Bestguess versusworstcase Deepwater disaster: … oil spill estimates got itwrong ... what went...
6
Deepwater disaster: how the oil spill estimates got it wrong "There is no crude emanating from that riser:' Then the official estimate was 1000 barrels a day, then 5000. The true figure was 58 000 barrels of oil a day leaking into the Gulf of Mexico. Why did the authorities so consistently underestimate the flow from the Deepwater disaster, and what damage did those underestimates do? Ian MacDonald reveals the smoking gun behind BP's erroneous statistics. On April 20th, 2010, the explosion and sinking of a semi-submersible drilling rig called Deepwater Horizon killed 11 people and initiated a furious eruption of oil and gas from BP's Macando well, which was located in 1500 m of water 75 km southeast of Grand Island, Louisiana. The discharge was virtually unabated for 84 days until a steel cap was installed and successfully closed, staunching the flow completely, on 15th July. Emergency operations continued around the clock to drill a second, intercepting, shaft and install a final plug into the bottom of the blown-our well. When the people and equipment on Deepwater Horizons sister drilling rig Development Driller III threaded the needle and intercepted the Macondo borehole under sediment and rock 4000 m below the sea floor on 19th September, they brought the first act of an unprecedented environ- mental drama to an anticlimactic conclusion. Because of the lives lost and the widespread ecological and economic damage, we need to determine what went wrong in all stages of the accident and the emergency response. We shall focus here on repeated confusion about one singular, all-important, and very © 2010 The Royal Sfatistical Society Best guess versus worst case consequential variable in the ongoing emergency: the discharge rate of oil: that is, the number of barrels of oil per day gushing into the ocean far below the surface. Official reports on the release and discharge rates were issued by authorities of the Unified Command, which was an often uneasy alliance between BP and the US government represented by no less than four cabinet-level departments (of Commerce, Energy, Homeland Security, and the Interior). Unfortunately, it took these authorities a very long time to get the rate right (Table 1). The first sighting of a floating oil slick coming from the sunken rig was blamed on diesel fuel escaping from the rig [9]. Initially, the authorities apparently assumed that an emergency valve called a "blow-our preventer" had closed off the well at the seafloor. They stated flatly that no oil was discharging from the well. On April 25th, the estimate was 1000 barrels of oil per day (bopd). By August 2nd, weeks after the oil had stopped flowing, the estimate had risen to 58000 bopd. The trend of increasing estimated rates, and the increas- ing perception of possible grave consequences for the BP used bad esti mates of the size of the spill to reject their own much better ones december2010 significance 149
-
Upload
truongtuyen -
Category
Documents
-
view
216 -
download
1
Transcript of Bestguess versusworstcase Deepwater disaster: … oil spill estimates got itwrong ... what went...
Deepwater disaster:how the oil spill
estimates got it wrong"There is no crude emanating from that riser:' Then the official estimatewas 1000 barrels a day, then 5000. The true figure was 58 000 barrelsof oil a day leaking into the Gulf of Mexico. Why did the authoritiesso consistently underestimate the flow from the Deepwater disaster,and what damage did those underestimates do? Ian MacDonaldreveals the smoking gun behind BP's erroneous statistics.
On April 20th, 2010, the explosion and sinking of asemi-submersible drilling rig called Deepwater Horizonkilled 11 people and initiated a furious eruption of oiland gas from BP's Macando well, which was locatedin 1500 m of water 75 km southeast of Grand Island,Louisiana. The discharge was virtually unabated for84 days until a steel cap was installed and successfullyclosed, staunching the flow completely, on 15th July.Emergency operations continued around the clock todrill a second, intercepting, shaft and install a final pluginto the bottom of the blown-our well. When the peopleand equipment on Deepwater Horizons sister drillingrig Development Driller III threaded the needle andintercepted the Macondo borehole under sediment androck 4000 m below the sea floor on 19th September,they brought the first act of an unprecedented environ-mental drama to an anticlimactic conclusion.
Because of the lives lost and the widespreadecological and economic damage, we need to determinewhat went wrong in all stages of the accident and theemergency response. We shall focus here on repeatedconfusion about one singular, all-important, and very
© 2010 The Royal Sfatistical Society
Best guess versus worst case
consequential variable in the ongoing emergency: thedischarge rate of oil: that is, the number of barrels of oilper day gushing into the ocean far below the surface.
Official reports on the release and discharge rateswere issued by authorities of the Unified Command,which was an often uneasy alliance between BP andthe US government represented by no less than fourcabinet-level departments (of Commerce, Energy,Homeland Security, and the Interior). Unfortunately, ittook these authorities a very long time to get the rateright (Table 1).
The first sighting of a floating oil slick coming fromthe sunken rig was blamed on diesel fuel escaping fromthe rig [9]. Initially, the authorities apparently assumedthat an emergency valve called a "blow-our preventer"had closed off the well at the seafloor. They stated flatlythat no oil was discharging from the well.
On April 25th, the estimate was 1000 barrels of oilper day (bopd). By August 2nd, weeks after the oil hadstopped flowing, the estimate had risen to 58000 bopd.The trend of increasing estimated rates, and the increas-ing perception of possible grave consequences for the
BP used badesti mates of thesize of the spill toreject their ownmuch better ones
december2010 significance 149

Table 1. Estimates of oil discharge rate from BP well. These estimates were given in press statements fromspokespeople representing Unified Command: Coast Guard Rear Admiral Mary Landry, Coast Guard Admiral ThadAllen, and Dr Marcia McNutt speaking for the Flow Rate Technical Group. Estimated rates are median values inbarrels of oil per day (bopd). The estimated release is the total barrels that would have issued from the wellbetween April 22nd and July 15th, 2010, had the estimated rate been accurate. Release is defined as oil andgas that leaves the reservoir. Discharge is oil and gas that escapes into the environment. Discharge is lessthan release because BP were eventually able to capture a total of 800000 barrels of oil and a large amountof gas before it escaped. Exxon Valdez (EV) units quantify the BP discharge relative to the official dischargeof 250000 barrels (10.8 million gallons) from the 1989 disaster.
Date 2010 Authority Estimated rate Estimated Estimated EV units Ref(bopd) release discharge
Apr. 23 Landry 0 0 NA NA 1
Apr. 25 Landry 1000 84000 NA NA 2
Apr. 28 Landry 5000 420000 NA NA 3
May 1 Allen Accurate estimate NA NA NA 4
impossible
May 27 McNutt 16000 1344000 544000 2.1 5
June 10 McNutt 30000 2520000 1720000 6.7 6
June 15 McNutt 48000 4032000 3232000 12.6 7
Aug. 2 McNutt 58000 4872 000 4072 000 15.8 8
ecosystem and people of the region, are obviousfrom Table 1. The facts show that during thefirst five weeks or more of the emergency, the of-ficial rate of release grossly underestimated thetrue rate that would eventually be determined.Particularly troubling is the interval from April28th to May 27th - a complete month dur-ing which authorities were responding to anestimated release rate of 5000 bopd, which wasmore than an order of magnitude lower thanthe true rate as efforts went forward. Clearlythis estimate must have hampered effectiverelief. Where did this erroneous and far-too-low estimated rate come from, and why was itallowed to stand for so long?
Getting the rate wrong
Consider the circumstances that faced theresponders assessing the situation at theexploded well during the waning days ofApril. Exploration by the indispensable robotsubmersibles had discovered that oil was dis-charging from three locations amid the twistedtangle of pipes and other debris that collapsedto the sea floor when the rig sank. There weresmall but very powerful jets coming from per-forations on the main 20-inch riser pipe whereit made a sharp bend on the top of the 60 fthigh blow-out pre venter (see Figure l(b), page152); there was a huge billowing gusher froma broken section of the riser where it lay in acrater about 400 ft from the well; and therewas a smaller jet from the drill pipe at whathad been the upper end of the riser, now at restabout 900 ft from the well. To estimate thetotal discharge, responders had three options,
150 significance december2010
listed in roughly descending order of reliabil-ity: (1) use technical means - seabed sensorsand videos - to quantify the flow from thedischarging jets; (2) model from the geologicaland engineering data already known about thereservoir and well from the exploration drillingthat Deepwater Horizon had completed justbefore the accident; or (3) quantify the amountof oil arriving at the surface of the ocean, andback-calculate a discharge rate from that:',;
Eventually, the authorities would cometo rely on methods (1) and (2), analysingvideo footage from cameras on remotely oper-ated submersible vehicles with a quantitativevisual technique called particle imaging veloci-merry" 10 and augmenting reservoir data withan extensive sensor array. Their stance in lateApril and early May was quite different. TheUnified Command initially chose to ignorewhat they might have learned from analysingthe jetting oil plumes. Thad Allen, IncidentCommander, proclaimed on May Lst that "anyexact estimation of what's flowing out of thosepipes down there is probably impossible at thistime due to the depth of the water and ourability to try and assess that from remotely op-erated vehicles and video'". Other experts werecapable of and would eventually succeed inproducing accurate estimates of the dischargerate based on even low-quality video of theoil jets!', but until 13th May BP categoricallyrefused to release publicly any of the copiousvideo footage it recorded at the sea floor.
The authorities took the public positionthat accurate assessment of the discharge rarewas unneeded, because they were already re-sponding with maximum effort and effect and
because such efforts might actually interferewith other response activity. Privately, BPand the arional Oceanic and AtmosphericAdministration (NOAA) were conductingdischarge assessments using well models andremote sensing. Remarkably, my review of therecords suggests that the authorities wouldcome to constrain the results of reservoir andwell modelling using for their constraint er-roneous results from the least reliable method- remote sensing evaluation of surface oil. Tounderstand how they went wrong, we need alittle background on oil pollution at sea.
Oil on water
Oil famously does not mix with water. Alight, low-sulphur crude oil like that from theMacondo well will rapidly spread into thin lay-ers on the surface of the ocean. Evaporation andother processes will consume about one-thirdof the floating oil over the course of a few days,but initially the appearance of the oil is wellcorrelated to its thickness. There is a long his-tory of study on this topic, and the North Seastates, including Britain, are signatories to theBonn Agreement. Under this authority, oil spillresponders are supposed to describe oil float-ing on the ocean by a standard nomenclatureand classify its thickness". The United Statesis not a signatory to the Bonn Agreement, butthe NOAA conforms to Bonn standards inits useful field guide for judging the amountof oil released by pollution events!". Thethinnest possible oil layers are called "sheen";
An oil layer, thinner than ahair, over thousands of squarekm makes a huge volume
they are no more than a few molecules thick.Thinner than the wavelength of visible light,they are detectable only because they dampensmall ripples and give the water an enhancedreflective appearance. Somewhat thicker oillayers, called "rainbow'; become visible whenthey refract light over a few multiples of thevisible range: these layers are about 0.5 to 5J-lmthick. Heavier oil begins to show "metallic';"discontinuous" and "(rue" colours in layers of10 to more man 100 J-lm. For comparison, ahuman hair bas a diameter of about 100 J-lm,so ucoloured" oil is SM a very thin layer, butwhen sprea over hundreds or thousands ofsquare . omerres the volume becomes large.
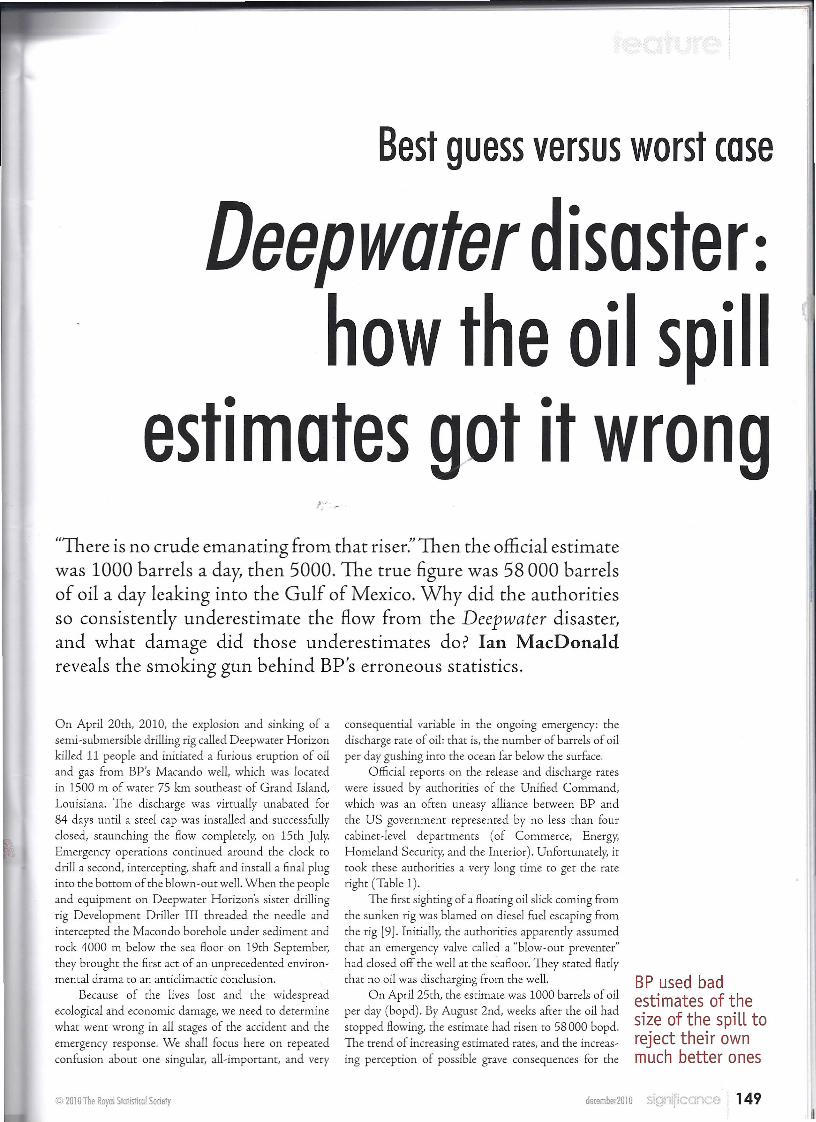
The Deepwater Horizon oiL spill as seen by NASA's Terra sateLLite, May 24th, 2010. Courtesy NASA/JPL-CaLtech
Here I should note that my public profilein the BP oil discharge story stems from back-of-an-envelope estimates I made in late Aprilalong with my colleague John Amos. Althoughno one in the public yet had access to the videoof oil jetting from the pipes, we could accessa variety of satellite images of the surface oil.From previous work on remote sensing ofnatural oil seeps in the Gulf of Mexico, I hadin my memory a trivial formula:
1 J-lmx Lkm? = 1m3
This allowed me easily to convert the area ofthe spreading oil into volume and piqued myconcern when I saw the area increasing rapidlyin successive images. By combining the satelliteimages with the Coast Guard's description ofthe oil appearance, and consulting the NOAAfield guide for appropriate thicknesses, I esti-mated that the minimum rate of discharge hadto be 26500 bopd. Because I did not accountfor evaporation or other losses, the actual rate
might well be significantly greater. I said this ina blog on April 27th14• It would be a numberof nervous weeks for us before the official ratescaught up with me and John - nervous becauseI had publicly staked my reputation on a ratemuch greater than the official one and becauseBP would not release the video to confirm orrefute what we were saying. What I did notknow then was that BP had also looked atremote sensing data and had come up withan estimate (as we now know, a far too lowone) close to the 5000 bopd rate given by theauthorities. These estimates apparently con-tributed to an officially sanctioned foundationon which public announcements were based.
Behind the scenes
Technicians working for BP made a series ofestimates of discharge rates beginning on April27th, looking at data similar to that whichJohn Amos and I had reviewed but coming up
(
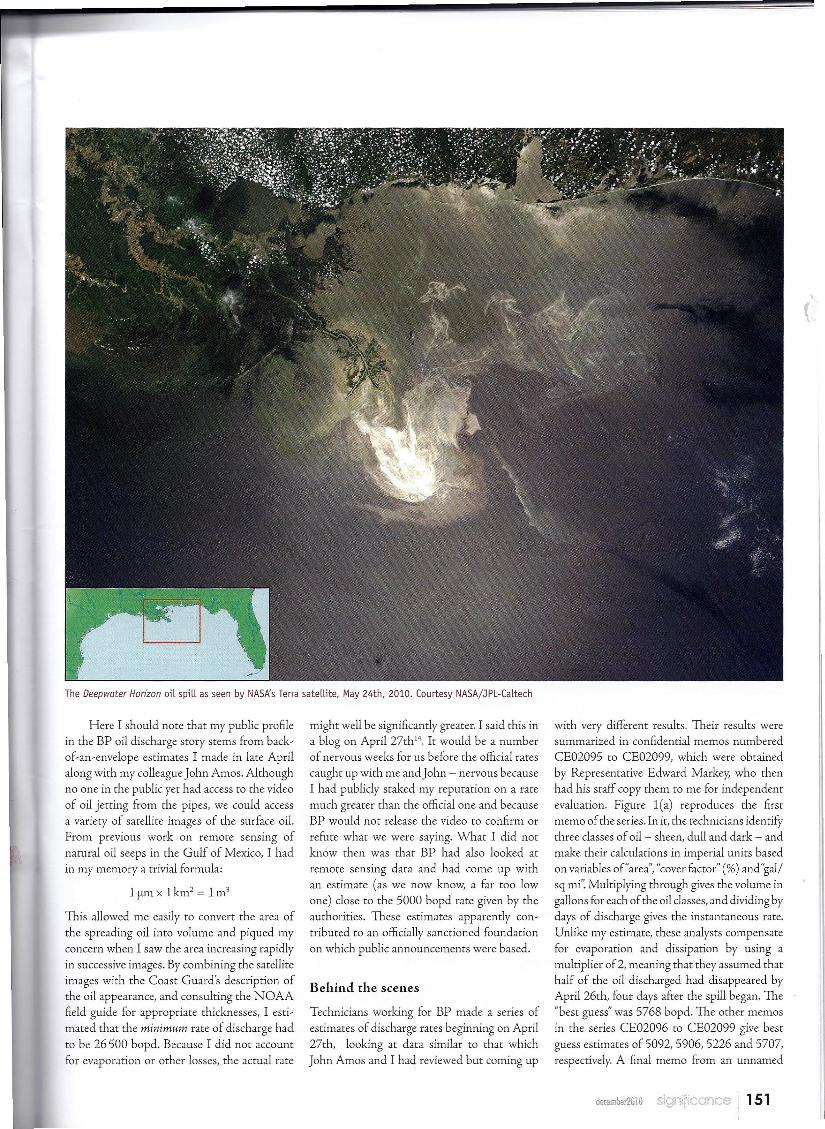
with very different results. Their results weresummarized in confidential memos numberedCE02095 to CE02099, which were obtainedby Representative Edward Markey, who thenhad his staff copy them to me for independentevaluation. Figure l(a) reproduces the firstmemo of the series. In it, the technicians identifythree classes of oil- sheen, dull and dark - andmake their calculations in imperial units basedon variables of "area", "cover factor" (%) andgal/sq mi". Multiplying through gives the volume ingallons for each of the oil classes, and dividing bydays of discharge gives the instantaneous rate.Unlike my estimate, these analysts compensatefor evaporation and dissipation by using amultiplier of2, meaning that they assumed thathalf of the oil discharged had disappeared byApril 26th, four days after the spill began. The"best guess" was 5768 bopd. The other memosin the series CE02096 to CE02099 give bestguess estimates of 5092, 5906, 5226 and 5707,respectively. A final memo from an unnamed
december2010 significance 151
NOAA technician also estimates 5000 bopd,assuming that most of the oil is sheen with athickness of 0.1 J-lm.Why was this estimate solow, given that the technicians were looking atthe same data as John and myself?
The worksheets claim that the authorityfor this procedure was taken from an ASTMstandard= and not from the NOAA guidelinesthat I have described previously. Careful reviewof this standard finds that a key parameter usedby the BP technicians, "gal! sq mi', does not ap-pear in it. The ASTM standard notes that thethickness of floating oil layers (in micrometres)can be judged from the colour and appearanceof oil on water. The standards caution: "theonly physical change in appearance that is reli-able is the onset of rainbow colours, at 0.5 to 3J-lmthickness".
If the "gal! sq mi" parameter is recalculatedin the accepted units of micrometres (Table 2)it is evident that the parameters for oil classthickness do not in fact match the ASTMstandards, which in any event do not providereliable guidance for layers thicker than 3 J-lm.Nor do they match the NOAA field manual.
The guidelines that were actually used bythe BP technicians were at least partially takenfrom BP's official Regional Oil Spill ResponsePlan - Gulf of Mexico": This document hasalready been criticised because it includesprotection plans for sea otters and walruses -neither of which exist in the Gulf of Mexico.Possibly more serious however is the table inSection 1D of the Plan, which is entitled "Oilthickness estimations': This set of standardsuses the same gallons per square mile multi-plier as is found in the BP worksheets, but thetable in the plan also gives equivalent thick-nesses in micro metres. Comparison of the BPtable with the NOAA and Bonn standards(Table 3) shows that the BP technicians wereusing oil thicknesses that were as much as 100times smaller than what is prescribed by theBonn Agreement and NOAA guidelines. Sothe "best guess" was obtained using guidelinesthat were biased toward results much lowerthan would have been obtained by using ac-cepted standards. Tellingly, if the dischargerates based on oil on water are recalculatedbut taking layer thickness estimates from theNOAA field guide and revising downward therate at which oil evaporates and dissipates, thelow, best guess, and high estimates increase bya factor of 5 or more (Table 2.)
The second method used by the BP teamto estimate discharge relied on what they knewabout the reservoir, the flow capacity of thepipes used, and evaluation of the condition ofthe reservoir and well components (Figure 1b).
152 ,<;lgn:ficance derember20l0
BP and NOAA Emlssion Rate Estimates From Rep. Markey'"soSUWU
~0..
'"ou on Wati'r Estimate· Low Oil on Water Estimate - HighOil on Wale" Estirna1e- east Guess
sq." "'- p..... ••• ••••F"''''•..... ,50< Cl5 50 moo 893
""'''' 251 n, ••• S33IlO ,.,"""'''' 0.15 ~ •••• .s 107
""nJ "'"" -. ••• "",,,""
"'- ,~ eee 333 _, ,...WI •• "" 0 1332: ml5 2715
De!\:oil • 025 ..,. """ 351
..mI eo",~m ,.- ....""'"
~ 1500 n", ••• ".... ,,.,.""'''' '50 Cl5 ~""
.,.,., •."""'oil , 0.35 t932C <I ••• •••
TobIfoUonwaw ,.... ".. TotalolJonwatar 481205 '0081 Totll oM on water ,.... ..,..t 2 10 eompersa14 ffjf ewIP IVio1 disp 35lI' ca klcompensat&toteYat),nddlsp "962 J; 2 10 compensate lor evap and dIsp .57498
reeoveJed 200 ,- '50 """""" 7llO
CIUUTlany dispeBoo 1000 c:hetnicallydi$p$fsed 3500 chemicalydisplrsed""'"
TotaIem!tted ".. ToU!I.mlttfld 2"'" Tolalemltt«i ,..,.Barrel$ omttted P8! day 1063 Satrels emitted per day 5168 Sanel, emitted par day 14266
(a)8@UwU
~0..In
Seafloor Exit7" x 9-7/8" Casing Annulus FlOW Path
Worst case theoretical flow assumes:
• Split 5-1/2" drill pipe at subsea BOP and flow out6-5/8" drill pipe
• Maximum theoretical flow rate is 60,000 BOPO
Items that reduce worst case theoretical flow:
• Crushed and bent riser and drill pipe
• Cement sheath in open hole by casing annulus
• Casing hanger and pack-off restriction
• Sand production (unconsolidated formation)
• Shale collapse
• Water production
• BOP functions activated
."
• Expected range of possible flow rates is 5,000 to40,00080PO
NOTE: Removal of all restrictions (riser, BOP, anddrill pipe) adds -10,000 BOPO to rates above
(b)Figure 1. Facsimile copies of discharge rate estimates calculated by BP technicians between about April 27thand May 1st, 2010. (a) Estimates of discharge rate calculated from oil on water measurements. (b) Range ofdischarge rates taken from reservoir properties and assessment of the well damage.
Table 2. Discharge rate estimates taken from oil on water (Figure l(a)), converting "galjsq mi" tomicrometres. BP's low, best guess and high rate estimates (bopd) were calculated from these thickness valuesmultiplied by a factor of 2 to allow for removal by dissipation and evaporation of oil over four days. Thedischarge rates are recalculated using thickness estimates taken from the NOAAfield manual" and assumingdifferent dissipation factors (2, 1.7, 1.4). Revision yields higher rate estimates in all categories.
Rate esti mate
(barrels oil per day)
Oi l class thickness Low Best guess High
(sq km) urn (cover %)
Sheen (3900) 0.07 (50) 0.49 (66) 0.97 (75)Dull oil (650) 0.97 (20) 1.95 (35) 4.87 (50)Dark oil (23) 4.87 (15) 9.73 (25) 19.5 (35)
1063 5758 14266
Rainbow (3900) 0.30 (50) 1.65 (66) 5.00 (75)
Dull oil (650) 5.00 (20) 26.- (35) 50.0 (50)Dark oil (23) 50.0 (15) • - (2-) 200 (35)
4194 64866
BP's rate
Revised rate
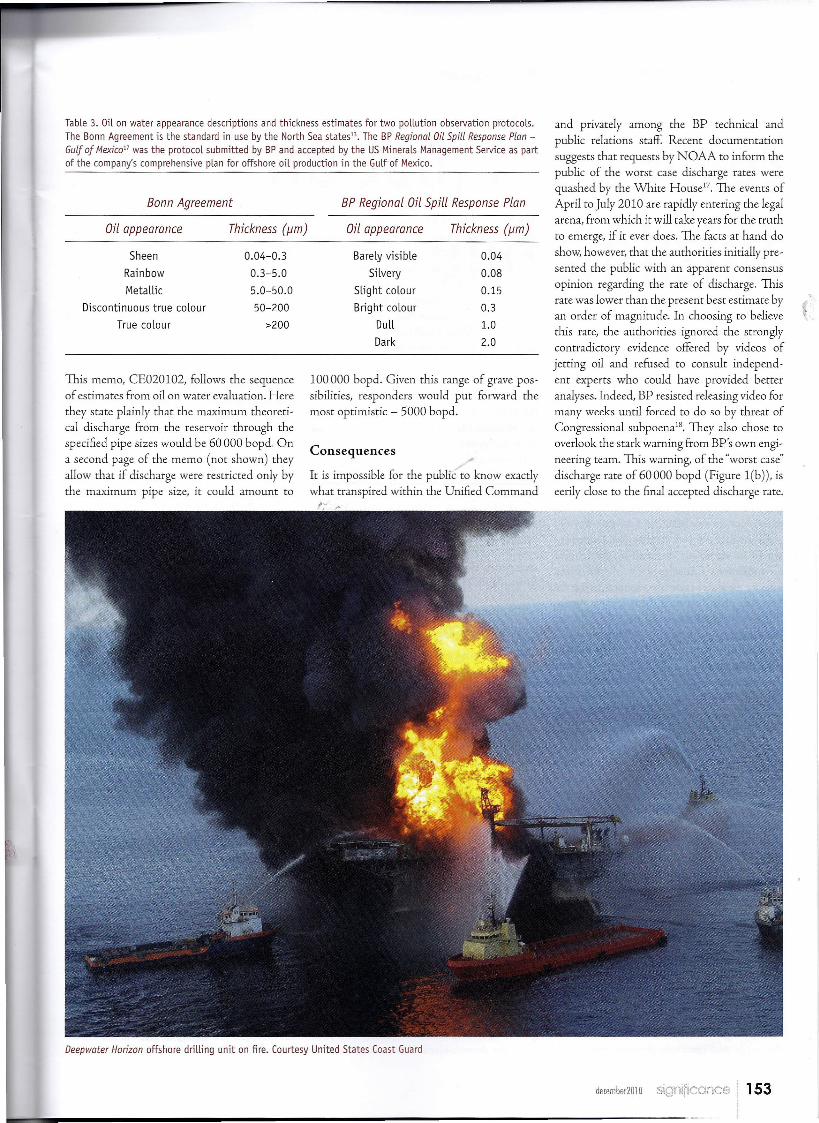
Table 3. Oil on water appearance descriptions and thickness estimates for two pollution observation protocols.The Bonn Agreement is the standard in use by the North Sea states". The BP Regional Oil Spill Response Plan -Gulf of Mexico17 was the protocol submitted by BP and accepted by the US Minerals Management Service as partof the company's comprehensive plan for offshore oil production in the Gulf of Mexico.
Bonn Agreement
Oil appearance Thickness (J.1m)
BP Regional Oil Spill Response Plan
Oil appearance Thickness (J.1m)
SheenRainbowMetallic
Discontinuous true colourTrue colour
0.04-0.30.3-5.05.0-50.050-200
>200
Barely visibleSilvery
Slight colourBright colour
DullDark
0.040.080.150.31.0
2.0
This memo, CE020102, follows the sequenceof estimates from oil on water evaluation. Herethey state plainly that the maximum theoreti-cal discharge from the reservoir through thespecified pipe sizes would be 60000 bopd. Ona second page of the memo (not shown) theyallow that if discharge were restricted only bythe maximum pipe size, it could amount to
100000 bopd. Given this range of grave pos-sibilities, responders would put forward themost optimistic - 5000 bopd.
Consequences
It is impossible for the public to know exactlywhat transpired within the Unified CommandI'; -
and privately among the BP technical andpublic relations staff. Recent documentationsuggests that requests by NOAA to inform thepublic of the worst case discharge rates werequashed by the White House'". The events ofApril to July 2010 are rapidly entering the legalarena, from which it will take years for the truthto emerge, if it ever does. The facts at hand doshow, however, that the authorities initially pre-sented the public with an apparent consensusopinion regarding the rate of discharge. Thisrate was lower than the present best estimate byan order of magnitude. In choosing to believethis rate, the authorities ignored the stronglycontradictory evidence offered by videos ofjetting oil and refused to consult independ-ent experts who could have provided betteranalyses. Indeed, BP resisted releasing video formany weeks until forced to do so by threat ofCongressional subpoena". They also chose tooverlook the stark warning from BP's own engi-neering team. This warning, of the "worst case"discharge rate of 60000 bopd (Figure l(b)), iseerily close to the final accepted discharge rate.
Deepwater Horizon offshore drilling unit on fire. Courtesy United States Coast Guard
december2010 significance 153

Instead, they relied on remote sensing analysisbased on non-standard evaluations regardingoil on water - highly questionable evaluations,in my view. Even here, with use of more realisticoil thickness and evaporation rate estimates, theremote sensing data should have warned theteam that they were guessing much too low.
One issue going forward is this: whatauthority are responders actually requiredto use in evaluating marine oil pollution inUS waters? Because the USA is not part of atreaty like the Bonn Agreement it appears that,for the moment, setting the legal standard forquantifying thickness of oil on the ocean fallsbetween a patchwork of government agencies.Many oil companies operating in the Gulf ofMexico have subcontracted the job of formu-lating oil spill response plans to consultingcompanies. The BP Regional Oil Spill ResponsePlan is virtually identical to plans on file from anumber of other companies - walruses and all.It would be good to supersede the oil on waterstandards in these plans at the very least.
The real question is this: did the low-ball estimates during the first month of theemergency do any harm? In my view they did- although I am certain that this judgementwould be vigorously disputed by the UnifiedCommanders. Consider each of the manyinterim measures taken in response during thefirst half of the event. In Maya containmentdome was placed above the riser. It could nothandle the rate of flow and within less than anhour became clogged with gas hydrate ice. Theriser tube insertion tool produced the darklycomical result of capturing almost 5000 bopdat a time when BP was insisting on 5000 bopdas a top rate, while the video (which was bythen on-line full time) showed an apparentlyundiminished gusher of oil. The "top kill" at-tempt to plug the well with drilling mud didnot succeed because of the enormous pressureof the oil and gas discharge. The "top hac"installed in July was too small. And finally,when by dogged endeavour the responderssucceeded in hooking up recovery lines so theycould capture oil before it discharged into theocean, it turned out that the maximum recoverycapacity of the ships on station - at this pointabout two months after the accident - was onlya quarter of the actual release rate: 15 000 asopposed to 58 000 bopd. The lower figure canbe found in the oil on water estimates labelled"high" - yet it was clearly far too low. In myopinion, the consequence of low estimates wasa longer duration of the oil discharge.
It was only when the Flow Rate TechnicalGroup began to have credible numbers fordischarge and reservoir pressure and trends
154 <:'gnificance december2010
over time that the responders gained theconfidence to unbolt the broken flange andbolt a new, closable cap in place to shut off thedischarge. This solution was actually proposedin the very early days of the emergency", burwas not adopted because the responders fearedit would make the situation worse; they didnot believe that they were already experiencingtheir worst case scenario.
Far from harming the response effort, ac-curate rate estimates proved crucial to the finalsolution. This is undoubtedly why the BP Re-gional Oil Spill Response Plan - Gulf of Mexicostates that: "When a spill has been verified andlocated, the priority issue will be to estimateand report the volume and measurements ofthe spill as soon as possible:' Determining thepump or spill rate by direct measurements isthe preferred method. The Coast Guard andthe Minerals Management Service have similarblow-our guidelines. If only they had followedtheir own advice.
References1. Johnson, A. (2010) No crude oil leaking
from Gulf well: us Coast Guard. AFp, April 22nd.http://bit.ly/dAiVV6
2. Robertson, C. (2010) Oil leakingunderwater from well in rig blast. New YorkTimes, April 24th. http://www . nytimes.com/2010/04/25/us/25rig.html
3. Robertson, C. and Kaufman, L_(Zq.10)Size of spill in Gulf of Mexico is larger thanthought. New York Times, April 28th. http: / /www.nytimes.com/2010/04/29/us/29spill.html
4. MarineLog (2010) Press Briefing by CoastGuard Commandant Thad Allen, and Assistant tothe President for Homeland Security John Brennan onongoing response to oil spill. Deepwater Horizon Re-sponse, May 1st. http://www .marinelog.com/DOCS/NEWSMMIX/2010mayOOOIO.html
5. US. Dept. Interior (2010) Flow RateGroup provides preliminary best estimate of oilflowing from BP oil well. Deepwater HorizonResponse, May 27th. http://www.doi.gov/news/pressreleases/Flow-Rate-Group-Provides-Preliminary-Best-Estimate-Of-Oil-Flowing-from-BP-Oil-Well. cfm
6. US. Dept. Interior (2010) Admiral Allen;Dr. McNutt provide updates on progress of scientificteams analyzing flow rates from BP's well. Deepwa-ter Horizon Response, June LGrh. http: / /www.doi.gov/news/pressreleases/Admiral-Allen-Dr-McNutt-Provide-Updates-on-Progress-of-Scientific-Teams-Analyzing-Flow-Rates-from-BPs-Well.cfm
7. US. Dept. Interior (2010) U.S. scien-tific team draws on new data, multiple scientific
methodologies to reach updated estimate of oi!_-from BP's well. Deepwater Horizon R _June 15th. http://www.doi. gov /:::e _pressreleases/Flow-Rate-Te~-Updates-Estimate-of-Oil-Flo~:-_-from-BP-Well.cfm.
8. US. Dept. Interior (2010) U.S.tific teams refine estimates of oil flow from BFsprior to capping. Deepwater Horizon RAugust 2nd. http://www.doLgov/c,,,_pres s releases /US-Scien tific-Te=-Refine-Estimates-of-Oil-Flow-=~--BP-Well-Prior-to-Capping.cfm
9. CNN Wire, Coast Guard: oilthat exploded has sunk. CNN 2010. _-_22, 2010 (http://news .blogs.--com/2010/04/22/coast-guard-c~_-rig-that-exploded-has-sunk).
10. Crone, T. J. and Tolstoy, M. (2010) _nitude of the 2010 Gulf of Mexico oil leak.doi:10.1126/ science.1l95840.
11.Harris, R. (2010) Gulf spill =rexceed official estimates. National PublicMorning Edition, May 14th. http://--npr.org/templates/story/stc~_php?storyId=126809525
12. Bonn Agreement (2007) Bonn A"Aerial Surveillance Handbook. http://~=- -ly/a8wJeq
13.NOAA Hazmat (2007) Open widentification job aid for aerial observation. Offi2Response and Restoration. http://bit.:_dtIHIc
l4. MacDonald, 1.R. and Amos, J. F.C _Gulf oil spill rate must be much higher than sta~-million gallons so far' Skytruth Blog, April =--http://blog.skytruth.org/2010 :-gulf-oil-spill-rate-must-be- _higher.html
15. ASTM International (2006) Sguide for visually estimating oil spill thicknesswater. In ASTM Committee F20 on Hazardousstances and Oil Spill Response. West ConshohPA: ASTM International.
16. BP (2009) Regional Oil Spill rPlan - Gulf of Mexico. GoM EMS Mgmt Ik::sentarive. UPS-US-GOM-HSE-DOC-OOl~-_http://publicintelligence.:::=~bp-gulf-of-mexico-regional-c~_-spill-response-plan/
17. ational Commission, The amountfate of the oil. National Commission on !he -Deepwater Oil Spill and Offshore Drilling, -October 6, 2010.
18.Markey staff,personal communicarioc,19.Suttles, D. (2010) Oral testirnorrc -
Deepwater Horizon Oil Spill and 0Drilling, Meeting 3, Day 1. http://---oilspillcommission.gov/
Ian R. MacDonaLd is a Professor of Oceanoqrazz,Florida State University. He speciaLises in usi _aging and geographic information system tech -to investigate the ecoLogy of deep-sea hydr -seeps, primarily in the GuLf of Mexico.