
Best Practices in Project Benefit Validation -...
35
Run smoothly. Change quickly. Achieve more. Cloud-based enterprise work management software Where are my savings? Best Practices in Project Benefit Validation Julie Brignac Executive Advisor and Independent Consultant
-
Upload
hoangthien -
Category
Documents
-
view
216 -
download
0
Transcript of Best Practices in Project Benefit Validation -...

Run smoothly. Change quickly. Achieve more.Cloud-based enterprise work management software
Where are my savings?Best Practices in Project Benefit Validation
Julie BrignacExecutive Advisor and
Independent Consultant

2
Discussion points
• What is a project benefit validation process?
• Discuss what works in companies regarding a project benefit infrastructure for all types of projects
• Share information as a best practice in this arena
• Peak interest in an otherwise boring (but necessary) subject
2Copyright ©2015 by Julie Brignac. All rights reserved.
3
Bio
• Former executive with 20+ years experience in Procurement, Supply Chain, Quality and Lean Six Sigma with Fortune 100 companies such aso DuPonto Honeywello Newell Rubbermaid
• Former Chief Procurement and Quality Officer for Australian-based Brambles Limited
• Procurement and Lean Six Sigma functional deployment leader
• Moved into consulting seven years ago – trademarked The RoSSModel®
3Copyright ©2015 by Julie Brignac. All rights reserved.

4
The dilemma
• Have you ever had the CFO say to you or a project leader:
“I don’t see the savings that you say your project delivered.”
4Copyright ©2015 by Julie Brignac. All rights reserved.

5
What is a project benefit validation process?
5
A multi-faceted application designed to ensure direct linkage between financial reporting and project results
Project Governance
Benefits Assignment
Financial Integration
Reconciliationand Reporting
Copyright ©2015 by Julie Brignac. All rights reserved.

6
The RoSS Model® Process
6
Project Benefit Guidelines
Define the Opportunity
Define the Benefits
Report and Locate the Benefits
Benefit RecognitionFinancial Statement ReconciliationIntangible Benefit Analysis
Predictive Benefit Modeling
Strategic or Tactical Focus
Copyright ©2015 by Julie Brignac. All rights reserved.

7
What the RoSS Model® methodology does
• Uses Throughput Accounting methodology to scope and prioritize projects and their benefits
• Quickly implements a robust project benefit reporting structure that can reconcile tangible (hard) savings to company financial statements
• Saves companies the time and effort of o Writing financial guidelineso Determining benefit
definitions and categorieso Building cost modeling
templates at various stages of the project governance process
• Implements a measurement system that measures previously immeasurablebenefits
7Copyright ©2015 by Julie Brignac. All rights reserved.
8
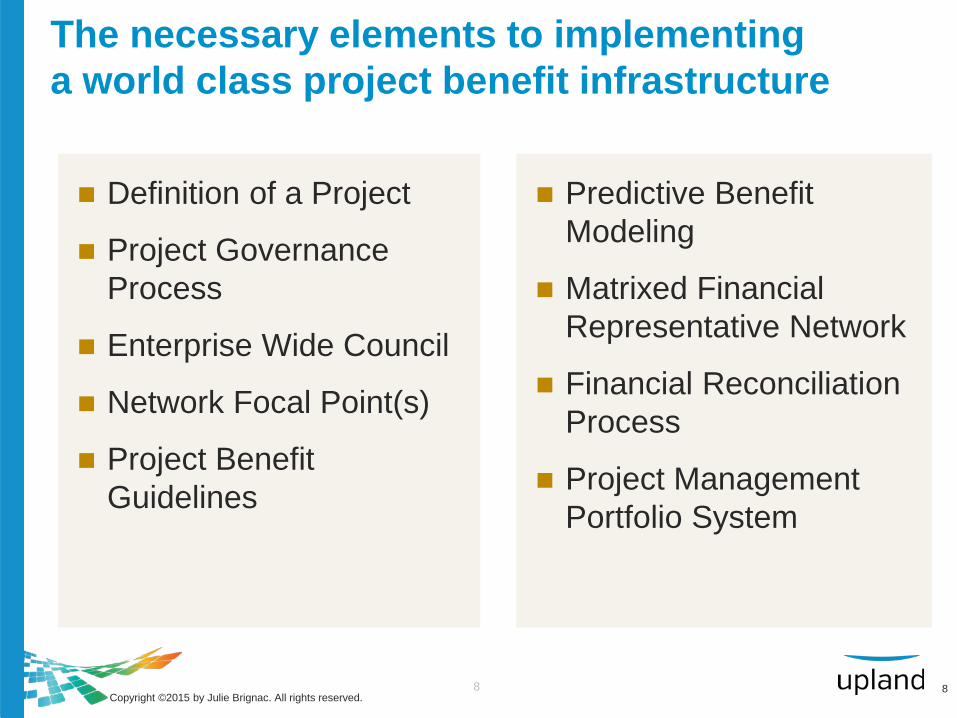
The necessary elements to implementing a world class project benefit infrastructure
Definition of a Project
Project Governance Process
Enterprise Wide Council
Network Focal Point(s)
Project Benefit Guidelines
Predictive Benefit Modeling
Matrixed Financial Representative Network
Financial Reconciliation Process
Project Management Portfolio System
8Copyright ©2015 by Julie Brignac. All rights reserved.

9
Project definition
• If you have 30,000 employees in your company, you have 30,000 different definitions of what a project is
• Important to clarify becauseo Determine whether an effort needs to travel through the
governance process• Hence requiring benefit validation
o Also helps determine which projects go into your central project repository
9Copyright ©2015 by Julie Brignac. All rights reserved.

1 0
Project governance processThe RoSS Model®
10
ProjectEvent Charter
BenefitAssessment
EventApproval
EventComplete
Trackand
ReportBenefits
Idea Generation and Triage
EventPrioritization
Post Project Benefit
Reconciliation
Event/Project work
(controls and tollgates)
Copyright ©2015 by Julie Brignac. All rights reserved.
1 1
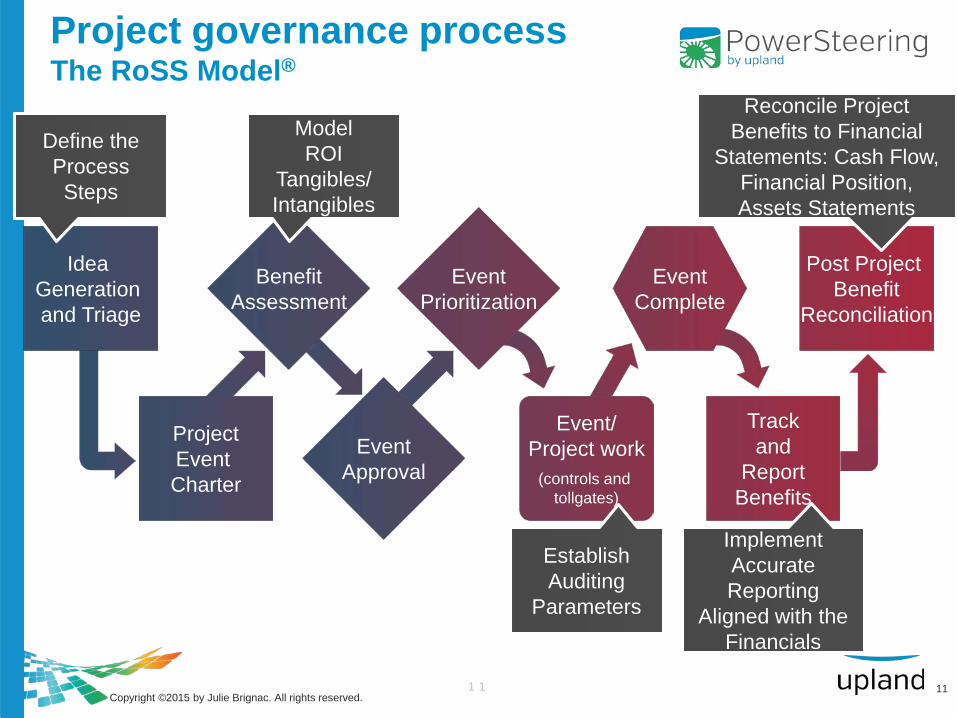
Project governance processThe RoSS Model®
11
ProjectEvent Charter
BenefitAssessment
EventApproval
EventComplete
Trackand
ReportBenefits
Idea Generation and Triage
EventPrioritization
Post Project Benefit
Reconciliation
Event/Project work
(controls and tollgates)
ModelROI
Tangibles/Intangibles
ModelROI
Tangibles/Intangibles
EstablishAuditing
Parameters
Implement Accurate Reporting
Aligned with the Financials
Reconcile Project Benefits to Financial
Statements: Cash Flow, Financial Position, Assets Statements
Define the Process Steps
Copyright ©2015 by Julie Brignac. All rights reserved.

1 2
Enterprise-wide council
• Governing body of stakeholders who are accountable for accurate benefit reporting
• Typically consists of finance, project and functional leadership
• Primary role is to approve the overall definitions and categories for project benefits
• Different responsibilities than the Project Benefit Networko May have some of the same members but they play a related,
but different role
12Copyright ©2015 by Julie Brignac. All rights reserved.

1 3
Network focal point
• Even with a strategic enterprise-wide council and a project benefit network, designating a focal point for the network will help too Keep the momentum moving for continuously improving the
process and corresponding documentso Hold the business accountableo Exercise authority when a disagreement must be resolved
13Copyright ©2015 by Julie Brignac. All rights reserved.

1 4
Project benefit guidelines
• The intent of this document is to give project leaders and financial representatives in your businesso Guidelines to understand project benefit categorieso A process for assessing benefits in a projecto The method of calculating project benefitso Model and examples to reference so that consistency in
prediction, reporting and reconciliation is maintained
14Copyright ©2015 by Julie Brignac. All rights reserved.

1 5
Project governance processThe RoSS Model® including guidelines
15
ProjectEvent Charter
BenefitAssessment
EventApproval
EventComplete
Trackand
ReportBenefits
Idea Generation and Triage
EventPrioritization
Post Project Benefit
Reconciliation
Event/Project work
(controls and tollgates)
DevelopProject Benefit
Guidelines
Copyright ©2015 by Julie Brignac. All rights reserved.

1 6
Suggested contents
• Guideline document purpose statement• Sample financial definitions for project benefits• Sample general rules for benefit calculation• The project benefit governance process• Specific benefit categories and calculations• Examples• Tools & templates
o Reference guideso Financial reconciliation o Sample reconciliation model
• Financial network representativeso Roles and responsibilities
16Copyright ©2015 by Julie Brignac. All rights reserved.

1 7
Illustrative sample benefit categoriesTangible definitions
Tangible Benefits — benefits that impact the financials, improve productivity, or change cash flow. All have a baseline, are measurable, and can be reconciled to the financials
• Revenue Growth — Projects that improve operating margin due to incremental revenue from volume or price increases, or revenue recovery
• Asset Productivity — Projects that improve the utilization of current assts (i.e., process or productivity enhanced so that capital expenditures for new assets are avoided)
• Cost Savings / Reductions — Projects that result in year-over-year savings or cost reduction
• Capital Expense Reduction or Working Capital — Projects that improve working capital (inventory, receivables, payables)
17Copyright ©2015 by Julie Brignac. All rights reserved.
1 8
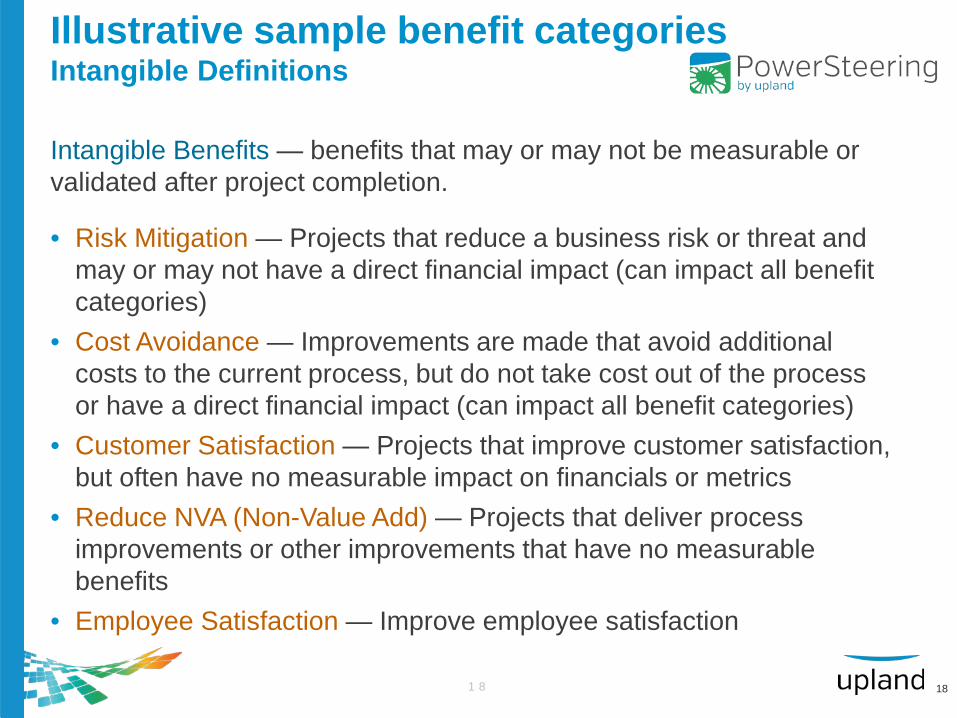
Illustrative sample benefit categoriesIntangible Definitions
Intangible Benefits — benefits that may or may not be measurable or validated after project completion.
• Risk Mitigation — Projects that reduce a business risk or threat and may or may not have a direct financial impact (can impact all benefit categories)
• Cost Avoidance — Improvements are made that avoid additional costs to the current process, but do not take cost out of the process or have a direct financial impact (can impact all benefit categories)
• Customer Satisfaction — Projects that improve customer satisfaction, but often have no measurable impact on financials or metrics
• Reduce NVA (Non-Value Add) — Projects that deliver process improvements or other improvements that have no measurable benefits
• Employee Satisfaction — Improve employee satisfaction
18

1 9
Illustrative sample general rules
Headcount and Labor Calculations• Savings for headcount reductions may be included if:
o A specific project is identified for process improvements to cover the reduction (headcount must be physically eliminated)
o The reduction in headcount savings has not been included in restructuring benefits. If headcount reductions have been included in restructuring benefits, then headcount reductions for the projects musts be categorized as cost avoidance to avoid double counting benefits
• No retroactively counting savings for headcount reductions in previous periods
• Labor savings should include the fringe rate ($ paid by employer for each employee – payroll taxes, medical, etc.)
• Labor-related cost savings can be counted if you can clearly link a reduction in census or reduction in overtime pay to the project
19Copyright ©2015 by Julie Brignac. All rights reserved.

2 0
Category Benefit 1
(example: data flow)
Speed of Information
Flow
Cost Avoidance
Proactive Risk Management
Impact Customer
Satisfaction
Speed of Information Flow
Yes Yes
Does your project focus on any of the following?
Does your project focus on any of the following?
Does your project focus on any of the following?
Category Benefit 3
(example: satisfaction)
Category Benefit 2(example: risk)
No, then No, thenNo, then
Data Accuracy Control Risk
Yes
YesCustomer Satisfaction
Employee Satisfaction
Yes
Focus?
No, then
Reporting Adjustments
No, then
No, then
Intangible Savings
Employee Retention
Does your project focus on any of the following?
Does your project focus on any of the following?
Productivity
No, then
No, then
Yes Effectiveness/Reduce Defects
Yes Efficiency/Reduce
Cycle Time
Yes Unit Cost of Service
Reduced
No, thenYes
Productivity Gain with
Same Cost
Yes
Cost Management
No, then
Reduce Direct
Support Costs
No, then
Reduce Direct Costs
(labor and material)
Yes
No, then
Throughput
No, then
No, then
Asset Utilization
Yes
Cost per Transaction
Cost Savings
Working Capital
Cash Flow
Reduce Carrying
Costs
Tangible Savings
Actual Costs Removed
Yes
Yes
Financial Validation Decision Tree — Example
YesYes
Yes
Yes
20

2 1
Illustrative predictive model inputsDepartment Headcounts and Annual Salaries
Department name
Full dept. headcount(from Finance Operating Exp.
Summary)Working days per year
(Standard per Finance)Hours per day
(Standard per Finance)
Benefits(from Operating Expense
Summary
Operations 133 242 6.5 $ 8,518,970Sales 223 242 6.5 $ 43,984,522Logistics 443 242 6.5 $ 32,944,386Procurement 554 242 6.5 $ 47,464,902Administrative services 123 242 6.5 $ 1,529,870Information services 443 242 6.5 $ 5,419,966
Annual Salaries and
Benefits
Departmental Headcount
Process Step Times
ProcessTouch time in minutes (Single
piece) Time in hours
Process Step 1 2.00 0.03Process Step 2 3.60 0.06Process Step 3 4.80 0.08Process Step 4 0.00 0.00Process Step 5 0.00 0.00Process Step 6 5.00 0.08
Process Step Times
Input VolumesVolume number Volumes
Call volume 133,233Transaction volume 12,543Volume 3Volume 4Volume 5Volume 6
Volumes
Expense line items Operations Sales Logistics ProcurementAdministrativ
e servicesInformation
services Quality Finance
Rent and occupancy charges
$ 91,611 $ 5,397,047
$ 4,857,414
$ 3,000,597 $ 1,897,456 $ 860,968 $ 335,289 $ 189,275
Equipment — $ 20,506 $ 17,283 $ 100,480 $ 509,055 $ 149,258 $ 1,339 $ 1,637Software — — $ 0 — — $ 866,440 — $ 45Amortization $ 1,647 $ 16,974 $ 14,528 $ 272,194 $ 866,440 $ 1,184,101 $ 2,999 $ 2,266Printing and supplies $ 13,767 $ 107,000 $ 438,772 $ 48,471 $ 1,184,101 $ 14,994 $ 490 $ 10,306Postage $ 460 $ 206,215 $ 332,370 $ 22,422 $ 14,994 $ 5,696 $ 5,344 $ 34,128Marketing — $ 55,659 $ 287,174 — $ 5,696 — — —Total expenses 322,627 14,194,16 14,382,500 14,966,007 2,596,509 13,810,834 1,173,638 708,103
Operating Expenses

2 2
Illustrative predictive model
Summary Input SheetCurrent
state Future state
Cost drivers
Change in:
Cost drivers
Transaction volume
Transaction volume
Call volume Call volume
Operating expenses
Operating expenses
Current efficiency
level
Current efficiency
level
Quality Quality
Process Step 1Current
state Future state
Total process
cost
Totalprocess
cost
Total unit cost
Total unit cost
Transaction volume
Transaction volume
Call volume Call volume
Headcount Headcount
Quality rate Quality rate
Process time
Process time
Process Step 2Current state Future state
Total process cost
Totalprocess cost
Total unit cost
Total unit cost
Transaction volume
Transaction volume
Call volume Call volume
Headcount Headcount
Quality rate Quality rate
Process time
Process time
Process Step 3Current state Future state
Total process cost
Totalprocess cost
Total unit cost
Total unit cost
Transaction volume
Transaction volume
Call volume Call volume
Headcount Headcount
Quality rate Quality rate
Process time
Process time
Summary Output SheetCurrent state
UnitCosts
Head-count Volumes Process
timeQuality
rate
By process
Availtime
Callvolume
By process
step% quality
By dept. % utilized
Trans. vol. Unit cost
HC applied
to process
Total process time
Future state
UnitCosts
Head-count
Volumes Process time
Quality rate
By process
Availtime
Callvolume
By process
step% quality
By dept. % utilized
Trans. vol. Unit cost
HC applied
to process
Total process time
Process Step 4Current state Future state
Total process cost
Totalprocess cost
Total unit cost
Total unit cost
Transaction volume
Transaction volume
Call volume Call volume
Headcount Headcount
Quality rate Quality rate
Process time
Process time
Process Step 5Current state Future state
Total process cost
Totalprocess cost
Total unit cost
Total unit cost
Transaction volume
Transaction volume
Call volume Call volume
Headcount Headcount
Quality rate Quality rate
Process time
Process time
Copyright ©2015 by Julie Brignac. All rights reserved.

2 3
Project benefit network
• To provide project resources specific contacts who are responsible for validating their project benefits per the guidelines
• Roles and Responsibilitieso Project Governance Process should dictate a project benefit
assessment at:• Charter stage Build initial benefits model• Periodic auditing throughout project to clarify benefits• Final signoff by Finance of validated benefits
– Reconciliation to P&L, if applicable
23Copyright ©2015 by Julie Brignac. All rights reserved.

2 4
Reporting and reconciliation
• Develop and/or modify reporting in tangible/intangible terms, reflecting project categories defined in the Guidelines
• Ability to reconcile tangible benefits to the financial statementso P&L, Income Statement, Balance Sheet
• Create customized analysis reporting for intangible benefits
24Copyright ©2015 by Julie Brignac. All rights reserved.
2 5
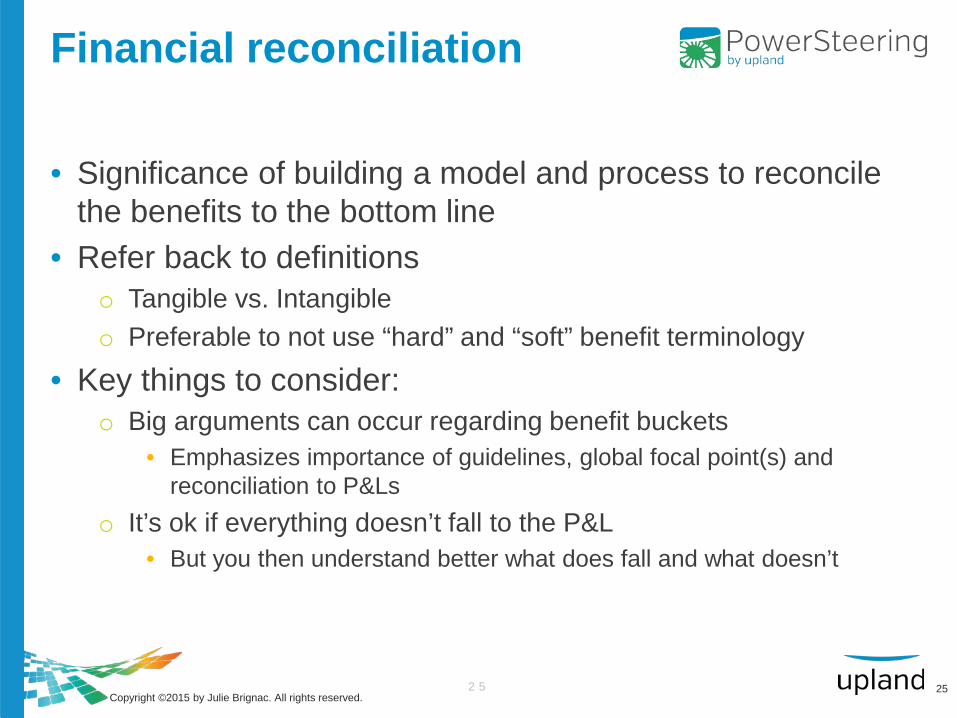
Financial reconciliation
• Significance of building a model and process to reconcile the benefits to the bottom line
• Refer back to definitionso Tangible vs. Intangibleo Preferable to not use “hard” and “soft” benefit terminology
• Key things to consider:o Big arguments can occur regarding benefit buckets
• Emphasizes importance of guidelines, global focal point(s) and reconciliation to P&Ls
o It’s ok if everything doesn’t fall to the P&L• But you then understand better what does fall and what doesn’t
25Copyright ©2015 by Julie Brignac. All rights reserved.

2 6
Financial statement analysis
26Copyright ©2015 by Julie Brignac. All rights reserved.

2 7
Electronic project repositoryProject management portfolio database
• Requirementso Web-based access for all business unitso Lifecycle management for all projectso Estimating model, particularly for capital intensive projectso Robust reporting including project dashboard, including benefit
analysiso 12-month forecasting of project benefits for active and pending
projects• MUST have governance process in place prior to system
o A system will not drive your processo The system must MIRROR your process and meet your
requirementso Don’t think of the system as an antidote for any lack of process(es)
27Copyright ©2015 by Julie Brignac. All rights reserved.

2 8
Project summary and predictive benefit modeling
28Copyright ©2015 by Julie Brignac & Upland Software. All rights reserved.

2 9
Financial capture
29
Implement auditing parameters during project work to fine-tune the savings
Copyright ©2015 by Julie Brignac & Upland Software. All rights reserved.

3 0
Validation lock
30Copyright ©2015 by Julie Brignac & Upland Software. All rights reserved.
3 1
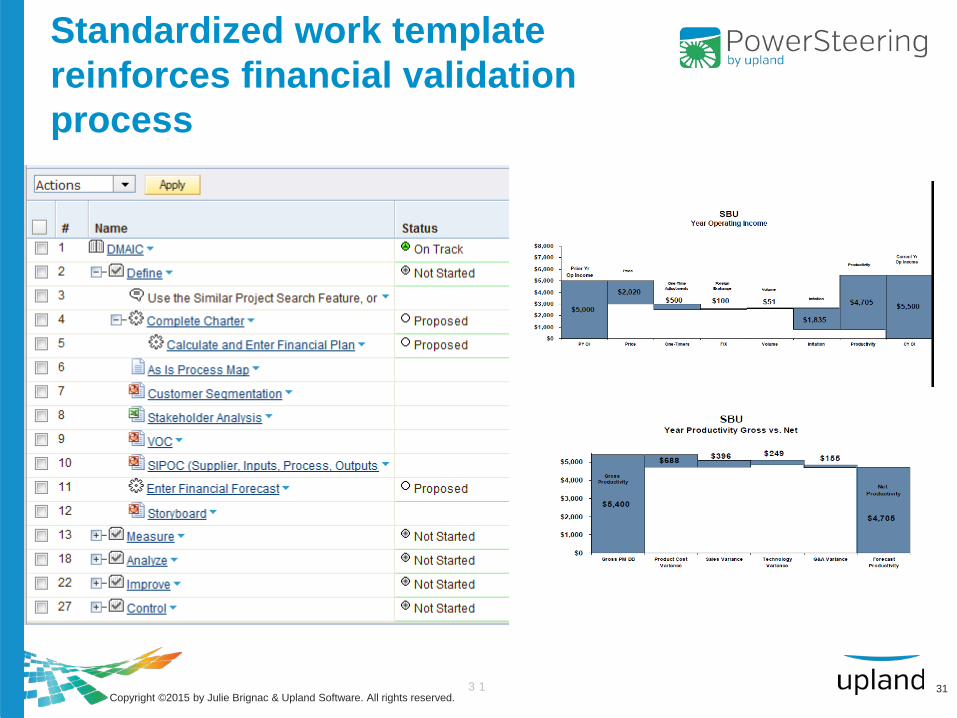
Standardized work template reinforces financial validation process
31Copyright ©2015 by Julie Brignac & Upland Software. All rights reserved.
3 2
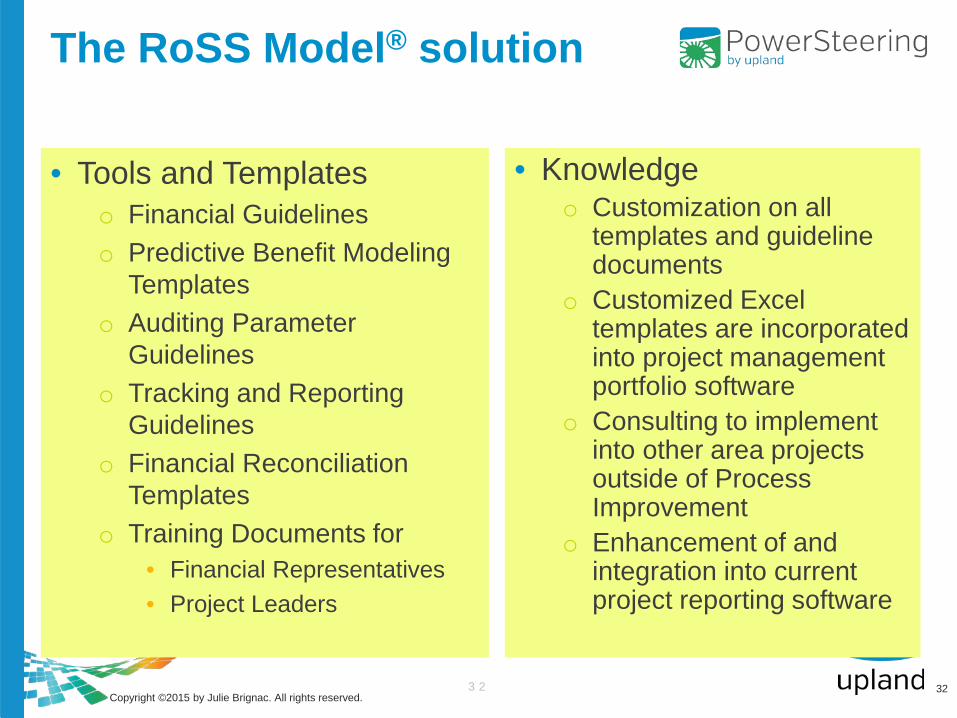
The RoSS Model® solution
• Tools and Templateso Financial Guidelineso Predictive Benefit Modeling
Templateso Auditing Parameter
Guidelineso Tracking and Reporting
Guidelineso Financial Reconciliation
Templateso Training Documents for
• Financial Representatives• Project Leaders
32
• Knowledgeo Customization on all
templates and guideline documents
o Customized Excel templates are incorporated into project management portfolio software
o Consulting to implement into other area projects outside of Process Improvement
o Enhancement of and integration into current project reporting software
Copyright ©2015 by Julie Brignac. All rights reserved.

3 3
Summarizing points
• Define your organization that will be benefit assessed• Have a central governing council and focal point for project benefits• Important to have project benefit guidelines and a network corporate
wide so everyone talks the same language and reports the same way• Let the process govern the system, not vice versa• Quick implementation of significantly improved project benefit
financial rigor• Consistent calculations and definitions for all project benefits• Applicable to all project work• Fully integrated model that develops robust project benefit reporting
33Copyright ©2015 by Julie Brignac. All rights reserved.

SYSTEM DEMONSTRATION

3 5
Questions
Thank you very much for your attention
Julie [email protected]
520.235.6730
35Copyright ©2015 by Julie Brignac. All rights reserved.