
Best Practices in Network Deployment, Positioning … - SP.pdfBest Practices in Network Deployment,...
14
SAMPLE PAGES: LTE Business Models Best Practices in Network Deployment, Positioning and Service Pricing July 2014 Report price: $3,495.00 Jan ten Sythoff, Analyst at Large Ozgur Aytar, Research Director
Transcript of Best Practices in Network Deployment, Positioning … - SP.pdfBest Practices in Network Deployment,...

SAMPLE PAGES:
LTE Business Models Best Practices in Network Deployment,
Positioning and Service Pricing
July 2014
Report price: $3,495.00
Jan ten Sythoff, Analyst at Large
Ozgur Aytar, Research Director
Built around five detailed country case studies of markets where LTE networks have been launched, ‘LTE Business Models: Best Practices in Network Deployment, Positioning and Service Pricing,’ a new Report by Pyramid Research, examines LTE spectrum allocation and availability, network deployment considerations, product and pricing strategies and LTE adoption trends as well as drivers for market growth. Highlighting what works and what doesn’t — based on the experience of commercial operators — this report uncovers the pain points and the keys to success for LTE service providers worldwide.
2
Summary
Key findings of the report include:
• The availability of spectrum underpins the timing and scale of LTE deployments and operators’ competitive positioning long-term. The importance of access to appropriate LTE spectrum has resulted in high bids for auctioned spectrum, acquisitions of companies with relevant spectrum and loss of 2G market share for the sake of spectrum refarming.
• Adoption of LTE differs depending on the market. As competitive operators reach nationwide coverage, adoption accelerates. To retain their high-value customer bases and keep a network edge, market leaders have to launch LTE first; challengers must minimize this edge and consider disruptive pricing strategies.
• Device strategies are important in order to drive upgrades: Ensuring the availability of a range of devices including popular, exclusive as well as low-cost devices that meet operator configuration requirements such as frequencies and backward compatibility with 2G and 3G networks is fundamental.
• LTE device adoption can be maximized by offering low-cost devices, providing financing and annual handset upgrade options, limiting the availability of non-LTE devices if appropriate (particularly among tablets) and offering smartphones that target less technology-savvy customers. Shared-data plans also help drive adoption, and more operators are targeting LTE car connectivity.
• Pricing LTE at a premium has clearly been the right strategy in markets where demand has been strong, thus boosting margins. However, premium pricing comes with downsides and risks, which have been exposed in different markets.
• Driving wide adoption of data-intensive services is crucial to a successful LTE strategy. Relevant services must not only take advantage of LTE’s better speeds and performance but also encourage greater data usage to boost ARPS.
• LTE drives data usage, typically increasing consumption by 80-120% compared with 3G.
• LTE can provide an attractive alternative to fixed broadband; just how attractive depends on the market.
• VoLTE will reinvigorate voice services and counter OTT providers, and operator approaches and plans to providing high-quality VoLTE services vary.
3
Key findings
The ‘LTE Business Models’ report comprises business model analysis, market sizing and demand analysis and trend analysis for networks based on the LTE technology, which had been deployed across nearly 300 networks worldwide by May 2014. Insights and data were captured through a mix of desk-based secondary research, primary research as well as quantitative modeling for sizing market opportunity.
Primary research involved in-depth interviews with service providers that have commercial or planned LTE networks and vendors. The secondary research effort included obtaining relevant data and intelligence through publicly available sources, regulatory authority publications, trade associations, specialist databases and company financial reports, presentations and press releases. The market sizing and demand analysis was derived from Pyramid Research’s Mobile Data Forecast product, the most comprehensive demand, growth and market share tracking service available in the industry. These forecasts are developed using a bottom-up methodology that combines secondary and primary research with international benchmarking and quantitative modeling in order to present a complete picture of the socio-demographic, competitive and demand trends affecting the adoption of LTE-based mobile services at the country, regional and global levels.
4
Report methodology
• The ‘LTE Business Models’ report provides a comprehensive examination of lessons learned and best practices from commercial LTE networks in different market environments to help executives develop business plans and product development plans effectively as well as optimize resource allocation and return on investment.
• This report provides a five-year forecast of LTE subscriptions, developed using Pyramid Research’s rigorous bottom-up modeling methodologies, to enable executives to effectively position their companies for emerging trends in demand for their products and growth opportunities.
• The report incorporates an easily digestible, executive-level assessment of LTE business models worldwide built around insights directly from the market players, which enables decision makers to quickly get up to speed with the current and emerging trends and make informed investment decisions.
5
Reasons to buy
6
Table of contents
Table of contents 2
Table of exhibits 3
Executive summary 6
Introduction Report scope and outline 10 Approach and methodology 11
Section 1: LTE background and status 4G/LTE technology primer 13 LTE deployment status 16 LTE market adoption trends and forecast 17 Voice over LTE: Technology readiness and operator approaches 18
Section 2: Analysis LTE spectrum trends and strategies to improve spectrum availability 20 Network deployment strategies and best practices 22 Drivers for LTE adoption and growth 23 LTE devices and key considerations for service providers 25 LTE-based services and the role of digital content 27 Trends in data traffic over LTE 28 Positioning LTE as a fixed broadband alternative 29 VoLTE timelines and opportunities for service providers 30 LTE pricing approaches and best practices 31 LTE ARPS trends and growth strategies 34
Market leaders: Go-to-market strategies and best practices 35 Market challengers: Go-to-market strategies and best practices 39
Section 3: Analysis of leading and emerging LTE markets Comparative review of the case study countries 42 Key takeaways from country case studies 43 Country case studies
Japan: NTT fails to capitalize on its time-to-market advantage 45 South Africa: LTE as a fixed-broadband replacement and channel for video content 55 South Korea: First to market with LTE-Advanced and VoLTE deployments 62 UK: Challenger MNOs disrupt the market leader’s pricing premium 72 USA: Largest LTE market in the world, where shared data plans have found success 80
Appendixes Companies mentioned 90 Sources and related research 91 About Pyramid Research 92
Report overview 11 HSPA, LTE and WiMAX comparison 13 Wireless standards evolution 14 LTE technology evolution 15 Number of commercial LTE networks, 2009-2014 16 LTE commercial networks by frequency band, May 2014 16 LTE percentage of mobile subscriptions globally 17 LTE penetration by region, year-end 2013 17 Examples of spectrum-driven acquisitions 20 LTE deployment strategies by country, operator position 22 Quarterly LTE adoption since launch in four markets 23 Low-cost operator-branded LTE devices 26 Comparison of service strategies by country 27 Additional data usage on 4G networks vs 3G networks at five operators 28 Android smartphone 3G and 4G data consumption globally, Jan 2013 and Dec 2013 28 LTE impact on fixed broadband 29 LTE pricing comparison and highlights by country 31 4G ARPS compared with 3G ARPS at six operators 34 Blended ARPS in Japan and South Korea, Q2 2012 to Q1 2014 34 SK Telecom quarterly LTE vs WCDMA data usage, 2011-2013 35 SK Telecom’s 3G and LTE price plans compared 35 Market share and ARPS performance of five market leaders 37 Market share and ARPS performance of eight challengers 39 Overview of mobile markets in five countries 42 Key country indicators in Japan, 2013 (year end) 45 Japan market highlights 45 Key LTE spectrum in Japan by operator 46 Population coverage of LTE FDD by operator in Japan, Q1 2011 to Q1 2014 46
NTT network evolution 47 Service subscriptions of KDDI and NTT, Q4 2013 and Q1 2014 48 Net FTTH additions of NTT, 2011-2013 49 Smartphone sales as percentage of handset sales in Japan, 2012 and 2013 50 KDDI smartphone plans 51 LTE and smartphone penetration in four countries, Q1 2014 52 Mobile, smartphone and LTE subscriptions in Japan, Q1 2011 to Q1 2014 52 3G and 4G data consumption in Japan, Jan 2013 and Dec 2013 53 Blended ARPS by operator in Japan, Q1 2011 to Q1 2014 53 Change in subscription market shares in Japan, Q1 2011 to Q1 2014 54 Key country indicators in South Africa, 2013 (year end) 55 South Africa market highlights 55 Number of Vodacom base stations in Gauteng by technology, 2014 and 2015 56 MTN South Africa coverage by network generation, year-end 2012 and 2013 56 MTN coverage by network generation in select African countries, year-end 2013 57 Telkom South Africa fixed broadband packages 58 Prices of 5Mbps broadband at Neotel and Telkom in South Africa 58 Mobile, smartphone and LTE subscriptions in South Africa, Q1 2013 to Q1 2014 59 Mobile subscription breakdown by network generation and use, Q1 2014 60 Data devices on Vodacom network, Q1 2012 to Q1 2014 60 Change in market shares in South Africa, Q1 2013 to Q1 2014 61
7
Table of exhibits
Key country indicators in South Korea, 2013 (year end) 62 South Korea market highlights 62 KT Telecom LTE lag behind SK Telecom and LGU+ 63 LTE spectrum by operator in South Korea 63 LTE operator services in South Korea 64 Fixed broadband net additions in South Korea, 2010-2013 65 LGU+ fixed broadband subscriptions: 100Mbps vs total, 2011-2013 65 LTE subscriptions using VoLTE in South Korea, Q2 2012 to Q4 2013 66 Evolution of LTE plans in South Korea 67 Comparison of operator data plans in South Korea 68 Mobile, smartphone and LTE subscriptions in South Korea, 2010-2014 69 SK Telecom subscription breakdown by technology, Q1 2014 69 SK Telecom data usage on LTE and WCDMA, Q4 2011 to Q4 2013 70 Blended vs LTE ARPS in South Korea, Q2 2013 and Q1 2014 70 Blended ARPS by operator in South Korea, Q4 2011 to Q4 2013 71 Changes in subscription market shares, South Korea, 2010 to 2013 71 Key country indicators in the UK, 2013 (year end) 72 UK market highlights 72 LTE coverage by operator in the UK, 2012-2015 73 Key LTE spectrum holdings of UK operators 73 LTE content and service details by operator in the UK 74 Data usage on 4G plans in excess of average 3G usage, Vodafone, Q1 2014 75 Evolution of LTE plans in the UK 76
Mobile, smartphone and LTE subscriptions in the UK, 2010-2014 77 Additional LTE ARPS over 3G ARPS at three operators in the UK, Q1 2014 78 LTE subscriptions by operator in the UK 79 Change in retail postpaid ARPS of UK operators, Q1 2013 to Q1 2014 79 Key country indicators in the United States, 2013 (year end) 80 US market highlights 80 LTE coverage by operator in the US, Q1 2012 to Q1 2014 81 Free personal cloud storage bundles of AT&T and Verizon 82 Verizon broadband prices compared 83 US HD voice and VoLTE timeline 84 Portion of postpaid subscriptions on shared-data plans, Verizon and AT&T, Q1 2012 to Q1 2014 85 Verizon retail postpaid subscription breakdown by device, Q1 2014 86 Mobile, smartphone and LTE subscriptions in the US, 2010-2014 86 Postpaid ARPS by operator in the US, Q1 2011 to Q1 2014 87 Verizon average revenue per account, Q1 2012 to Q1 2014 87 Change in retail postpaid subscription market shares among top four US operators, Q1 2012 to Q1 2014 88
8
Table of exhibits (continued)
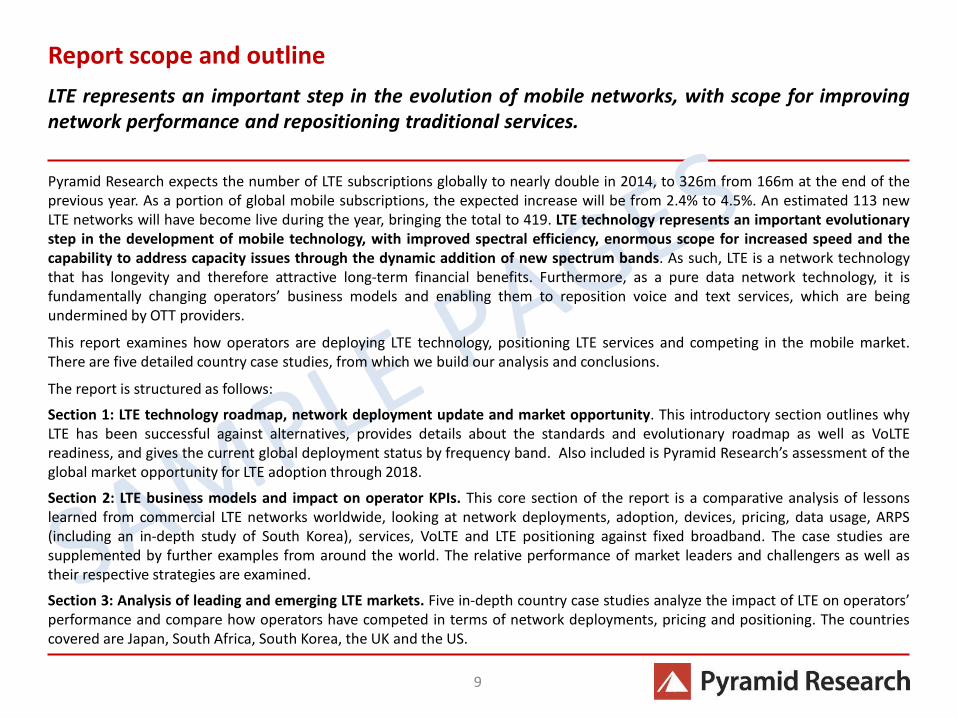
Report scope and outline
9
Pyramid Research expects the number of LTE subscriptions globally to nearly double in 2014, to 326m from 166m at the end of the previous year. As a portion of global mobile subscriptions, the expected increase will be from 2.4% to 4.5%. An estimated 113 new LTE networks will have become live during the year, bringing the total to 419. LTE technology represents an important evolutionary step in the development of mobile technology, with improved spectral efficiency, enormous scope for increased speed and the capability to address capacity issues through the dynamic addition of new spectrum bands. As such, LTE is a network technology that has longevity and therefore attractive long-term financial benefits. Furthermore, as a pure data network technology, it is fundamentally changing operators’ business models and enabling them to reposition voice and text services, which are being undermined by OTT providers.
This report examines how operators are deploying LTE technology, positioning LTE services and competing in the mobile market. There are five detailed country case studies, from which we build our analysis and conclusions.
The report is structured as follows:
Section 1: LTE technology roadmap, network deployment update and market opportunity. This introductory section outlines why LTE has been successful against alternatives, provides details about the standards and evolutionary roadmap as well as VoLTE readiness, and gives the current global deployment status by frequency band. Also included is Pyramid Research’s assessment of the global market opportunity for LTE adoption through 2018.
Section 2: LTE business models and impact on operator KPIs. This core section of the report is a comparative analysis of lessons learned from commercial LTE networks worldwide, looking at network deployments, adoption, devices, pricing, data usage, ARPS (including an in-depth study of South Korea), services, VoLTE and LTE positioning against fixed broadband. The case studies are supplemented by further examples from around the world. The relative performance of market leaders and challengers as well as their respective strategies are examined.
Section 3: Analysis of leading and emerging LTE markets. Five in-depth country case studies analyze the impact of LTE on operators’ performance and compare how operators have competed in terms of network deployments, pricing and positioning. The countries covered are Japan, South Africa, South Korea, the UK and the US.
LTE represents an important step in the evolution of mobile networks, with scope for improving network performance and repositioning traditional services.
Approach and methodology
10
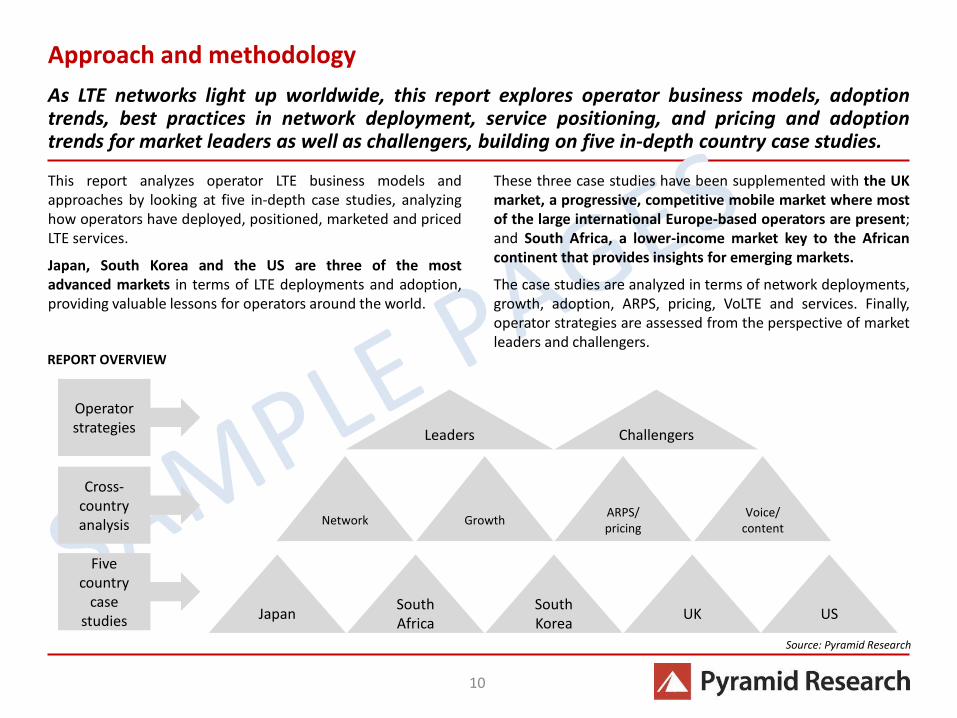
As LTE networks light up worldwide, this report explores operator business models, adoption trends, best practices in network deployment, service positioning, and pricing and adoption trends for market leaders as well as challengers, building on five in-depth country case studies.
Japan South Africa
South Korea
UK US
Network Growth ARPS/ pricing
Voice/ content
Five country
case studies
Leaders Challengers
Cross-country analysis
Operator strategies
These three case studies have been supplemented with the UK market, a progressive, competitive mobile market where most of the large international Europe-based operators are present; and South Africa, a lower-income market key to the African continent that provides insights for emerging markets.
The case studies are analyzed in terms of network deployments, growth, adoption, ARPS, pricing, VoLTE and services. Finally, operator strategies are assessed from the perspective of market leaders and challengers.
This report analyzes operator LTE business models and approaches by looking at five in-depth case studies, analyzing how operators have deployed, positioned, marketed and priced LTE services.
Japan, South Korea and the US are three of the most advanced markets in terms of LTE deployments and adoption, providing valuable lessons for operators around the world.
REPORT OVERVIEW
Source: Pyramid Research
Trends in data traffic over LTE
11
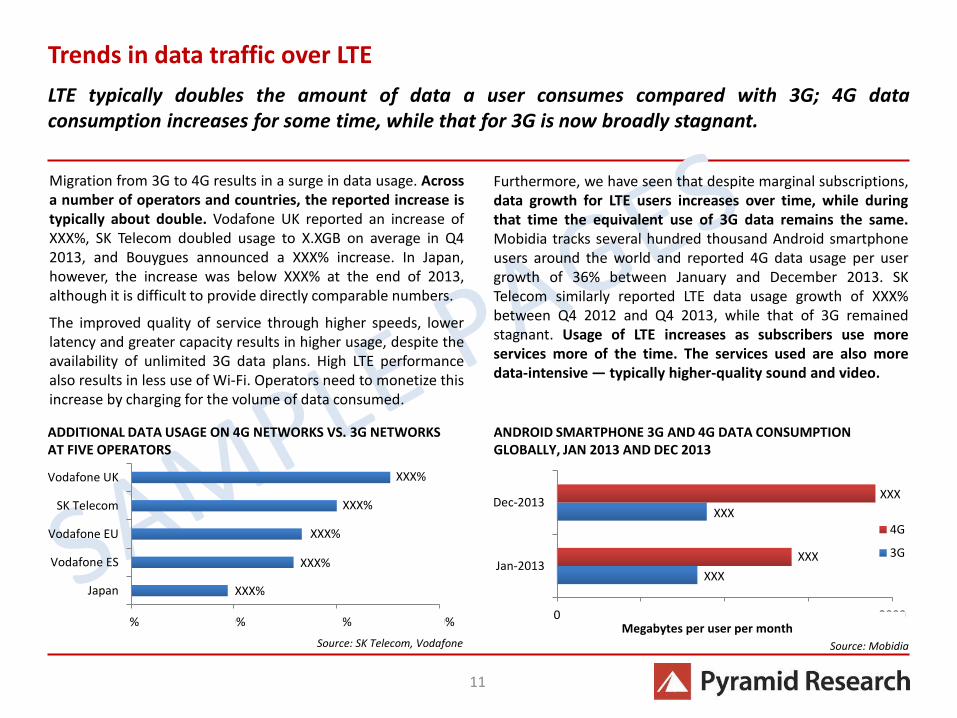
LTE typically doubles the amount of data a user consumes compared with 3G; 4G data consumption increases for some time, while that for 3G is now broadly stagnant.
Furthermore, we have seen that despite marginal subscriptions, data growth for LTE users increases over time, while during that time the equivalent use of 3G data remains the same. Mobidia tracks several hundred thousand Android smartphone users around the world and reported 4G data usage per user growth of 36% between January and December 2013. SK Telecom similarly reported LTE data usage growth of XXX% between Q4 2012 and Q4 2013, while that of 3G remained stagnant. Usage of LTE increases as subscribers use more services more of the time. The services used are also more data-intensive — typically higher-quality sound and video.
Migration from 3G to 4G results in a surge in data usage. Across a number of operators and countries, the reported increase is typically about double. Vodafone UK reported an increase of XXX%, SK Telecom doubled usage to X.XGB on average in Q4 2013, and Bouygues announced a XXX% increase. In Japan, however, the increase was below XXX% at the end of 2013, although it is difficult to provide directly comparable numbers.
The improved quality of service through higher speeds, lower latency and greater capacity results in higher usage, despite the availability of unlimited 3G data plans. High LTE performance also results in less use of Wi-Fi. Operators need to monetize this increase by charging for the volume of data consumed.
Source: SK Telecom, Vodafone
ADDITIONAL DATA USAGE ON 4G NETWORKS VS. 3G NETWORKS AT FIVE OPERATORS
47%
79%
83%
100%
126%
0% 50% 100% 150%
Japan
Vodafone ES
Vodafone EU
SK Telecom
Vodafone UK
838
894
1,400
1,900
0 500 1000 1500 2000
Jan-2013
Dec-2013
Megabytes per user per month
4G
3G
ANDROID SMARTPHONE 3G AND 4G DATA CONSUMPTION GLOBALLY, JAN 2013 AND DEC 2013
Source: Mobidia
XXX%
XXX%
XXX%
XXX%
XXX%
XXX
XXX
XXX
XXX

Apple
AT&T
CellC
EE
KDDI
KT Telecom
LGU+
MTN
NTT Docomo
O2
SK Telecom
Softbank
Sprint
Three UK
T-Mobile US
Verizon
Vodacom
Vodafone
12
Companies mentioned
Mobile Data Forecasts
Forecasts updated quarterly A premium version of the Mobile Demand Forecast, Mobile Data tracks current and future demand for mobile data services, within the context of overall mobile demand. This forecast includes all the same tracking as the standard Mobile Demand Forecast but breaks down mobile data ARPS, revenues and subscriptions at the service level.
Cellular M2M Connections: An Analysis of Growth Drivers, Market Segments and Operator Approaches A Thematic Report published January 2014 This report looks at the developments in the cellular M2M market, providing in-depth country, regional and application-level forecasts underpinned by an in-depth analysis of some of the key drivers and challenges that the market faces: This is of particular importance given the variance in forecasts available.
South Korea: LTE-A and 10Gbps Broadband to Drive Operator Investments A Country Intelligence Report published June 2014 This Country Intelligence Report offers a precise, incisive profile of South Korea’s mobile and fixed telecommunications and pay-TV markets based on comprehensive proprietary data and insights from our research in the South Korean market. Published annually, this presentation-quality, executive-level report provides detailed analysis of the near-term opportunities, competitive dynamics and evolution of demand by service type and technology/platform across the fixed telephony and broadband, mobile and pay-TV sectors, in addition to a review of key regulatory trends.
Mobile Broadband in Africa and the Middle East: LTE Profit Drivers and Outlook A Telecom Insider Report published May 2014 This report tackles the question of how LTE is positioned in Africa and the Middle East and what its growth drivers and consequences for mobile broadband are. It reviews the existing LTE deployments and assesses uptake vis-à-vis (and along with) 3G adoption and rollouts. It analyzes the current circumstances of and expectations for mobile broadband in AME by using three main pillars: revenue drivers (services, devices, pricing models), costs (regulations and deployment models) and structural dynamics (socioeconomic and competitive characteristics). Mobile Operator KPI Forecasts Forecasts updated quarterly These Forecasts measure key performance indicators for up to six operators per country, and breaks down key mobile demand metrics at the operator level. When combined with the standard Mobile Demand or enhanced Mobile Data Forecast, they provide the most comprehensive demand, growth and market share tracking available in the industry today. The Forecasts include the following key indicators by operator: subscription market shares and additions (net, gross); prepaid, postpaid and business subscriptions; ARPS (voice, data, aggregate); MOU (prepaid, postpaid, aggregate); annual churn; and total service revenue. At the country level, it is available for 74 markets worldwide.
CLIENT CONFIDENTIAL
© 2014 Pyramid Research. All rights reserved. No material contained in this report may be reproduced in whole or in part without the prior written permission of the publisher. Neither the information nor the opinions expressed in the report should be construed as a recommendation for the purchase or sale of any security. The information contained in this report has been obtained from sources we believe to be reliable, but neither its completeness nor accuracy can be guaranteed. Opinions expressed are based on our interpretation of the available information and are subject to change.
Sources and related research
13

© 2014 Pyramid Research
14
About Pyramid Research
To learn more about Pyramid Research’s product offerings and how they can be of service to your company, please
contact [email protected] or visit us on the Web at www.pyramidresearch.com.
Advising Leaders in the Global Communications Industries on Emerging Markets and Services Opportunities
Pyramid Research (www.pyramidresearch.com) offers practical solutions to the complex demands our clients face in
the global communications industry. Its analysis is uniquely positioned at the intersection of emerging markets,
emerging technologies and emerging business models, powered by the bottom-up methodology of our market Forecasts
for more than 100 countries — a distinction that has remained unmatched for more than 25 years.
How We Cover Communications Markets
Our highly structured analysis closely examines the performance, technology trends, macroeconomic environment and
regulatory conditions of service providers and equipment vendors in each of the more than 100 countries we cover.
Using a bottom-up approach, we size market demand across services and countries, and conduct end-user surveys to
validate adoption trends and anticipate shifts in demand. Our commitment to intensive, direct interviewing of
regulatory authorities, service providers and manufacturers — complemented with end-user data — ensures the most
reliable portrait of every market we examine.
Office locations: Latin America, North America
179 South St., Suite 200
Boston, MA 02111
USA
Tel: +1 617 747 4100
Fax: +1 617 747 4133
Email: [email protected]
EMEA, Asia Pacific
John Carpenter House
7 Carmelite Street
London, EC4Y 0BS
United Kingdom
Tel: +44 (0)20 7936 6530
Email: [email protected]