Best Practices Guide: Vyatta Firewall - Brocade...Best Practices Guide
Upload
truongxuyenCategory
view
213download
0
2009
Best Practices in
Education Grant Making

2
The Center on Philanthropy at Indiana University
Every culture depends on philanthropy and nonprofit organizations to provide essential elements of a
civil society. Effective philanthropy and nonprofit management are instrumental in creating and
maintaining public confidence in the philanthropic traditions – voluntary association, voluntary
giving, and voluntary action. The Center on Philanthropy at Indiana University increases the
understanding of philanthropy and improves its practice through programs in research, teaching,
public service, and public affairs. The Center on Philanthropy at Indiana University is a part of
the IU School of Liberal Arts at Indiana University-Purdue University Indianapolis. The Center
has academic and research programs on the IUPUI and the IU-Bloomington campuses.
Center on Philanthropy Project Team
Patrick M. Rooney, Ph.D., Executive Director and Principal Investigator
Una Osili, Ph.D., Interim Director of Research
Heidi K. Frederick, Assistant Director of Research and Project Manager
Deborah Hirt, Project Coordinator
Reema Bhakta, Research Development Specialist
Melanie Miller, Research Assistant
The Center on Philanthropy
Indiana University
550 W. North St., Suite 301
Indianapolis, IN 46202-3272
317-274-4200
www.philanthropy.iupui.edu

3
TABLE OF CONTENTS
Table of Contents .......................................................................................... 3
Executive Summary ........................................................................................ 4
Introduction ................................................................................................. 7
Methodology ................................................................................................ 10
A Need For Change ........................................................................................ 11
The Landscape of Higher Education .................................................................... 12
Preparation for Higher Education .................................................................... 12
Access to Higher Education ........................................................................... 13
Success in Higher Education ........................................................................... 14
Barriers to Higher Education .......................................................................... 14
Financial Barriers ....................................................................................... 15
Preparatory Barriers .................................................................................... 16
Information Barriers .................................................................................... 17
Philanthropic Purpose and Mission ...................................................................... 19
Stakeholders ............................................................................................... 21
Strategy ..................................................................................................... 28
Scholarships ............................................................................................. 35
Employee Giving and Volunteering ................................................................... 42
Policy/Government Relations ......................................................................... 44
Geography ............................................................................................... 46
Use of Intermediaries/Partnerships .................................................................. 47
Evaluation of Impact ...................................................................................... 51
Visibility .................................................................................................... 59
Grants Management ....................................................................................... 61
Conclusion / Issues to Consider ......................................................................... 66
Bibliography ................................................................................................ 70

4
EXECUTIVE SUMMARY
I. PURPOSE OF THE PROJECT
The purpose of this project is to identify and interpret best practices that will help inform
decisions about strategies, structures, and activities for education grantmakers in the field of
higher education.
II. METHODOLOGY
To derive best practices, the Center on Philanthropy at Indiana University (Center):
Summarized the literature on best practices in corporate and foundation philanthropy
along with key issues facing the field of higher education; and
Interviewed staff at six case study organizations to assess their experiences and practices.
III. KEY FINDINGS
PHILANTHROPIC PURPOSE
• Not Static: A general trend in foundations is to change strategy often based on new
research, changing techniques, or technologies. Example: Bill & Melinda Gates
Foundation’s practice is to (1) Develop a Strategy; (2) Make Grants; (3) Measure
Progress; and (4) Adjust Strategy.
• Core identity: Once understood, an organization’s core identity influences how the
philanthropic program is structured, implemented, managed, and measured.
STAKEHOLDERS
• Defining stakeholders: Identifying stakeholders and their relative importance determines
the balance of philanthropic choices to meet stakeholders’ tangible needs.
o State and federal aid programs are moving towards merit-based aid, which impacts
students from middle-income families.
o Funders focus their grant-making to meet the needs of lower-income, first-generation,
underserved learners. In highlighting their programs, audiences include policymakers,
legislators, and those that influence policy such as associations, media, and unions.
STRATEGY
• Setting a Goal: There is a general trend in grant making and other fields to create big
goals that provide focus to the overall work.
• Leveraging Resources: Collaborating with intermediaries, funding partners, as well as
government entities, allowing for greater impact, including the ability to influence
education nationally with limited resources.
• Content Knowledge Experts: Creating impact means developing strategic partnerships
with content-knowledge experts. For example, creating advisory councils of leading

5
scholars to shape strategic initiatives or using intermediaries with local or issue specific
knowledge to assist with investments made to the best direct-service providers.
• Influencing Policy: Many grant makers in education are working to influence policy in
order to positively impact educational outcomes, to level the playing field across racial,
socio-economic, and geographic divides, and to harness private and public financial and
social support.
• System’s Change: Education grant makers are supporting programs and initiatives that
lead to transformation of the education system in order to elevate all learners, especially
those underserved by the current model.
• Promising Practices:
o Scholars: Research has shown positive results from scholars’ programs, which
offer large, multi-year scholarships with “wrap-around” services such as
mentoring and tutoring. These programs track the result or impact of scholarships
by using a control group for comparison.
o Employee Giving and Volunteering Programs: Many companies are turning
their attention to employee councils that review charitable giving proposals and
design employee volunteering events or programs. These councils can increase
efficiency and create buy-in from employees who feel connected.
o Community Led Change: Programs successful in changing the education system
are often community led, sometimes emanating from P-16 or P-20 councils.
Many funders are investing their dollars to support these efforts.
EVALUATION
• Social Impact: Creating impact means selecting the best grantees; improving the
performance of grant recipients; and advancing the state of knowledge and practice.
• Student Success through Evaluation: Data-driven decisions lead to student success.
Funders are creating programs and initiatives with measurable goals in order to help the
education system evaluate better models leading to greater success.
VISIBILITY
• Heightening Visibility: Funders seek to balance the goals of disseminating grants and
creating a community dialogue. Visibility is focused on key stakeholders. Funders
interested in creating change emphasize the need to be known in order to advance
opportunities.
• Signature Initiatives/Programs: Gaining in popularity, signature or strategic programs
focus philanthropic dollars leading to greater efficiency, measurable impact, and
increased recognition with key stakeholders.

6
GRANTS MANAGEMENT
• Leadership Counts: Effective grants management is evidenced by senior executive
engagement.
• Responsive Grant-making: Nonprofits value transparency and approachable program
officers. Thus, funders need a standard evaluation process of all grants and time for
program officers to build relationships.
• Clear and Consistent Communication: Transparency in grant making includes clear
objectives, guidelines, and deadlines that are easily accessible to nonprofits and
consistent across mediums.
• Building Internal Capacity: Nonprofits report the value of program officers who are
knowledgeable about the field they support, which leads to designated and focused
portfolios.
• Larger, longer-term and unrestricted grants: Nonprofits report that funders that have
the greatest impact on their mission give larger, long-term, and unrestricted grants.

7
INTRODUCTION
The nonprofit sector is an important space in which the cultural, social, and economic divisions
in society may be challenged and transformed (Schooler, 1996). Corporate philanthropy, in
particular, offers an ideal means to achieve these objectives (Galaskiewicz & Colman, 2006).
The missions of such programs reflect the pluralistic needs and desires of society. The pluralistic
nature of such desires has thus propelled philanthropy to the center of importance in civil
decision making and innovation. In the past two decades many corporations have been moved to
reflect on their role within the third sector and beyond into greater societal contexts (Backer,
1999). This reflection has become a catalyst in the innovative restructuring of grant-making
programs wherein corporations seek to revolutionize their approach in satisfying particular
societal and contextual needs (Porter & Kramer, 2002).
Corporate philanthropy often uses corporate models of business practices in grant-making
program processes (Massachusetts Business Roundtable and the Philanthropic Initiative, Inc.,
2000). This strategy opposes a shot gun, reactive approach to philanthropy. Rather, it seeks to
provide a deliberate, proactive mechanism of effective grant-making. This is evident in the
emphasis on the development of narrowly-focused mission statements matched by strategic goals
and outcome measures. In harnessing the use of for-profit business practices, corporate
philanthropy programs seek to raise efficiency while heightening impact in the social context.
Moreover, as with the evolution of corporate-community relationships throughout the last two
decades, corporate philanthropy programs are more often implementing grant programs that
reinforce community relationships and partnerships. These programs provide greater long-term
impact while elevating transparency in the course of implementing social change (Smith, 1994).
Twenty to thirty years ago, corporate philanthropy was used primarily as a leveraging device to
promote a positive corporate image through ameliorating contextual social problems (Smith,
1994). In contrast, today the concepts of corporate social responsibility and corporate
citizenship have revolutionized corporate-philanthropic relationships (Lemay, 2004). The
modern purpose of corporate philanthropy generally encompasses an attempt by companies to
meld the sum of business with appreciable social benefit (Galaskiewicz & Colman, 2006).
There are three general categories of motivational factors that underlie today’s corporate
philanthropy: (1) stakeholder relations, (2) community obligation, or (3) strategic approach
(Lemay, 2004; Young & Burlingame, 1996). Stakeholders are those actors whom are both
effected by and affect corporate practices, and may include employees and their communities,
stockholders and customers, interest groups, vendors, and even greater society. In the stakeholder
approach, these relevant actors demand a blend and a balance of sound business practices and

8
philanthropic choices that are tangible to their needs (Lemay, 2004; Young & Burlingame,
1996). When community obligation is the motivation, the corporation supports the community
through a sense of obligation; that is, the corporation “gives back” what the community has
given to it. Finally, in the strategic approach, companies more narrowly focus on balancing and
advancing social goals and business objectives (Lemay, 2004).
Considering the blending of the for-profit world with the nonprofit world in the pursuit of
philanthropic action, how would a large nonprofit corporation- one that is a solid competitor -
most effectively heed the call in the context of these perspectives? This question poses
difficulties as there are no standard models in which either for-profit or nonprofit companies may
formulate a philanthropic plan of action. Thus, it is suggested that companies ask serious
questions about their ultimate goal and mission in the context of their philanthropic ideals. To
achieve these goals, a corporate philanthropic program must seek to evaluate its core identity,
which is defined as that which is “central, distinctive, and enduring about an organization”
(Albert & Whetton1985, as quoted in Young , D. 2001). A corporation may find itself with a
weak identity through a pervasive lack of clarity of organizational structure, a fragmented
understanding of the mission amongst the staff, generalized failure to expend energy and
resources in defining identity, or through institutional or external change (Young D. , 2001).
Factors that influence identity change may include a disparity in corporate image versus public
image; organizational restructuring; and political, economic, and social changes and
developments.
In ascertaining organizational identity, corporations must actively assess what the motivational
bottom line really is in their philanthropic endeavors. What does the organization seek to
accomplish through its philanthropic mission? Is it business, community, society, policy, or a
combination? Once motivational factors are understood, the organization can then define the
core structure, strategy, and managerial and management processes of the philanthropic program.
Again, there are no standard models of strategy in corporate philanthropy, but certain themes
loom large and answers to certain questions are imperative:
Focus: Targeting the stakeholder population is the first step in constructing a sound philanthropy
program. After analysis and consideration of the target population(s), the corporation must
consider the nature of influence it seeks to have on these populations and the relationship that
this influence will, in turn, manifest. Key questions include: Does the company seek to influence
the population generally or specifically? Is the philanthropic mission relevant to what the
population desires? How are the needs of the corporation balanced with stakeholder interests?
Are there conflicts amongst these populations? If so, what strategies can be used to mitigate such
conflicts?
Internal Structure: How is the giving program structured relevant to the corporation? Who are
the people involved, where is their place within the organization, and what is the nature of
interactive processes? Key questions include: Is there a separate foundation initiated for

9
corporate giving, or is the philanthropy program integrated into the organization? How does this
structure contribute or impinge upon the philanthropic mission? How are finances allocated to
corporate programming relevant to the key decision-makers and corporate processes? Does the
staff overlap within the two structures, or are they separate? Is the CEO of the organization
involved in key decisions of the philanthropy program?
External Structure: Does the philanthropy program partner with outside entities, which may
include partnering with other nonprofit or for-profit co-funders or partnerships with grantee?
What is the nature of these partnerships? Is the organization seeking greater visibility, heightened
impact on mission, or monetary gain?
Implementation: What is the nature of the giving program? Does the company dole out
sponsorships, gifts, grants or scholarships with minimal feedback expected? Or, is the program
contingent on contracts with emphasis on outcomes and measurement? Is the program long-term,
short-term, or a combination? How does the longevity of the program relate to its nature? Is the
program highly visible or does it operate quietly? If the program seeks visibility, are cause-
branding and marketing strategies involved? Does the program operate locally, regionally,
nationally, or all three? What percentage of a corporation’s resources is allocated toward the
financing of the philanthropic program? How large or small are the philanthropic gifts in relation
to the number of gifts being made and what is the relevance of the size of gifts to the program’s
functioning?
Management: How is the program managed throughout its term? Who are the key players in
philanthropic decision-making: the CEO and organizational management, the Board of Trustees
and sub-committees, the philanthropy staff, or other employees? What processes are involved in
communicating the development of the program? What tools are used in the process of
overseeing the philanthropic program? Are objectives being measured throughout, or only at the
end? What is the nature of the communication between the organization and the grantees?
Evaluation: What devices are used to measure impact and effectiveness of a particular program?
Does the corporation engage in benchmarking throughout the process, or does it utilize an end-
result outcomes assessment? What are the processes used in relating grant programs to the core
mission? More fundamentally, how does the organization know it has achieved success?

10
METHODOLOGY
The Center on Philanthropy at Indiana University (Center), a leading academic center dedicated
to increasing the understanding of philanthropy and nonprofit management, undertook a strategic
review of higher education philanthropy programs between July 2008 and March 2009. The
Center’s research goal was to identify and interpret best practices that will help inform decisions
about strategies, structures, and activities of grantmakers. “Best” does not mean that there is only
one way to achieve a desired result. Rather, the goal is to identify common principles to help
assess current and emerging trends in the environment in which organizationsoperates, determine
how to position its philanthropy so that it is more meaningful, and to reaffirm an organization’s
philanthropic focus and long-term strategies.
The methodology included the following aspects:
The Center reviewed relevant research in three key areas: best practices in corporate
philanthropy, grant-making in education, and a general overview of higher education
issues and trends. Research relevant to best practices in corporate philanthropy included
investigating cost/benefit ratios, recent trends and methods, and problematic areas.
Research related to higher education included a review of issues related to preparation,
access, and success in higher education. Other research looked at recent trends in
strategic grant making; and a particular focus on the funding of scholarships.
Case Studies: The Center conducted six interviews and provided two staff members to
conduct each interview on site to ensure accurate capturing and interpretation of
information. One criterion for the selection of the case study organizations was expertise
in impacting higher education through a well-defined, grant making process. Another
criterion was the selection of organizations, including those outside of higher-education
grant making, which have done a particularly good job at restructuring their grant-making
programs to provide greater impact on their mission. Four of the six case study
organizations are related to the student loan industry and two are community foundations.
To protect confidentiality we refer to each case study organization by Roman numerals,
case study (CS), I - VI. At times, names of programs and mission statements have been
altered in this report to protect the organization’s identity.

11
A NEED FOR CHANGE
Refining strategy and outcome measurements are key characteristics of today’s educational grant
makers. In a recent survey of 150 education grant makers, an overwhelming 78 percent reported
that their grant making methods and/or evaluation processes had recently changed (Grantmakers
for Education, 2008). Change within these organizations reflects the larger movement in the field
of education as well a general trend in foundation grant making. As new research becomes
available and new technologies emerge, adjustments are made that reflect cultural, political and
economic dynamics. Hence, grant makers are being more proactive, rather than reactive,
strategically aligning grants to the mission, and enacting measurable objectives.
Strategy is the name of the game in effective grant-making. Thus, grantors should always
reevaluate strategy effectiveness and allow for room for future adjustments. For example the
Bill & Melinda Gates Foundation, the largest private foundation in the U.S., has a step-by-step
process where the organization (1) develops the strategy (2) makes the grants (3) measures
progress and (4) adjusts the strategy. At least two of the six case study organizations are going
through a philanthropic strategic review. Case study organization III (CSIII) is in a 2-3 year
transition phase to readjust its strategy. Despite grant making in this area for a number of years,
grant-making was scaled back in order to conduct research; redefine goals and objectives;
develop narrower strategies relevant to goals; make exploratory grants; measure the outcome of
those grants; and solidify all objectives with the mission goal.
Case study organization VI (CSVI) is in a transition period in broadening their approach through
making exploratory grants. This transition is coupled with an evaluation process, which will
likely cause a subsequent narrowing of the grant-making approach. CSVI had been making
higher-education grants for seven years in the areas of: adult literacy; college preparation, access
and education for minorities; and after-school programs. In 2008, they realigned their funding
priorities by reinventing programs to strengthen, expand, and diversify the variety and quality of
educational access and advancement of all learners. CSVI’s investment in a broader array of
innovative and promising programs aims to acquire impact-driven knowledge to inform future
practices and shape public policy.

12
THE LANDSCAPE OF HIGHER EDUCATION
For every 10 students who start high school (Hunt Jr. & Tierney, 2006)
Seven will get a diploma
Only five will enroll in a postsecondary educational institution
Fewer than three will complete a bachelor’s degree within ten years
In this section of the report, we briefly explore the key topics related to higher education
which include preparation, access, and success in higher education along with the barriers
that prevent students from higher-education attainment.
PREPARATION FOR HIGHER EDUCATION
Preparation for higher education includes qualified academic skills and experience, social and
character skills, informational knowledge, including information on postsecondary costs and
academic programs, and contextual supports.
Preparation for college begins early in life. In 2006, the University of Cincinnati’s Center for
Urban Education (CUE) developed a Student’s Roadmap for Success. The roadmap shows the
important milestones and checkpoints in a young person’s life that provide positive evidence of
progress to transition into his/her desired career. This report highlights the complex and dynamic
factors that influence a child’s decision to prepare for college. Factors like health and nutrition,
family environment and stability, and abuse and trauma all influence a child’s college and career
aspiration (Center of Urban Education, University of Cincinnati, 2006).
In addition to core developmental factors, early experience in developing solid academic skills is
critical in determining college readiness. Research indicates that academic performance in the
freshman year of high school, in particular, is key in determining a student’s eventual graduation
from high school. If students are “off-track” early on, they are at a much greater risk for
dropping out of high school later. Students who are “on track” at the end of their freshman year
are 3.5 times more likely to graduate within four years (The Consortium on Chicago School
Research, 2007). Students in Grade 12, who complete mathematics courses beyond Algebra 2,
have substantially greater odds of enrolling in college (Horn & Nunez, 2000). Hence, this
evidence suggests that intervention in high school and proactive measures in promoting
advanced academic skills both contribute to college readiness.
Further evidence suggests that the academic strength of high schools is strongly linked to higher
education preparation and, hence, success (Baird, 2006). Academically-advanced school
systems tend to be situated in more affluent areas, and research has demonstrated that students in

13
such systems are at a considerable advantage in gaining the academic experience and logistical
information needed to prepare for college compared to under-represented students in poorer
communities (Vargas, J., 2004). The study, The Silent Epidemic, found that at least half of the
high-school dropouts surveyed left school because they were not being challenged academically.
A majority noted that they would have worked harder to graduate had there been more demanded
of them (MTV Press, 2007).
Parental education and support of their children’s pursuit of higher education are also key
elements in a student’s post-secondary preparation. Students of well-educated parents are at a
particular advantage in cultivating such aspirations. These parents instill the values and virtues of
higher education as well as logistical support for their children. Parental support is tightly linked
with socio-economic status (Vargas, J., 2004).
Other studies have found that engagement in negative behaviors early on in a student’s high-
school career, for example, skipping school, may lead to low achievement and higher drop-out
rates (The Consortium on Chicago School Research, 2007).
ACCESS TO HIGHER EDUCATION
Access to education considerations include the availability and usability of information regarding
higher education costs, requirements, and programming by prospective students. It is also
influenced by actual access to the finances necessary in covering all higher-education costs,
including tuition, board, books, and other living expenses. There are also a myriad of other
contextual variables, including social supports, socio-economic, family and socio-cultural
dynamics that influence access to education.
The financial aid system, with processes and ability to provide adequate resources, has a
powerful influence on a student’s access to education. The complexity of the financial aid
application and the plethora of grants and scholarships add to the cumbersomeness of this
process. The complexity of the application process is particularly important. One researcher
suggests that state aid is more powerful than federal Pell grant assistance in bolstering access to
higher education, because information regarding applying to state aid is more readily accessible
and decipherable. Moreover, certain minority populations seem to be particularly sensitive to
state aid assistance in access to higher education (Baird, 2006).
A student’s demographic makeup is another strong influence on their access to higher education.
Research has suggested that low enrollment of certain racial populations into higher-education
institutions is linked to the diverse and, often, disenfranchised socio-economic environment from
which these populations derive. K-12 schools within low-income geographic areas often suffer
from budget constraints. Budgetary constraints affect the level to which these schools are able to
provide students with the academic experience and logistical information needed for
postsecondary education enrollment (Vargas, J., 2004).

14
Family and cultural dynamics influence college enrollment according to levels of
encouragement, resources and expectation regarding higher education (Baird, 2006). Moreover,
there is strong interaction and correlation with a student’s cultural and ethnic background and
socio-economic status in influencing their decision to attend college. One study has shown that
racial background strongly influences the financial decisions necessary for college enrollment
and success. Some populations have a psychological and cultural perception that any debt is
negative. For example, it was found that Asian and Hispanic students are much less likely to
borrow funds for postsecondary education than White students when all other factors were held
constant (Institute for Higher Education Policy and Excelencia in Education, 2008).
SUCCESS IN HIGHER EDUCATION
Success, or retention, in higher education is defined as securing some formal postsecondary
degree. While success in higher education is contingent on the factors of preparation and access,
achieving student retention is an important consideration. A student’s retention in higher
education is confronted by unique variables unlike those experienced when preparing or applying
to college. Achievement and the ability to sustain coursework are areas often affected by social
and familial supports, finances, and personal characteristics and skills.
During the freshman year of college, studies have shown that financial aid that includes work-
study has a positive impact on persistence in college. College orientation courses and first-year
seminars, which orient students to college life, have been shown to enhance retention of students
to at least their sophomore year. In general, students are also more likely to stay in college if they
can master stress management skills to cope with college. In addition, autonomy in decision-
making, understanding how to prioritize, and self-responsibility all positively affect grade point
averages (Sidle, 1999; Students 'Swirl' Their Way to Four-Year Degrees, 2005; Williford &
Chapman, 2001)
Finances and access to financial aid impacts students throughout their college years. There are
many dynamics in any individual’s life that can affect his finances, as well as financial aid
eligibility. Getting married, having children, or other familial changes all lead to changes in
finances which, in turn, affect retention in college. Cultural and social factors also impact the
importance that the family places on a student’s ability and decision to stay in college.
BARRIERS TO HIGHER EDUCATION
Barriers to higher education have been well researched, and it has been found that there are at
least three logistical barriers to postsecondary access. Logistical barriers include financial,
academic preparation, and information about getting into college. These barriers reflect the
financial aid system, inter-system processes of higher-education institutions and government, and
the K-12 education system. Other barriers reflect issues relevant to the underlying sociological,

15
psychological, cultural, and political systems. All of these barriers interact to create complex,
individual-specific issues in the realm of higher education access.
FINANCIAL BARRIERS
Financial barriers include all informational and logistical factors relevant to a student’s access to
the resources necessary to prepare, attend or succeed in college.
Cost
The Commission on the Future of Higher Education found that “there is no issue that worries the
American public more about higher education than the soaring costs of attending college,” (p.
19). Affordability has always been a concern and barrier to higher education, but the problem
has worsened over the last several decades. Between 1976 and 2005, costs have risen by 270
percent (adjusted for inflation), while median family income has only increased by 23 percent
(College Board, 2008). Over the past decade, published tuition and fees have risen at an average
rate of 4.2 percent per year, after inflation, at public, four-year institutions, compared to 4.1
percent in the preceding decade and 2.4 percent from 1978-79 to 1988-89 (College Board, 2008).
Average tuition and fees for in-state students at public, four-year colleges and universities in
2008 was $6,585, which was 6.4 percent higher than in 2007. An average total charge, which
includes tuition, fees, room and board in 2008 was $14,333, a 5.7 percent increase over 2007
totals (College Board, 2008).
Financial Aid Policy and Accessibility
While student aid has risen significantly, it has not been enough to keep up with tuition
increases. In addition, many existing financial aid policies have shifted emphasis from low-
income students to middle-income students. The College Board reported on the net price of
college per student, which is the cost of college less grant aid and tax benefits. It was
indicated, “On average, full-time students receive about $10,200 of grants and tax benefits in
private, four-year institutions, $3,700 in public, four-year institutions, and $2,300 in public, two-
year colleges” (College Board, 2008). Over the past decade, the inflation-adjusted increase in
the average net price at private, four-year colleges was 22 percent, compared to a 27 percent
increase in average published prices. The changing distribution of income has also had a
significant influence on the ability of families to pay for college (College Board, 2008).
The availability of financial aid in satisfying unmet financial need is an additional consideration
for students today. Unmet need is defined as the out-of-pocket cost for college after all grants,
loans, and scholarships have been paid. As tuition costs rise along with the cost of living index,
more students and their families lack the ability to balance living expenses with college cost.
Moreover, given the current economic climate, students and their families are experiencing

16
greater overall debt. Such pre-existing debt is a substantial barrier to college retention (Institute
for Higher Education Policy and Excelencia in Education, 2008; Long & Riley, 2007).
Student Demographics, Debt and Financial Aid
Independent, non-traditional students, such as returning adults and single-parents, are uniquely
affected within the area of college retention. Independent students often work outside of school
and have familial responsibilities that take away from time needed to focus on school.
Individuals from certain racial and ethnic groups, in offsetting financial aid debt, also tend to
work while in school. As a result, these populations are more likely to attend college part-time.
As research shows, part-time attendance is more highly correlated with dropping out than full-
time attendance (Institute for Higher Education Policy and Excelencia in Education, 2008).
An additional, nuanced factor in affecting part-time attendees who work is the impact on
financial aid eligibility. This leads to a double-edged sword, of sorts. Students who need to work
while in college are at a disadvantage when it comes to financial aid, as any income decreases
eligibility thresholds. The decrease in eligibility threshold often translates into a higher amount
of unmet need (Long & Riley, 2007). Hence, students who work often have a greater amount of
out-of-pocket expense than students who do not work. This circle of burden often leads to
students taking one class at a time over the course of several years or drop-out completely (Long
B. , 2009).
PREPARATORY BARRIERS
Quality of Life and Family Dynamics
Researchers at the Cincinnati Center for Urban Education (CUE) reported in Student’s Roadmap
for Success that inadequate prenatal care, high rates of family transience, frequent shifts in foster
homes, insufficient nutrition, trauma and injuries from domestic violence, and even medical
issues can all hinder student success (Center of Urban Education, 2006).
High School Completion
Only 77.5 percent of all Americans in 2005 earned a high school diploma and this figure has
decreased from 1980 levels. High school graduation rates for minority groups are significantly
different than for Whites. In 2005, only 69.1 percent of African American and 72.3 percent of
Hispanic students graduated from high school. Students are also taking longer to complete
degrees or are, alternatively, reverting to GED attainment. Students’ geographic contexts,
combined with racial background, also lead to differentiated graduation outcomes. For example,
93 percent of White students in Kansas graduated while only 79 percent of their African
American counter-parts had (National Center for Public Policy and Higher Education, 2008).

17
Academic Preparation
Research has found that only 34 percent of students who do graduate from high school possess
the skills and qualifications necessary to attend postsecondary institutions without remediation
(Green & Winters, 2005). However, new research has shown that most states are showing
improvement in preparing students for traditional college or university through enhanced science
and math curriculum. Nevertheless, states are failing at initiating advanced courses in K-12 math
and science: these are the courses that correspond highly with college preparation. Moreover,
states have not yet implemented a national standard assessment of high school achievement.
Such an assessment would advance the understanding of students’ cumulative knowledge at the
high school level to compare with higher education standards. This valuable information could
lead to new policy in filling the education gaps between high school and college (National
Center for Public Policy and Higher Education, 2008).
Family and Cultural Dynamics
Students from low-income families often lack the perception that they are entitled to higher
education opportunities and lack the necessary financial and logistical information in preparing
for college. Moreover, such parents may not understand how to assist their children in effectively
selecting the courses needed for college admittance. Hence, low-income students within a low-
income, geographical contexts are at substantial disadvantage in college preparation (Vargas, J.,
2004).
INFORMATION BARRIERS
College Application
Attending college requires a complex set of steps over a period of time. Applying for college
involves the understanding of how to connect high school coursework with college aspirations,
entrance examination testing, college selection, and the application process (Vargas, J., 2004). A
few studies have found that prospective students with certain demographic characteristics
significantly lack information regarding the college application process. Researchers have found
that low-income, minority, and first-generation students are all at a significant disadvantage in
gaining quality information on the processes of applying for college (Horn, Chen, & Chapman,
2003; Vargas, J., 2004). The parents of first-generation students lack knowledge regarding how
to navigate the application process. These students must rely more heavily on guidance
counselors and outside support. If the educational system or community in which they reside are
lacking in such supports, these prospective college students are at a significant disadvantage
(Vargas, J., 2004).

18
College Cost and Financial Aid
Students and parents living within the lower, socioeconomic stratum are also at a disadvantage
regarding assessing information on paying for college. Long and Riley (2007) suggest that the
financial aid system is too complex for some students to navigate. Those students whose parents
have not gone to college and who attend high schools with inadequate guidance structures are
particularly limited on information necessary for proper navigation through the financial aid
system. Vargas (2004) reports that underrepresented populations are generally misinformed
regarding the costs associated with paying for college. These populations tend to underestimate
the amount of aid they are eligible for and to overestimate costs. This misinformation directly
corresponds with the lack of student aspiration and preparation for college within these
demographic categories.

19
PHILANTHROPIC PURPOSE AND MISSION
PHILANTHROPIC PURPOSE: CASE STUDY ORGANIZATIONS
For nearly all case study organizations, grant making was at the core of their philanthropic
mission. For a few case study organizations, however, philanthropy was only part of their
overall strategy to fulfill their mission. Discussions with case study organizations revealed that
how funders define themselves directly impacted their strategy, method of grant making, type of
grants made, level of involvement with their grantees, and measurements of impact.
CSIII is a good example of how self defining affects mission and strategy. They began a
visioning process by thinking about their organization’s values which are learning, foresight,
innovation, equity, social justice, courage, sustainability, and organizational excellence. This led
to defining their work as being a “connector of the dots between breakthrough innovations and
the larger system and community,” in addition to being “innovation engines.”
The implications for grant making are that CSIII:
Takes risk on learning new innovation;
Connects innovative ideas to “on-the-ground” platforms;
Leverages resources by connecting successes with other funders/partners; and
Advocates for the lessons learned by impacting policy.
Moreover, CSII’s connection and interaction with the community also implies that they are not
simply
An effective intermediary, or
A manager of other people’s “big ideas.”
This has influences their grant making. CSIII operates an “incubator model,” meaning that the
organization operates initiatives to success and spins them off in the creation of new
organizations. CSII’s grant-making approach involved the seeking of new opportunities to fund
and having a high level of involvement with grantees. Further, its initiatives are data driven with
the evaluation of impact integrated throughout.
Contrasting with CSIII, CSII with CSV each sees itself as a high-level partner involved in
strategy development. This has translated to placing a high value on partnerships and the
leveraging of resources. However, the organization places less emphasis on creating innovative
solutions. Hence, the organization does not fund research and is less data driven in the creation
of systems change. Both funders, however, make grants to innovative programs that have policy
implications.

20
FIGURE 1: CORE IDENTITY - HOW FUNDERS SEE THEMSELVES
Innovation engine
Connector of dots between breakthrough
innovations and the larger system and community
Facilitator of transformative change in
the education system
High level partner involved in strategy
development
Funder of community led education reform or
innovative acces programs
Proactive or strategic funder
Creator of nationwide efforts to increase access to education particularly
among underserved learners
Collaborative community leader
Generalists with good relationships with
colleagues

21
STAKEHOLDERS
STAKEHOLDERS: LITERATURE REVIEW
Stakeholders are those influential actors on whom organizations depend in order to operate. The
stakeholder has certain expectations regarding what the organization or corporation ought to be
doing within the larger context of the business world. Often, however, there is an underlying
tension between the organization and the stakeholder. Moreover, there may also be tension
amongst all stakeholders who are influenced by the organization. It is essential that organizations
appropriately define and target the stakeholders they seek most to influence in order to develop a
focused strategic plan. Further, defining the stakeholder population also means balancing
organizational goals with the totality of stakeholder goals (Committee to Encourage Corporate
Philanthropy, 2008).
There are multiple stakeholders in whom grantmakers in higher education should consider in the
course in a strategic plan. These stakeholders are:
Students/Parents
Institutions of Higher Education and Financial Aid Offices
Federal Government
State Higher Education Commissions
Communities in which the organization conducts business
Employees
Communities in which the organization employees work and live
STUDENTS AS STAKEHOLDERS
As indicated in the Landscape to Higher Education section of this report, certain populations are
at a disadvantage regarding preparation, access and success in higher education. These
populations include low-income, certain ethnic and racial populations, first-generation students,
and non-traditional students (single parents and returning adults). In this next section, we report
on the demographic landscape of higher education, the corresponding factors implicated and
revealed in this analysis, and a refinement of the concept of the student as the stakeholder.
HIGHER EDUCATION ATTAINMENT AND RACIAL/ETHNIC DEMOGRAPHICS

22
Analysis of enrollment and attainment is an important consideration when addressing access to
higher-education issues. Some studies have found that of those that graduate from high school,
73 percent of Whites, 56 percent of African Americans, and 58 percent of Hispanics enroll in
college the next fall (Snyder, Dillow, & and Hoffman, 2008). Cross analysis of college access
and college attainment according to race, in particular, is crucial in ascertaining gaps in post-
secondary success. The chart below outlines college enrollment and college attainment to
determine if racial and ethnic minorities are proportionately represented.
TABLE 1: 2006 HIGHER EDUCATION ATTAINMENT ACCORDING TO RACE BY
POPULATION PERCENTAGE
Race/Ethnicity Percentage
of College
Enrollment
(2005)
Percentage
of Total
Degrees
Earned
Percent
Difference
Enrollment
vs.
Attainment
Total
Percentage
of
Population
Percent
Difference
Percent of
Population
vs. Degrees
Attained
African American 12.7 % 9.0 % - 3.7% 12.3 % - 3%
Asian/Pacific Islander 6.5 % 7.1 % + 0.6% 4.4 % + 3 %
Hispanic 10.8 % 6.5 % - 4.3% 14.8 % - 8%
Native American/
Alaskan Native 1.0 % 0.7 % + 0.7% 0.0 % + 1 %
Nonresident Alien 3.3 % 9.6 % + 0.6% 3.3 % + 6%
White 67.0 % 67.1 % + 0.1% 66.4% + 1%
Note: Figures are rounded, Degrees include Associates through Doctorate)
Source: (National Center for Education Statistics, 2009)
• White, African-American and Native American enrollment in higher education correlates
with corresponding population percentages. However, Hispanics are underrepresented in
higher education by a 4.3 percent margin. Asian and Pacific Islander enrollment,
however, exceeds population percentage in college enrollment by 2.1 percentage points.
• Despite some differences in enrollment according to race, it appears that the percentage
of college enrollment by race generally corresponds to the percentage of the population
by race, with the exception of the Hispanic population. Thus, access to education, in
terms of enrollment, is more than a factor of race alone.
• African-American and Hispanic college success rates are significantly lower than
enrollment rates. For Hispanic populations, in particular, there is a double impact of low
enrollment and low success rates in higher education.
It appears that the Hispanic population, especially, experiences barriers to higher education that
are race sensitive. However, socio-economic considerations must certainly be a factor. Further

23
analysis of socio-economic factors according to race is necessary in untangling the net of barriers
which these populations face. Table 2 examines socio-economic demographics by race and
ethnicity.
TABLE 2: MEDIAN INCOME AND POVERTY RATES BY RACE/ETHNICITY, 2006
Race Median Household
Income
Percentage Population
Living in Poverty
African American, Non-Hispanic $ 31,969 24.3%
Asian/Pacific Islander $ 64,238 10.3%
Hispanic $ 37,781 20.6%
Native American/Alaskan Native Data not available Data not available
White, Non-Hispanic $ 52,423 10.3%
Source: (United States Census Bureau, 2007)
• This information is quite illustrative for the purpose of delineating access to education
according to socio-economic status and race. Asians/ Pacific Islanders have the same rate
of poverty as Whites. However, Asians/Pacific Islanders also have the highest median
income and the highest enrollment rate in higher education relative to population
proportion.
• The Hispanic population has twice the poverty rate as the White population, as well
as lower enrollment rates.
• Enrollment in higher education correlates with income when tied to race. As income rises
the percentage of higher-education enrollment rises. There is an exception with the
Hispanic population, however. Despite a higher median income level than the African-
American population, this group’s college success rate is 2.5 percent less. Thus, it may be
that for all populations, except for the Hispanic population, success rates are contingent
on socio-economic status and not racial status. Hence, any program directed towards the
Hispanic population ideally would be aimed towards both the socio-cultural and socio-
economic barriers to access and success in higher education.
• The African-American population statistics reveal that a quarter of the population lives in
poverty. Because the African-American population lags 3 percentage points behind
degree attainment relative to population proportion, it is important to analyze socio-
economic factors within this particular population.
In Table 3 we further explore socio-economic status and race by factoring in age.
TABLE 3: POVERTY RATES BY RACE AND AGE
Age Demographics Percentage of African-
American Population Living
in Poverty
Percentage of White
Population Living in
Poverty
Age 0-18 33.4% 14.1%
24
18-24 27.5 % 15.9%
25-34 23.1% 10.7%
Aggregate 24.3% 10.3%
Source: (Population Reference Bureau, 2009)
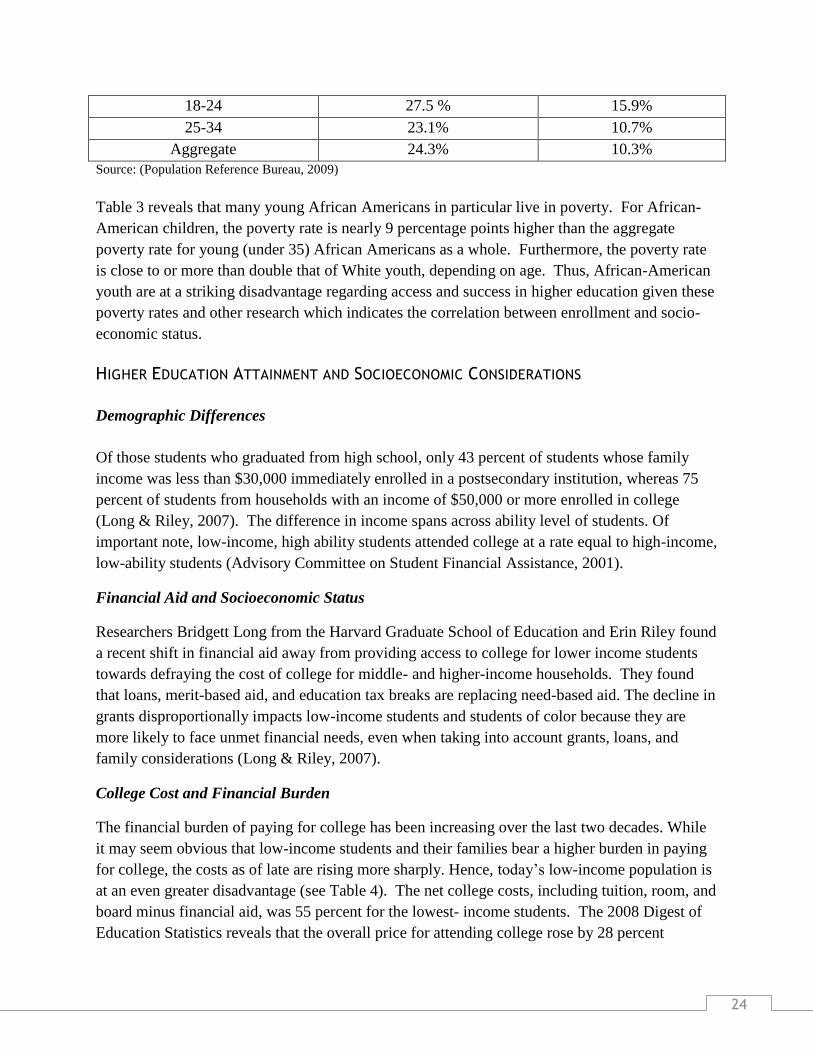
Table 3 reveals that many young African Americans in particular live in poverty. For African-
American children, the poverty rate is nearly 9 percentage points higher than the aggregate
poverty rate for young (under 35) African Americans as a whole. Furthermore, the poverty rate
is close to or more than double that of White youth, depending on age. Thus, African-American
youth are at a striking disadvantage regarding access and success in higher education given these
poverty rates and other research which indicates the correlation between enrollment and socio-
economic status.
HIGHER EDUCATION ATTAINMENT AND SOCIOECONOMIC CONSIDERATIONS
Demographic Differences
Of those students who graduated from high school, only 43 percent of students whose family
income was less than $30,000 immediately enrolled in a postsecondary institution, whereas 75
percent of students from households with an income of $50,000 or more enrolled in college
(Long & Riley, 2007). The difference in income spans across ability level of students. Of
important note, low-income, high ability students attended college at a rate equal to high-income,
low-ability students (Advisory Committee on Student Financial Assistance, 2001).
Financial Aid and Socioeconomic Status
Researchers Bridgett Long from the Harvard Graduate School of Education and Erin Riley found
a recent shift in financial aid away from providing access to college for lower income students
towards defraying the cost of college for middle- and higher-income households. They found
that loans, merit-based aid, and education tax breaks are replacing need-based aid. The decline in
grants disproportionally impacts low-income students and students of color because they are
more likely to face unmet financial needs, even when taking into account grants, loans, and
family considerations (Long & Riley, 2007).
College Cost and Financial Burden
The financial burden of paying for college has been increasing over the last two decades. While
it may seem obvious that low-income students and their families bear a higher burden in paying
for college, the costs as of late are rising more sharply. Hence, today’s low-income population is
at an even greater disadvantage (see Table 4). The net college costs, including tuition, room, and
board minus financial aid, was 55 percent for the lowest- income students. The 2008 Digest of
Education Statistics reveals that the overall price for attending college rose by 28 percent

25
between 1997 and 2007 (National Center for Education Statistics, 2009). In 2007, the average
annual price for attending a public undergraduate program stood at $11,034 (including room and
board), while the price for attending a private institution stood at $28,384 per annum. Over this
ten-year time frame, the price for attending a public school rose by 32 percent while the price for
attending a private institution rose by 22 percent (adjusted for inflation).
TABLE 4: NET COLLEGE COSTS AS A PERCENT OF MEDIAN FAMILY INCOME
At public four-year college and universities 1999-00
(%)
07-08
(%)
% point
increase
Lowest income quintile 39 55 16
Lower-middle income quintile 23 33 10
Middle income quintile 18 25 7
Upper-middle income quintile 12 16 4
Highest income quintile 7 9 3
A public two-year college and universities
Lowest income quintile 40 49 9
Lower-middle income quintile 22 29 7
Middle income quintile 15 20 5
Upper-middle income quintile 10 13 3
Highest income quintile 6 7 2
Source: (The National Center for Public Policy and Higher Education, 2008, p. 8)
Financial Aid Availability
Financial aid availability is crucial for access to college education for the majority of college
students. For the 2003-2004 academic year, 63 percent of all undergraduates received some form
of financial aid. During that time, an average of $4,000 in grants was awarded to undergraduate
students, while the average amount borrowed in loans totaled $5,800. Fifty-one percent of
undergraduate students received grants and one-third received student loans. Grants distributed
were most likely to come from the Federal Pell and Federal Supplemental Educational
Opportunity Grants. Other grants were awarded through educational institutions (18 percent), the
state (15 percent), and another 15 percent from a variety of other sources (NCES, 2005).
Federal Funding of Financial Aid
Generally, federal funds appropriated for education increased 64 percent from 2000-2006 for all
categories (primary to post-secondary and other categories). While funding for post-secondary
education stagnated throughout the late 90’s, it began to rise throughout the last seven to nine
years. Hence, the rise in federal funding reported between 2000 and 2007 was a staggering 102
percent (NCES, 2009)

26
Total funds provided through the federal system, off budget, increased 288 percent in constant
dollars from 1990-2007. In 2007, in particular, post-secondary federal allocations totaled $36.6
billion. In 2006, educational institutions received the largest bulk of federal funds at 64 percent,
while students seeking post-secondary degrees received 11 percent. In 2007, the U.S.
Department of Education, in particular, allocated $13.5 billion (19 percent) to postsecondary
institutions and $13.7 billion (19 percent) to postsecondary students (NCES, 2009).
Higher Education Attainment and Gender
College degree attainment by women outpaced men in the 2002-2003 academic period with 58
percent of all degrees awarded to women. The breakdown of this percentage includes: 60 percent
of all associates degrees, 58 percent of all BA degrees, and 59 percent of all Master’s Degrees
(NCES, 2005).
TABLE 5: DEGREE ATTAINMENT OF WOMEN BY RACE, 2003
Race/Ethnicity
Percentage
who Earned
Degree
African American 67%
Asian/Pacific Islander 55%
Hispanic 61%
Native American/Alaskan Native 63%
White 58%
Source: NCES, 2005
HIGHER EDUCATION ATTAINMENT AND NONTRADITIONAL STUDENTS
While the population of younger adults, aged 18-25, has increased over the course of 15 years
between 1990-2005, the Digest of Education Statistics (2005) anticipates that the percentage of
older adults, over the age of 25, enrolling into higher-education programs has begun to outpace
younger adult enrollment.
STAKEHOLDERS: CASE STUDY ORGANIZATIONS
Case study organizations all focus philanthropic dollars on postsecondary access and success on
low-income students, although there was variation around the language used to describe such
students. Case Study I (CSI) focuses on first-generation college students, students from high
schools with low college-going rates, and Hispanic Americans. Priority is also given for students
who are unrepresented in undergraduate and graduate education.
Case Study IV focuses on adult students, students from low-income families, first-generation
college students, and minority students. CSIV recognizes the dynamics of working to satisfy

27
multiple stakeholders. However, this organization focuses on the low-income student as the
primary stakeholder. This organization’s target audience is policymakers and state legislators,
while the impact of mission goals is on students and their families.
CSIII identifies schools, students, teachers, and parents as stakeholders. The goal of the grant-
making program is to influence and inform the community, state, and nation issues on
postsecondary education. Thus, grant making is aimed towards policymakers, legislators, and
community leaders. Grant making is also aimed towards those who influence government and
community leaders, such as unions, the media, business leaders, and other funders.
CSVI identified that nearly half of youth need an alternative pathway to higher education. This
organization believes that the traditional course that students take from high school to college
does not provide them with a solid footing in the ultimate attainment of a college degree. Thus,
CSVI focuses on learners from lower socio-economic backgrounds who appear to be at the
greatest disadvantage in bridging from high school to college.
The remaining two organizations, CSII and CSV, define the chief stakeholder as the community
“at large.” These organizations define their primary purpose as a developer of the local
community of which education is a part.

28
STRATEGY
OVERALL STRATEGY: LITERATURE REVIEW
Grant making in education works to influence policy; to positively impact educational outcomes;
to level the playing field across racial, socio-economic, and geographic divides; and to harness
private and public, financial and social support. Excellent grant making in education begins by
gathering knowledge regarding the gaps in access and success; first, by targeting core areas of
need, then by formulating a proactive plan of action matched by identification of observable
results, and finally by the careful implementation of resources. Long-term impact requires, at
times, innovation and a bit of risk (Grantmakers for Education, 2008).
As shown in Table 6, grant makers in education focus on many different education issues
including high school reform, effective schools, along with family and community social
supports. Approximately 60 percent of surveyed grant makers in education were addressing
college access and 40 percent made grants supporting college success and retention.
TABLE 6: FOCUS AREA OF OTHER GRANT MAKERS
Percentage of funders supporting: Key Education Issues:
Public Schools or Districts: 68% High School Reform, College or Career Readiness: 68%
Public Policy, Direct or Indirect: 66% Effective School/District Leadership: 62%
General Operating Support: 57% Family Community and Social Supports: 62%
Support of Community Organizing: 50% Math/Science/Technology Knowledge Funding: 61%
College Access (financial or non-financial): 59%
College Success and Retention: 40%
Source: (Grantmakers for Education, 2008)
CHARACTERISTICS OF EFFECTIVE GRANT MAKERS IN EDUCATION
Discipline and Focus
The best grant-making programs focus on key, specific objectives, while allowing for some
flexibility to integrate innovative ideas. Strategy in educational, grant-making programming
aims, specifically and strategically, to either counter opposition to or to strengthen broader
public-funding objectives. Such programming focuses on individuals, a policy, or a system, in
particular. Funders must understand how to best leverage and tie organizational strengths to the
purposes of the program for the greatest impact.
Knowledge

29
Consistent intake of evidence-based knowledge and contextual knowledge is essential in
educational grant making. Funders need to understand who the internal and external players are
relevant to the educational system and how these players interact cooperatively or in opposition
to one another. Barriers to program success, relevant to the contextual environment, must also be
evaluated an ongoing basis. Understanding what other education philanthropists are doing is also
imperative. This understanding offers an opportunity for collaboration, provides greater insight
on effective grant making, and assists in evaluating possible gaps in the system. Effective
funders know who the leaders are in the communities in which they work and fund. Moreover,
funders understand the cultural, historical and political dynamics of recipient communities.
Resources Linked to Results
Funders specify how the objectives of the program will provide fundamental change in the
targeted area of education, and they match these objectives with measurable outcomes
fundamentally related to the organization’s mission.
Effective Grantees
Funders are selective when considering grantees and aim to support those who are already have a
solid operational footing. They also ensure that the program is a good fit for both participants;
neither party needs to compromise their mission out of convenience. Finally, effective funders
consider the requirement that grantees develop a plan of sustainability whenever applicable.
Engaged Partners
Funders consider the involvement of key stakeholders and community stakeholders in the
decision-making process of grant making, as its decisions will affect both populations. Inviting
local leaders, education experts, and grassroots organizers are all important considerations.
Moreover, funders seek the development of a “broad constituency,” which enriches the pool of
ideas and innovation working towards solutions in education.
Leverage, Influence, and Collaboration
Funders strive to use all available resources for the pursuit of the cause. They analyze current
policy with the subsequent investigation of where changes need to occur. Then they assemble all
usable leveraging tools including collaboration with other organizations to tackle the issues.
Persistence
Funders must balance efficiency and effectiveness in program timeframes. Effective funders
ensure ample time for the fulfillment of program goals, while setting reasonable parameters of
program cessation if objectives are not being met.
Innovation and Constant Learning

30
Funders understand the appropriate methods in the research and measurement of program goals
and objectives. New methods are constantly assessed and integrated. Through research and
integration of novel methods of goal development, funders develop carefully, targeted plans of
program assessment both during the program and upon program completion.
Funders identify and adhere to measurable program milestones to implement assessment
protocols of program processes throughout the duration of the program. Changes are made as
needed as a result of these assessments on an ongoing, but structured basis.
Funders publish the results of successes and failures of grant making in an effort to advance the
field of education grant making as a whole.
Funders stay transparent and connected with grantees throughout the grant contract process.
While the level of communication may vary, maintaining open lines of communication enables
the grantee to ask questions and provide insight with much greater security and ease. Such
openness is conducive to expanding the funder’s knowledge base in educational, grant-making
processes.
Need for Data
Excellent postsecondary grant making requires effective, up-to-date data on higher-education
systems and processes and the problems relevant to the preparation, access, and success of
students. Evidence-based decisions are crucial for funders in building coalitions and public will,
changing policy, and making an impact on education. Sources for quality data on education
varies and is widely reported (Green & Winters, 2005; The Bill & Melinda Gates Foundation,
2008). Sources may include government studies and reports through the Department of
Education website or through private, nonprofit entities such as Grantmakers for Education, a
network of “foundations, corporate giving programs and individual donors [who] represent a
diverse and experienced cross-section of grant makers who improve programs, systems and
institutions from pre-kindergarten through higher education” (Grantmakers for Education, 2009).
The Bill & Melinda Gates Foundation also identifies with the need for advocacy to confront
barriers and initiate innovation in college preparation. The P-16 and P-20 council committees are
community advocacy groups that bring together business, government, and community leaders
with the goal of strengthening the ties between K-12 education and postsecondary education.
These committees work to bolster academic curriculum and work to strengthen policies that
work and change policies that do not. While the committees have now expanded into at least 38
states, education researchers, policymakers and government officials have mixed feelings
regarding the effectiveness of the committees (Education Week, 2008).
OVERALL STRATEGY: CASE STUDY ORGANIZATIONS

31
Case Study I (CSI) focused on three initiatives: need-based aid scholarships (~30 percent), direct
services (~60 percent), and education research (~10 percent). Need-based funding supports
eligible institutions that award financial aid to qualified students. Direct services programs
support access and success programs. Access programs, in particular, support pre-collegiate
outreach services and enrollment for students within a targeted demographic. Higher-education
success initiatives support those student services which help to increase retention, graduation,
credit transfers, and financial literacy services. Financial literacy services, in particular, aim to
improve debt and credit management and avoid delinquency and defaults. Funders also sponsor
education research that improves college access and retention among first generation college
students and students from rural communities; improves enrollment and graduation among
Hispanic Americans; and reduces student loan delinquencies and defaults.
CSI concentrates their grants in one state. However, this organization has recently implemented
plans to expand nationally to enhance visibility. Moreover, plans to expand grant-making efforts
to support more community-based organizations, which currently receive 12 percent of program
expenditures, is underway. Educational institutions, in particular, currently receive about 30
percent of program expenditures. Despite expansion efforts, CSI staff members express that the
grant-making strategy is too broad. Hence, the organization is currently considering hiring an
evaluator to help them narrow their grant-making focus.
CSII focuses grant making on the local community and spends $14.5 million on educational
endeavors within the public- and private preschool through post-secondary education systems.
Specifically, this organization only makes grants through a community-led initiative called
Driven to Success.1 All large grants are conditioned on direct-service providers participating in
the Driven to Success community initiative. The strategy of CSII’s grant making is built around
the Student’s Roadmap to Success, developed at the University of Cincinnati’s Center for Urban
Education. As noted earlier in this report, the roadmap identifies key skill sets and junctions in a
student’s life that increase the probability that a student will succeed in his or her desired career.
CSII only makes grants to organizations that facilitate students meeting these important
milestones. In this way, CSII’s strategy is highly focused.
One of CSII’s main strategies is to collaborate with other funders to improve the educational
system and postsecondary access and success. They envision that their organization is an integral
component of the community’s plan to improve education from the ground up and work to
leverage the resources of other funders for this purpose. Within education grant making, they
encourage citizen participation in advocating educational-system development and change. This
organization views itself as a function of the community and builds on their community’s
strengths and assets.
1 Name was changed to protect organization’s confidentiality.

32
CSII, although highly focused, also has built in flexibility within their strategic system. For
example, they make smaller grants for the capacity-building of other educational nonprofits
unrelated to Driven for Success. Moreover, CSII funds programs outside of education. For
example, funds are allocated towards human services and arts organizations.
CSIII’s strategy focuses on creating systems change within the realm of higher education. They
are currently in the stage of solidifying their strategy aimed towards being an engine of
innovation. Their current strategy aims towards:
• Continuing to build national platforms through innovation
• Identifying and investing in the strongest “learning” innovations
• Partnering with major funds and policymakers to ensure scope and sustainability of their
work
In this sense, CSIII has developed an incubator model. On at least three instances, CSIII has
begun an internal initiative; hired staff and funded the program; sought outside partners and
funders; and then spun the initiative off into a separate, self-sustainable, organization.
CSIV has set a highly-focused and ambitious goal of increasing the percentage of college
attendance. All of their grant making is aimed towards achievement of this singular goal, thereby
making their process a highly-selective and strategic process. To achieve the goal of increasing
college attendance, CSIV utilizes a few strategies. First, they fund in the areas of preparation,
financial aid, success, and institutional affordability. They have created signature initiatives
which focus on first-generation, minority, and lower-income students. These initiatives usually
start in one community but are also designed to be model programs for other communities. They
leverage the program by setting parameters for the program and soliciting buy-in and support
from other funders. Another strategy that this organization uses is grant making to
intermediaries who use their own knowledge expertise to re-grant funds to other direct-service
providers. Given the limitations of funding, a funding focuses on five key states. However, only
high-potential programs that can be duplicated in other states are funded.
CSV is the least focused of all case study organizations in terms of strategy. This organization is
in the process of considering the role that higher education plays in their overall philanthropic
plan. The organization focused on only one community supporting community-led efforts. The
strategy of this organization has four levels (see
Figure 2).

33
FIGURE 2: STRATEGY OF CASE STUDY V
CSVI’s mission2 is to stimulate transformative change of public education for underserved
learners. This is done by facilitating the expansion of “pathways” that enable all learners to
achieve a high-quality education. Further, CSVI focuses on ensuring students obtain the skills,
knowledge and the supports necessary to become self-sufficient, life-long learners. CSVI is in a
transition period wherein they have broadened their approach and are making exploratory grants.
These grants are coupled with an evaluation process that narrows throughout the process. This
broadened focus has led to the funding of five significant programs: Early Learning, Time for
Learning, Pathways to Higher Learning, Adult Learning, and Systems Building.
Currently, CSVI defines their strategy by delineating the questions each strategic initiative is
meant to answer, and works to resolve the following questions:
1. What are the skills and knowledge necessary for success in today’s world?
2. What are the barriers to creating an effective, flexible K-14/K-16 lifelong education
continuum in order to achieve these outcomes?
3. What innovations in practice and related policy advancements hold the greatest promise
for moving underserved learners toward extraordinary education results?
4. For students, what does it mean to be college-ready? What do postsecondary institutions
need to do to become more “ready” for the widening variety of students they serve?
5. What do we need to learn about public understanding to move the work forward?
2 Revised slightly to make the identity of the organization.
School Reform
(SELL, Charter School)
Community (Common Goal Sunday)
School (Early college)
Individual (Tutoring & mentoring)

34
Investments made through the Pathways to Higher Learning initiative currently focuses on:
identifying and investing in the innovative programs that increase student engagement in order to
increase student achievement; the development of college-level retention programs; and the
promotion of new and revised student achievement standards and accountability systems that
may lead innovation concerning where, when, how, and with whom students learn.
CSVI also supports programs, organizations, research, and conferences to influence policy and to
advance knowledge of public opinion toward education. CSVI does not operate programs but
harnesses their resources to increase the operational capacity of other organizations.
35
SCHOLARSHIPS
SCHOLARSHIPS: LITERATURE REVIEW
Financial Aid
Much of the literature on scholarship funding focuses on financial aid’s impact on college
enrollment and retention (Heller D. , 1997; Leslie & Brinkman, 1988). Some studies conclude
that college enrollment is directly influenced by the type of financial aid received. For example,
grants, as opposed to student loans or work-study, are more likely to positively influence college
enrollment decisions and retention. Additionally, these studies have found that certain
populations are particularly responsive to financial aid and grant eligibility, such as African-
Americans, Hispanics, and low-income students in the decision to attend college and where to
attend college. In other words, these students are more price sensitive than White students or
middle- and upper- income students. An example of this research comes from a study of high
school students in their sophomore year of college (St. John, 1990). St. John found that lower
income students were twice as likely to respond to a $100 increase in grants versus higher-
income students. African-American’s were 3.7 times as likely to respond to an increase in state
grants spending as White students.
Financial Aid System
Long and Riley (2007) suggest that the financial aid structure favors higher-income students over
those in the lowest income brackets. The authors’ contention is that low-income students are
forced to pay relatively more out of pocket than higher-income students. Many factors play into
the decision to seek and receive educational loans, and all of these factors have contributed to the
rise in receipt of such loans over the course of the last 15 years. These factors include the type of
educational institution, income level of the student, race, policy changes, and the economic
climate.
Student Debt and Loan Aversion
The percentage of student debt given student income has substantially risen over this period,
representing an increase in borrowing, an increase in cost, or both. However, Long and Riley
(2007) noted that such an increase in reliance on loans may not be true for all students, citing that
some populations decide entirely against taking out loans. Refusal of loans despite need appears
to be contingent on cultural mores, pre-existing financial distress, non-traditional student status,
and college choice (Institute for Higher Education Policy and Excelencia in Education, 2008).

36
Importantly, as Long and Riley (2007) suggest, research reports on higher education access and
success, relevant to student financial aid, are largely conducted through interviewing college
students. Thus, such reports include only those students who were enrolled in school at the time
of the study. How many individuals exist who have not bothered to acquire loans or attend
college because of affordability issues? Further research is needed in assessing this particular
issue.
Insufficient Financial Coverage
Long and Riley (2007) also suggest that students taking out federal loans are also increasingly
taking out supplemental private loans. Importantly, such loans generally carry higher interest
rates than federal loans. The supplementation of private and public loans alludes to various
factors including rising college costs, consumer debt, the national economic environment, and
the caps on the amount of federal student loans that may be borrowed. Insufficient federal
student loans limits are also evidenced by the fact that more students are borrowing at the
maximum available level.
Unmet Need Demographics
Additional research emphasize the problem of “unmet need,” or the amount of funding still
needed to cover college costs after granting, scholarships and financial aid (Institute for Higher
Education Policy and Excelencia in Education, 2008; Long & Riley, 2007). The authors provided
these key facts on student’s unmet need:
• Low-income students are in the highest unmet need category, despite receiving grants,
loans and other sources of aid.
Only three-fourths of students in undergraduate institutions completed the FAFSA in
2003-2004.
Twenty-five percent of students with a remaining need of at least $2,000 after grants
failed to apply for financial aid in 2003-2004.
• The average amount of unmet need for dependent students in 2003-2004 was $5,567 for
the academic year.
TABLE 7: UNMET NEED OF DEPENDENT STUDENTS 2003-2004
African American $4, 819
Asian/Pacific Islander $7,483
Hispanic $5,029
Native American/Alaskan Native $4,470
White $6,175
• The average amount of unmet need for independent students in 2003-2004 was $ 5,120.

37
TABLE 8: UNMET NEED OF INDEPENDENT STUDENTS 2003-2004
African American $4,431
Asian/Pacific Islander $5,989
Hispanic $4,387
Native American/Alaskan Native $3,822
White $4,419
Source: (Long B. , 2009)
Student Borrowing Habits that Impact Retention
(Institute for Higher Education Policy and Excelencia in Education, 2008)
• Students who do not borrow their first year of college, despite substantial unmet need, are
somewhat more likely than borrowers to leave college within three years without a
degree.
• African American and Hispanic non-borrowers are much more likely, in particular, to
leave school without a degree, 51 and 41 percent, compared to 39 and 32 percent of
borrowers, respectively.
• Non-borrowers enrolled into community colleges are much more likely to drop out than
students enrolled into other institutions.
• Borrowers are more likely than non-borrowers with unmet need to complete college, with
a substantial higher percentage of Hispanic and African American, and Native American
students leaving school compared to White cohorts. Moreover, these populations who
attend lower-cost institutions are at even greater risk of dropping out.
In reducing the aversion to financial aid, The Institute for Higher Education Policy and
Excelencia in Education (2008) suggest that policymakers and funders:
• Support high school counselors in addressing aversion early
• Increase financial literacy and emergency support with the institutional setting
• Support and implement financial aid revisions
• Address cultural and psychological barriers to reducing aversion to borrowing
Merit Aid and Need-Based Aid
The literature also documents the rising trend of state merit-aid programs, which have complexly
affected students’ access to education. Studies have found little evidence that merit-based
programs close the disparities between socio-economic status and racial/ethnic differences in
higher education (Marin, 2002; Dynaski 2000). Using strong control measures, Dynaski (2000)
concluded that the GA Hope award greatly impacted the attendance levels of incoming freshman
by an increase of 7-8 percentage points in 1999. However, the author found that high-income

38
youth enrolled at nearly a 13 percent higher rate relative to nearby states over lower-income
youth, and White students exhibited a 12 percent higher enrollment rate relative to Whites in
surrounding states.
The author attributed the high enrollment rate of Whites, compared to African Americans, to
socio-economic differences between these populations. A larger majority of African Americans,
at 94 percent (compared to Whites at 64 percent), were in the lower economic bracket. Students
within the lower economic bracket were required to apply for financial aid, which then cancelled
out the benefit of receiving the Hope Scholarship award. Thus, Whites, who composed the
majority of the higher income brackets, reaped the largest rewards from the Hope Scholarship
Program.
The socio-economic status of African Americans had a double impact on this population when it
came to the merit portion of the scholarship. Socio-economic standing tends to correlate with the
geographic distribution of poor performing schools. Schools in lower income areas tend to be
substandard, or at least at less of an advantage than geographically-situated higher-income areas.
In fact, the author reports that only 4 percent of African Americans in total met the merit-based
requirement of the Hope grant. In conclusion, Dynaski (2000) found substantial evidence that
African American attendance rates as well as attendance rates for all lower-to-middle income
youth, stagnated during the initiation period of the Hope Scholarship Award. Although
enrollment rates increased for White youth quite substantially, it appears many of these students
may have gone to college anyway, regardless of the help of the GA Hope Scholarship Award.
Moreover, the increased enrollment of this population further enlarged the ever-present
inequality gap between Whites and African Americans and rich and poor.
Impact of modified a Merit-Based Scholarship Program
Despite the negative impact of the GA Hope Scholarship contended by Dynaski (2000), Long
and Riley (2007) proffered that the GA Hope Scholarship Award is effective at least in regards to
its ease in understanding. During high school, students learn the exact financial and academic
requirements needed to be awarded the scholarship. Hence, students can prepare for college
years in advance. Ness and Tucker (2008) analyzed high-school student’s perceptions of the
impact that the Tennessee lottery scholarship program would have on their decision to go to
college. The TN lottery scholarship program, reformed in 2003 to broaden its aim of promoting
access to education for minorities and low-income students, is an expanded form of traditional
merit-based programs. This program allows for greater financial aid to merit-worthy students
while also allowing for a lower threshold of achievement. This lowering of the achievement
threshold is important as numerous studies have indicated that students from predominately poor
and culturally diverse communities have less access to quality education. This study analyzed the
degree to which high-school students were dependent on financial aid: additionally students’
perception of eligibility for aid on their subsequent decision to attend college was assessed.

39
Key finding of this study concluded:
Students in households earning less than $36,000 per year were 1.5 times more likely to report
that the receipt of a lottery scholarship would influence their decision to attend college.
Students least likely to report the goal to attend college were the most likely to report that
the receipt of a lottery scholarship would affect their decision to attend college.
College-bound African-American students were 1.5 times more likely than White
students to report that receipt of a lottery scholarship would affect their decision to attend
college. This is contrasted with a 65 percent increase in African-Americans with no
intention to attend college who reported that the receipt of the lottery scholarship would
positively affect their decision to attend college.
The author concluded that the perception of eligibility, in fact, influences the decision to attend
college. The more liberal aspects of Tennessee’s program are especially influential on
traditionally under-represented populations. It was suggested that opening up funding for such a
liberal, merit-based program may not be “efficient,” but this program provides greater
opportunity of success over traditional scholarship programs.
Source: (Ness & Tucker, 2008)
Promising Programs
The literature also uncovered promising scholarship programs (The Pell Institute for the Study of
Opportunity in Higher Education, 2006). Two of these programs are supported by the Bill &
Melinda Gates Foundation: the Washington States Achievers Scholars Program and the Bill &
Melinda Gates Millennium Scholars Program. In both instances, these programs are focused on
a target population, offer substantial dollar amounts, and provide secondary wrap-around
services.
The Washington State Achievers Scholarship program has shown very positive results. The
Achiever’s program currently consists of 3,340 Scholars who were selected from 16 high schools
with high rates of low income students. Junior-level students apply to the program and criteria
are: Active college academic preparation as evidenced by classroom involvement and college
outreach; intentionality in applying to a private or public school four-year college or university
located in the state of WA; and the lowest one-third of the family income bracket in WA. In
2006-07, the maximum scholarship was $4,350 for those attending two-year institutions and
$9,700 for those attending four-year institutions. Students in crisis are given the flexibility of
deferring the scholarship for one year (The Pell Institute for the Study of Opportunity in Higher
Education, 2006).
Some of the results of the Achiever’s Program include:

40
• Increased in student enrollment by 14 to 19 percentage points, after controlling for family
background, school characteristics, aspirations, and educational experiences in high
school.
• A majority of Achievers Scholars started on the direct path to the baccalaureate by
enrolling in four-year institutions. Almost two-thirds of Achievers Scholars (62 percent)
enrolled in four-year institutions compared to only 27 percent of low-income students
nationally.
• Higher attraction rate of minority students compared to the state average.
• Achievers Scholars have higher degree attainment rates relative to low-income students
nationally (36 percent versus 15 percent, respectively). While the initial cohort had not
yet completed their educational program at the time of the study, it was anticipated that
59 percent of the first cohort would graduate, which is nearly double the national rate
(The Pell Institute for the Study of Opportunity in Higher Education, 2006).
There are other unique features of the Achievers Scholars program which may contribute to its
success. Students are not selected on the basis of academic performance in high school (GPA) or
on pre-college entrance exams. Rather emphasis is placed on students’ social environment, self-
perception and experience. A positive self-concept and realistic self-appraisal, long and short
term goals, ability to navigate social systems, strong interpersonal support, community service,
leadership skills, and academic field knowledge all contribute to qualifying for the scholarship.
Recipients are selected in the spring of their junior year and participation begins with attendance
at the Achievers College Experience (ACE) between their junior and senior year of high school.
The ACE is a four-day summer program held on a college campus. The program provides
information and resources that are needed to be successful college applicants. Scholars are also
paired with a “Hometown Mentor” by the start of the senior year, who works with the scholars to
address college admissions and financial aid through the first two months of college (The Pell
Institute for the Study of Opportunity in Higher Education, 2006).
The Bill & Melinda Gates Foundation has another Scholars program, The Gates Millennium
Scholars Program, which has awarded more than 12,000 scholarships to “high ability,” low-
income students of color. Unlike the Achiever’s Program, Millennium Scholars are found in all
50 states and five outlying areas. The program is managed by the United Negro College Fund
(UNCF) with assistance from the American Indian Graduate Center Scholars, the Hispanic
Scholarship Fund, and the Asian & Pacific Islander American Scholarship Fund. Similar to the
Achiever’s Program, Millennium Scholars are awarded funding to cover unmet financial need
and are supported through wrap-around services. These secondary services include mentoring,
online internship information, fellowships, and scholarships. The Millennium Scholars Program
has been very successful, boasting a 77.6 percent college graduation rate for its Scholars.

41
SCHOLARSHIPS: CASE ORGANIZATIONS
Most funders interviewed do not utilize scholarships as a strategy in higher-education grant
making. In two cases, the funders manage scholarship programs for individual donors.
Specifically, CSIII, CSIV, and CSVI do not fund scholarships. These organizations believe
scholarships are an ineffective strategy when implemented in a “traditional” manner. For CSVI,
the overall strategy is to change the education system to benefit all students. Therefore,
scholarships are deemed unable to induce system change. CSII and CSV only fund scholarships
according to donor choice. CSV issues scholarships, but has set a restriction that all scholarships
total at least $2,000. CSV believes traditional scholarship programs do not have the desired
impact of increasing college attendance. CSV provides that the best scholarship programs have
the best characteristics:
Provide gap funding (for example for room and board and payment of books)
Include wrap-around services that provide other forms of support such as mentorship
Work within the context of a state scholarship program. For example, a scholarship
program in Georgia must be linked to the HOPE Scholarship program and a scholarship
program in Indiana must be designed to complement the new Academic Honors diploma
The only organization that funds scholarships as part of their grant-making strategy was CSI.
This organization awarded $2 million in scholarships in 2008 to enhance access to education for
needs-based students. CSI, in particular, aims to fill in the gaps of students’ unmet need.
Therefore, the amount of the scholarship is based on the amount of unmet need according to each
individual student. The assessment of need is tied directly to the FAFSA form, 3 hence, the
capped award is based on the median amount of unmet need (~$4,300). A secondary goal of
CSI’s scholarship program is student retention, which is open to all students.
Some case study organizations contract with other organizations in tracking the impact of
scholarships. For example, CSV uses the National Student Clearinghouse which verifies student
enrollment and degree attainment. This organization also builds a knowledge-base of scholarship
impact by measuring enrollment and the degree-completion rates of CSV-recipient students
against other scholarship programs to assess impact.
All but one case study organization uses Scholarship America to process and manage
scholarships. Utilization of Scholarship America differs across the case study groups. Some use
this organization to manage all aspects of scholarship programming and others use them only
post-award.
3 It should be noted that one of the issues raised with using the FAFSA form is that it doesn’t take into account a
student’s changing need over the year, and therefore, may not be a true reflection of unmet need.

42
EMPLOYEE GIVING AND VOLUNTEERING
EMPLOYEE GIVING AND VOLUNTEERING: LITERATURE REVIEW
Employee Giving Programs
One study revealed that approximately 10 percent of all corporate contributions are towards
matching-gift programs. The typical rationale that corporations have for instituting a matching-
gift program is to attract, retain, and motivate the best employees. Investment in employees
enables companies to contribute broadly across numerous regions without the overhead of a
centralized allocation process. However, generally, little research exists on the actual effect of
these programs on employee recruitment or retention. Employee participation in corporate giving
programs is typically low at 10 and 30 percent of employees. While there is some postulation
that these low percentages have little effect on employee recruitment and retention, some
research suggests that these programs matter greatly to a small number of employees, typically
senior executives who give large amounts (Peterson, 2004).
For many companies, matching-gift programs grow to consume a large percentage of the total
contributions budget. Large allocation of grant-making towards employee programs grows over
time and is often indicative of the success of such programs within the community. Research
reveals that employee philanthropy programs have a positive impact on consumer and employee
loyalty. Despite the success of some employee-giving programs, some organizations should
approach such programs with caution. As employee-giving programs grow, they may limit the
overall philanthropic agenda and budget. Moreover, the elimination or curtailment of such
programs may have detrimental effects on employee morale (Rochlin, 2000; Walker
Information, 2001).
Trends in Employee Matching-Gift Programs:
• Strategic alignment of an employee matching-gift program with philanthropic mission
goals. Employee gifts are geared towards the fulfillment of the specific philanthropic
agenda
• Limitation of employee gifts to full-time employees or subpopulations to minimize cost
• Outsourcing of the administration of the employee matching-gift program
• Establishment of a “cap” on the dollar amount to be matched or adjustment of the
percentage matched. Some companies match gifts on a first-come, first-serve basis until
the budget amount has been exhausted
Employee Volunteer Programs
Employee volunteer programs are company-sponsored initiatives that encourage employees to
volunteer within their community.

43
Examples of employee volunteer programs include:
Company paid programs wherein the company allots employees a certain number of paid
volunteer hours per year
Company-sponsored group volunteer projects, paid and unpaid
Allocation of financial resources to organizations in which employees volunteer. This
program is often referred to as a “Dollars for Doers” program
Executive loan programs which allow managers to take a sabbatical from the corporation
to utilize professional skills at a nonprofit organization. Usually these sabbaticals are for
a significant, prescribed period of time
It has been demonstrated that employee volunteer programs enhance teamwork and morale,
develop vocational and interpersonal skills of employees, improve community relations, enhance
the corporate image, and strengthen employee recruitment and retention (Aylward, 2002).
The best employee volunteer programs have these attributes in common:
Programs are managed through the external relations or community involvement
department of the organization
The name of the program is engaging and creative. For example, Disney has the Disney
VoluntEARS, Inc. “Grow Up Great” program and Home Depot has the Team Depot
program
Programs allocate, on average, nearly two full-time staff members for the implementation
of employee volunteer programs. This translates into one full-time staff member for
every 32,000 employees for larger companies and one full-time staff member for every
2,700 employee for companies with less than 10,000 employees
Larger companies spend an average of $30 per employee, and smaller companies spend
an average of $64 per employee
Source: (Points of Light Foundation, 2006)
Trends in Employee Volunteering Programs
Eligibility is often limited to full-time employees
Employee volunteer programs align with the company’s overall philanthropic mission
Employee volunteering policy designates a set number of hours per year, per employee to
be paid by the employer
Employee Councils
One final trend in employee-giving and volunteer programs is employee councils. Employee
councils serve as review communities for charitable giving programs and employee volunteering

44
events or programs. Employee councils incorporate employees from key departments and
represent all levels of employees.
EMPLOYEE GIVING AND VOLUNTEERING: CASE STUDY ORGANIZATIONS
Only two of the case study organizations interviewed have an employee-giving program. CSIV,
an organization which does make community grants, provides a 3:1 employee match donation.
Employees contributing to this program must make a minimum donation of $25 (the cap is
$50,000). CSI, as an alternative to employee matching or giving programs, involves employees
in grant-making decisions. In this program, giving is employee-directed and gifts are based on
the strategic alignment with philanthropic goals. Employees have positively responded to CSIV’s
employee-directed program in its garnishment of employee connectivity.
POLICY/GOVERNMENT RELATIONS
POLICY/GOVERNMENT: LITERATURE REVIEW
Half of the over 150 survey respondents reported that they support grassroots’ efforts at policy
change in education and two-thirds reported that they directly contribute to policy change efforts.
Fifty-eight percent of all respondents increased efforts at policy change in recent years. Of all
corporate foundations interviewed, 44 percent of grants allocated were directed towards policy.
Of all private foundations interviewed, 74 percent of grants allocated were directed towards
policy (Grantmakers for Education, 2008).
Policy grant making is directed towards all levels of government, government policy, and
governmental institutions, and grant making has several aims. State and federal policy on higher
education affects philanthropic interests on a variety of levels Given the latitude that states have
to develop higher-education policy, an analysis of states’ performance of higher education is
particularly relevant and important. Measuring Up 2008 provides grades on states relevant to
their performance on higher-education policy and initiatives (The National Center for Public
Policy and Higher Education, 2008). While the state statistics are not provided here, the report
developed state scorecards according to:
• How adequate the state is in preparing students for higher education enrollment
• Whether states are providing all residents with ample opportunity to assess higher
education and advanced training after high school
• How state policy affects the cost of higher education regarding tuition and financial aid
provisions

45
• Statewide college completion rates and variables affecting those rates
• The cost/benefit ratio of investment in higher education. How does the state benefit from
this investment in terms of the cultivation of a “highly-educated population” (p. 28).
• How do states track the gap between high school and higher education and what students
are learning compared to other states?
These factors provide a synopsis of the states’ role in developing effective policy for advancing
preparation, access and success in higher education. Hence, it may be beneficial for grant makers
to investigate these factors and implement policy grant-making toward the fulfillment of mission
goals.
A report commissioned by the Nellie Mae Education Foundation indicates that a long-term
political and public-will campaign is needed to enhance information access for prospective
college students (Jobs for the Future, 2008). The foundation expressed:
“A combination of messaging about the challenges we face, improvements and
innovation in practice that can help more underprepared youth and adults advance and
succeed, and policy changes that can spread and sustain more effective learning
opportunities and outcomes. These can be thought of as efforts to end the invisibility of
the most at-risk members of our society, spur a wave of innovation and invention of new
options and models for serving struggling and underprepared individuals and enabling
them to benefit from college learning, and invest in the infrastructure of policies and
partnerships for change that can be sustained over time and lead to significant upgrading
of knowledge, skills, and economic success.”
The Nellie Mae Education Foundation suggests that funds from within the nonprofit sector play a
critical role in this strategy, particularly for low-income, minority, and underprepared young
people and working adults.
POLICY/GOVERNMENT: CASE STUDY ORGANIZATIONS
Three of the six case studies organizations specifically focus on policy change as part of their
overall grant-making strategy. For CSIII, influencing policy is at the core of its strategy to
produce change at the systems level. The target audience of this organization is policy makers,
legislators, and community leaders. CSIV also supports research and other efforts with the
specific aim of providing institutional and policy support. One action taken by CSIV in an effort
to heighten its effect on policy was the hiring of a Director of Policy. The director’s job is to
deepen and strengthen the organization’s capacity to inform public policy in creating innovative,
multi-dimensional improvements in the higher-education system. The methods used by the
Director of Policy include the conceptualization and implementation of policy and research
agendas. These agendas build knowledge in the field of education policy at the federal, state,
regional, and local levels. Moreover, CSVI also supports programs, organizations, research, and

46
conferences in an effort to affect policy and to advance public knowledge regarding higher-
education issues and initiatives.
While CSI does not specifically focus on policy change according to their prescribed
philanthropic agenda, they do support research that informs policy. Affecting policy at the
community level, CSII and CSV are partners and fund community-wide efforts to affect change
within the local educational system.
GEOGRAPHY
GEOGRAPHY: LITERATURE REVIEW
Little research is available regarding geographic strategy in higher-education grant making. This
element of strategy is integrated intimately with other strategic elements, including grant size and
the nature of the grant program. Hence, delineating geographic strategy may only be purposeful
in relation to those variables.
Current research provides statistics on how other funders are disseminating grants according to
geography. According to a survey of over 150 organizations in the field of higher-education
philanthropy, in late 2007, 34 percent of organizations directed grants locally, 23 percent
supported programs or organizations in one or two states, 21 percent directed their support
nationally, and 14 percent distributed grants with an international scope (Grantmakers for
Education, 2008).
GEOGRAPHY: CASE STUDY ORGANIZATIONS
Among the case study organizations, four mostly support local efforts, one has a regional focus,
and the remaining organization has a multi-state focus. However, CSI and CSIII are both
looking to expand nationally. CSI is doing this by expanding their visibility beyond their state
borders. CSIII is funding promising initiatives in their local community that can work to solve
national education problems. CSVI’s mission specifically focuses them on their region, but on
occasion will support programs that may be outside their region, as long they have the potential
to impact education initiatives in their states. CSIV is the only case study organization that can
operate nationally. CSIV believes that to make an impact they must focus on just a few states or
communities. To do this, they have looked at education statistics from around the country and
selected states where they believe they can have the greatest impact. This has meant focusing
initially on five states. However, they also use partners and funders in other states to coordinate
their programs to expand their reach beyond the initial five states. Finally, they support
initiatives which may have a larger impact on the national education system.

47
USE OF INTERMEDIARIES/PARTNERSHIPS
USE OF INTERMEDIARIES/PARTNERSHIPS: LITERATURE REVIEW
Why partner?
A report by the Committee to Encourage Corporate Philanthropy provides, via a survey of the
nation’s most efficient philanthropists, that partnership and collaboration strongly affects the
efficiency and effectiveness of the philanthropic approach. In fact, fifty-eight percent of the most
efficient philanthropists partner with other organizations. Of the respondents who are already
partnering, fifty-five percent report that there has been so much success that plans are underway
to increase these endeavors (Committee to Encourage Corporate Philanthropy, 2008).
Some funder operates on the corporate model; hence, research regarding corporate-nonprofit
partnering in pursuit of social goals is included. Burlingame and Smith (1999) reported that
while corporate philanthropy has been on the relative decline throughout the last several years,
corporate-nonprofit partnerships have risen substantially in the same period of time. These
partnerships include corporation sponsorship of relevant nonprofit research and “hybrid cross-
functional business units” working towards specific social agendas (p.72). The authors surmise
that while corporate philanthropy numbers may seem down, corporations are actually investing
more into the business units that externalize to nonprofit causes. Hence, clearly, this alludes to
corporate-nonprofit partnering as high-efficiency endeavors (Burlingame & Smith, 1999).
Rather than viewing the corporate-nonprofit philanthropic partnership as singularly beneficial to
the corporation, more often it is case that the nonprofit partner receives the largest reward. The
connections that nonprofits develop in addition to corporate contributions allow nonprofits to
explore previously unimaginable areas. Moreover, corporations offer substantial business and
technical expertise to nonprofits that provides for an intersection of corporate-nonprofit interests.
(Burlingame & Smith, 1999). This intersection, thus, allows for innovative solutions to unfold
and maximize unlike those in any other type of partnership.
Partnership Development
Steven Rochlin in, Alliance for Youth: What works in CSR Partnerships, defines
corporate/nonprofit partnerships as those, “initiatives in which participants define shared goals
and objectives to solve a defined problem that requires each to contribute labor and resources”
(p. 5). It was further emphasized that such partnerships require mutual goals and benefit for all
of the organizations involved and a commitment to work on the common goal for a significant
duration. In this report, Rochlin outlines seven key considerations in nonprofit partnerships as
provided by the Center for Corporate Citizenship at Boston College. (Kinkade, Macy, Nieker, &
Rochlin, 2006):

48
1. Know your company and know your motivations
Corporations must seek to balance between maintain distance via check writing and end-result
evaluation and over emphasis on financial return and impact. Funders should seek to use its
higher-education financing expertise in driving the greatest impact on its social objectives.
However, funders should be aware of partners who wholly or significantly rely on the
organization for funding as this may place an undue burden on the corporation for the success of
the program. Moreover, heavy reliance on finances versus social objectives is a drain on the
partner’s creativity.
2. Due diligence of company goals, mission and objectives
Rochlin suggests that corporations interrogate prospective partners’ abilities, strengths,
weaknesses, and complementary factors in accordance with traditional due diligence practices.
3. Broad partnership goals/vision
Both partnership organizations should have an over-arching goal of vision under which the
program is driven, rather than narrow, technical objectives. Narrowing the objectives may prove
to be suffocating for both parties. It is advised, however, that this approach may not be suitable
for all relationships.
4. Build social capital first
Grantmakers in education must build relationships with different organizations and
organizational leaders in order to build and strengthen success in its philanthropic missions. It is
suggested that funders build trust with other potential partners prior to engaging in any
significant philanthropic project.
5. Develop organizational capacity
Organizational capacity also assumes financial, social and creative capacity, amongst others.
Corporations, while certainly having the structural and financial capacity, may be lacking in the
other areas. Funders should seek to partner with organizations that have the attributes which it is
missing, such as social capacity in the community and creative capacity in higher education and
access.
6. Prioritize - The partnership is as important as all other business functions
The philanthropic partnership should be viewed as integral, not only to the corporation’s
philanthropy, but to the organizational whole. As such, the partnership is as important as any
other business factor. Moreover, the partnership must be cultivated and routinely supervised in
order to reap the rewards of such a partnership.
USE OF INTERMEDIARIES/PARTNERSHIPS: CASE STUDY ORGANIZATIONS

49
Program officers at nearly all case study sites admitted that they are not “content-knowledge
experts.” Most of these organizations utilize intermediaries and other partnerships to create the
change specific changes which they seek. At least two case study organizations, CSIV and CSVI,
use intermediaries to re-grant dollars to direct service providers. Intermediaries are used not just
for end-purposes, but also as sources for building relationships and knowledge. In general,
intermediaries create an advisory committee, develop the Request of Proposal (RFP) in
partnership with the funder, implement the RFP, and host grantee meetings throughout the
process. In the case of CSIV, the intermediary implements the grant program or endeavor. In the
case of CSVI, the intermediary simply acts as a referral source for the organization. In this
situation, CSVI retains the right of refusal and always implements the grant to maintain oversight
of the granting process and to increase visibility. Both CSIV and CSVI use intermediaries as a
strategy as a consequence of low manpower and to maintain program oversight.
All case study organizations have partnerships to varying degrees. Case study interviewees
cited various examples of issues that develop in partnerships:
• Unrealistic expectations on either side. Grantees promising too much in terms of
outcomes seems to be a significant issue
• Poor communication between partners; the use of passive-aggressive behaviors; and
withholding important information were all cited as particularly negative outcomes.
• Staff turnover causing disruption and confusion in program linkage
• Rigidity imposed on the grantee by the funder, including the funder’s inability to allow
the grantee to activate their expertise in program implementation.
• Lack of buy-in to the project by the personnel of either organization.
Case studies also provided the positive traits of successful organizational partnerships:
Clear objectives and an overarching goal
Funders approaching grantees as partners, not funders
Transparency on both sides, which includes having frank, open conversations
Trust
Demonstration of the commitment to respect for the grantee’s topical expertise
Passion for the project
Solid data
“Being supportive and creative champions of change means you don’t get the credit all
the time.”
One case study organization indicated that long-term relationships are particularly valuable.
These relationships are lower-risk than short-term, more unfamiliar partnerships. Forming long-
term relationships allows for greater transparency and trust. Hence, such relationships offer a

50
solid investment in what really works and the greater leveraging in content-knowledge expertise.
However, interviewees at CSVI indicate that long-term relationships should not impede on
organizations maintaining an open mind in regard to the creation of other partnerships in the
future.
Leveraging Resources
A funder’s leveraging of the resources of another nonprofit organization for the purposes of
satisfying a singular goal increases the impact on that goal. Leveraging the resources of another
organization provides efficiency for both organizations. All case study organizations, with the
exception of CSI, engage heavily in leveraging as a strategy. For CSII, this means using
community leadership and knowledge of the community in the grant-making process. Further,
CSII specifically measures how the investment of leveraged resources spur growth and, hence,
further investment. For example, an initial investment of $500,000 to one program generated
nearly $6 million in co-investments, and the investment of $1 million to another program led to
the creation of a $25 million loan pool. CSII admitted, despite these returns, that it is challenging
to get funders to work together effectively as each organization has its own traditions and
favorite projects.
CSIII, CSIV and CSVI all seek to create systems-change within the educational sphere. All three
organizations indicate that such systems-change, considering the vastness of the endeavor,
requires coalition-building. CSIII, in creating partnerships with other funders, actively seeks
grant dollars from other sources to fund its initiatives. CSIV’s national strategy is to partner with
selected funders in managing initiatives within selected communities. CSIV’s approach is to
fund those organizations that are more intimately connected with the grant-impact community.

51
EVALUATION OF IMPACT
EVALUATION OF IMPACT: LITERATURE REVIEW
Impact can be defined as the extent to which mission objectives satisfy the problem addressed by
the grant-making program. Given the subjective nature of social-impact programs, it is difficult
to measure how grants ultimately impact mission goals. Hence, there are no standard
measurement models to assess the outcomes of grant-making programs. The outcome
measurements that do exist borrow from the corporate world. Charles Moore of the Committee
for Effective Corporate Philanthropy refers to outcomes as “leverage, community benefits and
business benefits” (Strategic Corporate Philanthropy Brief, 2003). Therefore, outcome
measurements should address how effectively the funder leverages resources, the level to which
the community benefits and the level to which the company benefits.
Impact
Porter and Kramer (Dec. 2002) suggest that corporate philanthropy programs must be able to
identify how companies “achieve the greatest social and economic impact” (p.11). The grant-
making organization, unlike government funders and individual donors, has considerable latitude
in the implementation of philanthropic programs. For this reason, grant-making organizations
also have considerable responsibility in maximizing the effectiveness of these programs for the
benefit of the public good. The authors cite four modes of initiating the greatest amount of social
value: selecting the best grantees, signaling other funders (i.e. partnering with other funders);
improving performance of grant recipients; and advancing knowledge and practice (p.14). The
authors emphasized the importance of corporate philanthropists on keeping an eye on impact
rather than self-benefit.
The four modes of social impact:
1. Select the Best Grantees
Grant makers should seek to fund the best grantees in the implementation of philanthropic goals.
Doing so will provide for a “higher social return.”The key to selecting the best grantees is
evaluating the results of current grantees and comparing successes over time. Moreover, grant
makers should seek to update its evaluation and selection practices according to best-practices
innovation.
2. Signaling other Funders
Attracting other funders in contributing to the best programs doubles the impact of value on the
grant-maker’s objectives. Organizations should consider offering matching grants to potential

52
partners. Matching grants elevate the impact of the program while providing for capacity
development in the funded organization.
3. Improving the Performance of Grant Recipients
Grant makers must consider moving away from the “provider” to the “partner” in grantor-
grantee relationships. This move raises the social capacity of the grantee in providing greater
impact throughout the community. Partnering with grantee organizations includes: impact
tracking and measurement assistance, functional management assistance, access to other
professional services, and building “clout.”
4. Advancing the State of Knowledge and Practice
Grant makers are in an especially unique and valued position to fund, research and pursue
innovative solutions. Instituting “pilot projects,” enhancing current research, and providing
leverage for other organizations with different ideological frameworks should all be key
considerations in instituting greater impact.
“ As long as companies remain focused in the public relations benefit of their contributions
instead of impact achieved, they will sacrifice opportunities to create social value” (Porter &
Kramer, 2002, p. 15).
MEASUREMENT
Funders of social programs are increasingly demanding that grantees produce evidence that grant
dollars have been used effectively in regard to specific programs. This increase in demand relates
to external pressures developed as a result of government and corporate influence. An outcome
assessment is defined as the “regular measurement and monitoring of how well [ ….] programs
are performing relative to the desired outcomes” (Thomas, 2005, p. 391). Outcome assessments
developed largely out of government contractual agreements with nonprofit organizations.
Specifically, the Government Performance and Results Acts of 1993 enforced such
accountability for nonprofit organizations. Corporate practices have also affected the use of
outcomes assessements by today’s nonprofit organizations. Cost/benefit analysis has always
been a part of the corporate world. Nonprofit outcomes assessment are simply a variation of the
costs and benefits of grant making. However, in the nonprofit sphere, assessing the costs of
program implementation against net gain is substantially more difficult. This may be one reason
why many nonprofit organizations fail to perform such assessments (Thomas, 2005).
Purpose of Evaluation
There are two purposes for employing an evaluation of program processes. The first purpose is
the summative purpose and the other the formative purpose (Thomas, 2005). Before conducting
an evaluation of any program, the organization must define the reasons for the evaluation. The

53
summative approach emphasizes evaluation of the program’s overall achievements. The
formative approach emphasizes evaluation of the functioning of the program. Funders will tend
to require that grantees provide a summative assessment of the program’s achievements in
ascertaining that grant dollars had an impact. Funders require formative evaluation to determine
if the organization used their grant dollars as they stated in the proposal or grant agreement.
Processes of Planning an Outcome Assessment
Assessment plans must be thoughtfully planned and diligently executed for optimum benefit and
value. Thomas (2005) outlines four major points in the creation of an outcome assessment:
• Involvement of the CEO of the nonprofit organization and/or the Board of Trustees in the
creation of the plan. The persons responsible for implementing the plan must be aware
that the entire organization or philanthropic program has a vested interest in the outcome
of grant-making programs.
• All outcome assessments must measure each program singularly. The staff person or
team responsible for implementing the particular program must be involved in creating
the program assessment plan.
• All outcome assessment planning should involve staff, and, as needed, other stakeholders
who are affected by the program. Involving personnel or stakeholders outside of the
managerial team leverages information-gathering efforts and builds a sense of program
ownership of all team players.
• All outcome assessment plans must be created with the organization’s information
systems and protocols in mind. The organization must have sufficient staff and
technologies to implement the outcome assessment plan.
Program Goals
Outcome assessments are tied to program goals, hence, the development of sound program goals
is imperative. There are two types of goals according to Thomas (2005): outcome goals and
activity [output] goals. Outcome goals are the “intended consequences of a program for its
clients or society” (p. 393). Outcome goals are where the impact lies and are mostly oriented
towards the effect that the program has on people. Hence, for organizations, an outcome goal
may be expressed as “An increase on the number of students who receive a college degree.”
Activity goals, also referred to as outputs, refer to the internal workings of the grant program.
Such goals allude to the desired methods or outcomes within program processes. One might ask,
referring to an activity goal, how many people does the organization assist (in achieving the
outcome goal), or how much time is the staff spending on particular activities within the
program?
When implementing an outcome assessment it is important to differentiate between what the
end-result/impact of the grant looks like (outcomes goal) versus how it is being achieved.
Thomas (2005) suggests that when an organization sets a goal, it should implement both sides of

54
this goal. The most effective way to do this is to add a bridging goal, which links both outcomes
and activity goals. The bridging goal refers to the consequence of the program’s activity in
establishing the success of the end-result goal. Hence, a hypothetical goal to increase the number
of students receiving college degrees might look like this:
Outcome Goal: “To increase the number of minority students receiving Bachelor’s Degrees in
the metropolitan statistical area to (a certain number) by 2015.”
Activity Goal: “Employ the Access to Education Scholarship program in providing (x-number)
of need-based scholarships each year until 2015.”
Bridging Goal: “An expansion of funds in the amount of (x-dollars) via scholarships for need-
based students.”
All three types of goals, according to Thomas (2005), must have these critical three elements in
common:
• All goals must be an expression of only one concrete idea
• One goal must never overlap with another goal in its expression
• All goals must be expressed with the use of action verbs
Note: At the Fund Raising School at the Center on Philanthropy, the SMART method of
objective grant measurement is taught. Namely grants should be Simple, Measurable, Attainable,
Realistic, and include a Time element.
Measurement of Goals
There are a variety of measurement tools used for outcome evaluation. These tools relevant to
grant-making efforts include:
• Utilization of program records and statistical analysis in the creation of a quantitative
database
• Questionnaire surveys which assess the impact of the program on the client base. Hence,
funders might employ the use of questionnaires with scholarship recipients, consumers of
grantee services, or the grantee themselves. Questionnaire surveys may derive both
quantitative and qualitative data in the assessment of outcomes
• Use of qualitative analysis in conjunction with quantitative analysis tools. One method of
qualitative analysis employs the use of “in-depth interviews” of those impacted by the
grant program, including grantees and program consumers
Source: (Thomas, 2005, pp. 398-401)

55
One report on corporate philanthropy states that efficient philanthropy programs should move
beyond measurement of philanthropic outcomes in quantitative terms, by implementing long-
term strategies with well-defined objectives. It was further suggested that measurement of
qualitative outcomes should be concurrent with quantitative outcomes (Corporation to Encourage
Corporate Philanthropy, 2008).
Program Evaluation
In addition to outcome assessments, grant-making organizations may engage in program
evaluation, defined as evaluating how a grant-making program actually produces impact. Hence,
program evaluation looks at the internal workings of the program and outcome assessment looks
at the effects of the program. Thomas (2005) emphasizes the use of the utilization-focused
evaluation method of program evaluation. This evaluation method emphasizes the approach of
both quantitative and qualitative data to provide a balanced perspective of program operations.
Evaluation of the program is done through subjective and objective measures and “necessitates
multiple perspectives” (p. 403).
Who evaluates the program?
There are three options for program evaluation according to Thomas (2005):
• Internal evaluation by program staff: This type of evaluation necessitates that staff have
training on measurement techniques and unbiased input from staff management.
• External evaluation by hired consultants: The risk of using this type of evaluation
includes the lack of investment or excessive objectivity of the evaluator.
• External evaluation with substantial input by program staff: This method is the most
balanced approach. It is less costly than hiring an external evaluator to conduct the entire
assessment, provides greater impact derived from the involvement and commitment from
the staff, and provides for greater technical input. This is also the method most employed
by case study organizations.
Suggested Conditions of Effective Measurement of Outcomes:
CEOs suggested that effective measurement of outcomes includes (Committee to Encourage
Corporate Philanthropy, 2008):
Clear expectations for grantee partners from the start
Treatment of foundation or corporate giving program as just another part of the company
Integration of metrics and return-on-investment practices throughout the grant process
Understanding of the measurement of philanthropic programs by all philanthropic staff,
not just one specific person or team

56
One CEO has proffered that companies should invest in or invite nonprofit leaders to training
sessions on nonprofit management and techniques; doing so assists nonprofit leaders in
understanding how to communicate and relate to corporate grantors more effectively.
EVALUATION OF IMPACT: CASE STUDY ORGANIZATIONS
For all case study organizations, impacting the field of education is their chief interest. Examples
of impact evaluations used by these case study organizations include one-time reporting by
grantees (formative evaluations) to a strategy utilizing measurable outcomes and metrics to
assess program outcomes (summative evaluations). All grantees require at least a final report by
the recipient on the use of the grant dollars. There was a general consensus of case study
organizations that they would like to move past measuring outputs to measuring impact.
CSI requires that grantees “spell out” project goals and objectives by tying them to deliverables,
outcomes and expectations, and CSI requires both an interim and final report. This organization
conducts site visits in order to assess grantee performance.
CSII, along with their community-wide partners, have developed six objectives with
corresponding indictors to measure the effectiveness of the educational initiative. CSII requires
all organizations which receive grants to submit an end-of-grant evaluation report. Some
organizations are also asked for an interim progress report. All reporting is submitted through an
online evaluation report system. Funding priorities and measurements are shown in Figure 3.

57
FIGURE 3: CSII FUNDING PRIORITIES AND MEASURES
CSIII is chiefly interested in creating system change in the field of education. Therefore,
measurement of impact hinges on the creation of change. As seen in Figure 4, if a project or
initiative moves forward along the system change continuum, for example from conducting
research to defining the problems and solutions, then the program is successful in moving toward
their goal of system change.
CSIII uses a formula for change developed by Richard Beckhard and David Gleicher. One
theory of change holds that three factors must be present for meaningful change to take place.
• % increase in children assessed to be ready for school
Students are prepared for school through early childhood education
• % increase in students with more than 20 developmental assetsStudents are supported
inside and outside school
• % increase in students at or above proficiency in reading
• % increase in students at or above proficiency in math
• % increase in students that graduate from high school
Students succeed academically inside and
outside school
• % improvement in average ACT score of students
• % increase in graduates that enroll in college
Students enroll in some form of college
• % increase in students that are retained in college
• % increase in students that graduate from college
Students graduate from college and enter a career
• % increase in children assessed to be ready for school
• % increase in students with more than 20 developmental assets
• % increase in students at or above proficiency in reading
• % increase in students at or above proficiency in math
• % increase in students that graduate from high school
• % improvement in average ACT score of students
• % increase in graduates that enrole in college
• % increase in students that are retained in college
• % increase in students that graduate from college
Reduce disparities in educational attainment
among minority and low-income population

58
The formula is:
D x V x F > R, where
D = Dissatisfaction with how things are now
V = Vision of what is possible
F = First, concrete steps that can be taken towards the vision
If the product of these factors is greater than
R = Resistance
Then change is possible.
FIGURE 4 CSVI SYSTEM CHANGE CONTINUUM
CSIV’s primary measurement of impact relates to the overall goal of increasing the percentage of
students who obtain a postsecondary degree. A specific percentage target is set against a specific
date. To determine this simple measurement of success, CSIV has two evaluators on staff.
CSIV believes that data analysis leads to student success. Therefore, evaluators are hired to
evaluate the program from the beginning of its creation and work throughout the course of the
program to measure impact. CSIV does not independently measure the impact of all grants and
brings in third-party evaluators as necessary.
CSV is currently working towards developing a measurement system in assessing the impact of
program goals. A new strategic initiative is being used as a launch into the evaluation process.
The new initiative includes metrics of student success and compares these students to a control
group. The success and lessons learned from this evaluation system will be applied in other
granting areas.
CSVI has hired a director of research to perform high-quality academic and practice-based
research; to provide support in the development, monitoring, and evaluation of grants; and to
•Sustain Policy Change Among Stakeholders
•Sustain Policy Change Acorss Community / State
Sustainability
•Achieve Interim Policy Change
•Propose Sustainable Policy Change
•Achieve Sustainable Policy Change
Policy Change
•Raise Awareness/ Advocate Solutions
•Build Coalitions and Public Will
Advocacy
•Conduct Research
•Define Problems/ Solutions
•Develop Framework for Change
Strategy Development

59
gather and manage critical data. Because this organization is in a transition phase, they have also
hired an outside evaluator to help them design program objectives. These program objectives
will be used to match grants with program objectives.
VISIBILITY
VISIBILITY: LITERATURE REVIEW
Research has found various external benefits to a more visible corporate philanthropy program
including customer loyalty and retention as well as assistance in helping companies entering new
markets. Furthermore, a visible philanthropy program gives executives greater opportunities
within the community setting (Committee to Encourage Corporate Philanthropy, 2006).
Executives attending the Committee to Encourage Corporate Philanthropy’s (CECP) Board of
Boards meeting (2008) contend that transparency in corporate philanthropy is becoming the
norm. Companies should seek to walk that fine line between quietly disseminating grants and
creating a dialog with the community about corporate philanthropy. There was general consensus
amongst the attendees that all stakeholders should be aware of a company’s philanthropic
endeavors, but such public displays should be monitored. Key recommendations from CEOs
include:
Reach out to nonprofit leaders in creating a dialog regarding nonprofit’s needs
Consider allowing nonprofit leaders to assist in allocating grants where they are needed
most
Create a brand that assists the public in tying together the philanthropy with the company
Initiate strong “community investment programs” first, allowing positive media attention
to follow
Allow the CEO to be the leader in communicating the vision of the company’s
philanthropy both internally and externally
Corporate members of CECP (2006), reporting on the visibility efforts of their organization,
indicated :
Over two-thirds use public relation strategies as a communication device to promote their
philanthropy
One-third market and place adds to promote their philanthropic program
McAlister and Ferrell (2002) contend, however, that cause-related marketing (CRM) is not
strategic philanthropy, but a marketing tool. CRM should be utilized for short term purposes

60
rather than long term. The major problem with CRM, they found, was that 90 percent of the
public were unable to identify the “cause” with the company and it was deemed by the public as
a way to increase sales rather than a company being philanthropically-minded (McAlister &
Ferrell, 2002).
To overcome the problems with cause related marketing, McAlister and Ferrell (2002) provide
these key considerations:
Philanthropy must be linked with a company’s vision and mission
The organization must understand stakeholders’ expectations
Evaluation must be conducted to link philanthropic endeavors and stakeholders’
understanding of effectiveness
There must be a strong link between vision and outcomes
Signature programs/campaigns are gaining in popularity as a vehicle for heightening visibility.
A signature program is defined as: A significant philanthropic campaign that is advanced as a
central focus of a company’s philanthropy (Committee to Encourage Corporate Philanthropy,
2006, p. 35). Fifty-five percent of companies’ giving departments have at least one signature
program or campaign. Of the respondents who reported that they did not have a signature
program or campaign, just over half were in the decision-making or implementation phase of
doing so. The benefits of initiating a signature program include: greater efficiency overall since
considerable dollars are focused into one project; greater linkage to the corporation’s mission
and aims, which provides for greater leverage and impact; and greater recognition by
policymakers, stakeholders, and potential, high-quality employees. One problem associated with
initiating a signature program is budgeting. Conducting a quality signature program that is
reliable across locations can be quite expensive. Moreover, nonprofit partners often do not have
the capabilities to promote corporate sponsors and corporations, sometimes limiting publicity
and communication (Committee to Encourage Corporate Philanthropy, 2006).
VISIBILITY: CASE STUDY ORGANIZATIONS
Visibility was widely accepted as a necessity as a funder. A few case study organizations
reported that in the past they were not good at promoting themselves, in part because they felt
that either their work should stand for itself or because they felt no need for recognition.
However, each case study organization now acknowledges that visibility means promotion of
their organization’s mission. Many felt that to be effective they have to be known as doing this
work. Otherwise, they may miss out on opportunities, and if they are not well known they have
less clout, especially in the field of education reform. CSVI acknowledged that you have to be
perceived as having a brand that others want to identify with.
Visibility for these case study organizations often means press releases either by the funder or by
the grantee about the initiatives they are supporting. A few have created annual reports to

61
discuss their grant-making. Especially in the case of strategic initiatives, a few funders have
invested time and energy into branding the initiative so that it can have a greater influence and
impact.
CSI does not shy away from publicity. This organization reported having an internal audit of
their programs a few years ago and that they received no push-back from colleges and
universities regarding their efforts to heighten visibility. In fact, these institutions saw CSI’s
grant making as investment in the student population. CSI did report some pushback, however,
in efforts to seek publicity in a policy space. Ultimately, they were able to communicate to
policymakers that this investment (visibility) was salient to their mission and implored
policymakers, who wanted to make cuts to their guarantor business, that doing so would threaten
the philanthropy program.
GRANTS MANAGEMENT
GRANTS MANAGEMENT: LITERATURE REVIEW
Leadership
Effective grants management begins with executive leadership. Nearly three-fourths or
companies indicated that there is significant “senior executive engagement” in philanthropy
programs (Committee to Encourage Corporate Philanthropy, 2006). In fact, 63 percent of the
most “Efficient Philanthropists” utilize the CEO as the public face of their philanthropic
program. CEOs are not necessarily leading the effort, but are actively involved in all aspects
(McKinsey Quarterly, 2008). In a gathering of leading corporate funders, CEOs also reported the
need to involve Boards of Directors and other high level executives. Doing so not only sets a
positive example for the employees, but also translates into a positive corporate image to the
community (Committee to Encourage Corporate Philanthropy, 2008).
Staff
Research revealed three dimensions that nonprofits report are key for effective grants
management. The first is the quality of the interaction the nonprofit receives from staff. This
includes their fairness, responsiveness, and approachability. The second dimension includes the
clarity of the funder’s communication. This includes having clear goals and strategy with a
consistent articulation of objectives. Finally nonprofits value the expertise and external
orientation of funders. In particular they appreciate program staff that understand the field and

62
constituents that the foundation is trying to reach. This helps nonprofits advance knowledge and
affect public policy (Boldue, Buchanan, & Huang, 2004).
When it comes to staffing, there is a direct relationship between the size of the contribution
budget and the number of staff. With corporate philanthropy, however, many high contributing
companies are responsible for a vastly greater dollar amount per FTE than from smaller
companies (Committee to Encourage Corporate Philanthropy, 2008). Just over half of all giving
departments employ no more than 5 people and 39 percent employ more than 10 staff members.
Of significance, those offices with the least number of employees will typically run either a
signature program that dominates the nature of the philanthropy program or a “broader grant-
making program that engaged employees, sr. management and communities…” (CECP, 2008, p.
31). If a company were to engage in more than one of these initiatives, more than five employees
are usually involved. The report noted that a well-run national program is possible with just a
few staff. Of important note, some companies engage employees and others on a volunteer basis
to help with national programs. Additionally, companies utilize employees or department from
outside of the philanthropy department itself (Committee to Encourage Corporate Philanthropy,
2006).
Grant size and type of grant
There is some evidence that grant size and type of grant is related to impact. Recipients of
operating support from foundations reported slightly more impact than recipients of program
grants. However, the research suggests that operating support, by itself, doesn’t seem to impact a
nonprofit. Rather the combination of longer-term (three to five year) general operating grants
were reported as having the greatest impact (Huang, Phil, & and Buteau, 2007).
According to Grantmakers for Education (Grantmakers for Education, 2008)
31 percent made an average grant of $50,000 or less
28 percent made an average grant of $250,000 or more, with 50 percent of these grants
totaling more than $500,000
24 percent reported a grant making budget between $10 million to $50 million
Budgeting and Management Costs
The typical grant-making budget for a foundation is based on a three to five year rolling average
of the foundation’s assets, granting out a predetermined percentage of the corpus, usually around
5 percent after administrative costs are subtracted. Budgeting, however, is also based on other
factors including the overall strategy of the foundation. Some foundations, for example, intend
to spend all their assets in a given time period and, therefore, grant out much more than 5 percent
each year. For corporations, budgeting is a little different. It is commonly held that a company’s

63
philanthropic budget lags behind the corporation’s financial performance by one year. However,
some companies forecast profits, others adjust throughout the year, and others set a budget based
on historical grant-making (Committee to Encourage Corporate Philanthropy, 2008).
Corporations gave on average 0.8 percent of pretax profits to charity in 2007. Historically, this
percentage has fluctuated from 0.7 percent to just under 2 percent over the last 40 years (Center
on Philanthropy at Indiana University, 2008). There is no research related to the best way to
determine a philanthropic contribution’s budget.
Estimating the amount of funds corporate grant makers spend on administrating their
philanthropic program is challenging for a couple of reasons. First, many funders utilize
resources outside the grant-making arm of the corporation, for example, human resources,
information technology, and communications. In addition, many include employee councils that
review proposals, or at a minimum, time from senior leadership approving grants. With this in
mind, the typical administrative cost is 6.1 percent of total giving (Committee to Encourage
Corporate Philanthropy, 2008).
GRANTS MANAGEMENT: CASE STUDY ORGANIZATIONS
CSI has one cycle per year where grants are due in March and organizations are notified at the
end of June. The award period is for one year only, usually August to August. CSI stipulates that
if an organization requests funding for the second year for the same project, CSI is limited to
only providing 25 percent of the total project budget. CSI has the following grant-making cycle:
Program officers do an initial review to see if grants meet their basic guidelines
A volunteer committee of approximately 15 staff members (management or leadership
level) read and scored the proposals
There are two reviewers for each proposal
The scores are summed and the highest scores receive funding
All recommended proposals are reviewed by staff and are then submitted to the board for
final approval
CSII’s granting cycle has three components. First CSII requires grantees to submit a pre-
application which is a short description of the organization and program. Pre-applications are
accepted on a rolling basis. Organizations are notified within 30 days whether they are invited to
submit a full proposal. Full proposals are reviewed twice a year (March and September). CSII
uses topic-specific outside advisory committees to rate their proposals. Ratings are:
recommended, recommended with reservations, and not recommended. With assistance from the
staff, recommended proposals are taken to the board for final approval. The only exception is for
grants less than $20,000 for which staff has approval authority. Proposals submitted in March are
notified in June, proposals submitted in September are notified by December.

64
CSIII’s grant-making cycle is less structured in part because they tend to create and manage
many of their own initiatives. Typically, CSIII convenes a high level task force to look for
opportunities. They then make grants, provide technical systems, and evaluate the process. If the
model is successful, they advocate for it, including providing publications, venues, and forums to
disseminate the findings and get the attention of legislators so they will support the change.
CSIV has a two step process. First they require a letter of inquiry and then accept a full proposal.
A grant coordinator reviews all letters of inquiry; if they meet the basic guidelines and
mission of the organization, they are routed to a program officer
Groups of four to six program officers review all letters of inquiry and request full
proposals
Two program officers negotiate the terms of the full proposals
Grants are accepted and reviewed monthly, January through October
Cabinet level staff is given the authority to approve grants up to $1 million
One interviewee for CSIV acknowledged that an obvious drawback to their current monthly
system is they do not necessarily have the ability to compare proposals to each other. However,
CSIV does initiate RFPs for many projects, including providing funding for re-granting to make
their process more competitive and to ensure they are making the best possible investments.
For a specific education initiative, CSV began by creating an RFP, and then holding a training
session for about 30 educational institutions. They convened a group of 8 community evaluators
who were content knowledge experts to make decisions about their “big” awards. Similar to
CSII, they also make smaller technical assistance grants to nonprofits that staff has the authority
to approve.
There are three ways in which CSVI makes grants.
The first way is through invited proposals. CSVI seeks out opportunities and invites
organizations to submit a proposal for funding considerations.
The second way is through RFPs created and managed by CSVI for their strategic
initiatives. An example is a program for expanding the variety and number of ways
students can attend a postsecondary school.
The third way is an RFP process which is managed by a third party intermediary who has
content knowledge expertise and local connections to direct service providers. The
intermediary distributes the RFP, forms a review committee, and makes funding
recommendations to CSVI. CSVI, however, makes final funding decisions.
65
Invited proposal have no set due date and each RFP has a different deadline. Another interesting
aspect of CSVI’s grant-making process is an information session for grantees to explain the
funding initiatives, its goals, and the organization’s expectations. They try to discourage
unsolicited proposals. Grants over $300,000 must get board approval, but the remaining grants,
under $300,000 may be approved by their CEO. Grants are made quarterly.
Staff size varied widely between the funders in part because of their organizational structure. In
general, case study organizations had a program officer for every $4 to $5 million in grant
making. CSIV’s ratio was slightly higher, one program officer for every $7 to $8 million,
however CSIV’s average grant size was also larger, making their overall portfolios similar.
Program officers at CSII maintained about 58 grants in their portfolio of current grantees. Staff
sizes at these organizations were often much larger, however, than just program officers. Staff
also included senior staff, assistants, investment and finance staff, an information technology
department or person, and external affairs or communications personnel. Further, a few case
study organizations had researchers, evaluators, and policy specialists on staff. Two of the
organizations maintained a staff of between 40 and 50 people.
The average grant size for strategic initiatives at case study organizations was around $100,000.
The exception to this was CSIV whose asset base is considerably larger. CSIV grants out $50
million a year and their median grant was $250,000, although they make a considerable number
of larger grants and on occasion make grants to intermediaries to then re-grant to direct service
providers. Both CSII and CSV also provide smaller grants, less than $20,000, to nonprofits for
capacity building efforts.

66
CONCLUSION / ISSUES TO CONSIDER
Creating impact begins with thinking strategically. McAlister and Ferrell (2002) define strategic
philanthropy as, “the synergistic use of organizational core competencies and resources to
address key stakeholders’ interests and to achieve both organizational and social benefits” (p.
690).
I. OBTAINING A CORE IDENTITY
To be strategic, the Committee to Encourage Corporate Philanthropy (2006) says companies
need to think strategically. All philanthropic efforts should derive from and point to the central
philanthropic theme – a theme which defines its core identity. Organizational identity influences
the language of the funder, the strategy, and the grant-making process. The challenge for
Education grantmakers is to carefully define the organization in the context of higher-education
grant making.
Organizational identity may change according to each context, or it may be singular across all
contexts. Education grantmakers may decide to be a proactive funder in one environment, to
leverage funding resources in another environment, or to be an innovator in creating novel grant-
making programs in yet another environment. Each of the strategies suggested below will move
Education grantmakers toward a more proactive approach to grant making.
II. DEFINING STAKEHOLDERS
In conducting strategic, rather than traditional philanthropy, companies are aligning their
charitable programs to meet the tangible needs of identified stakeholders. Education
grantmakers’ stakeholders include students and parents; institutions of higher education and
financial aid offices; federal government; state higher-education commissions; communities in
which the organization conducts business; employees; and the communities in which employees
live and work.
Achieving impact means that funders will need to focus on a specific problem within higher
education. Research has shown that the foundations that have the greatest social impact are those
that pick a specific problem, along with a specific stakeholder, and utilize all resources to correct
that specific problem (Porter & Kramer, Philanthropy's New Agenda: Creating Value, 1999).
A remaining issue is whether low-income student stakeholders should be further defined, for
example by racial and/or ethnic disparities and academic-ability levels. The more defined the
stakeholder, the more focused the strategy and the easier will be to evaluate the impact of the
grant-making program.
III. CREATING STRATEGY

67
Once stakeholders are defined, a funder can begin to understand their tangible needs and design a
philanthropic strategy that best meets those needs. This can include setting specific, achievable
goals; leveraging resources through collaboration; utilizing content-knowledge experts;
influencing policy; and/or working towards changing education systems to better help key
stakeholders achieve success. Strategy can also take the form of strategic initiatives, banded for
heightened visibility, with defined objectives for achieving measurable impact.
Suggested Strategies
The Center on Philanthropy suggests a few models which will help grantmakers in higher
education further refine their strategy. These models are not necessarily mutually exclusive:
Outside advisory council: The advisory council made up of content-knowledge experts
will help create overall objectives or goals for the defined stakeholders. The council’s
role is to bring specialized knowledge about the tangible needs of stakeholders to help
the organization design a program that can achieve heightened impact.
Community-led education efforts: Community-led efforts often have stakeholder buy-in,
cooperation, leveraged resources, content-knowledge experts, and data which will lead to
greater impact on the mission. Within these efforts, grantmakers will be better prepared
to hone in on their niche.
Scholarships: The choice to continue funding scholarships should come from a decision
to reach a specific type of student in which financial barriers are paramount and where
the literature has shown that increasing financial aid improves enrollment and/or
retention. When constructing a strategic scholarship program, one option is to model the
program after the success of recent Scholars program. This program awards scholarships
to students in their junior year of high school; provides high dollar amounts to support
the breadth of tuition costs; and provides wrap-around services, such as mentoring,
tutoring, and access to internships.
Intermediaries as content-knowledge experts: Intermediaries can successfully be used
to increase the impact and reach of philanthropic dollars because of their enhanced
knowledge of the mission subject and their relationships with other funders. Some
methods include:
Being a high-level partner/funder which helps these intermediaries craft and fund
their own strategy, which is often a community-level initiative, or
Funding to an intermediary to manage a strategic initiative. This could include re-
granting funds to direct-service providers.
Strategic Initiatives: Strategic initiatives are measurable and are often replicable and/or
scalable so that their findings can be disseminated to others who can use them. Strategic
initiatives are often a set of grants (can use an RFP) which have a common set of
objectives and are managed by one program officer. Those objectives become the basis

68
for measuring the impact of the initiative. Many funders use outside advisory councils or
intermediaries to help craft the initiatives.
IV. EVALUATING IMPACT
No matter which strategy is used, grantmakers desire to understand the impact of the
philanthropic program. The results should cycle back to an evaluation of the organization’s
overall strategy and then further refine sub-strategies.
Formative Evaluation – measuring outputs: The measurement of impact can be the summation
of grantee outputs or activities, such as the number of students serviced or the number of classes
taught. Output measures are the least costly and can be managed in-house. However, outputs
alone are incapable of answering questions about the nature of the impact, but will offers due
diligence to ensure that grantees’ performance matches the contracted grant proposal.
Summative Evaluations -measuring outcomes: The measurement of outcomes differs by
timeframe and sophistication. The level of evaluation stems from organizational resources and
the nature of the overall mission. The benefit of long-term studies conducted by outside
evaluators is that it controls for contextual factors and provides a more thorough assessment of
impact. However, such studies are expensive to implement and are lengthy processes. We
suggest a focus on short-term outcomes with an occasional evaluation of intermediate outcomes.
Short-term outcomes – Focuses on new knowledge, increased skills or awareness of
issues
Intermediate outcomes – Focuses on the modified behaviors (of the people served)
Long-term outcomes – Focuses on overall improved conditions or altered states
We suggest that evaluation funding be allocated either within large grants/initiatives, so grantees
can evaluate their own outcomes, or organizations can create an evaluation budget by hiring
outside evaluators to review specific, large grants or initiatives.
V. VISIBILITY
Visibility can be a strategic tool used by grant makers to achieve greater impact or mission
fulfillment. The main issue for education grantmakers is whether or not to promote the
philanthropic program visibly. Further discussions on this topic should only come once the
strategy and objectives of the program are clearly delineated. From this point, the level of
visibility, including the use of a strategic initiative or branding efforts, can be evaluated.
VI. IMPROVING OPERATIONS
Organizations must implement a solid management framework under which all program
processes are carefully implemented, controlled, and evaluated. This process should have strong

69
leadership, be responsive grantees and potential grantees, provide clear and consistent
articulation of the objectives of the organization, and allow program officers to excel by
specializing.
Our suggestions, which are not mutually exclusive, include:
Define the grant cycle to include deadlines at a specified frequency
o Option 1: Quarterly or biannual deadlines. This can include a pre-application or
letter of inquiry (LOI) stage. Quarterly or biannual deadline gives funders a
granting calendar which allows program officers to schedule time after the end of
one cycle and beginning of the other to conduct site visits, develop relationships,
and strategize.
o Option 2: Creating a Request for Proposals (RFP) process managed by a program
officer with specific objectives. RFPs can easily become a strategic initiative if
the cluster of grants awarded is focused on accomplishing a common goal.
Organizations can create multiple RFPs to meet the needs of multiple
stakeholders. This allows program officers to specialize and become content
knowledge experts and make evaluation of the organization’s overall impact
easier.
Build in flexibility with either option by considering the creation of a smaller, capacity-
building fund. This would allow funders to maintain its responsiveness to nonprofits and
relationships within their local nonprofit sector.
Communicate the revised strategy and objectives consistently and thoroughly with all
grantees and potential grantees through the website, letters, meetings, and so forth. This
also includes updating third-party information, such as found in grant databases.
Utilize employee councils as reviewers to create efficiencies and build internal
knowledge and satisfaction with an organization’s philanthropic program.
Consider having fewer, but larger grants, including multi-year grants. This will reduce
the overall number of grants in a program officer’s portfolio allowing for more time to
build relationships, conduct due diligence, and strategize. Nonprofit also report larger,
multi-year grants have a greater impact on their operations because these grants are built
into longer term programming and budgeting.

70
BIBLIOGRAPHY
Advisory Committee on Student Financial Assistance. (2001). Access denied: Restoring the
nation's commitment ot equal educaitonal opportunities. Washington D.C.: U.S. Department of
Education.
Aylward, R. (2002). Managing Employee Programs. Washington D.C.: Council on Foundations.
Backer, T. (1999). Innovation in Context: New Foundation Approaches to Evaluation,
Collaboration, and Best Practices. A study conducted for the John S. and James L. Knight
Foundation, Human Interaction Research Institute.
Baird, K. (2006). Access to College: The Role of Tuition, Financial Aid, Scholastic Preparation
and College Supply in Public College Enrollments. NASFAA Journal of Student Financial Aid ,
36 (3), 16-38.
Boldue, K., Buchanan, P., & Huang, J. (2004). Listening to Grantees. Cambridge, MA: The
Center for Effective Philanthropy.
Burlingame, D., & Smith, C. (1999, Winter). New Directions in Philanthropic Fundraising.
Center of Urban Education, University of Cincinnati. (2006). Student's Roadmap to Success:
Critical Benchmarks and Transitions Years. Cincinnati: University of Cincinnati.
Center on Philanthropy at Indiana University. (2008). Giving USA 2008. Giving USA
Foundation.
College Board. (2008). Trends in College Pricing . New York: College Board.
Committee to Encourage Corporate Philanthropy. (2003). CECP Perspectives. CECP.
Committee to Encourage Corporate Philanthropy. (2008). Board of Boards: The CEO's
Challenge, Leading the Company, Shaping Society. Committee to Encourage Corporate
Philanthropy.
Committee to Encourage Corporate Philanthropy. (2008). Business's Social Contract: Insights
from CEOs on Achieving Efficient Philanthropy. CECP.
Committee to Encourage Corporate Philanthropy. (2006). Exploring Corporate Philanthropy: A
Member Survey. Committee to Encourage Corporate Philanthropy.
Committee to Encourage Corporate Philanthropy. (2008). Giving in Numbers. Committee to
Encourage Corporate Philanthropy.

71
Diplomas Count 2008: School to College Can State p-16 Councils Ease the Transition? (2008,
June 5). Education Week .
Dynaski, S. (2000). Hope for Whom: Financial Aid for Middle Class and its impact on College
Attendance. Working Paper No. W7756.
Editorial Projects in Education. (2008, June 5). Diplomas Count 2008. Education Week .
Education Week. (2008, 5 June). Editorial Projects in Education. Retrieved March 26, 2009,
from EducationWeek.org: http://www.edweek.org/ew/articles/2008/06/05/40overview.h27.html
Galaskiewicz, J., & Colman, M. S. (2006). Collaboration between Corporations and Nonprofit
Organizations. In W. Powell, & R. Steinberg (Eds.), The Non-Profit Sector: A Research
Handbook (2nd ed., pp. 180-204). New Haven and London: Yale University Press.
Grantmakers for Education. (2008). Benchmarking 2008: Trends in Education Philanthropy.
Grantmakers for Education.
Grantmakers for Education. (2009, March 26). edfunders.org. Retrieved March 26, 2009, from
Grantmakers for Education: http://www.edfunders.org/index.asp
Green, J. P., & Winters, M. A. (2005). Pulbic High School Graduation and College-Readiness
Rates 1991-2002. New York: Center for Civic Innovation at the Manhattan Institute.
Heller, D. E. (2003). Merit Aid and College Access. Symposium on the Consequences of Merit-
Based Student Aid. University Park, PA: Wisconsion Center for the Advancement of
Postsecondary Education.
Heller, D. E. (1997). Student price response in higher education: An update to Leslie and
Brinkman. Journal of Higher Education , 624-659.
Horn, L., & Nunez, A. M. (2000). Mapping the road to college: First-generation students' math
track, planning strategies and context of support. Washington, DC: U.S. Department of
Education.
Horn, L., Chen, X., & Chapman, C. (2003). Getting ready to pay for college: What students and
their parents know about the cost of college tuition and what they are doing to find out.
Washington, D.C.: U.S. Department of Education, National Center for Education Statistics.
Huang, J., Phil, B., & and Buteau, E. (2007). In Search of Impact. Cambridge, MA: The Center
for Effective Philanthropy.
Hunt Jr., J., & Tierney, T. (2006). American Higher Education: How does it Measure Up for the
21st Century? San Jose California: National Center for Public Policy and Higher Education.

72
Institute for Higher Education Policy and Excelencia in Education. (2008). Student Aversion to
Borrowing: Who Borrows and Who Doesn't. Institute for Higher Education Policy and
Excelencia in Education. Institute for Higher Education Policy and Excelencia in Education.
Jobs for the Future. (2008). What It Takes to Succeed in the 21st Century - and How New
Englanders Are Faring. Quincy, MA: Nellie Mae Education Foundation.
Kinkade, S., Macy, K., Nieker, M., & Rochlin, S. (2006). Alliance for Youth: What Works in
CSR Partnerships. International Youth Foundation. IYF.
Lemay, T. (2004). Metrics for the Masses: Making Community Investments More Strategic. Shell
Canada Limited , Community Investment.
Leslie, L., & Brinkman, P. (1988). The economic value of higher education. Washington, D.C.:
American Council on Education.
Long, B. (2009, February 13). Preparation, Access and Retention in Higher Education. (Staff,
Interviewer)
Long, B. T., & Riley, E. (2007). Financial Aid: A Broken Bridge to College Access? Harvard
Educational Review , 39-63.
Marin, P. (2002). Merit scholarships and the outlook for equal opportunity in higher education.
In H. D.E., & P. Marin, Who should we help? The negative social consequences of merit
scholarships (pp. 109-114). Cambridge, MA: The Civil Rights Project at Harvard University.
Massachusetts Business Roundtable and the Philanthropic Initiative, Inc. (2000). Primer for
Strategic Philanthropy. Paper, Massachusetts Business Roundtable and the Philanthropic
Initiative, Inc., Boston.
McAlister, D. T., & Ferrell, L. (2002). The Role of Strategic Philanthropy in Marketing Strategy.
European Journal of Marketing , 689-705.
McKinsey Quarterly. (2008). Business' Social Contract: Capturing the Corproate Philanthropy
Opportunity. McKinsey & Company.
MTV Press. (2007). Ending the Silent Epidemic: A Blueprint to Address America's High School
Dropout Crisis. Washington D.C.: Bill & Melinda Gates Foundation.
National Center for Education Statistics. (2009). Digest of Education Statistics: 2008.
Washington D.C.: National Center for Education Statistics .
National Center for Public Policy and Higher Education. (2008). Measuring Up 2008: The
National Report Card on Higher Education. San Jose, CA: The National Center for Public
Policy and Higher Education.

73
NCES. (2005). 2003-04 National Postsecondary Student Aid Study (NPSAS) Undergraduate
Financial Aid Estimates for 2003-04 by Type of Institution. U.S. Department of Education.
Ness, E., & Tucker, R. (2008). Eligibility Effects on College Access: Under-represented Student
Perceptions on Tennessee's Merit Aid Program. Res Higher Education , 569-588.
Peterson, K. (2004). Employee Matching Gifts - A Blessing or a Curse? RSG Perspectives on
Corporate Philanthropy, Foundation Strategy Group.
Points of Light Foundation. (2006). How the Best Employee Volunteer Programs Structure
Themselves: Benchmarks of Excellence Series. Washington D.C.: Points of Light Foundation.
Population Reference Bureau. (2009). Population Statistics. Retrieved January 23, 2009, from
www.prb.org:
http://www.prb.org/Datafinder/Geography/MultiCompare.aspx/variables=654,404,396,398,394&
regions=72
Porter, M., & Kramer, M. (1999, November - December). Philanthropy's New Agenda: Creating
Value. Harvard Business Review , pp. 119-130.
Porter, M., & Kramer, M. (2002, December). The Competitive Advantage of Corporate
Philanthropy. Harvard Business Review , 5-16.
Porter, M., & Kramer, M. (2006, December). The Link Between Competitive Advantage and
Corporate Social Responsibility. Harvard Business Review .
Rochlin, S. (2000). Making the Business Care: Determining the Value of Corporate Community
Involvment. Boston, MA: Boston College Center for corproate Citizenship.
Scholarship America. (2009). Retrieved March 27, 2009, from www.scholarshipamerica.org:
www.scholarshipamerica.org
Schooler, D. (1996). Philanthropy's Commitment to Creating Civil Communities: Grants,
Investments, Programs, and Leadership from Foundations. Indiana University, Center on
Philanthropy, Indianapolis, IN.
Sidle. (1999). The freshman year experience: Student retention and student success. NASPA
Journal, 288.
Smith, C. (1994, May-June). The New Corporate Philanthropy. Harvard Business Review , 105-
118.
Snyder, T., Dillow, S., & and Hoffman, C. (2008). Digest of Education Statistics 2007.
Washington, D.C.: National Center for Education Statistics, Institute of Education Sciences, U.S.
Department of Education.

74
St. John, E. P. (1990). Price response in enrollment decisions: An analysis of high school and
beyond sophomore cohort. Research in Higher Education , 161-176.
Students 'Swirl' Their Way to Four-Year Degrees. (2005). Recruitment & Retention in Higher
Education , 3.
TGF. (2009). Retrieved March 27, 2009, from Thurgood Marshall Fund.org:
http://www.thurgoodmarshallfund.org/index.php?action=faq
The Bill & Melinda Gates Foundation. (2008). College Ready. Seattle, WA: The Bill & Melinda
Gates Foundation.
The Consortium on Chicago School Research. (2007). Freshman Year: The Make-it or Break-it
Year. Chicago: The Consortium on Chicago School Research.
The National Center for Public Policy and Higher Education. (2008). Measuring Up 2008: The
National Report Card on Higher Education. San Jose, CA: The National Center for Public
Policy and Higher Education.
The Pell Institute for the Study of Opportunity in Higher Education. (2006). Expanding Access
and Opportunity. Washington, D.C.: Bill & Melinda Gates Foundation and the College Success
Foundation.
Thomas, J. (2005). Outcome Assessment and Program Evaluation . In R. H. Associates, The
Jossey-Bass Handbook of Nonprofit Leadership & Management (pp. 391-416). San Francisco:
Jossey-Bass.
UNCF. (2009). Retrieved March 27, 2009, from www.UNCF.org:
http://www.uncf.org/aboutus/mission.asp
United States Census Bureau. (2007). Current Population Survey. Retrieved January 2009, from
www.census.gov: http://www.census.gov/hhes/www/income/histinc/h17.html
Vargas, J. (2004). College Knowledge: Addressing Information Barriers to College. Boston,
MA: The Education Resources Institute (TERI).
Walker Information. (2001). National Benchmark Study: Measuring the Business Value of
Corporate Philanthropy. Washington, D.C.: Council on Foundations.
Williford, A., & Chapman, L. a. (2001). The university experience course: A longitudinal study
of student performance, retention, and graduation. Journal College Sudent Retention , 327-340.
Young, D. (2001). Organizational Identity in Nonprofit Organizations: Strategic and Structural
Implications. Nonprofit Management and Leadership , 12 (2), 139-157.

75
Young, D., & Burlingame, D. (1996). Paradigm Lost: Research toward a new Understanding of
Corporate Philanthropy. In D. &. Burlingame, Philanthropy at the Crossroads (pp. 158-176).
Indianapolis: Indiana University Press.