
Best Practices
22
PRESENTATION FOR HARVEY MUDD ALUMNI BEST PRACTICES FROM INSIDE A PROFESSIONAL FINANCIAL ADVISORY FIRM March 23, 2012 Proud Bird Restaurant
-
Upload
ahmad-mostafa -
Category
Documents
-
view
10 -
download
0
description
practices
Transcript of Best Practices

PRESENTATION FOR HARVEY MUDD ALUMNI
BEST PRACTICES FROM INSIDE A PROFESSIONAL FINANCIAL ADVISORY FIRM March 23, 2012 Proud Bird Restaurant

Potpourri of Topics
• Estate planning • Umbrella liability • Education planning • Mortgage payoff • Charitable Giving
• Advisory landscape • Tax loss harvesting • Retirement
spending • Investing • Your questions

Estate Planning
• This is first because it’s important • Under current federal law couples can pass
on $10M without paying estate tax • So why do you need to worry about this? • It’s about control of assets, not tax savings • Probate is time consuming and expensive
– California probate is running 18 months – Statutory fee on $1M assets is $23,000

Estate Planning (cont.)
• Standard package includes – Revocable living trust – Pour-over wills – Healthcare powers of attorney – Financial powers of attorney
• Guardians for children are listed in wills • Selecting trustees/executors and ultimate
beneficiaries often proves difficult • Cost: $1,500 to $3,500 (non-blended
family)

Umbrella Liability Insurance
• A question about umbrella liability insurance appears on the Certified Financial PlannerTM certification test every year
• Is in addition to your homeowners and auto policies (i.e., an umbrella over)
• Provides additional coverage against large claims and lawsuits
• Very affordable – $1M coverage about $200

Education Planning • 529 college savings
plans recommended – Contributions grow tax-
free if used for college – Opportunity to front-
load with five year contribution
– Each state runs a plan – Shop based on
investment choices • Be careful with
custodial (UTMA) accounts

Mortgage Payoff
• Should I pay off my home mortgage loan? • The portfolio leverage answer:
– Assume taxable (i.e., accessible) investment portfolio earning 8% per year
– Assume interest rate 4.5%; tax bracket 37% combined (28% fed + 9% CA)
– After-tax cost of loan = (4.5%)(1-.37) = 2.8% – Return difference: 8% - 2.8% = 5.2%
• Limited by income available for debt service

Charitable Giving • Donor-advised funds
can be a good option • Income tax deduction
in year of contribution • Make donations from
the fund any time • Assets leave your
estate but you retain control
• Used to reduce tax in high income years

Advisory Landscape
• Proliferation of credentials – CFP, CFA, CIMA, CPA, EA, ChFC, CLU, CMFC, PFS,
RIA, AAMS, CDFA, etc. • Growth in client-centered, advice-driven
model versus traditional product sales model – Independent firms vs. Wall Street firms
• Fiduciary standards debate

• Advisors are employees
• Products and services limited, often proprietary
• Sales culture, product-centric business model
• Advisors/reps are NASD Series 7 licensed to sell financial products
• Paid by commission and fees which can create conflicts of interest
• Advisors not fiduciaries (not obligated to act in client’s best interest)
Fully Affiliated Supervised Independent Fully Independent
Brokerage Firm: (e.g. Smith Barney, Merrill Lynch, UBS, Morgan Stanley)
Independent Broker/Dealer (IBD): (e.g. LPL, Royal Alliance)
• Advisors are independent contractors
• Products and services limited to IBD offerings
• Mixed culture, products and advice
• Advisors/reps are NASD Series 7 licensed to sell financial products
• Paid by commission and fees which can create conflicts of interest
• Advisors not fiduciaries (not obligated to act in client’s best interest)
• Advisors are self-employed/partners
• Broadest product access and most sophisticated service offerings
• Client-centered, advice driven business model
• Advisors are NASD Series 65/66 licensed to provide investment advice
• Advice for fee compensation reduces conflicts of interest
• Fiduciaries by law, required to act in client’s best interest
Registered Investment Advisor (RIA): (e.g. Parkworth Wealth Mgmt., Inc.)

NAPFA • About 600,000 people are called financial advisor in the U.S.
– Includes brokerage reps, broker/dealer reps, bank reps and insurance reps
– Most are sales people; conflicts abound
• Of those, about 65,000 are CFP® practitioners – Certified Financial PlannerTM certificants have completed 6+ graduate
level courses and practicum, passed a two-day exam, have minimum 3 years’ experience and complete 30 hours of continuing education every 2 years
– Considered the most highly qualified financial advisors
• Of those, about 1,300 are NAPFA registered – The National Association of Personal Financial Advisors
(www.napfa.org) is known for advocacy of fee-only compensation structures to reduce conflicts of interest, and tough membership requirements stressing ethics and competence
– NAPFA registered advisors must be CFP practitioners, submit work samples (e.g., financial plan) to peer review, sign a fiduciary oath and complete 60 hours continuing education across 7 subject areas every 2 years

• High transparency • Low fees • ERISA 3(38) fiduciary advisors • Independent registered investment
advisory firm managed plans • Plan sponsor/participant driven
• Non-fiduciary consultants • Insurance company and large
brokerage firm managed plans • Lack of transparency • Unnecessarily high fees • Conflicts of interest
Changing 401(k) Marketplace

Tax Loss Harvesting • Technique to reduce and defer capital gains taxes
generated by taxable portfolios • Involves selling an investment at a loss, buying
back a similar investment and holding for 30 days, then selling that investment and buying back the original investment
• Result is a capital loss that can be used to offset capital gains in that year or carried forward to use in future years

Retirement Spending • For the first time in human
history, mass population is scheduled to be retired nearly as long as they worked
• Retirement portfolios will need to keep working hard
• Sustainable withdrawal rates while maintaining principal are in 3%-5% range
• A glimpse at the future: Stanford and Yale endowments are pioneering spending rules using a “low-pass filter” to smooth spending
Stanford Spending Rule:
[w1 * (s * (1+i))] + [w2 * (r * m)]
w1 = 60% w2 = 40% s = last year’s spending i = inflation r = policy spending rate m = last year’s market value

Randomness of Returns Highest Return
Lowest Return
1997 1998 1999 2000 2001 2002 2003 2004 2005 2006 2007 2008 2009 2010 2011 36.94 28.58 66.41 31.04 40.59 7.62 74.48 35.14 34.54 35.97 39.78 8.83 79.02 34.59 9.37
33.75 23.11 33.01 8.96 18.04 5.11 69.18 33.16 24.13 32.99 8.16 6.60 70.19 29.53 3.38
33.36 11.95 30.16 8.28 12.35 3.82 66.79 32.11 22.63 32.59 8.04 4.75 51.48 28.07 2.31
25.79 10.24 28.41 7.33 8.44 3.58 60.25 30.58 15.10 27.54 6.35 -37.00 47.81 20.79 2.11
19.66 9.69 21.51 4.01 7.28 3.39 57.81 27.33 13.82 26.32 6.31 -38.64 47.02 20.17 0.57
7.27 8.41 21.04 -2.01 6.44 -2.85 56.28 25.95 9.70 21.87 6.24 -39.20 44.83 19.30 -5.38
7.12 7.75 6.99 -3.08 -2.37 -6.00 36.43 19.15 5.61 21.70 5.95 -42.54 37.51 19.20 -10.78
5.93 5.91 4.37 -6.40 -2.71 -11.72 36.18 17.74 4.91 17.08 5.49 -44.49 28.46 15.06 -15.12
0.39 -2.33 4.04 -9.10 -6.48 -13.84 28.69 10.88 4.45 15.80 -2.61 -45.12 26.46 13.32 -15.59
-11.59 -10.04 3.55 -12.26 -11.89 -19.87 2.04 2.65 3.08 4.32 -12.24 -47.11 2.29 3.73 -17.05
-14.55 -17.01 1.90 -12.26 -15.41 -22.10 1.95 1.35 2.36 4.09 -17.55 -53.14 0.80 1.99 -18.17
-15.12 -25.34 -2.58 -30.61 -16.75 -30.28 1.47 0.83 1.34 3.75 -18.38 -53.18 0.19 0.83 -19.90
1997 1998 1999 2000 2001 2002 2003 2004 2005 2006 2007 2008 2009 2010 2011 US Large Cap 33.36 28.58 21.04 -9.10 -11.89 -22.10 28.69 10.88 4.91 15.80 5.49 -37.00 26.46 15.06 2.11
US Large Cap Value 33.75 11.95 6.99 -6.40 -2.71 -30.28 36.43 17.74 9.70 21.87 -12.24 -53.14 37.51 20.17 -19.90 US Small Cap 25.79 -2.33 28.41 -12.26 18.04 -19.87 57.81 19.15 5.61 17.08 -2.61 -38.64 47.02 29.53 -5.38
US Small Cap Value 36.94 -10.04 4.37 -3.08 40.59 -11.72 74.48 27.33 4.45 21.70 -18.38 -44.49 70.19 34.59 -10.78 US Real Estate 19.66 -17.01 -2.58 31.04 12.35 3.58 36.18 33.16 13.82 35.97 -17.55 -39.20 28.46 28.07 9.37
International Large Cap Value 0.39 23.11 33.01 4.01 -15.41 -13.84 69.18 30.58 15.10 32.99 6.35 -45.12 51.48 13.32 -17.05 International Small Cap -14.55 10.24 30.16 -12.26 -16.75 -2.85 60.25 32.11 22.63 26.32 8.04 -47.11 44.83 20.79 -15.59
International Small Cap Value -15.12 9.69 21.51 -2.01 -6.48 3.82 66.79 35.14 24.13 27.54 6.24 -42.54 47.81 19.30 -15.12 Emerging Markets -11.59 -25.34 66.41 -30.61 -2.37 -6.00 56.28 25.95 34.54 32.59 39.78 -53.18 79.02 19.20 -18.17
One-Year US Fixed 5.93 5.91 4.04 7.33 7.28 3.39 1.47 0.83 2.36 4.32 5.95 4.75 0.80 0.83 0.57 Five-Year US Government
Fixed 7.12 7.75 1.90 8.96 8.44 7.62 2.04 1.35 1.34 3.75 8.16 8.83 0.19 3.73 3.38 Five-Year Global Fixed 7.27 8.41 3.55 8.28 6.44 5.11 1.95 2.65 3.08 4.09 6.31 6.60 2.29 1.99 2.31

• The vast majority of the variation in returns is due to risk factor exposure
• After fees, traditional management typically reduces returns
sensitivity to market [market return minus T-bills]
sensitivity to size [small stocksminus big stocks]
sensitivity to BtM [value stocksminus growth]
randomerror e(t)
++ + +=average expected return [minus T-bills]
average excess return
THE MODEL TELLS THE DIFFERENCE BETWEEN INVESTING AND SPECULATING
Priced Risk • Positive expected return • Systematic • Economic • Long-term • Investing
Unpriced Risk • Noise • Random • Short-term • Speculating.
Structured Exposure to Factors
Unexplained Variation
• Market • Size • Value/Growth
Structure Determines Performance

• Equity Market (complete value-weighted universe of stocks) Stocks tend to have higher expected returns than fixed income over time.
• Company Size (measured by market capitalization) Small company stocks tend to have higher expected returns than large company stocks over time.
• Company Price (measured by ratio of company book value to market equity) Lower-priced “value” stocks tend to have higher expected returns than higher-priced “growth” stocks over time.
Value
Large
Small
Growth
Increased Risk Exposure and Expected Return
Total Stock Market
Decreased Risk Exposure and
Expected Return
Three Dimensions of Stock Returns around the World
Risk and Return are Related
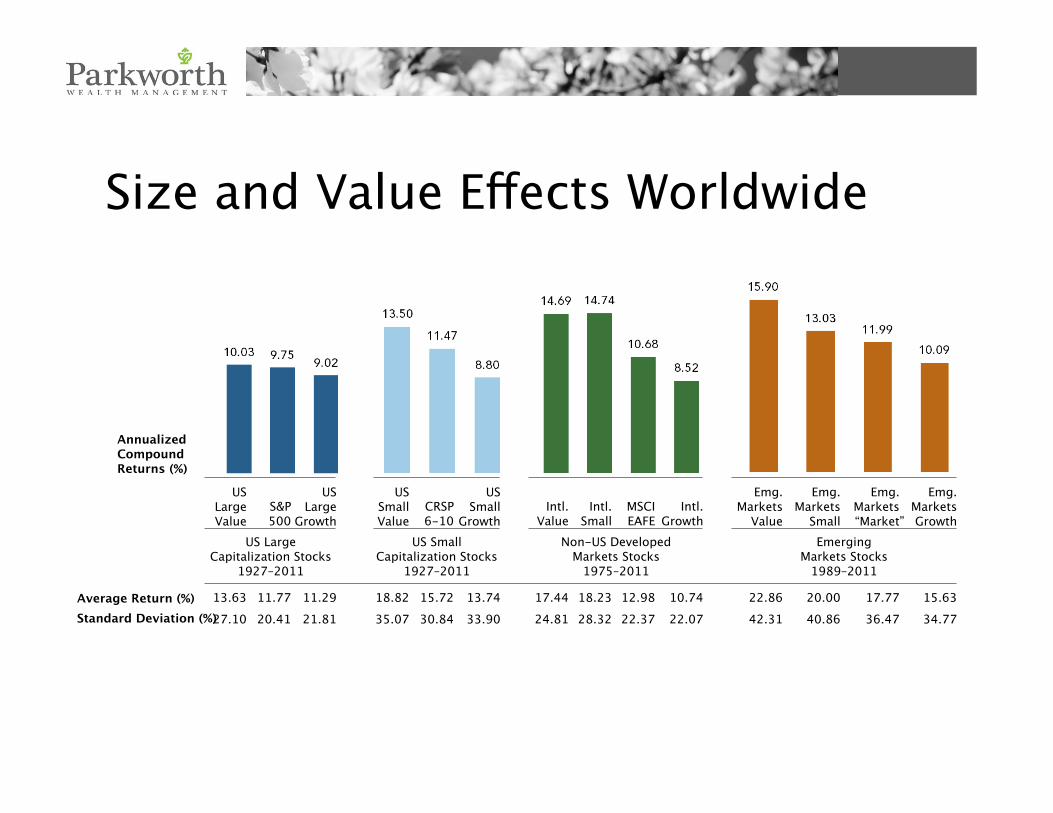
US Large Value
S&P 500
US Large
Growth
US Small Value
CRSP 6-10
US Small
Growth Intl.
Value Intl.
Small MSCI EAFE
Intl. Growth
Emg. Markets
Value
Emg. Markets
Small
Emg. Markets “Market”
Emg. Markets Growth
US Large Capitalization Stocks
1927–2011
US Small Capitalization Stocks
1927–2011
Non-US Developed Markets Stocks
1975–2011
Emerging Markets Stocks
1989–2011
13.63 11.77 11.29 18.82 15.72 13.74 17.44 18.23 12.98 10.74 22.86 20.00 17.77 15.63 27.10 20.41 21.81 35.07 30.84 33.90 24.81 28.32 22.37 22.07 42.31 40.86 36.47 34.77
Average Return (%) Standard Deviation (%)
Annualized Compound Returns (%)
Size and Value Effects Worldwide

The Failure of Active ManagementPercentage of Active Public Equity Funds That Failed to Beat the Index Five Years as of June 2011
US Large Cap
US Mid Cap
US Small Cap
Global International
International Small
Emerging Markets
% of
Act
ive
Fund
s Th
at F
aile
d
to O
utpe
rfor
m B
ench
mar
k
Equity Fund Category
Investing • Asset allocation is the primary determinant of a broadly
diversified portfolio's performance • Market timing and individual security selection are far less
important in determining performance • Portfolio return is related to risk. Generally, the more risk the
greater the return. • Diversification is essential. Investors are not compensated for
the additional risk of concentrated investments. • Passive, not active management, is preferred in most markets • Reducing expenses and minimizing taxes increases net return • Rebalancing maintains portfolio structure and risk level • Asset location is powerful in reducing taxes • Alternative investments can increase return while reducing
risk

Bull and Bear MarketsS&P 500 Index (USD)Daily Returns: January 1, 1926–December 31, 2011
220%
-13%
-85%
20%
-16% -39%
119%
87%
27%
-15% -10%
-13%
100%
44%
-53%
25%
40%
-13% -14%
26%
-25%
22%
-11%
23%
-33%
83%
-11%
99%
-26%
19%
-11% -16%
26%
53%
91%
-13%
121%
-11%
26%
-13%
18%
69%
-21% -11%
44%
-27%
15%
96%
-11%
59%
-27%
-10% -21%
-32%
56%
-12%
38%
-45%
22%
-13%
50%
-13%
38%
-15%
27%
-13%
26%
-10%
21%
-16%
48%
-20%
78%
-11%
156%
-33%
73%
-10%
16%
-19%
303%
-12%
37% 50%
-19% -12%
23%
-11%
13%
-47%
21%
-14%
113%
03/09/2009 -55%
12/31/2011
-11% 1%
Average Duration Bull Market: 413 Days Bear Market: 220 Days
Average Return Bull Market: 58% Bear Market: -21%