Best Foot Forward FoodPrint Calculator - · PDF fileBest Foot Forward FoodPrint Calculator ......
21
Best Foot Forward FoodPrint Calculator Assumptions and data sources Rebeca Laorga & Richard Sheane 9/5/2011
Transcript of Best Foot Forward FoodPrint Calculator - · PDF fileBest Foot Forward FoodPrint Calculator ......

Best Foot Forward
FoodPrint Calculator Assumptions and data sources
Rebeca Laorga & Richard Sheane
9/5/2011

Contents
1 Introduction ....................................................................................... 4
1.1 Project background .................................................................................................................. 4
1.2 Tool characteristics .................................................................................................................. 4
2 Life cycle impact of food consumption .............................................. 7
2.1 Food production ...................................................................................................................... 7
2.1.1 Production conversion factors .......................................................................................... 7
2.1.1.1 Energy .......................................................................................................................... 8
2.1.1.2 Agricultural land ........................................................................................................... 9
2.1.1.3 Water ......................................................................................................................... 10
2.1.1.4 Greenhouse gases ...................................................................................................... 11
2.1.2 Organic foods ................................................................................................................. 12
2.1.3 Processing ...................................................................................................................... 13
2.2 Distribution ............................................................................................................................ 13
2.3 Use & End of Life .................................................................................................................... 15
2.3.1 Cooking & refrigeration .................................................................................................. 15
2.3.2 Waste ............................................................................................................................. 16
2.3.2.1 Food ........................................................................................................................... 16
2.3.2.2 Packaging ................................................................................................................... 17
3 Food system characteristics............................................................. 19
3.1 Dependence on trade............................................................................................................. 19
3.2 Land availability ..................................................................................................................... 19

Figures Figure 1: Summary of environmental impacts, life cycle stages and processes to be modelled ................ 5
Figure 2: Summary of user input requirements ........................................................................................ 6
Figure 3: Early mock-up of dashboard ......................................................... Error! Bookmark not defined.
Figure 4: Agricultural land availability per capita, by food zone .............................................................. 19
Tables Table 1: Food production conversion factors for energy, land, water and greenhouse gases ................... 7
Table 2: Uplift factors for organic production ........................................................................................ 12
Table 3: Food transport assumptions ..................................................................................................... 14
Table 4: Energy and GHG emissions associated with cooking and refrigeration ...................................... 15
Table 5: Energy and GHG emissions associated with packaging waste management ............................. 17
Table 6: Eat Well Plate ................................................................................ Error! Bookmark not defined.
Table 7: Agricultural land availability per capita, by food zone ............................................................... 20
Table 8: Urban land availability in London (Garnett, 1999) ..................................................................... 21
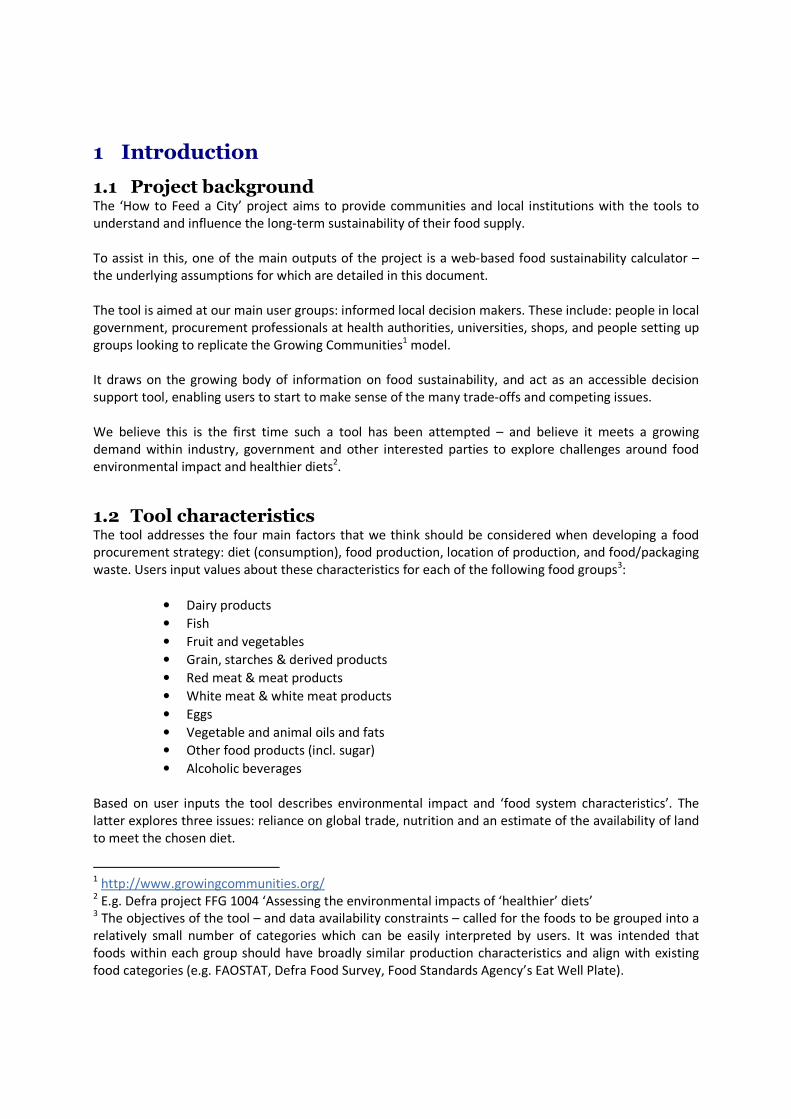
1 Introduction
1.1 Project background The ‘How to Feed a City’ project aims to provide communities and local institutions with the tools to
understand and influence the long-term sustainability of their food supply.
To assist in this, one of the main outputs of the project is a web-based food sustainability calculator –
the underlying assumptions for which are detailed in this document.
The tool is aimed at our main user groups: informed local decision makers. These include: people in local
government, procurement professionals at health authorities, universities, shops, and people setting up
groups looking to replicate the Growing Communities1 model.
It draws on the growing body of information on food sustainability, and act as an accessible decision
support tool, enabling users to start to make sense of the many trade-offs and competing issues.
We believe this is the first time such a tool has been attempted – and believe it meets a growing
demand within industry, government and other interested parties to explore challenges around food
environmental impact and healthier diets2.
1.2 Tool characteristics The tool addresses the four main factors that we think should be considered when developing a food
procurement strategy: diet (consumption), food production, location of production, and food/packaging
waste. Users input values about these characteristics for each of the following food groups3:
• Dairy products
• Fish
• Fruit and vegetables
• Grain, starches & derived products
• Red meat & meat products
• White meat & white meat products
• Eggs
• Vegetable and animal oils and fats
• Other food products (incl. sugar)
• Alcoholic beverages
Based on user inputs the tool describes environmental impact and ‘food system characteristics’. The
latter explores three issues: reliance on global trade, nutrition and an estimate of the availability of land
to meet the chosen diet.
1 http://www.growingcommunities.org/
2 E.g. Defra project FFG 1004 ‘Assessing the environmental impacts of ‘healthier’ diets’
3 The objectives of the tool – and data availability constraints – called for the foods to be grouped into a
relatively small number of categories which can be easily interpreted by users. It was intended that
foods within each group should have broadly similar production characteristics and align with existing
food categories (e.g. FAOSTAT, Defra Food Survey, Food Standards Agency’s Eat Well Plate).

The tool quantifies the energy, water, land4 and climate change impacts of different food procurement
scenarios (see Figure 1). The tool approaches environmental impact from a life cycle perspective:
examining the supply chain from agricultural production to waste disposal. These indicators were
chosen following a review of possible environmental impacts to model5.
Figure 1: Summary of environmental impacts, life cycle stages and processes to be modelled
INPUTS
OUPUTS
The tool does not attempt to address all aspects of food system sustainability – e.g. ecosystem function,
trade partnerships, animal welfare, etc.
The tool is intended to help with the initial strategic steps towards setting up a food strategy and is not a
detailed predictive model. Instead it encourages experimentation and demonstrates interactions and
trade-offs in the system. Adjustments to the tool show the impacts on outputs in real-time. The outputs
can then be used, with other materials, to help build up a picture of the relative risks and benefits of
different decisions in the food system, and to help people to prioritise a strategy for action and more
detailed research, environmental assessment and target-setting.
4 Only agricultural land is included – i.e. does not include built land, etc.
5 See How to Feed a City report ‘A review of UK food chain resilience and environment impact’
Foo
d p
rod
uct
ion On farm production
of food ingredients and minor processing
Dis
trib
uti
on Freight to consumer
from location of production by air, land & sea
Use
& E
nd
-of-
life Chilling
Cooking
Food waste
Packaging waste
Lan
d
Wa
ter
En
erg
y
GH
Gs
GH
Gs
GH
Gs
GH
Gs
En
erg
y
En
erg
y
Wa
ter
Lan
d
En
erg
y
GH
Gs
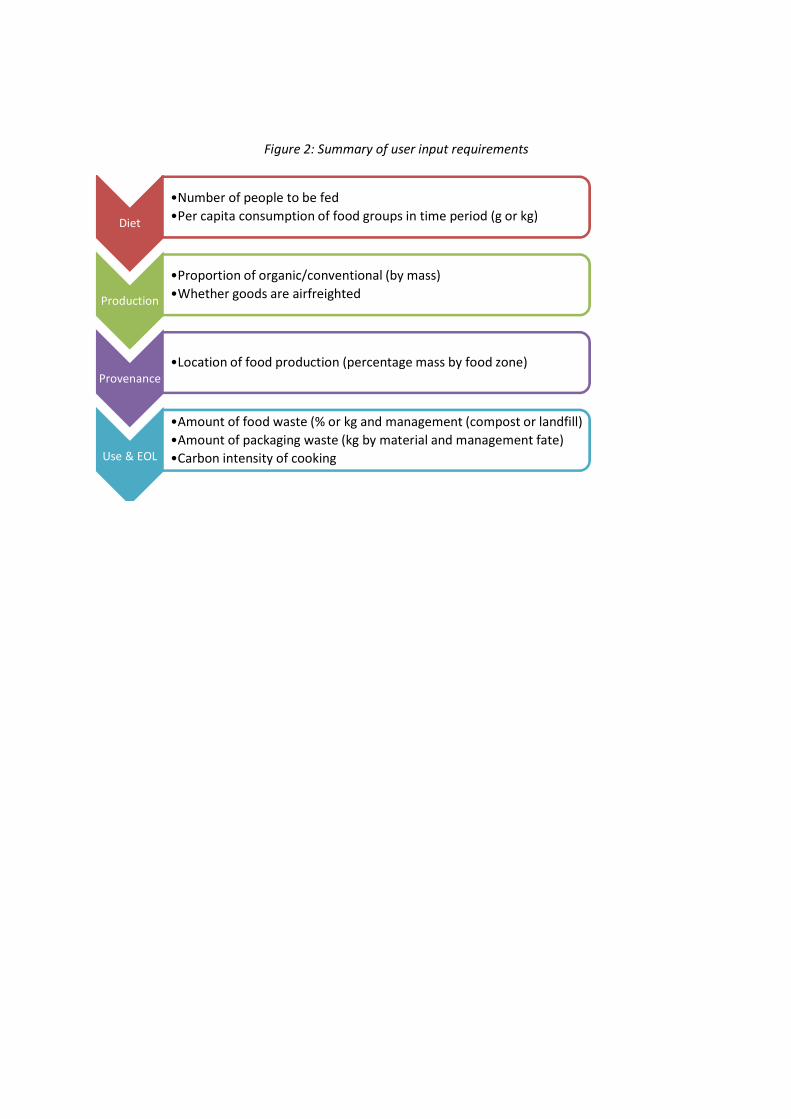
Figure 2: Summary of user input requirements
Diet
•Number of people to be fed
•Per capita consumption of food groups in time period (g or kg)
Production
•Proportion of organic/conventional (by mass)
•Whether goods are airfreighted
Provenance
•Location of food production (percentage mass by food zone)
Use & EOL
•Amount of food waste (% or kg and management (compost or landfill)
•Amount of packaging waste (kg by material and management fate)
•Carbon intensity of cooking
2 Life cycle impact of food consumption
2.1 Food production
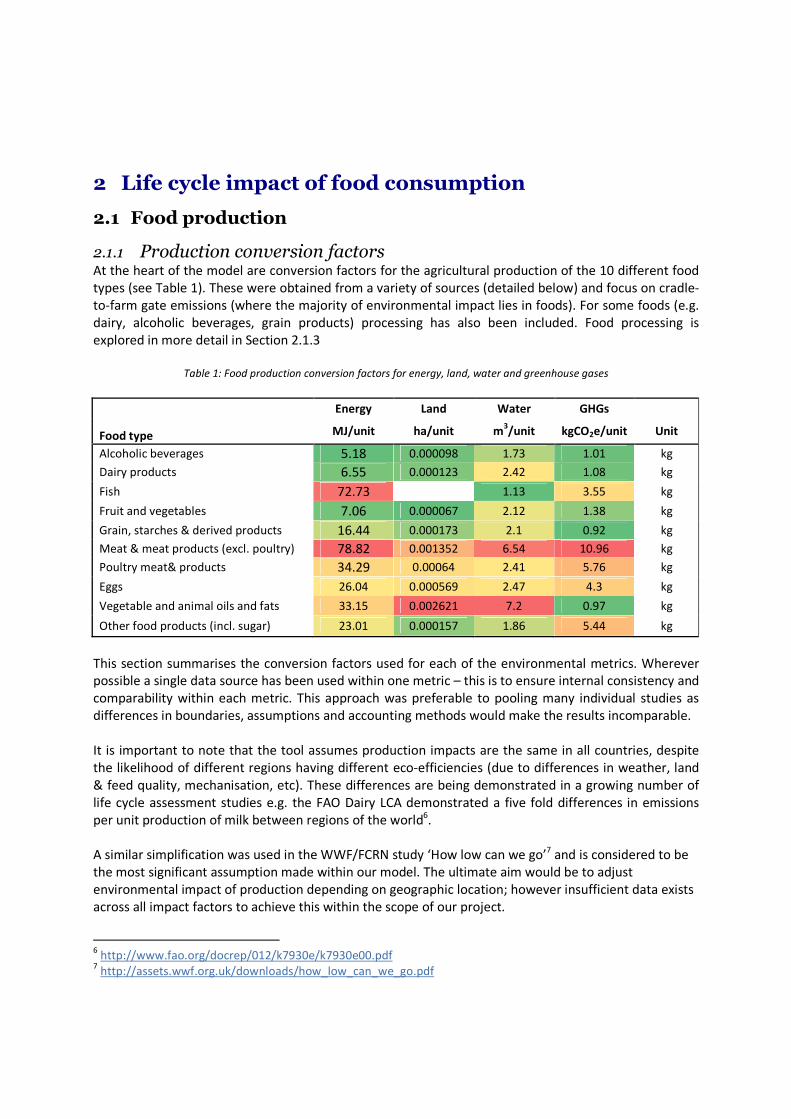
2.1.1 Production conversion factors At the heart of the model are conversion factors for the agricultural production of the 10 different food
types (see Table 1). These were obtained from a variety of sources (detailed below) and focus on cradle-
to-farm gate emissions (where the majority of environmental impact lies in foods). For some foods (e.g.
dairy, alcoholic beverages, grain products) processing has also been included. Food processing is
explored in more detail in Section 2.1.3
Table 1: Food production conversion factors for energy, land, water and greenhouse gases
Energy Land Water GHGs
Food type MJ/unit ha/unit m3/unit kgCO2e/unit Unit
Alcoholic beverages 5.18 0.000098 1.73 1.01 kg
Dairy products 6.55 0.000123 2.42 1.08 kg
Fish 72.73 1.13 3.55 kg
Fruit and vegetables 7.06 0.000067 2.12 1.38 kg
Grain, starches & derived products 16.44 0.000173 2.1 0.92 kg
Meat & meat products (excl. poultry) 78.82 0.001352 6.54 10.96 kg
Poultry meat& products 34.29 0.00064 2.41 5.76 kg
Eggs 26.04 0.000569 2.47 4.3 kg
Vegetable and animal oils and fats 33.15 0.002621 7.2 0.97 kg
Other food products (incl. sugar) 23.01 0.000157 1.86 5.44 kg
This section summarises the conversion factors used for each of the environmental metrics. Wherever
possible a single data source has been used within one metric – this is to ensure internal consistency and
comparability within each metric. This approach was preferable to pooling many individual studies as
differences in boundaries, assumptions and accounting methods would make the results incomparable.
It is important to note that the tool assumes production impacts are the same in all countries, despite
the likelihood of different regions having different eco-efficiencies (due to differences in weather, land
& feed quality, mechanisation, etc). These differences are being demonstrated in a growing number of
life cycle assessment studies e.g. the FAO Dairy LCA demonstrated a five fold differences in emissions
per unit production of milk between regions of the world6.
A similar simplification was used in the WWF/FCRN study ‘How low can we go’7 and is considered to be
the most significant assumption made within our model. The ultimate aim would be to adjust
environmental impact of production depending on geographic location; however insufficient data exists
across all impact factors to achieve this within the scope of our project.
6 http://www.fao.org/docrep/012/k7930e/k7930e00.pdf
7 http://assets.wwf.org.uk/downloads/how_low_can_we_go.pdf
In the tables that follow, details are provided on the data sources and key assumptions e.g. geographic
relevance, age and data boundaries, etc.
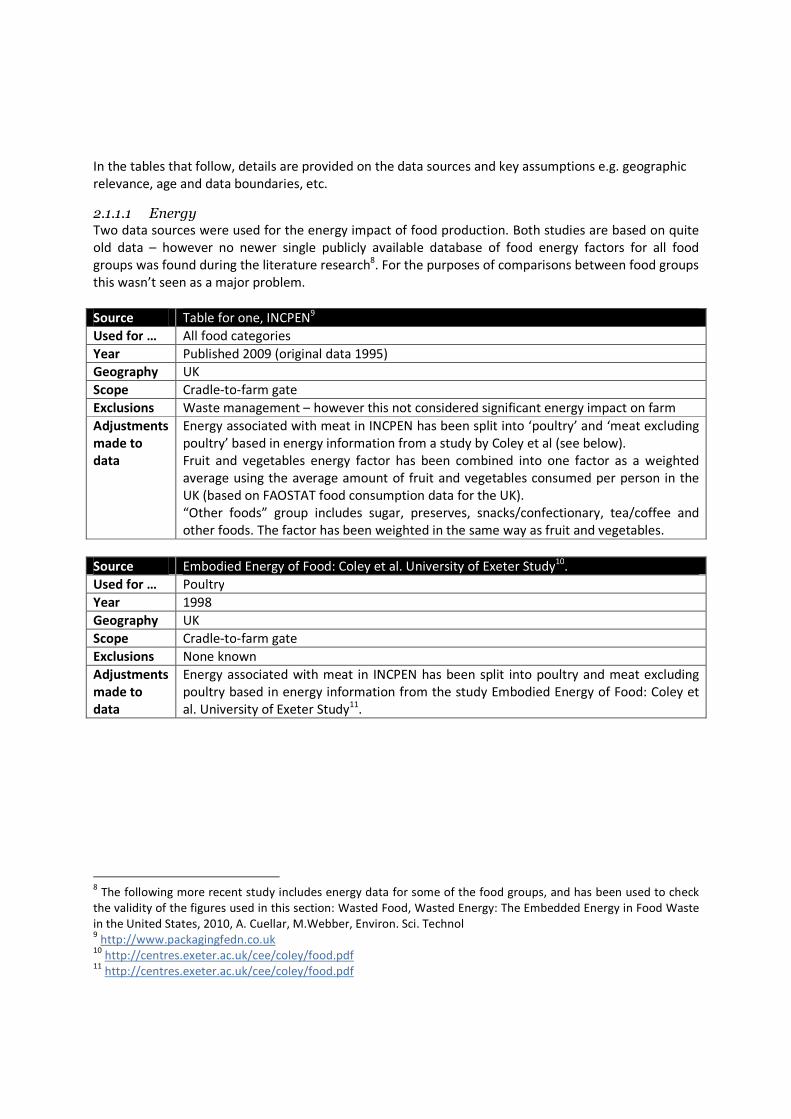
2.1.1.1 Energy Two data sources were used for the energy impact of food production. Both studies are based on quite
old data – however no newer single publicly available database of food energy factors for all food
groups was found during the literature research8. For the purposes of comparisons between food groups
this wasn’t seen as a major problem.
Source Table for one, INCPEN9
Used for … All food categories
Year Published 2009 (original data 1995)
Geography UK
Scope Cradle-to-farm gate
Exclusions Waste management – however this not considered significant energy impact on farm
Adjustments
made to
data
Energy associated with meat in INCPEN has been split into ‘poultry’ and ‘meat excluding
poultry’ based in energy information from a study by Coley et al (see below).
Fruit and vegetables energy factor has been combined into one factor as a weighted
average using the average amount of fruit and vegetables consumed per person in the
UK (based on FAOSTAT food consumption data for the UK).
“Other foods” group includes sugar, preserves, snacks/confectionary, tea/coffee and
other foods. The factor has been weighted in the same way as fruit and vegetables.
Source Embodied Energy of Food: Coley et al. University of Exeter Study10
.
Used for … Poultry
Year 1998
Geography UK
Scope Cradle-to-farm gate
Exclusions None known
Adjustments
made to
data
Energy associated with meat in INCPEN has been split into poultry and meat excluding
poultry based in energy information from the study Embodied Energy of Food: Coley et
al. University of Exeter Study11
.
8 The following more recent study includes energy data for some of the food groups, and has been used to check
the validity of the figures used in this section: Wasted Food, Wasted Energy: The Embedded Energy in Food Waste
in the United States, 2010, A. Cuellar, M.Webber, Environ. Sci. Technol 9 http://www.packagingfedn.co.uk
10 http://centres.exeter.ac.uk/cee/coley/food.pdf
11 http://centres.exeter.ac.uk/cee/coley/food.pdf
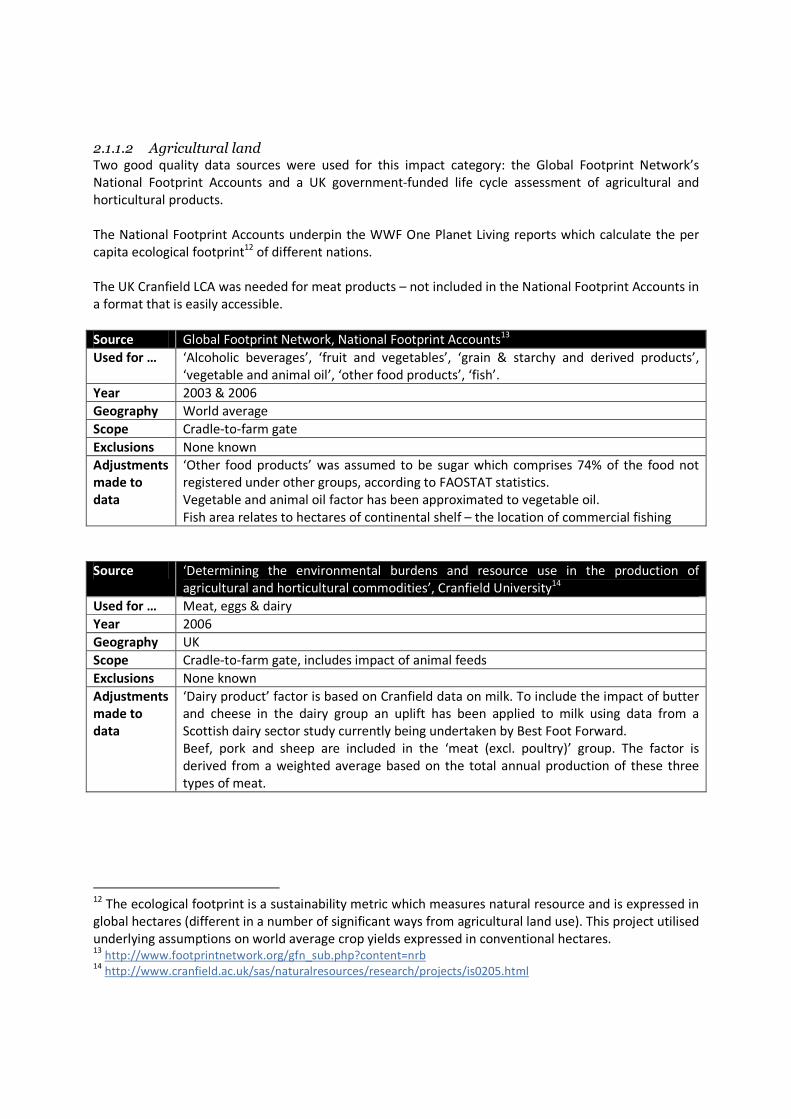
2.1.1.2 Agricultural land Two good quality data sources were used for this impact category: the Global Footprint Network’s
National Footprint Accounts and a UK government-funded life cycle assessment of agricultural and
horticultural products.
The National Footprint Accounts underpin the WWF One Planet Living reports which calculate the per
capita ecological footprint12
of different nations.
The UK Cranfield LCA was needed for meat products – not included in the National Footprint Accounts in
a format that is easily accessible.
Source Global Footprint Network, National Footprint Accounts13
Used for … ‘Alcoholic beverages’, ‘fruit and vegetables’, ‘grain & starchy and derived products’,
‘vegetable and animal oil’, ‘other food products’, ‘fish’.
Year 2003 & 2006
Geography World average
Scope Cradle-to-farm gate
Exclusions None known
Adjustments
made to
data
‘Other food products’ was assumed to be sugar which comprises 74% of the food not
registered under other groups, according to FAOSTAT statistics.
Vegetable and animal oil factor has been approximated to vegetable oil.
Fish area relates to hectares of continental shelf – the location of commercial fishing
Source ‘Determining the environmental burdens and resource use in the production of
agricultural and horticultural commodities’, Cranfield University14
Used for … Meat, eggs & dairy
Year 2006
Geography UK
Scope Cradle-to-farm gate, includes impact of animal feeds
Exclusions None known
Adjustments
made to
data
‘Dairy product’ factor is based on Cranfield data on milk. To include the impact of butter
and cheese in the dairy group an uplift has been applied to milk using data from a
Scottish dairy sector study currently being undertaken by Best Foot Forward.
Beef, pork and sheep are included in the ‘meat (excl. poultry)’ group. The factor is
derived from a weighted average based on the total annual production of these three
types of meat.
12
The ecological footprint is a sustainability metric which measures natural resource and is expressed in
global hectares (different in a number of significant ways from agricultural land use). This project utilised
underlying assumptions on world average crop yields expressed in conventional hectares. 13
http://www.footprintnetwork.org/gfn_sub.php?content=nrb 14
http://www.cranfield.ac.uk/sas/naturalresources/research/projects/is0205.html

2.1.1.3 Water Two data sources were used for the water footprint of food products – both from the leading
organisation in this field: the Water Footprint Network.
Source Hoekstra, A.Y. and Chapagain, A.K. Globalization of water: Sharing the planet's
freshwater resources, Blackwell Publishing, Oxford, UK15
.
Used for … All foods, except for fish
Year 2008
Geography UK (data is available for all counties)
Scope Cradle-to-processing
Exclusions None known
Adjustments
made to
data
Fruit and vegetables factor has been combined into one factor as a weighted average
using the average amount of fruit and vegetables per person (FAOSTAT data).
Other food factor has been combined in the same way as fruit and vegetables using
factors for sugar, nuts and oil seeds.
Source Fish water footprint factor is based on the study: Virtual Water Trade, Proceedings of the
international expert meeting on virtual water trade, IHE Delft16
Used for … Fish
Year 2003
Geography World average
Scope Cradle-to-gate
Exclusions None known
Adjustments
made to
data
Fish factor has been assumed as the average of the range presented in the study Virtual
Water Trade
15
http://www.waterfootprint.org/?page=files/Productwaterfootprint-statistics 16
www.waterfootprint.org/Reports/Report12.pdf
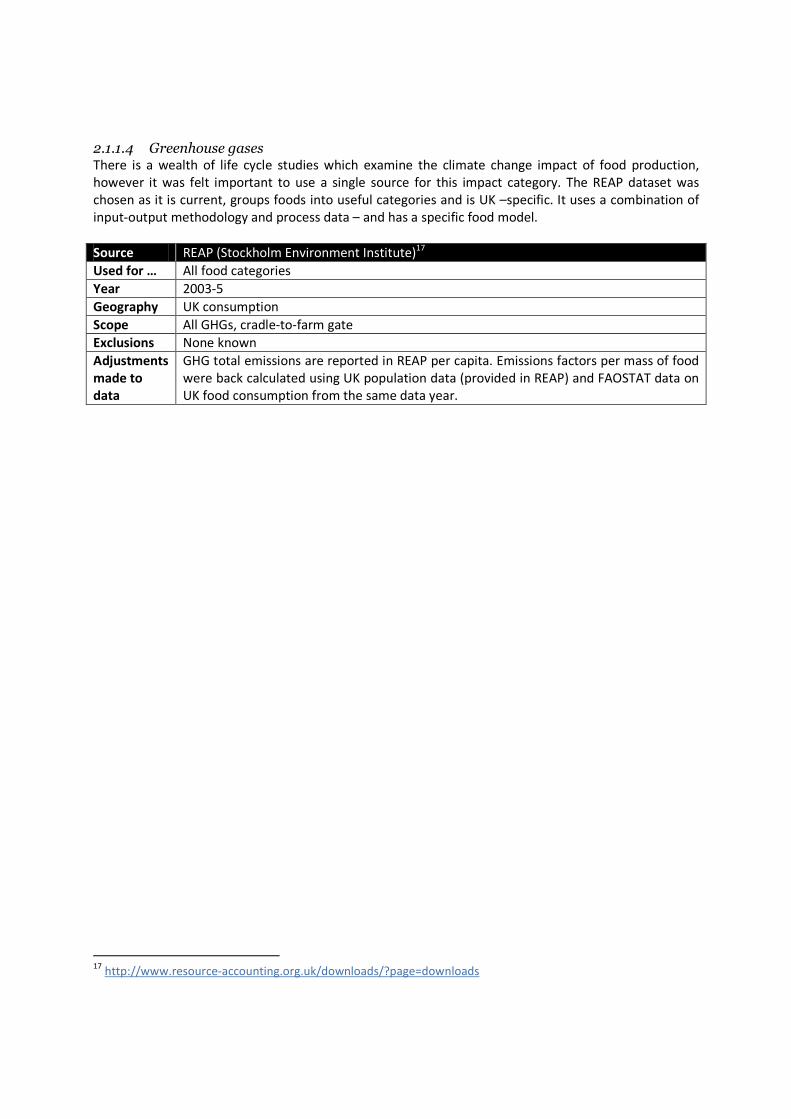
2.1.1.4 Greenhouse gases There is a wealth of life cycle studies which examine the climate change impact of food production,
however it was felt important to use a single source for this impact category. The REAP dataset was
chosen as it is current, groups foods into useful categories and is UK –specific. It uses a combination of
input-output methodology and process data – and has a specific food model.
Source REAP (Stockholm Environment Institute)17
Used for … All food categories
Year 2003-5
Geography UK consumption
Scope All GHGs, cradle-to-farm gate
Exclusions None known
Adjustments
made to
data
GHG total emissions are reported in REAP per capita. Emissions factors per mass of food
were back calculated using UK population data (provided in REAP) and FAOSTAT data on
UK food consumption from the same data year.
17
http://www.resource-accounting.org.uk/downloads/?page=downloads
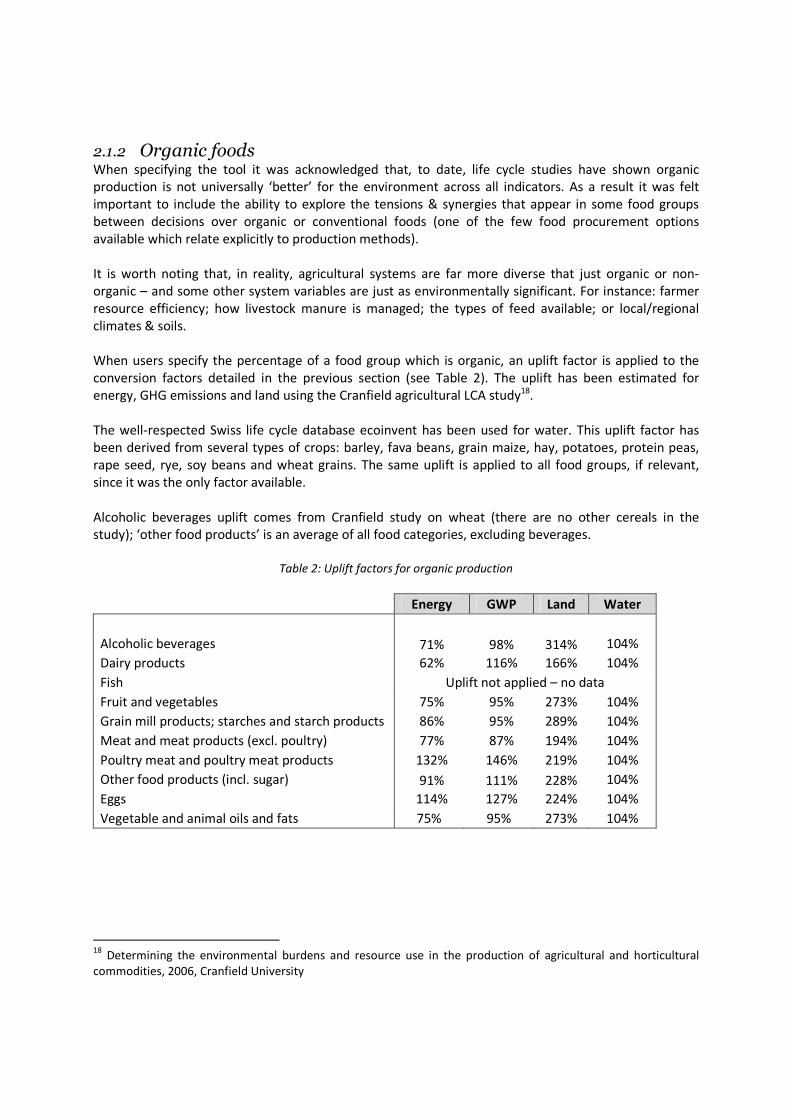
2.1.2 Organic foods When specifying the tool it was acknowledged that, to date, life cycle studies have shown organic
production is not universally ‘better’ for the environment across all indicators. As a result it was felt
important to include the ability to explore the tensions & synergies that appear in some food groups
between decisions over organic or conventional foods (one of the few food procurement options
available which relate explicitly to production methods).
It is worth noting that, in reality, agricultural systems are far more diverse that just organic or non-
organic – and some other system variables are just as environmentally significant. For instance: farmer
resource efficiency; how livestock manure is managed; the types of feed available; or local/regional
climates & soils.
When users specify the percentage of a food group which is organic, an uplift factor is applied to the
conversion factors detailed in the previous section (see Table 2). The uplift has been estimated for
energy, GHG emissions and land using the Cranfield agricultural LCA study18.
The well-respected Swiss life cycle database ecoinvent has been used for water. This uplift factor has
been derived from several types of crops: barley, fava beans, grain maize, hay, potatoes, protein peas,
rape seed, rye, soy beans and wheat grains. The same uplift is applied to all food groups, if relevant,
since it was the only factor available.
Alcoholic beverages uplift comes from Cranfield study on wheat (there are no other cereals in the
study); ‘other food products’ is an average of all food categories, excluding beverages.
Table 2: Uplift factors for organic production
Energy GWP Land Water
Alcoholic beverages 71% 98% 314% 104%
Dairy products 62% 116% 166% 104%
Fish Uplift not applied – no data
Fruit and vegetables 75% 95% 273% 104%
Grain mill products; starches and starch products 86% 95% 289% 104%
Meat and meat products (excl. poultry) 77% 87% 194% 104%
Poultry meat and poultry meat products 132% 146% 219% 104%
Other food products (incl. sugar) 91% 111% 228% 104%
Eggs 114% 127% 224% 104%
Vegetable and animal oils and fats 75% 95% 273% 104%
18
Determining the environmental burdens and resource use in the production of agricultural and horticultural
commodities, 2006, Cranfield University

2.1.3 Processing As the tool is aimed at those procuring food on larger scales, it is assumed that pre-processing to goods,
such as ready-meals and similar goods, is not applicable – instead it is assumed most food is purchased
with minimal pre-processing e.g. flour, milk. This more limited level of processing is captured in food
production conversion factors detailed in Section 2.1.1.
Additionally, some studies have demonstrated energy (and GHG emissions) savings through the
industrial preparation of meals when compared to the same meal cooked at home19
and so a blanket
adjustment for processing has questionable validity. It is suggested that the benefits of unprocessed
foods are quite often more a question of nutrition, food quality & cultural ‘connectedness’ with food
(i.e. it cannot be considered so much of an environmental issue20
).
The environmental impact of packaging production is, however, included at the end-of-life stage (see
Section 2.3.2.2).
2.2 Distribution The users are able to select the origin of the food for each food group. The origin is aligned with
Growing Communities ‘Food Zones’ terminology and definitions21.
The figure below shows value boxes, which users manipulate to adjust where food comes from
(percentage by mass). Row totals must equal 100.
Column 6 (‘rest of world’) can be either all sea freight – or air freight (if the box is ticked).
Figure 3: Screenshot of food zone slider control
The default values have been derived using Defra & UN statistics and expert judgement. They represent
a likely UK typical scenario.
19
The Validity of Food Miles as an Indicator of Sustainable Development, AEAT for Defra, 2005 20
Food processing effluent is one obvious exception to this (but is not captured well by our four indicators) 21
http://www.growingcommunities.org/start-ups/what-is-gc/manifesto-feeding-cities/explore-food-
zones/
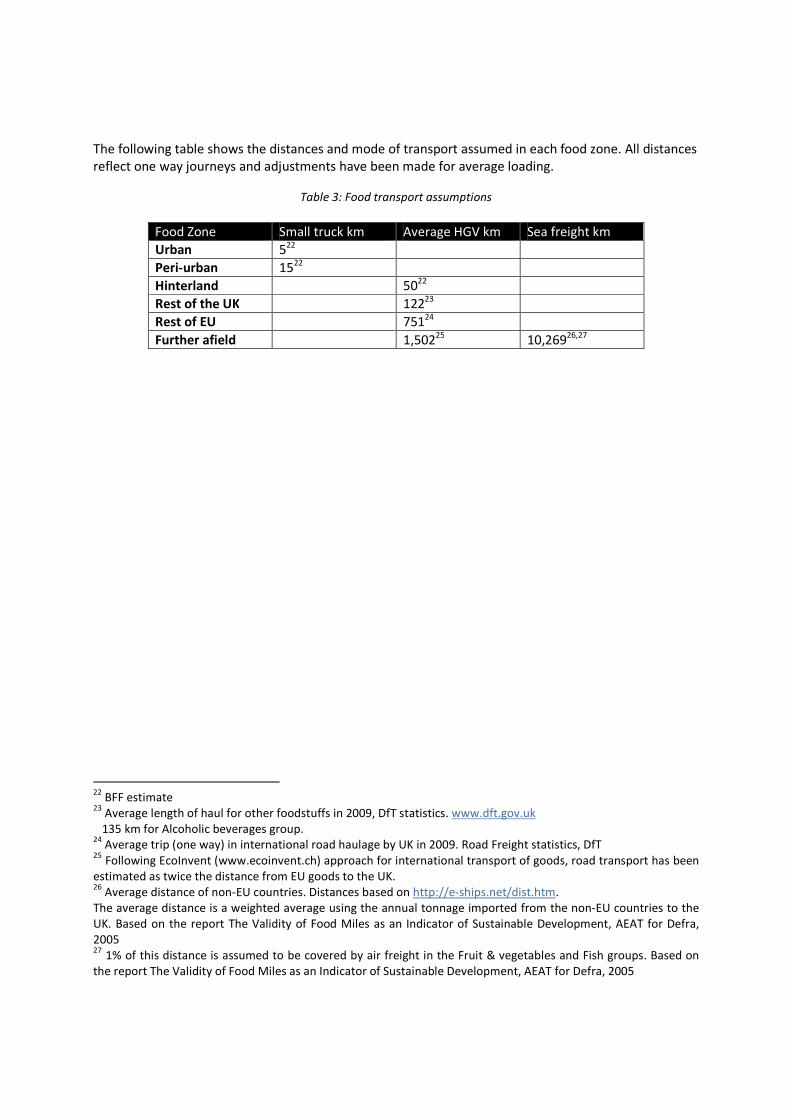
The following table shows the distances and mode of transport assumed in each food zone. All distances
reflect one way journeys and adjustments have been made for average loading.
Table 3: Food transport assumptions
Food Zone Small truck km Average HGV km Sea freight km
Urban 522
Peri-urban 1522
Hinterland 5022
Rest of the UK 12223
Rest of EU 75124
Further afield 1,50225
10,26926,27
22
BFF estimate 23
Average length of haul for other foodstuffs in 2009, DfT statistics. www.dft.gov.uk
135 km for Alcoholic beverages group. 24
Average trip (one way) in international road haulage by UK in 2009. Road Freight statistics, DfT 25
Following EcoInvent (www.ecoinvent.ch) approach for international transport of goods, road transport has been
estimated as twice the distance from EU goods to the UK. 26
Average distance of non-EU countries. Distances based on http://e-ships.net/dist.htm.
The average distance is a weighted average using the annual tonnage imported from the non-EU countries to the
UK. Based on the report The Validity of Food Miles as an Indicator of Sustainable Development, AEAT for Defra,
2005 27
1% of this distance is assumed to be covered by air freight in the Fruit & vegetables and Fish groups. Based on
the report The Validity of Food Miles as an Indicator of Sustainable Development, AEAT for Defra, 2005

2.3 Use & End of Life
2.3.1 Cooking & refrigeration Energy (and resulting emissions) associated with refrigeration and cooking of food groups are
derived from the INCPEN study28 (see Table 4). The user is able to affect GHG emissions by
entering the proportion of electricity & heat supplied by good quality renewables (as defined by
Defra GHG reporting guidelines). Energy footprint is not affected by this adjustment.
Table 4: Energy and GHG emissions associated with cooking and refrigeration
Energy Emissions
Food type MJ/kg kgCO2e/kg
Alcoholic beverages 1.30 0.22
Dairy products 7.26 1.24
Fish 16.36 2.64
Fruit and vegetables 3.86 0.54
Grain, starches & derived products 11.40 1.71
Meat & meat products (excl. poultry) 28.18 4.31
Poultry meat& products 28.18 4.31
Eggs 21.88 3.15
Vegetable and animal oils and fats 5.52 0.95
Other food products (incl. sugar) 0 0
Assumptions:
• The same energy data has been used for all meat types
• The GHG factors were derived from the INCPEN energy data. Cooking energy has been
split into gas and electricity29
while refrigeration is all allocated to electricity. Energy to
GHG conversion factors come from Defra 201030
28
Environmental impact of packaging in the UK food supply system, 1996, INCPEN (The Industry Council for
Packaging and the Environment) 29
Defra consultation, Annex 12, http://www.defra.gov.uk/corporate/consult/energy-using-products 30
http://www.defra.gov.uk/environment/business/reporting/

2.3.2 Waste Two types of waste are considered in the tool: food waste and packaging waste.
2.3.2.1 Food Food waste has two environmental impacts which are captured in this tool:
1. Greenhouse gas emissions and energy use associated with the management of waste
e.g. transport to treatment facility, processing emissions (e.g. methane). Emissions
factors for this are taken from standard sources e.g. Defra GHG Reporting Guidelines.
2. As the tool models the quantity of food consumed by a population, any wastage at use
requires additional production of resource to meet that diet demand. For example, if
10% of dairy food is wasted at use, for a given population to eat 200kg of dairy per
person per year, an additional 10% (20kg) of production is required. This ‘overhead’ is
be included in the footprint.
The user can choose the percentage (by mass) of food wasted at use and its waste management
route (landfill or compost). To help the user the tool is set to a default (UK typical) level: In UK
the average waste disposed in percentage of the food we buy is shown in the following table31:
Food waste
Alcoholic beverages 12%
Dairy products 9%
Fish 23%
Fruit and vegetables 43%
Grain mill products; starches and starch products 37%
Meat and meat products (excl. poultry) 23%
Poultry meat and poultry meat products 23%
Other food products (incl. sugar) 22%32
Eggs 9%
Vegetable and animal oils and fats 17%
Post harvest losses are not considered, as it is assumed that agricultural production conversion
factors already account for this waste. Distribution losses were not included as they are small in
comparison to waste at consumer33
.
The environmental impact of food waste management of all types is modelled using the same
conversion factors (i.e. meat is no different to vegetables). Greenhouse gases are modelled
using the latest factors from Defra’s GHG Reporting Guidelines. Energy is estimated from the
same source assuming 10 km distance to the landfill site, transported in an average truck.
31
Household Food and Drink Waste in the UK, 2009, WRAP 32
Average of all food types 33
Parfitt, J. (2010) Food waste within food supply chains: quantification and potential for change to
2050. Phil. Trans. R. Soc. B (2010) 365, 3065–3081
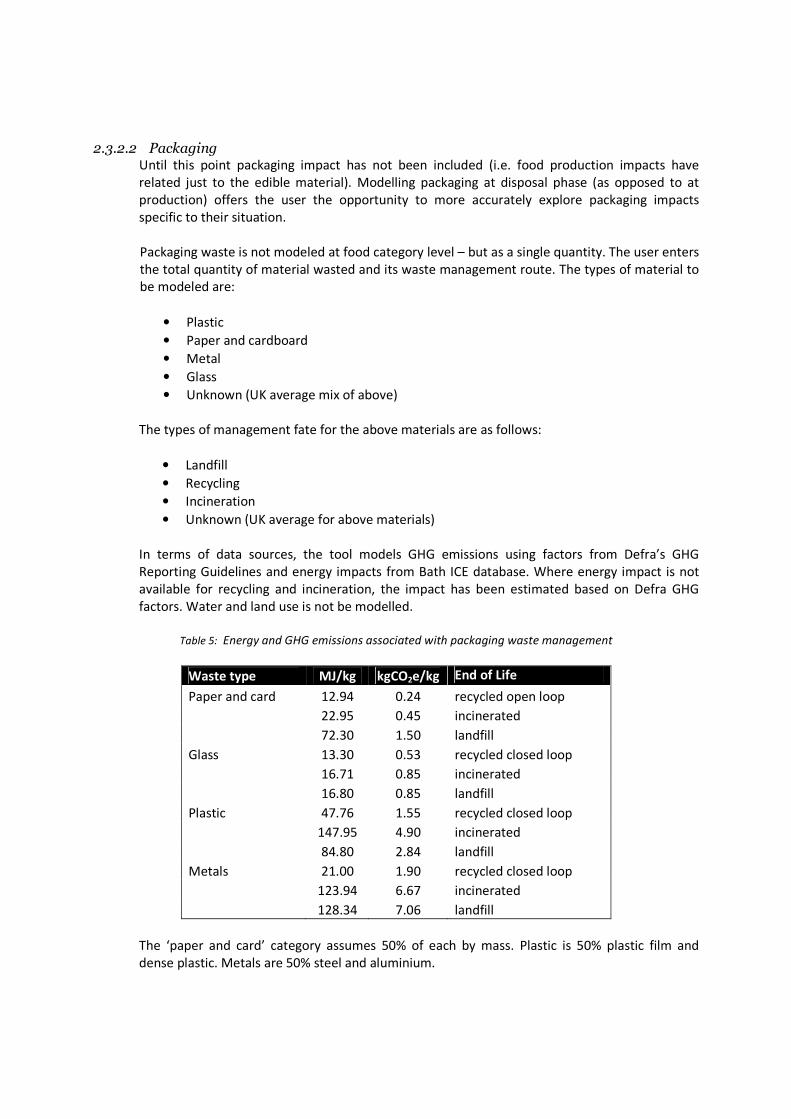
2.3.2.2 Packaging Until this point packaging impact has not been included (i.e. food production impacts have
related just to the edible material). Modelling packaging at disposal phase (as opposed to at
production) offers the user the opportunity to more accurately explore packaging impacts
specific to their situation.
Packaging waste is not modeled at food category level – but as a single quantity. The user enters
the total quantity of material wasted and its waste management route. The types of material to
be modeled are:
• Plastic
• Paper and cardboard
• Metal
• Glass
• Unknown (UK average mix of above)
The types of management fate for the above materials are as follows:
• Landfill
• Recycling
• Incineration
• Unknown (UK average for above materials)
In terms of data sources, the tool models GHG emissions using factors from Defra’s GHG
Reporting Guidelines and energy impacts from Bath ICE database. Where energy impact is not
available for recycling and incineration, the impact has been estimated based on Defra GHG
factors. Water and land use is not be modelled.
Table 5: Energy and GHG emissions associated with packaging waste management
Waste type MJ/kg kgCO2e/kg End of Life
Paper and card 12.94 0.24 recycled open loop
22.95 0.45 incinerated
72.30 1.50 landfill
Glass 13.30 0.53 recycled closed loop
16.71 0.85 incinerated
16.80 0.85 landfill
Plastic 47.76 1.55 recycled closed loop
147.95 4.90 incinerated
84.80 2.84 landfill
Metals 21.00 1.90 recycled closed loop
123.94 6.67 incinerated
128.34 7.06 landfill
The ‘paper and card’ category assumes 50% of each by mass. Plastic is 50% plastic film and
dense plastic. Metals are 50% steel and aluminium.

To help the user, the waste quantity is set to a default – it is assumed that in the UK the average
packaging mass is 10% of the total purchased food mass34
.
The UK average packaging waste mix by mass has been estimated as 53% cardboard, 20% glass,
20% plastic and 7% metals35
. The UK average figures on waste disposal are 72% landfill, 9%
incineration and 19% recycled36
.
It is important to note that the relationship between packaging and life cycle environmental
impact is not a straightforward one. Packaging serves to protect food during transport and so
reduce wastage. A complete removal of packaging would, in some cases, be counterproductive
and increase agricultural production demands (where much of a foods environmental impact
lies). There is however an optimal level of packaging which delivers the protection function with
minimal impact (e.g. through lightweighting and use of recycled/reused materials). Due to the
complexities and food-specific nature of this relationship, the tool does not explore this tension.
34
Environmental impact of packaging in the UK food supply system, 1996, INCPEN (The Industry Council for
Packaging and the Environment) 35
Defra statistics on household waste. Paper and cardboard, glass, plastic and metals are assumed to be associated
with packaging 36
www.wasteonline.org.uk
3 Food system characteristics Apart from reporting environmental impact, the results of the tool are further interpreted through two
lenses: dependence on global trade; and food zone land availability.
3.1 Dependence on trade Based on the user’s selection of food production location, a small chart shows proportion of food
imported. It is felt important to highlight this as over-dependence on imported foods, or conversely
over-dependence on local sources. Both could be viewed as a supply chain risk; the former being
exposure to erratic trade, the latter exposure to localized production failure, for example.
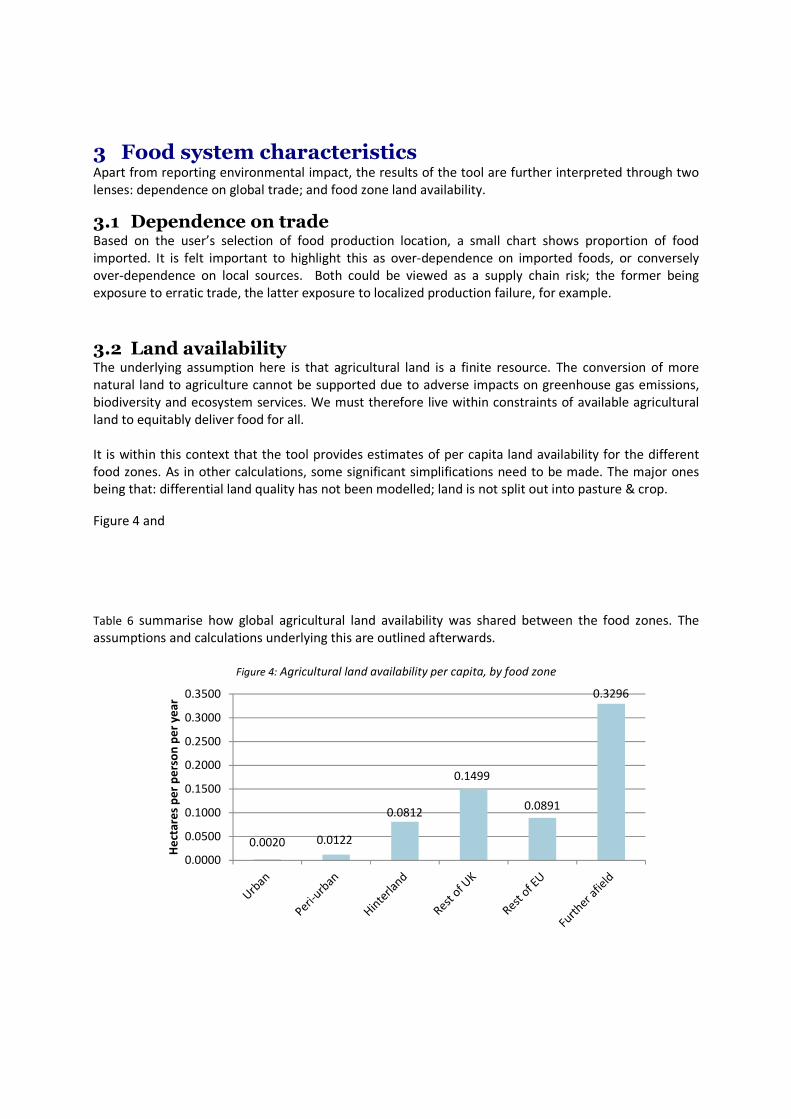
3.2 Land availability The underlying assumption here is that agricultural land is a finite resource. The conversion of more
natural land to agriculture cannot be supported due to adverse impacts on greenhouse gas emissions,
biodiversity and ecosystem services. We must therefore live within constraints of available agricultural
land to equitably deliver food for all.
It is within this context that the tool provides estimates of per capita land availability for the different
food zones. As in other calculations, some significant simplifications need to be made. The major ones
being that: differential land quality has not been modelled; land is not split out into pasture & crop.
Figure 4 and
Table 6 summarise how global agricultural land availability was shared between the food zones. The
assumptions and calculations underlying this are outlined afterwards.
Figure 4: Agricultural land availability per capita, by food zone
0.0020 0.0122
0.0812
0.1499
0.0891
0.3296
0.0000
0.0500
0.1000
0.1500
0.2000
0.2500
0.3000
0.3500
He
cta
res
pe
r p
ers
on
pe
r y
ea
r

Table 6: Agricultural land availability per capita, by food zone
Food Zone Available Land
(ha per capita)
Urban 0.0020
Peri-urban 0.0122
Hinterland 0.0812
Rest of the UK 0.1499
Rest of EU 0.0891
Further afield 0.3296
Total37
0.6640
Land availability assumptions & calculations
It was assumed that the food zones model encourages agricultural land nearer to populations to be used
preferentially for producing food for local consumption. It does, however, appreciate that transport
from distances further afield is necessary.
The items below summarise the main calculations involved in developing the land availability.
1. Fundamentally, it was assumed that – at a global level – each person has 0.6620 hectares of
agricultural land currently theoretically available to them38. It was assumed that this does not
include ‘urban’ land which could be used for food production.
2. Urban land availability has been derived using production estimates in ‘City Harvest: The
feasibility of growing more food in London’ by Tara Garnett (1999)39 (see
3.
4.
5. Table 7)
6. Total UK agricultural land availability (14,778,000 hectares) was shared between the population
(60,739,000 people) to give per capita share of 0.2233 hectares/person within the UK.
7. This total UK land was allocated between:
a. Peri-urban (5%): BFF estimate
b. Hinterland (25%): assuming this includes land stretching 100 miles from a city40
c. Rest of UK (70%): total UK area minus peri-urban and hinterland
37
Equals world share + urban 38
Total agricultural land: 4,364,775,950 hectares. (Grazing: 2,814,355,170 hectares; Crop: 1,550,420,780 hectares).
World population: 6,592,899,000 39
London could produce 232,000 tonnes of fruit and veg at 10.7 tonnes/hectare.
http://www.fcrn.org.uk/researchLib/PDFs/CityHarvest.pdf 40
Growing Communities Food Zone definition

8. Total European land share was estimated by dividing EU agricultural land hectares (153,755,680
hectares) and population (462,495,883 people): 0.3324. The UK per capita land availability was
subtracted from this to give ‘Rest of Europe’ land share of 0.0891 hectares/person/year.
9. Finally, UK and EU land share were subtracted from total global land availability per person (see
point 1) to provide ‘Further afield’ land share of 0.3296 hectares/person/year.
Table 7: Urban land availability in London (Garnett, 1999)
Land type Hectares % of land for
horticulture
Hectares for horticulture
Agricultural land 13,566 50% 6,783
Other green belt land 40,034 20% 8,007
Allotments 831 100% 831
City farms 51 25% 13
Community gardens 20 25% 5
Public open space 14,617 5% 731
Derelict/vacant land 1,388 1% 14
Gardens 38,014 14% 5,322
Total 21,705
Food zones ‘urban’41
14,922
41
Excluded ‘Agricultural land’ as this already counted in peri-urban