BESE Attachment 2, Emerging and Sustaining … · Web viewEmerging and Sustaining Practices for...
59
Emerging and Sustaining Practices for School Turnaround An Analysis of School and District Practices, Systems, Policies, and Use of Resources contributing to the successful Turnaround Efforts in Level 4 Schools June 2013 An Evaluation and Policy Analysis conducted for the Massachusetts Department of Elementary and Secondary Education by INSTLL, LLC
Transcript of BESE Attachment 2, Emerging and Sustaining … · Web viewEmerging and Sustaining Practices for...
Emerging and Sustaining Practices for School Turnaround
An Analysis of School and District Practices, Systems, Policies, and Use of Resources contributing to the successful Turnaround Efforts
in Level 4 Schools
June 2013
An Evaluation and Policy Analysis conducted for the Massachusetts Department of Elementary and Secondary Education by INSTLL, LLC
Emerging and Sustaining Practices for School Turnaround
Authors: Brett Lane, President, INSTLL
Chris Unger, Senior Partner, INSTLL
Lauren Morando Rhim, LMR Consulting
INSTLL, LLC
The Institute for Strategic Leadership and Learning (INSTLL, LLC) is an education research and consulting firm that works with educational organizations, state education agencies, districts, and schools to promote meaningful improvements to our system of public education.
INSTLL works to support the development and spread of innovative ideas to improve public education by cultivating strategic leadership and learning, supporting the construction of a policy environment conducive to innovation and successful implementation of powerful ideas, and engaging in meaningful evaluations of the various strategies and interventions employed to support teaching and learning.
www.instll.com
Copyright © 2013 by the Institute for Strategic Leadership and Learning. Permission is granted to print or copy portions of or this entire document.
Emerging and Sustaining Practices for School Turnaround
Table of Contents
Executive Summary i
Introduction 1
Purposed, Methods, and Organization 2
Achievement Trends in Level 4 Schools 3
Emerging Practices for Sustained Turnaround
Sustaining Practice #1: Building a Community of Practice through Leadership, Shared Responsibility, and Professional Collaboration
Sustaining Practice #2: Improving Instruction and Interventions through Teacher- and Student-specific Data
Sustaining Practice #3: Providing Data-driven Tiered Instruction for All Students
4
District Systems and PracticesDistrict Actions Supporting School TurnaroundDistrict Actions Identified as Hindering Turnaround Efforts
13
Trends in District and School Use of SRG and Bridge Grant Funds Staffing, Time, and Resources: How and where did schools allocate funds?Improvement Focus: What was the focus and target of SRG funds?
17
Use of Turnaround Approaches and Flexibilities: Federal Intervention Models and Teacher Turnover Rates
23
Appendix A: List of Indicators of Measurable Annual Goals A
Appendix B: Description of Data Sources and Methodology B
Appendix C: Listing of Achievement Gain and Non-Gain schools C
Emerging and Sustaining Practices for School Turnaround
This page intentionally left blank
INSTLL

Executive Summary: Emerging and Sustaining Practices for School Turnaround
The experience of Massachusetts’ Level 4 schools provides a compelling test case of what it takes to leverage, support, and sustain turnaround efforts in our lowest performing schools. Changes in state law (e.g., the 2010 Act Relative to the Achievement Gap) provided districts and Level 4 schools with unprecedented ability to change the conditions in and around schools, as needed to directly improve teachers’ instruction and create a school climate conducive to accelerating learning. School Redesign Grant (SRG) funding provides resources to accelerate turnaround efforts, as well as build district capacity to support such efforts.
After two years (through the 2011-12 school year), some of the Level 4 schools are clearly on a path to rapid improvement while other schools are not—the glass is half full and half empty. While it is too early to judge whether or not the “turnaround” experiment is a success, we have the opportunity to use the rich data provided by these schools to explore why and how some have been able to make significant improvements through two years and to learn from their experience. The question is: What have we learned?
Of the original 34 schools designated as Level 4 in 2009, 14 schools are on target to meet their 3-year goals (we call these schools Achievement Gain schools), 9 schools have made little progress and are not on target (Non-
Gain schools), and 11 schools are partially on target to meet their goals.
Looking closely at the experience of all of the Level 4 schools, we found clear differences in how Achievement Gain schools are approaching and implementing turnaround efforts in comparison to Non-Gain schools. In providing these findings, we remind readers that these are generally descriptive trends and that there are some schools that have taken different paths to success. The “recipe” for each school is different, but the ingredients and supports, summarized here and presented in detail in the full report, are consistent and merit consideration as to how these efforts can be leveraged and further supported across all schools needing to accelerate student academic achievement.
Staffing and Teacher Turnover. Achievement Gain schools are more likely to have actively used staffing flexibility prior to (or during) the first year of turnaround, to ensure that the school would have teachers in place with the capacity, willingness, and skill to move forward. Of those schools that replaced over 50% of its teachers in the first year, 89% (8 of 9 schools) are Achievement Gain schools. In contrast, all nine of the Non-Gain schools had teacher turnover rates of 35% or less in their first year (2010-11).
i
Strategies, Policies, and Use of Resources: A Roadmap to Sustainable Turnaround
Get the right leaders and teachers in place, with the expertise, willingness and skill to improve.
Establish a safe and orderly environment for learning.
Employ intentional and deliberate practices and data-driven systems to: (1) provide students with tiered instruction, (2) improve teachers’ instruction, and (3) cultivate a community of practice with shared responsibility for the achievement of all students.
Organize district staff and resources to support turnaround schools.
Strategically allocate resources, including partners and external expertise, towards direct instruction and support for students.

Executive Summary: Emerging and Sustaining Practices for School Turnaround
Emerging and Sustaining Practices. Achievement Gain schools are characterized by a sophisticated and aligned use of key practices while schools not on a positive achievement trajectory may be lacking essential practices or exhibit a general or uncoordinated use of existing structures and systems.
The intentionality and intensity of these key practices is what distinguishes the work in Achievement Gain schools. After establishing a safe and positive climate for learning, Achievement Gain schools galvanized a collective focus on student achievement and employed deliberate systems to improve instruction (e.g., intensive coaching for teachers, useful principal and peer classroom observations), and a substantive tiered approach to instruction (for students and for teachers).
District Actions Supporting School Turnaround. The actions and policy shifts enacted by districts have played a crucial role in supporting school-level turnaround efforts. Overall, districts have used changes in state law and funding opportunities (e.g., Race to the Top and SRG) as an opportunity to build district capacity and change policies that directly impact school-based turnaround efforts. These shifts in actions and policies should not be minimized, as previous efforts to improve low performing schools (in Massachusetts and across the nation) have often ignored the importance of district actions as a catalyst and as a means of sustaining turnaround efforts. District actions that appear to support school turnaround include focusing district resources and organizing staff to support specific turnaround efforts, providing flexibility to turnaround schools around staffing and resources, and investing in and supporting the use of a coherent curriculum and meaningful, timely, and useful assessments. There is also evidence of districts learning from their experience and applying effective strategies in other schools in the district.
Strategic Use of Resources. In 2010-11 and 2011-12, 30 schools (SRG Cohorts 1 and 2) were awarded a total of $27.36 million dollars (excluding fringe benefits). The average annual SRG funding was $577 thousand per year, which translates to approximately $1077 dollars per student. Of the $27.36 million provided to schools, 34.5% ($9.44 million) was used to compensate teachers and teacher assistants for extended learning time (e.g., extending the school day by approximately 300 hours over the school year). Key findings from our analysis of SRG budgets are as follows:
Districts and schools allocated SRG funds in different ways, focusing on addressing identified priorities and areas of need. The variation in how districts allocated funds suggests that there is no “best way” to allocate funds within the district; rather, there are multiple routes to providing the Conditions for School Effectiveness and supporting school turnaround.
Achievement Gain schools tended to allocate higher percentages of funds towards the direct instruction of students and job-embedded, teacher-specific professional development, e.g., classroom-based coaching.
In contrast, Non-Gain schools expended a higher percentage of funding to address social-emotional and behavioral issues.
ii
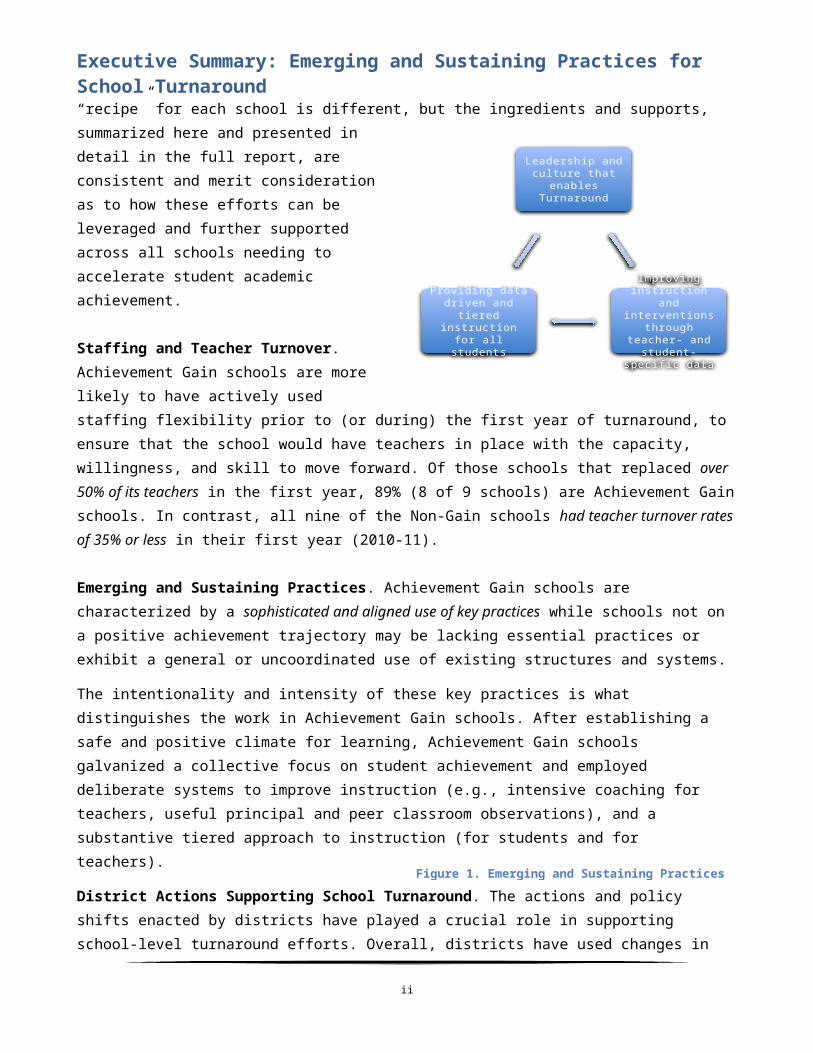
Leadership and culture that enables
Turnaround
Improving instruction and interventions
through teacher- and student-specific
data
Providing data driven and tiered instruction for all
students
Figure 1. Emerging and Sustaining Practices

Emerging and Sustaining Practices for School Turnaround
IntroductionThe spring 2012 report, Emerging Practices in Rapid Achievement Gain Schools, explored and documented a set of “emerging practices” that appeared to be contributing to the rapid achievement gains in a subset of the Level 4 schools. We found evidence that schools showing rapid gains in achievement were leveraging the increased flexibility granted by the 2010 Act Relative to the Achievement Gap to directly address many of the challenges that have stymied traditional school improvement efforts. Districts recruited and hired new and dynamic principals to lead many of the Level 4 schools. These leaders were able to implement structures and systems that developed collective responsibility for improving student achievement and provided teachers the time and tools to quickly modify, improve and deliver more effective instruction.
The original 34 Level 4 schools are now in their third year of turnaround (in 2012-13) and we have two years of data (from 2010-11 and 2011-12) documenting their efforts. We examined these data to determine why some schools have continued or maintained a positive “achievement trajectory,” while other schools have experienced two years of minimal gains in student achievement. Understanding why and how some of the Level 4 schools are progressing will inform the state’s continued refinement of policies and implementation of supports to districts as they continue to adjust current efforts to turnaround underperforming schools.
Achievement Gain Schools
For the purpose of this report and our analysis, Achievement Gain schools are those schools that have already met, or are very close to meeting (e.g., within 20%) the academic components of their Measurable Annual Goals1 (MAGs). To be within 20% of meeting MAGs, a school would have had to have made significantly positive gains in student achievement in one year, and then maintained these gains in the following year, or the school made strong gains in achievement (in math and English) for two consecutive years. We call these schools “Achievement Gain” schools. In contrast, schools that are more than 60% away from meeting their MAGs and have we identified as “Non-Gain” schools; these schools demonstrated little to no gains in achievement over two years, from 2010 to 2012.2
Inquiry Questions
This report builds upon the emerging practices identified in our previous report3 by identifying and describing specific practices in Achievement Gain schools that, after two years, appear to be contributing to schools’ ability to produce and sustain rapid growth in student achievement.
Now that schools have gone through a full two years of implementing turnaround efforts, including receiving and using School Redesign Grant (SRG) funding4, this report provides an opportunity for a first look at how schools and districts have leveraged the turnaround approaches and flexibilities at their disposal, and how they allocated SRG funding to support school-level turnaround efforts.
1 Appendix A provides a listing of the performance measures that comprise the MAGs2 Refer to Appendix B for more details on the methodology used to identify Achievement gain and Non-Gain schools3 Emerging Practices in Rapid Achievement Gain Schools, 2012
Primary Inquiry QuestionsSustaining PracticesAre there particular strategies or practices observed in achievement gain schools that explain how schools have been able to accelerate and sustain students’ academic growth?
Levers and Use of Resources
What can we learn from schools that are on course to meet measurable annual goals (MAGs) in contrast to schools that are not on target, with respect to: (1) use of turnaround approaches, flexibilities, and conditions; (2) strategic use of resources; and (3) district supports?
Page 1 of 24
Emerging and Sustaining Practices for School Turnaround
Purpose, Methods, and Organization Research and experience here in Massachusetts, including the current efforts underway in Level 4 schools, tell us that turnaround5—rapid and dramatic improvements in school operations, culture, and student achievement—is possible, but it does not happen by chance. Rather, successful turnaround efforts are strategic, planned, and require effective leadership. In conducting the comparative analysis of turnaround efforts across identified Achievement Gain and Non-Gain schools, we intended to contribute to the ongoing deliberation of how best to support turnaround schools and, to the extent possible, inform the strategic planning and modification of strategies in existing Level 4 schools.
Data Sources6. The primary data sources for this report include the spring 2011 and spring 2012 monitoring site visit reports (MSVs) and the SRG renewal applications for Cohort I (spring 2011 and 2012) and Cohort II (spring 2012). A detailed analysis of documents from Achievement Gain schools and Non-Gain schools provides the core evidence for our Emerging and Sustaining Practices. The 2010-11 and 2011-12 amended budgets for each school were used in the Budget Analysis.
Organization of the Report
Beginning on the following page, we provide an overview of achievement trends in Level 4 schools, from 2010 to 2012.
Next, we present our high-level findings around sustaining practices in Achievement Gain schools, followed by three two-page overviews of each practice that provide additional detail and a bulleted comparison of the practices in the Achievement Gain schools and Non-Gain schools.
The remaining sections provide descriptive data and analysis of district systems to support school-level turnaround, how schools are using SRG resources, and the relationship between teacher turnover rates and the extent to which schools have quickly improved instruction and student achievement.
4 In Massachusetts, the federal School Improvement Grant (SIG) is named the School Redesign Grant (SRG).5 We use the term “turnaround” to describe the efforts of all Level 4 schools, regardless of the particular federal model or approach used by the school. When referenced, the federal Turnaround or Transformation models are capitalized. 6 Our approach and methodology for this analysis in provided in Appendix B.
What is different in this report?
For those readers familiar with the 2012 Emerging Practices report, we highlight the following distinctions in methodology and focus in this report.
We based identification of Achievement Gain schools and Non-Gain schools on the extent to which each school is meeting its MAGs.
We provide a detailed analysis of how schools have allocated SRG funding, including the extent to which consultants and providers are engaged and contributing to turnaround efforts.
We examine the relationship between teacher turnover, as a particular aspect of the Turnaround and Transformation models, and two-year achievement trends (again, using MAGs as a proxy for achievement gains).
We analyze how districts are developing systems and providing supports to support school-level turnaround efforts.
Where feasible, we examine practices that may be contributing to gains among certain populations of students.
Page 2 of 24
Emerging and Sustaining Practices for School Turnaround
Achievement Trends in Level 4 Schools: 2010 to 2012Of the original 34 schools designated as Level 4 in 2009, 14 schools are on target to meet their 3-year MAGs (Achievement Gain Schools), 9 schools have made little progress and are not on target (Non-Gain Schools), and 11 schools are partially on target, but still have much work to do to meet their Year 3 MAGs. The Composite Performance Index (CPI) Achievement Gap—a measure of the extent to which schools have closed achievement gaps between students in their own schools and the state average—illustrates the dramatically different levels of success observed across Level 4 schools. Between 2010 and 2012, Achievement Gain schools have decreased CPI Achievement Gaps by an average of 10 points in ELA and 15 points in
mathematics. In contrast, Non-Gain schools have experienced an average increase in (already large) CPI Achievement Gaps of 1.1 point in ELA and 3.7 points in mathematics.
Achievement Trends: Observations and Suggestions
There is a consistent achievement trajectory among many of the Achievement Gain and Non-Gain schools. Eight of the schools identified as making rapid gains in 2010-11 have continued to remain on target to meet their MAGs; similarly, seven of the schools that failed to make gains in 2010-11 continued to have difficulty, and did not make significant gains in 2011-12.
However, there are few cases of schools changing their improvement trajectory from 2010-11 to 2011-12, which leads to the question of why schools making gains would have trouble sustaining improvements, or why it took schools two years to see a jump in student achievement.7 Some schools that made significant gains in ELA or math in 2010-11 saw those gains erased the following year. Similarly, some schools not making gains in 2010-11 were able to improve in 2011-12. Using the CPI achievement gap as the standard measure for achievement gains, we identified five “gain-loss” schools that made gains in 2010-11 and then experienced declining achievement in 2011-12 (in either math or ELA) and three “loss-gain” schools that made minimal gains in 2010-11 and then experienced substantial gains in 2011-12.
Middle schools and high schools (with one exception) continue to have the most difficultly engaging in successful turnaround as evidenced by their lack of improvement in student achievement. Of the 10 schools that are more than two-thirds, or 66% away from meeting their MAGs, 7 are middle or high schools. In the one high school demonstrating progress, acheivement gains are evident among English Language Learners (ELLs), which is clearly important; however, little to no gains have been observed in other students in the school.
Emerging Practices for Sustained Turnaround
7 Appendix C provides full listing of Achievement Gain and non-Gain schools.
After a full two years of implementation, it is clear that some schools are on a positive achievement trajectory towards successful “turnaround” while others are not.
…Which suggests that an initial year one gain in achievement is a strong indicator of how schools will progress in year two.
We see evidence of schools making mid-course corrections to accelerate achievement; but there are also examples of schools failing to maintain initial gains in student achievement.
…Which suggests that driving dramatic improvement in urban high schools and middle schools may require a fundamentally different approach to school turnaround than what is currently being used in Level 4 schools.
Page 3 of 24
Emerging and Sustaining Practices for School Turnaround
Significant Finding
There remains a high degree of correlation between the use of the key practices identified in the 2012 Emerging Practices report and a school’s achievement trajectory.
Achievement Gain Schools with positive movement towards meeting MAGs and closing achievement gaps are characterized by a sophisticated use of key practices while schools not on a positive achievement trajectory are lacking in such key practices and/or exhibit a
general or uncoordinated use of existing structures, resources, and systems.
The consistent achievement trajectory of Level 4 schools and the corresponding use of key practices in those schools making and sustaining gains gives us confidence in asserting that the emerging practices are practices that, if continued to be implemented, will sustain achievement gains and overall turnaround efforts.
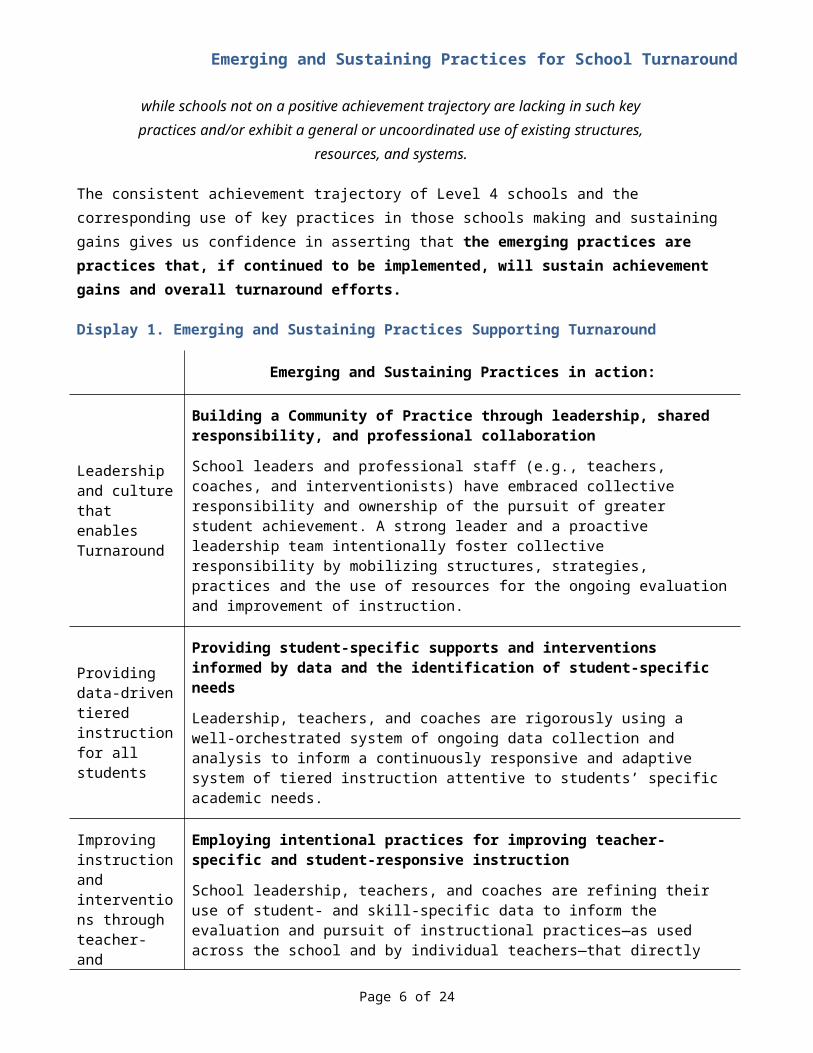
Display 1. Emerging and Sustaining Practices Supporting Turnaround
Emerging and Sustaining Practices in action:
Leadership and culture that enables Turnaround
Building a Community of Practice through leadership, shared responsibility, and professional collaboration
School leaders and professional staff (e.g., teachers, coaches, and interventionists) have embraced collective responsibility and ownership of the pursuit of greater student achievement. A strong leader and a proactive leadership team intentionally foster collective responsibility by mobilizing structures, strategies, practices and the use of resources for the ongoing evaluation and improvement of instruction.
Providing data-driven tiered instruction for all students
Providing student-specific supports and interventions informed by data and the identification of student-specific needs
Leadership, teachers, and coaches are rigorously using a well-orchestrated system of ongoing data collection and analysis to inform a continuously responsive and adaptive system of tiered instruction attentive to students’ specific academic needs.
Improving instruction and interventions through teacher- and student-specific data
Employing intentional practices for improving teacher-specific and student-responsive instruction
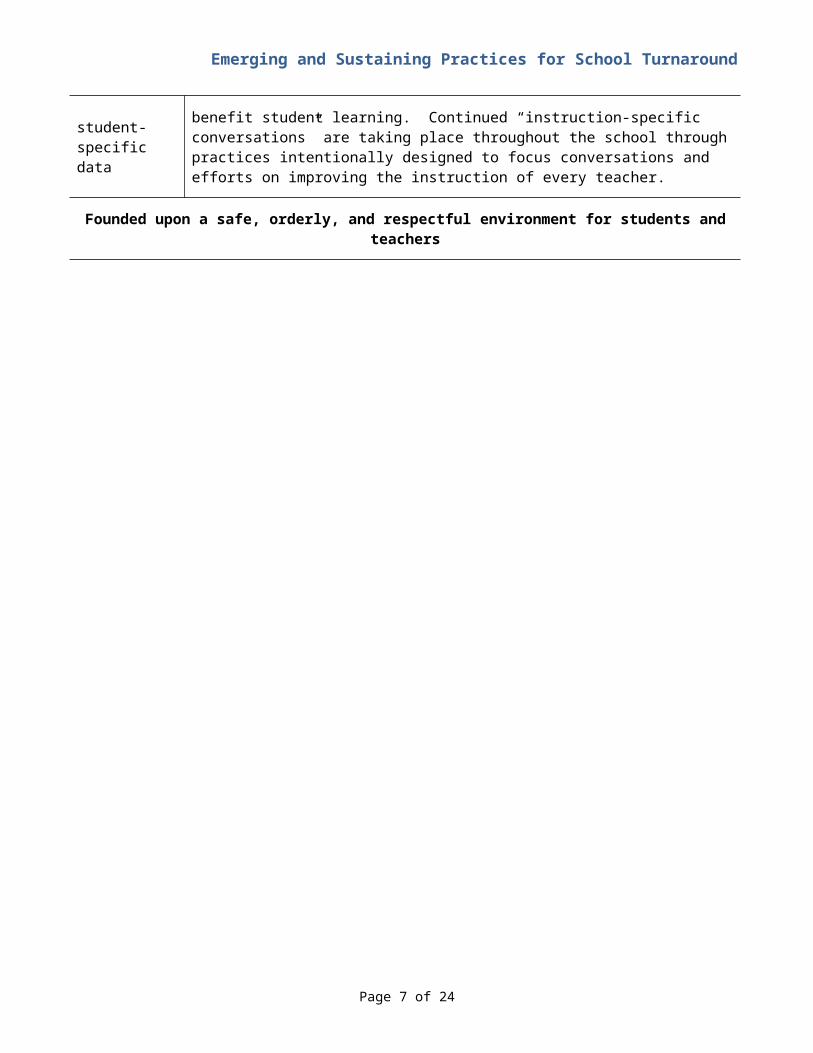
School leadership, teachers, and coaches are refining their use of student- and skill-specific data to inform the evaluation and pursuit of instructional practices—as used across the school and by individual teachers—that directly benefit student learning. Continued “instruction-specific conversations” are taking place throughout the school through practices intentionally designed to focus conversations and efforts on improving the instruction of every teacher.
Founded upon a safe, orderly, and respectful environment for students and teachers
Page 4 of 24
Emerging and Sustaining Practices for School Turnaround
Sustaining Turnaround: What are we learning?
A safe, orderly, and respectful school environment for both students and teachers in the building is a crucial and foundational first step for a successful turnaround. Schools that have not developed a positive school climate are not having success. Next, turnaround schools have cultivated a high-functioning community of practice, with good, effective leadership and structures and practices that drive improvements in the delivery of instruction. Building upon a positive culture of trust and respect, successful turnaround schools refine how they manage the instructional core by actively monitoring and providing teachers the feedback they need to improve their practice and provide quality instruction to all students; in short, they have a tiered system of support for improving teacher instruction. Finally, successful turnarounds employ an effective and robust tiered system of instructional support that ensures that each student receives the academic and social supports needed to accelerate improvement.
What is making the difference in schools able to make and sustain achievement gains over two years?
The sustaining practices, as outlined above and described in the following pages, provide an evidence-based set of practices that characterize what is happening in Achievement Gain schools. Digging deeper into the data, we asked: what is really important—what are the essential ingredients—that are driving Achievement Gain schools to have the success they are showing to date?
Effective Management of Classroom Instruction: A tiered approach to teacher development.
A key ingredient contributing to the ability of Achievement Gain schools to sustain turnaround efforts is the development of a tiered approach to improving teachers’ instruction that directly supports sustained improvement in student achievement.
In 2010-11, schools making rapid gains developed and were actively using a wide array of formative and summative assessments to inform and modify instructional strategies and to quickly provide appropriate interventions to students. In 2011-12, schools with continued and sustained achievement gains created systems and feedback loops that enabled a “tiered system of support” to be in place for teachers, as well as for students. Whereas a system of tiered instruction for students is focused on targeting specific interventions to students, current Achievement Gain schools are also developing systems that directly enable leaders to identify teacher-specific needs and provide teacher-specific guidance and feedback on instruction. In essence, these schools are developing systems to effectively and precisely manage the instructional core to deliver high-quality instruction to each and every student.
In Achievement Gain schools, observations of teachers’ instruction (by principals, coaches, or other teachers) leads to proactive identification of ways to improve instruction, which is quickly addressed through specific, individual, and teacher-focused feedback and support provided by coaches, or through grade-level team meetings. The strategy is “tiered” in that schools are differentiating their approach to improving teachers’ instruction, customizing and providing need-based support to teachers on an individual basis. In some schools, approaches to improving instruction were team-based, where instructional coaches supported teacher teams to effectively review data and develop strategies and action plans to meet the needs of their students. In other instances, and where the need was identified, coaches worked directly with individual teachers to provide specific feedback and coaching based on classroom observations, including modeling instruction and co-teaching.
Page 5 of 24
Emerging and Sustaining Practices for School Turnaround
Establishing and Maintaining a Safe, Orderly, and Respectful School Climate
Establishing and maintaining an environment conducive to student learning continues to be foundational to successful turnaround, serving as the basis for the purposeful pursuit of student achievement through deliberate and shared practices. Achievement Gain schools were characterized by a safe and respectful environment for professionals and for students. In contrast, Level 4 schools that continued to struggle with student behavior and classroom management were less likely to experience consistent gains in student achievement. In some Non-Gain schools, the lack of a safe and orderly environment has undermined their ability to fully leverage additional resources (e.g., data systems and increased instructional time) and see the fruits of teachers’ efforts to improve instruction.
In many schools, a first step in initiating turnaround efforts involved the development of new routines, structures, and expectations for a safe, orderly, and supportive school environment. In schools where such transitions were observed or documented, immediate achievement gains were more likely to occur. Subsequent to developing shared expectations for student (and teacher to student) behavior and classroom management, principals have been able to build upon this foundation and focus teachers’ attention and work on meeting students’ academic needs through collaborative practices for the improvement of instruction.
Those schools that were able to establish a safe and orderly learning environment for students and begin to galvanize a collective focus on student achievement were the schools that evidenced the greatest immediate gains in 2010-11. And those schools that were able to build on this new environment with the development of deliberate systems to improve instruction, including a substantive tiered approach to instruction (for students and for teachers), evidenced the greatest sustained achievement gains through 2011-12.
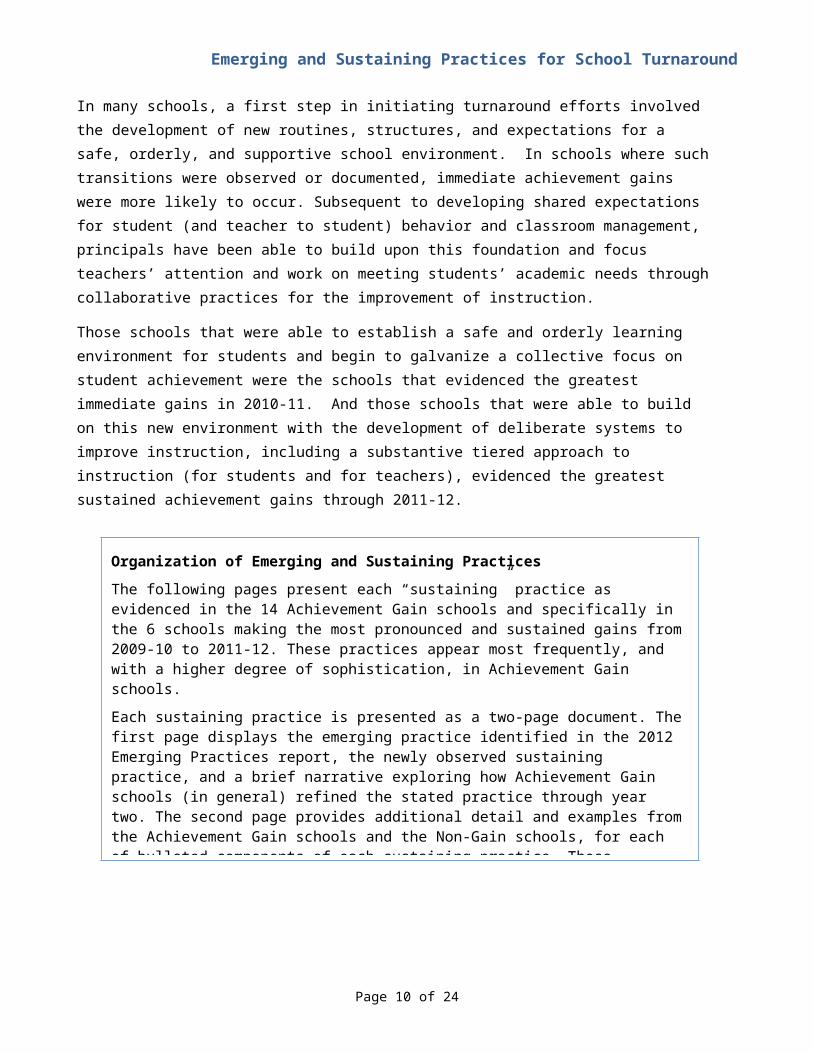
Organization of Emerging and Sustaining Practices
The following pages present each “sustaining” practice as evidenced in the 14 Achievement Gain schools and specifically in the 6 schools making the most pronounced and sustained gains from 2009-10 to 2011-12. These practices appear most frequently, and with a higher degree of sophistication, in Achievement Gain schools.
Each sustaining practice is presented as a two-page document. The first page displays the emerging practice identified in the 2012 Emerging Practices report, the newly observed sustaining practice, and a brief narrative exploring how Achievement Gain schools (in general) refined the stated practice through year two. The second page provides additional detail and examples from the Achievement Gain schools and the Non-Gain schools, for each of bulleted components of each sustaining practice. These examples are evidence-based, but are not necessarily present in each and every Achievement Gain school (or likewise, in each Non-Gain school).
We emphasize that these practices (and others, such as addressing students’ social-emotional health and having an aligned curriculum) are interrelated; therefore, we hypothesize that sustained turnaround and improvement is likely a function of how schools strive for these practices together, as a system, rather than as isolated practices.
Page 6 of 24
Emerging and Sustaining Practices for School Turnaround
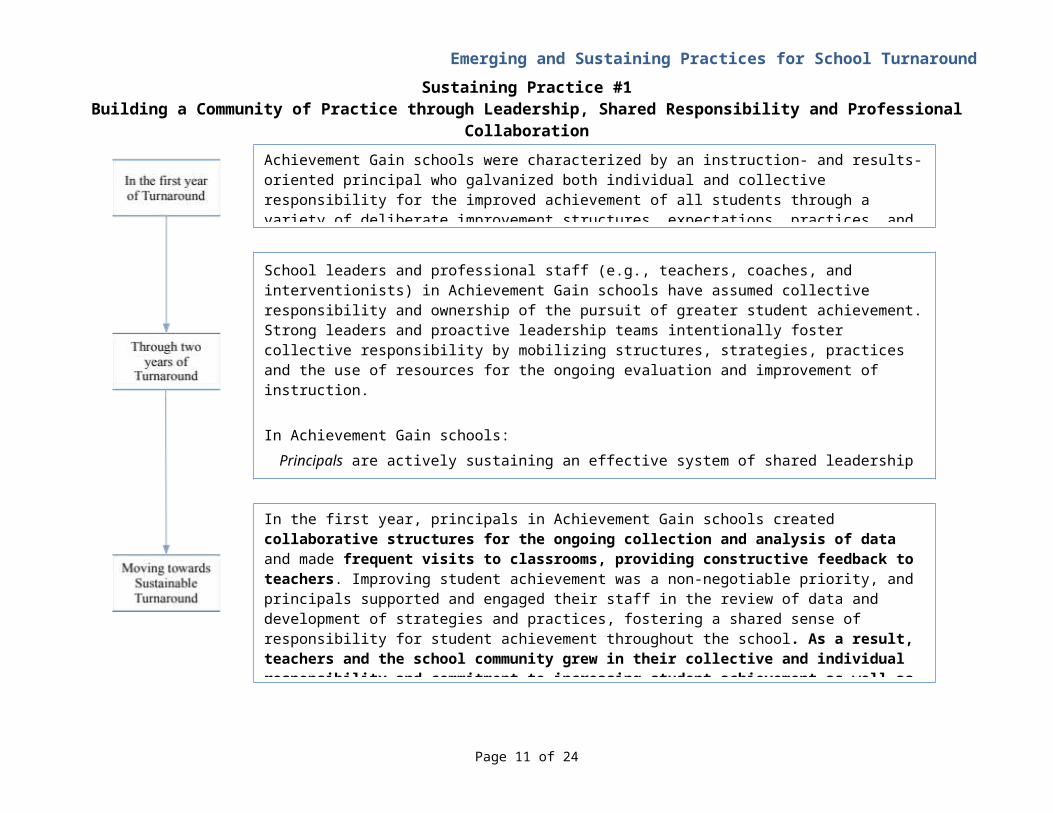
Sustaining Practice #1Building a Community of Practice through Leadership, Shared Responsibility and Professional Collaboration
Achievement Gain schools were characterized by an instruction- and results-oriented principal who galvanized both individual and collective responsibility for the improved achievement of all students through a variety of deliberate improvement structures, expectations, practices, and continuous feedback.
School leaders and professional staff (e.g., teachers, coaches, and interventionists) in Achievement Gain schools have assumed collective responsibility and ownership of the pursuit of greater student achievement. Strong leaders and proactive leadership teams intentionally foster collective responsibility by mobilizing structures, strategies, practices and the use of resources for the ongoing evaluation and improvement of instruction.
In Achievement Gain schools: Principals are actively sustaining an effective system of shared leadership and responsibility throughout the school. Leaders and teachers are jointly committed to and have assumed shared ownership and collective responsibility for improving student achievement. The professional environment is one of mutual respect, teamwork, and accountability.
In the first year, principals in Achievement Gain schools created collaborative structures for the ongoing collection and analysis of data and made frequent visits to classrooms, providing constructive feedback to teachers. Improving student achievement was a non-negotiable priority, and principals supported and engaged their staff in the review of data and development of strategies and practices, fostering a shared sense of responsibility for student achievement throughout the school. As a result, teachers and the school community grew in their collective and individual responsibility and commitment to increasing student achievement as well as greater responsiveness and transparency in decision-making throughout the school. In Achievement Gain schools, an instruction- and results-oriented leadership approach has emerged as collective accountability for increasing student achievement.
Page 7 of 24
Emerging and Sustaining Practices for School Turnaround
In schools making progress over two years… In contrast, schools not making progress over two years…
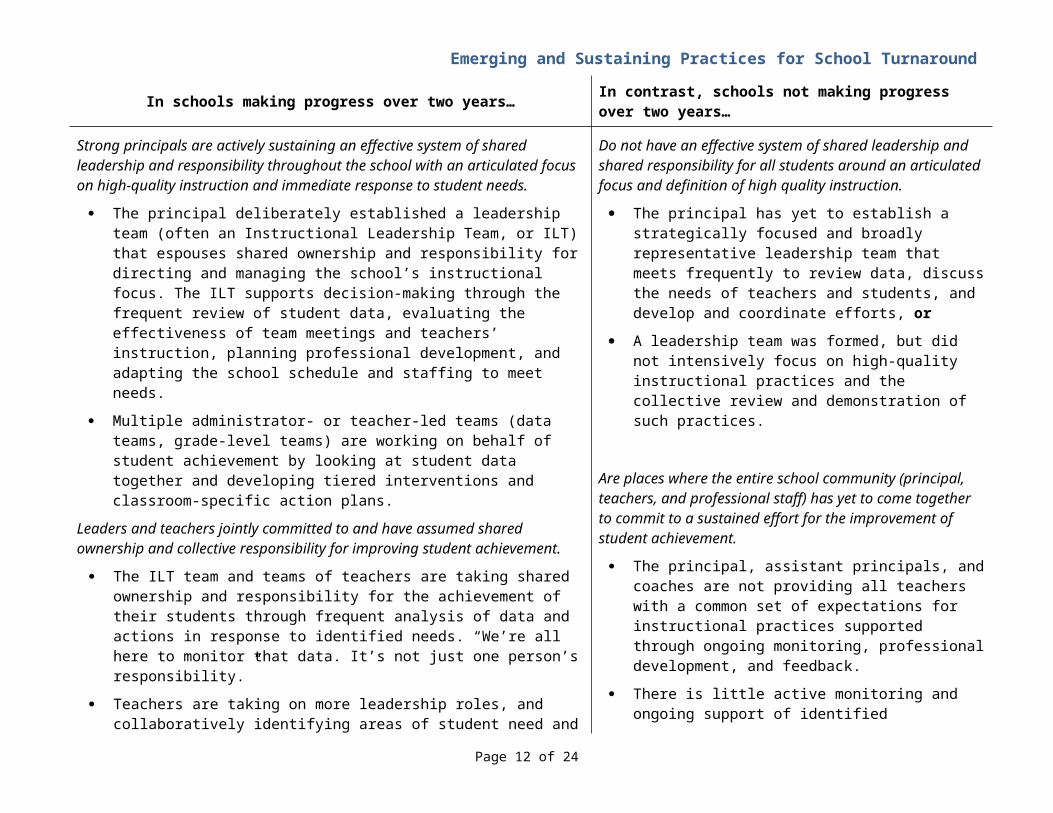
Strong principals are actively sustaining an effective system of shared leadership and responsibility throughout the school with an articulated focus on high-quality instruction and immediate response to student needs.
The principal deliberately established a leadership team (often an Instructional Leadership Team, or ILT) that espouses shared ownership and responsibility for directing and managing the school’s instructional focus. The ILT supports decision-making through the frequent review of student data, evaluating the effectiveness of team meetings and teachers’ instruction, planning professional development, and adapting the school schedule and staffing to meet needs.
Multiple administrator- or teacher-led teams (data teams, grade-level teams) are working on behalf of student achievement by looking at student data together and developing tiered interventions and classroom-specific action plans.
Leaders and teachers jointly committed to and have assumed shared ownership and collective responsibility for improving student achievement.
The ILT team and teams of teachers are taking shared ownership and responsibility for the achievement of their students through frequent analysis of data and actions in response to identified needs. “We’re all here to monitor that data. It’s not just one person’s responsibility.”
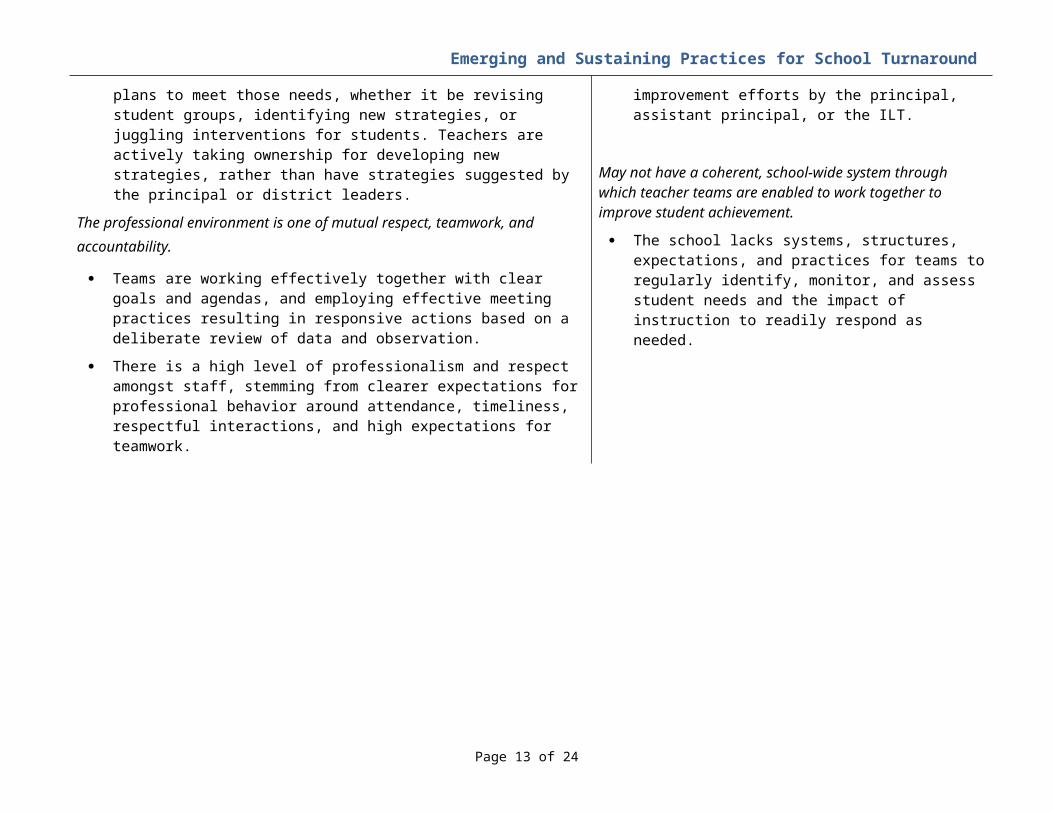
Teachers are taking on more leadership roles, and collaboratively identifying areas of student need and plans to meet those needs, whether it be revising student groups, identifying new strategies, or juggling interventions for students. Teachers are actively taking ownership for developing new strategies, rather than have strategies suggested by the principal or district leaders.
The professional environment is one of mutual respect, teamwork, and accountability.
Teams are working effectively together with clear goals and agendas, and employing effective meeting practices resulting in responsive actions based on a deliberate review of data and observation.
There is a high level of professionalism and respect amongst staff, stemming from clearer expectations for professional behavior around attendance, timeliness, respectful interactions, and high expectations for teamwork.
Do not have an effective system of shared leadership and shared responsibility for all students around an articulated focus and definition of high quality instruction.
The principal has yet to establish a strategically focused and broadly representative leadership team that meets frequently to review data, discuss the needs of teachers and students, and develop and coordinate efforts, or
A leadership team was formed, but did not intensively focus on high-quality instructional practices and the collective review and demonstration of such practices.
Are places where the entire school community (principal, teachers, and professional staff) has yet to come together to commit to a sustained effort for the improvement of student achievement.
The principal, assistant principals, and coaches are not providing all teachers with a common set of expectations for instructional practices supported through ongoing monitoring, professional development, and feedback.
There is little active monitoring and ongoing support of identified improvement efforts by the principal, assistant principal, or the ILT.
May not have a coherent, school-wide system through which teacher teams are enabled to work together to improve student achievement.
The school lacks systems, structures, expectations, and practices for teams to regularly identify, monitor, and assess student needs and the impact of instruction to readily respond as needed.
Page 8 of 24
Emerging and Sustaining Practices for School Turnaround
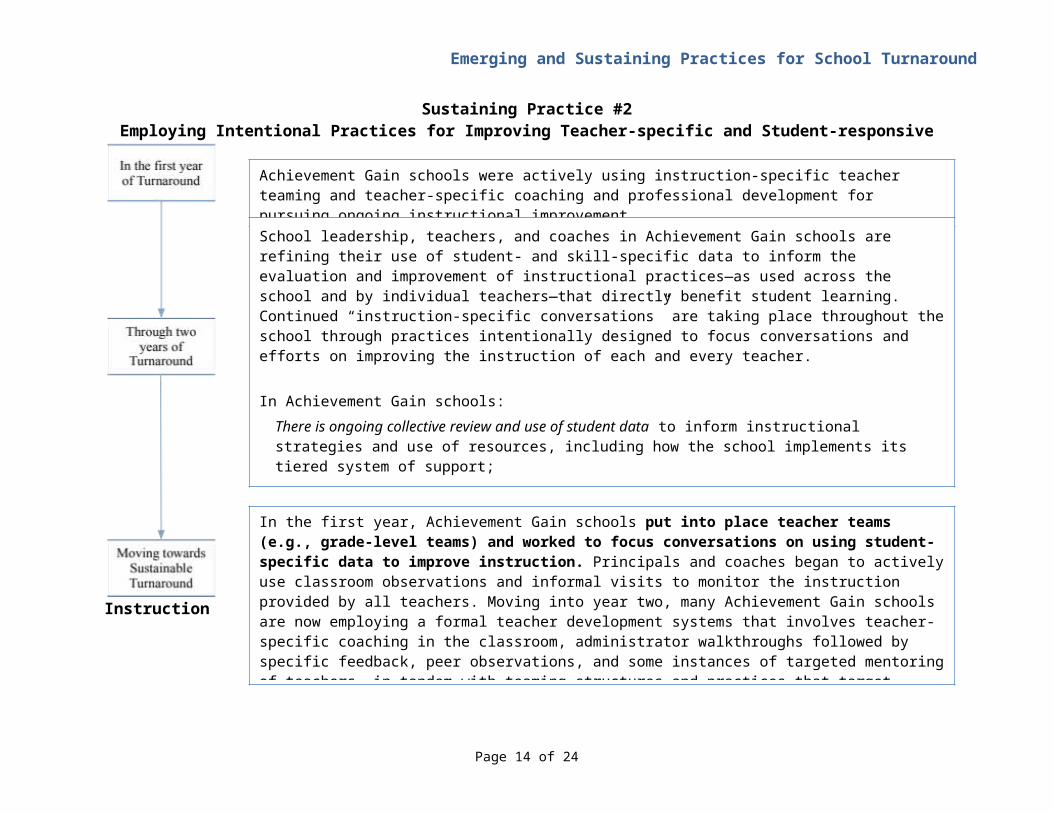
Sustaining Practice #2Employing Intentional Practices for Improving Teacher-specific and Student-responsive Instruction
Achievement Gain schools were actively using instruction-specific teacher teaming and teacher-specific coaching and professional development for pursuing ongoing instructional improvement.
School leadership, teachers, and coaches in Achievement Gain schools are refining their use of student- and skill-specific data to inform the evaluation and improvement of instructional practices—as used across the school and by individual teachers—that directly benefit student learning. Continued “instruction-specific conversations” are taking place throughout the school through practices intentionally designed to focus conversations and efforts on improving the instruction of each and every teacher.
In Achievement Gain schools: There is ongoing collective review and use of student data to inform instructional strategies and use of resources, including how the school implements its tiered system of support;Principals spend significant time in classrooms, observing teachers and providing teachers with constructive, teacher-specific feedback. In some cases, peer-observation by teachers is used to support learning among teachers within and across grade levels; andProfessional conversations, targeted coaching, and professional development is perceived as effective and is directly informed by data and observations of what is working (e.g., helping students to improve) and what is not.
In the first year, Achievement Gain schools put into place teacher teams (e.g., grade-level teams) and worked to focus conversations on using student-specific data to improve instruction. Principals and coaches began to actively use classroom observations and informal visits to monitor the instruction provided by all teachers. Moving into year two, many Achievement Gain schools are now employing a formal teacher development systems that involves teacher-specific coaching in the classroom, administrator walkthroughs followed by specific feedback, peer observations, and some instances of targeted mentoring of teachers, in tandem with teaming structures and practices that target effective, student-driven instruction. As a result, schools have developed a tiered system for supporting teachers as well as students. In some of the Achievement Gain schools, school-wide use of research-based instructional models (e.g., Cornerstone or the Workshop model) is providing a coherent framework for instructional improvement.
Page 9 of 24
Emerging and Sustaining Practices for School Turnaround
In schools making progress over two years… In contrast, schools not making progress over two years…
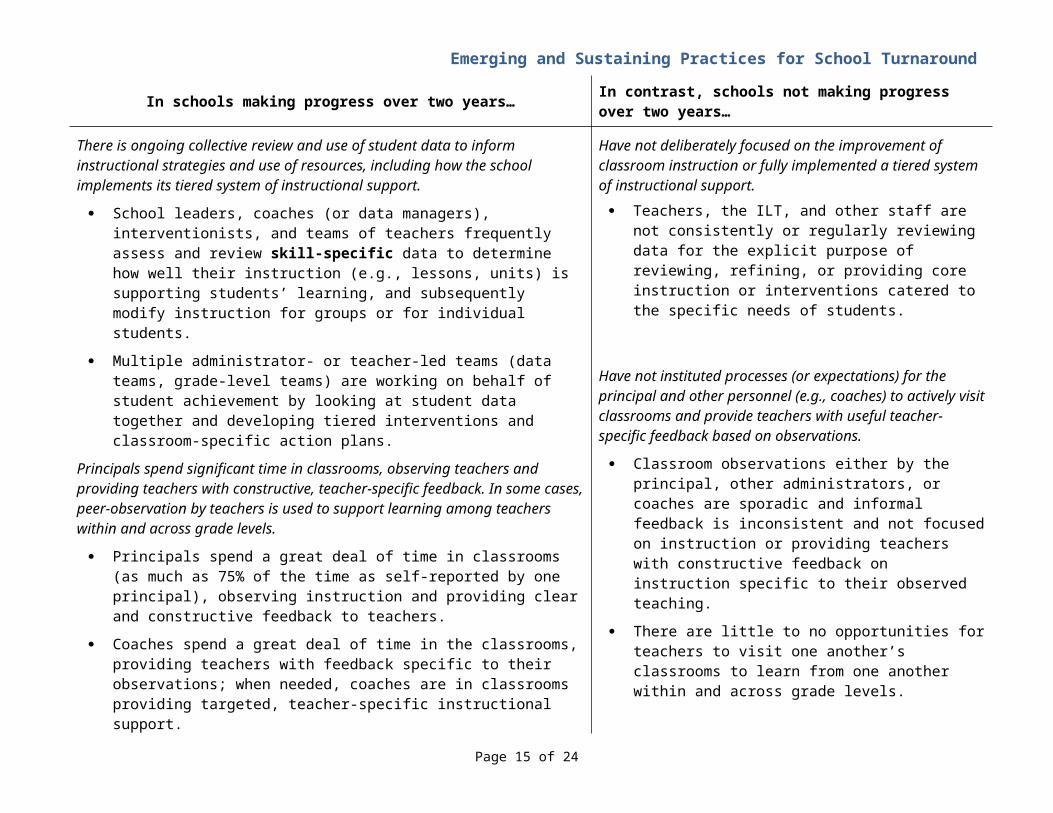
There is ongoing collective review and use of student data to inform instructional strategies and use of resources, including how the school implements its tiered system of instructional support.
School leaders, coaches (or data managers), interventionists, and teams of teachers frequently assess and review skill-specific data to determine how well their instruction (e.g., lessons, units) is supporting students’ learning, and subsequently modify instruction for groups or for individual students.
Multiple administrator- or teacher-led teams (data teams, grade-level teams) are working on behalf of student achievement by looking at student data together and developing tiered interventions and classroom-specific action plans.
Principals spend significant time in classrooms, observing teachers and providing teachers with constructive, teacher-specific feedback. In some cases, peer-observation by teachers is used to support learning among teachers within and across grade levels.
Principals spend a great deal of time in classrooms (as much as 75% of the time as self-reported by one principal), observing instruction and providing clear and constructive feedback to teachers.
Coaches spend a great deal of time in the classrooms, providing teachers with feedback specific to their observations; when needed, coaches are in classrooms providing targeted, teacher-specific instructional support.
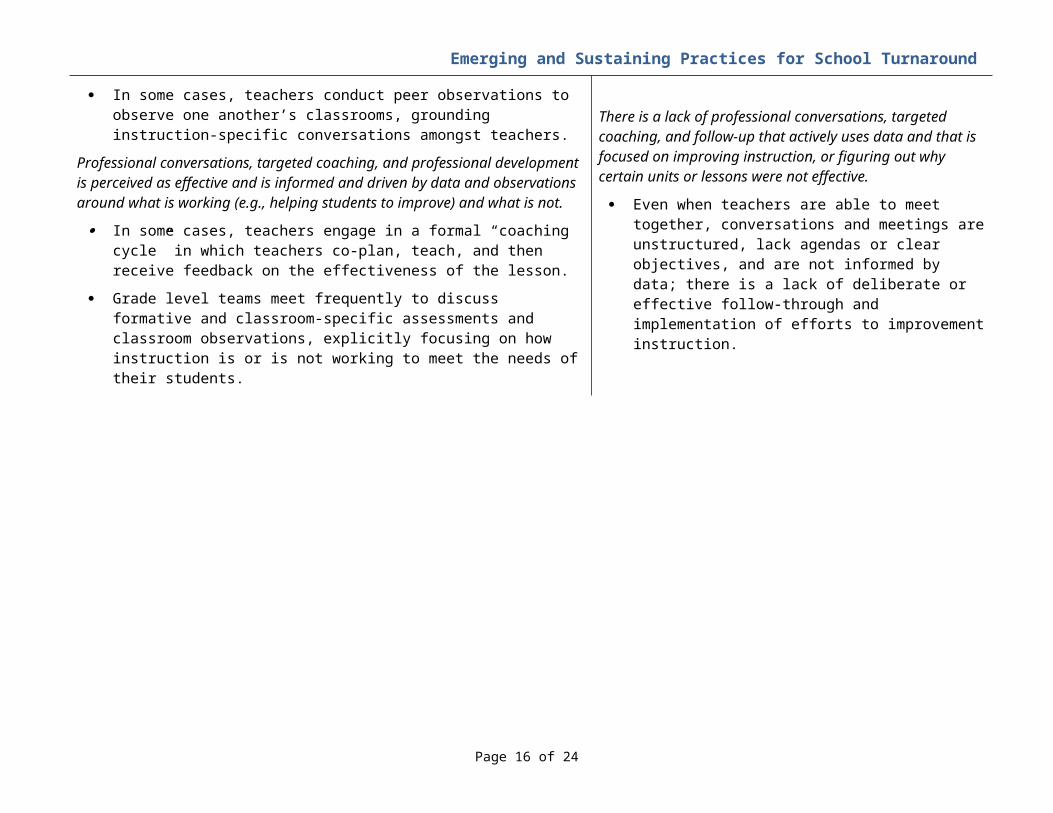
In some cases, teachers conduct peer observations to observe one another’s classrooms, grounding instruction-specific conversations amongst teachers.
Professional conversations, targeted coaching, and professional development is perceived as effective and is informed and driven by data and observations around what is working (e.g., helping students to improve) and what is not.
In some cases, teachers engage in a formal “coaching cycle” in which teachers co-plan, teach, and then receive feedback on the effectiveness of the lesson.
Grade level teams meet frequently to discuss formative and classroom-specific assessments and classroom observations, explicitly focusing on how instruction is or is not working to meet the needs of their students.
Have not deliberately focused on the improvement of classroom instruction or fully implemented a tiered system of instructional support. Teachers, the ILT, and other staff are not consistently or
regularly reviewing data for the explicit purpose of reviewing, refining, or providing core instruction or interventions catered to the specific needs of students.
Have not instituted processes (or expectations) for the principal and other personnel (e.g., coaches) to actively visit classrooms and provide teachers with useful teacher-specific feedback based on observations.
Classroom observations either by the principal, other administrators, or coaches are sporadic and informal feedback is inconsistent and not focused on instruction or providing teachers with constructive feedback on instruction specific to their observed teaching.
There are little to no opportunities for teachers to visit one another’s classrooms to learn from one another within and across grade levels.
There is a lack of professional conversations, targeted coaching, and follow-up that actively uses data and that is focused on improving instruction, or figuring out why certain units or lessons were not effective.
Even when teachers are able to meet together, conversations and meetings are unstructured, lack agendas or clear objectives, and are not informed by data; there is a lack of deliberate or effective follow-through and implementation of efforts to improvement instruction.
Page 10 of 24
Emerging and Sustaining Practices for School Turnaround
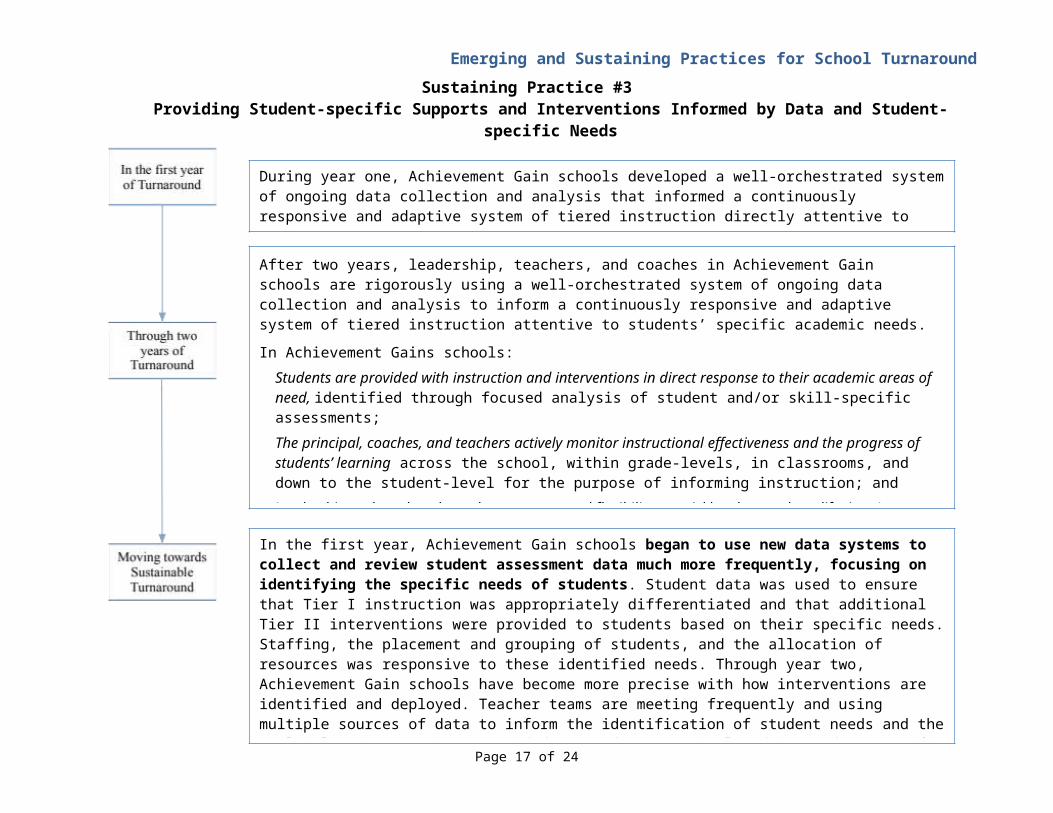
Sustaining Practice #3Providing Student-specific Supports and Interventions Informed by Data and Student-specific Needs
During year one, Achievement Gain schools developed a well-orchestrated system of ongoing data collection and analysis that informed a continuously responsive and adaptive system of tiered instruction directly attentive to students’ specific academic needs.
After two years, leadership, teachers, and coaches in Achievement Gain schools are rigorously using a well-orchestrated system of ongoing data collection and analysis to inform a continuously responsive and adaptive system of tiered instruction attentive to students’ specific academic needs.
In Achievement Gains schools: Students are provided with instruction and interventions in direct response to their academic areas of need, identified through focused analysis of student and/or skill-specific assessments;The principal, coaches, and teachers actively monitor instructional effectiveness and the progress of students’ learning across the school, within grade-levels, in classrooms, and down to the student-level for the purpose of informing instruction; andLeadership and teachers have the autonomy and flexibility to quickly adapt and modify time (e.g., schedules), resources (e.g., people and interventionists), and interventions to directly and immediately meet student-specific needs.
In the first year, Achievement Gain schools began to use new data systems to collect and review student assessment data much more frequently, focusing on identifying the specific needs of students. Student data was used to ensure that Tier I instruction was appropriately differentiated and that additional Tier II interventions were provided to students based on their specific needs. Staffing, the placement and grouping of students, and the allocation of resources was responsive to these identified needs. Through year two, Achievement Gain schools have become more precise with how interventions are identified and deployed. Teacher teams are meeting frequently and using multiple sources of data to inform the identification of student needs and the (multiple) interventions provided to students, articulated in student-specific actions plans. Schedules are modified to maximize the use of resources (e.g., teachers, enrichment, tutors) that provide targeted support to more students, and with greater intensity, than in year one (and significantly more than in pre-turnaround efforts.) As a result, Achievement Gain schools are moving from “routine” use of a tiered system of instructional support to continuously improving and refining the precision of instruction provided to students.
Page 11 of 24
Emerging and Sustaining Practices for School Turnaround
In schools making progress over two years… In contrast, schools not making progress over two years…
Students are provided with instruction and interventions in direct response to their academic areas of need, identified through focused analysis of student and/or skill-specific assessments
Data from multiple sources is typically reviewed and discussed in data team, grade level, or ILT meetings. Teams conduct item analyses to identify needed student skill development and develop action plans to attend to those specific needs, whether that means re-teaching to the whole class, in small groups, or individually.
Follow-up assessments (such as DIBELS, aimsweb Maze, and ANet) inform the degree to which students make progress, and if not, what other strategies or interventions can be taken to address the students’ lack of progress.
The principal, coaches, and teachers actively monitor instructional effectiveness and the progress of students’ learning, across the school, in grades, in classrooms, and down to the student-level, for the purpose of deliberately informing classroom instruction.
The ILT, teachers, and interventionist closely monitor student progress on specific skills, collecting and quickly sharing data with teachers throughout the school. For example, one school was able to pinpoint which classrooms (and teachers) were able to maximize MCAS-related skill instructions, and why.
Leadership and teachers have the autonomy and flexibility to quickly adapt and modify time (e.g., schedules,) resources (e.g., people and interventionists,) and interventions to directly and immediately meet student-specific needs.
The ILT and teachers adapt the schedule, deployment of interventions, and student groups in an ongoing fashion to ensure that students requiring additional instruction or interventions are provided with that instruction, additional supports, and interventions.
Upon review of student needs, teachers (in grade-levels) reorganize their student groupings allowing for teachers to attend to specific student needs dependent on their group. In addition, teachers and interventionists are strategically reassigned to work with different groups of students or individual students throughout the school day dependent on need.
Are collecting student data, but are not using this data to provide all students with instruction and interventions in direct response to their academic needs; the school lacks a deliberate approach for using data to inform student-specific instruction. Data collection and review does not allow for an ongoing
and adaptive response to students’ specific academic needs. Assessment data is not used to monitor student progress
and provide timely interventions; or there is a lack of common assessments when needed or appropriate.
Have a fragmented, or not fully operationally, system for monitoring classroom instruction and student achievement in individual classrooms. Formative and summative assessments are not regularly
used or reviewed to identify student progress and/or student-specific needs.
Teacher teams are not regularly reviewing and analyzing data for the explicit purpose of adapting or providing differentiated, student-specific tiered instruction to students.
Have not modified the school schedule or its use of resources in a manner that will dramatically improve teachers’ instruction and the culture of the school. The school community is not readily providing or adapting
its instructional response to students’ specific academic needs. Rather, most responses, if any, are general in nature and given to the whole group and not specific to the needs of groups or individuals students.
Page 12 of 24
Emerging and Sustaining Practices for School Turnaround
District Systems and PracticesOverall FindingDistricts shape the context in which schools operate and therefore have the unique ability to influence schools’ efforts to dramatically improve instruction and outcomes. Conversely, district actions, and inactions, can hamper turnaround efforts. Our review of the Monitoring Site Visit reports and district and school renewal applications indicates that there is not one specific district action or set of actions that guarantees turnaround success but there were actions that were repeatedly identified as supporting turnaround efforts.
Based on the data available8, it is not possible (or wise) to assign causation to district actions and supports. Nevertheless, in an effort to learn from how districts are striving to support turnaround efforts, we identified recurring themes regarding specific district actions perceived to support turnaround efforts. And, we saw patterns by comparing the district actions identified as helpful by Achievement Gain schools relative to those actions identified as barriers by Non-Gain schools. While this comparison is a relatively rough approach to identifying differentiating behaviors, it did reveal some differences in district actions and points to specific actions that directly support school turnaround efforts and those actions that clearly hinder turnaround efforts.
We pose these findings as potential District Actions Supporting (or Hindering) School Turnaround.
District Actions Supporting School Turnaround
8 Additional data regarding the nuances of implementation of some of these practices by individual schools even within the same district is necessary to being to be able to attribute causation.
A Cautionary Note about District FindingsIt bears noting that there were district actions (e.g., increased use of data) identified by Achievement Gain schools, Non-Gain schools, and schools making some progress in meeting MAGs. Similarly, Level 4 schools within the same district have had varying levels of success despite receiving similar supports from the district office.
If district capacity and support is crucial, why is there such variance in school performance, among Level 4 schools, within the same district? To this question, we offer the following possibilities:
It may be that the relative impact of district supports depends on school-level capacity, including the ability of the school to ask for and strategically use district resources and support. As a result, schools that lack the internal capacity to improve may not be able to take full advantage of district supports.
Or, it may be that districts have difficulty appropriately differentiating the support that they provide to schools. In this situation, it is not the school’s capacity—or lack thereof—that determines the effectiveness of district supports; rather, there is a lack of alignment, a mismatch, between what the district is providing to schools and what schools fully need in order to engage in successful turnaround.
While either of these hypotheses is feasible, we posit that the relationship between district supports and school turnaround is nuanced and that successful turnaround is likely a function of differing school capacity and district ability to differentiate support. Consequently, addressing both is essential to sustainable school turnaround.
Page 13 of 24
Emerging and Sustaining Practices for School Turnaround
Five specific clusters of district actions appear to have the ability to positively influence school-level turnaround efforts: (1) intentional district focus and/or reorganization to support turnaround; (2) district extension of school autonomy and flexibility; (3) district investment in a coherent curriculum that aligns with state standards; (4) district support for meaningful assessments and data analysis to inform decisions; and (5) district support for effective integration of external partners/providers.
1. The district focused organizational resources and (re) organized district staff to support turnaround by prioritizing turnaround efforts, intentionally articulating a framework for school improvement and aligning resources to support turnaround efforts within that framework.
Examples include:
Demonstrating that Level 4 schools are a priority by ensuring that multiple district staff members, including the superintendent or deputy, are actively engaged in turnaround efforts (e.g., communicate with school leaders, attend meetings, conduct classroom walkthroughs and monitor external providers).
Assigning a skilled district leader/liaison to Level 4 schools and establishing regular two-way communication system with school leaders, to: (a) help turnaround schools navigate district policies and procedures; (b) directly monitor schools and assess fidelity of implementation of turnaround initiatives; and (c) provide constructive feedback to school leaders and staff around key issues (e.g., data team meetings, curricular alignment, quality instruction, and use of extended learning time).
Reorganizing or revamping the district’s human resources department to improve recruitment and retention efforts with a focus on assigning qualified leaders and teachers to Level 4 schools in a timely manner.
Allocating additional resources to support turnaround priorities (e.g., assign a librarian, program specialist, social worker, bilingual paraprofessional/parent liaison, or part-time computer teacher or purchase computer lab and software, a pre-kindergarten program with two classes, Smart Boards, and computers in all classrooms).
2. The district extends Level 4 schools autonomy and flexibility to implement turnaround efforts by providing autonomy and flexibility around resources and directly addressing policies or district requirements that might hinder turnaround efforts.
Examples include:
Extending schools’ autonomy to allocate their budget according to their unique needs as opposed to a standard district formula wherein enrollment dictates a specific number of positions.
Addressing aspects of collective bargaining agreements that can undermine turnaround efforts, such as adjusting “bidding and bumping” language to protect staff recruited to work at Level 4 schools and avoid having to place ineffective teaches or leaders in Level 4 schools.
Waiving district assessment requirements if a school is already administering effective benchmark and predictive assessments to avoid devoting precious instructional time to redundant assessments.
3. The District invests in providing a coherent curriculum that aligns with standards and related training by establishing curriculum and curriculum maps and offering training to support implementation of core curriculum.
Page 14 of 24
Emerging and Sustaining Practices for School Turnaround
Examples include:
Providing coherent curriculum and requisite curriculum maps that serve as a foundation for turnaround efforts that rely on progress monitoring, focused interventions and data informed decision-making.
Introducing effective packaged programs that support the curriculum and address specific school-level needs.
4. The District supports meaningful assessments and data analysis to inform instructional decision making, by providing training on data use and supporting school- and classroom-walkthroughs focused on effective instructional practices.
Examples include:
Providing training around and supporting the effective implementation of data analysis to inform instructional decisions, through professional development, attending data team meetings, and tracking student data to monitor the effectiveness of interventions.
Conducting instructional leadership team walkthroughs and facilitating meetings and discussions based on walkthroughs focused on effective instructional practices.
5. The District supports effective integration of external partners/providers by helping schools with the selection and management of various providers with different areas of expertise and capacity.
Examples include:
Selecting and encouraging partnerships with established providers that build school capacity by introducing external expertise.
Managing key partnership in ways that further enhance the focus and impact of external partners, such as monitoring the work of external partners and working with external partners to ensure alignment of partner expertise and content with the district or school’s articulated approach to turnaround.
District Actions Identified as Hindering Turnaround Efforts
Across districts with Level 4 schools, four clusters of actions emerged as barriers to change. While some of these were the converse of actions that support change (e.g., control versus lack of control of hiring, adequate
“The data compiled by the teams conducting the walkthroughs are shared with the principal and instructional coaches. They then use the data to direct the focus of professional development sessions and provide general feedback to teachers. … The item-by-item analysis provided by the district gives valuable information about the types of questions students are missing, and the results are used to direct the focus of instructional coaches as they work with teachers.”
“The district’s adoption of Reading Street as a core reading program helped align curriculum for ELA. The reading program provides staff with consistent training and follow-up support. It is noted in our redesign plan that over 50% of our students are not meeting math and ELA targets. Recognizing there is a need to strengthen our core instruction in ELA and math for all subgroups, coaches provide teachers with training on how to use Reading Street for small group and individual instruction.”
“The district has been instrumental in providing additional resources, most importantly in the form of human capital for the school’s turnaround efforts. Programs and partnerships such as the BURST curriculum, City Connects, City Year, district coaches, Research for Better Teaching and a VISTA Data Coordinator, have increased <our school’s> capacity to make decisions based on data, provide compelling professional development and increase social-emotional supports for students.”
Page 15 of 24
Emerging and Sustaining Practices for School Turnaround
versus inadequate investment in turnaround), others illustrated the extent to which effective district supports depends on the individuals hired to implement the supports.
1. The lack of school-level autonomy or the differentiation of district supports to schools was repeatedly identified as a source of frustration by some schools, primarily because it requires schools to divert attention and resources from their specific priorities to district-wide priorities.
2. District directed shifts in human resources (or a lack of needed shifts) hindered improvement in some Level 4 schools. Identifying and keeping the right leaders and teachers in place is a crucial aspect of turnaround. Some districts have been unable to prioritize recruitment, retention, and monitoring of qualified school leaders for all of their schools. In some cases, districts have been slow to replace principals or leaders that have not worked out, even after just one year. Similarly, districts have had difficulty in identifying enough high quality, “turnaround” leaders to place in each Level 4 school; in a few instances, principals were not in place until the start of school year. Additional challenges include the cutting of crucial positions in year two of turnaround efforts and the lack of district attention to assigning key personnel (e.g., coaches or classroom substitutes) to work in Level 4 schools. Another human resource challenge resulted from the district assignment of students with highly specialized instruction needs (e.g., low-incidence disabilities) without providing adequate transition planning, training, or personnel.
3. An increase in district oversight and support that is not integrated and aligned with school turnaround efforts. In some instances, increased district supports may interfere with school turnaround efforts, such as when schools perceive that the district has not provided adequate curricular guidance, has not clearly articulated what “effective instruction” means, or has failed to explicitly link district goals with school or provider specific turnaround strategies.
4. School-level loss of confidence in district capacity to support schools to reach goals. Some schools expressed reservations about district oversight, in light of the perception that not all schools were implementing turnaround strategies effectively. Similarly, schools noted that key issues have yet to be resolved, such as negotiating with the teachers union or addressing looming budget cuts that will (and are) leading to the loss of personnel trained during turnaround efforts. Issues related to the sustainability of turnaround efforts—maintaining necessary staffing, strategic planning for sustainability, addressing unresolved policy issues—have the potential to undermine school confidence and fortitude moving forward.
“The District is currently regarding all Level 4 schools as identical, whereas each Level 4 school is distinctively different. One size fits all solutions do not work. Communication, training for personnel, support, initiatives, guidance, and departmental interventions need to be differentiated and specifically tailored to meet the needs of each individual school. When making high-stakes intervention decisions, fairness requires that each school in need of improvement be judged on its own merits and not on the basis of the group with which it is identified.”
“While we understand the district-level need for consistent data, these duplicate assessment efforts add additional layers of work on the part of teachers and administrators and detract from students’ learning time through the administration of unnecessary tests. Although some of the assessments are useful, there is little benefit from administering all of the district-mandated tests, including the Terra Nova, two predictive tests, a mid-year test, three sessions of DIBELS and TRC, and end-of-year assessments.”
Page 16 of 24
Emerging and Sustaining Practices for School Turnaround
Trends in District and School Use of SRG and Bridge Grant Funds Overview of Budget Analysis The federal School Improvement Grant (SIG) program—known as the School Redesign Grant, or SRG, in Massachusetts—provides districts and schools with unprecedented supplemental funding to accelerate district and school improvement efforts. Drawing upon the experience of previous school improvement efforts, the federal SIG program permits schools to competitively apply for up to 2 million dollars per year, for up to three years9. In 2009, upon learning that SIG funds could support the efforts of Level 4 schools, Massachusetts’ leaders strategically ensured that Level 4 schools (and other eligible schools, based on federal requirements) each had a competitive opportunity to apply for a meaningful amount of funding. To ensure this competitive opportunity, eligible schools were encouraged to submit SRG grant proposals in the range of $500 thousand dollars a year, for up to $1.5 million over three years10.
In 2010-11 and 2011-1211, 30 schools successfully applied for and received SRG funding. Excluding fringe benefits, approximately $27.36 million of SRG and Bridge Grant12 monies were provided directly to the 30 Cohort 1 and Cohort 2 schools, representing an aggregate 2-year per pupil expenditure of $1,679 per student.
Budget Analysis CategoriesThe analysis utilizes two different frames, or lenses, through which to consider how districts and schools allocate funds.
The Staffing, Time, and Resources lens provides a snapshot of how districts and schools allocate funds for the hiring of people, for stipends for teachers primarily as compensation for extended learning time and for professional development, and additional funding for consultants, materials, and other aspects of the work, such as incentives or travel.
The Improvement Focus lens distinguishes the purposes and intentionality of funds allocated for new staff, for time, and for resources. This lens drills down into the particular foci of each school’s turnaround effort; making distinctions, for instance, between one school’s funding of a new staff person focused on providing direct instruction to students, compared to another school’s hiring of an administrator to improve parent and community engagement.
9 The previous iteration of the SIG program, called Comprehensive School Reform (CSR), required that schools receive a minimum of $50 thousand dollars a year, for three years. While CSR did not specify a maximum award amount, the majority of states encouraged schools to apply for less than $100 thousand a year. One of the generally accepted failings of CSR is the use of a “minimum” award amount, leading to underfunding of school improvement efforts. 10 In addition to the SRG funding that is direct and supplemental funding for turnaround, districts and schools have access to and are also using supplemental funding through Race to the Top and existing Title I funding to support overall turnaround efforts. 11 The analysis is based on the two-year combined SRG and Bridge Grant funding allocate to Level 4 schools, during the 2010-11 and 2011-12 school years. A summary of the methodology used in the budget analysis is provided in Appendix B. 12 Bridge Grant funding was provided to the state’s lowest achieving schools to support planning for Level 4 required Turnaround Plans.
Staffing, Time and Resources: How and where did schools allocate funds?• Direct Staffing: Hiring full/part time staff• Stipends for required extended time, for
teachers and para-professionals.• Stipends for administrators, teachers and
substitutes (not part of required extended time) for professional development
• Consultants• Materials, including technology • Other (e.g., Incentives, Travel)
Improvement Focus: What was the foci and target of SIG funds?• Implementation and oversight• Redesign team planning• Direct instructional support to students• Formal professional development• Job-embedded professional development• Data (primarily new assessments)• Materials, including technology • Social-emotional programs and services• Parent and community engagement• Other/misc.
Page 17 of 24
Emerging and Sustaining Practices for School Turnaround
Staffing, Time, and Resources: How and where did schools allocate funds?
Excluding fringe benefits, $27.36 million of combined SRG program ($24.67 million) and Bridge Grant ($2.69 million) funding was awarded to 30 schools, in 2010-11 and 2011-12. As displayed in Chart 1, the largest portion (34.5% of total funds, $9.44 million) was allocated to compensate teachers and teacher assistants for extended time in school, stemming from the federal requirement to increase learning time13. The next largest allocation (23.6% of total funds, $6.45 million) went to direct hiring and staffing of additional teachers and administrators. After staffing, consulting (at $5.24 million) and additional stipends for teachers for professional development and summer work (at $4.05 million) were the next highest areas of funding.
Staffing, Time, and Resources: Analysis
Comparing the allocation of SRG resources across schools with different achievement trajectories, we found no apparent or statistical difference in how Achievement Gain schools and Non-Gain schools allocated SRG funds towards staffing, time, and resources.
Table 1. Percent allocation of SRG funding by Achievement Gain and Non-Gain schools, by Staffing, Time and Resources, 2010-2012
Staffing Stipends: Non-Extended Time
Stipends: Extended Time Consulting Materials Other Actual $
AmountAch. Gain Schools 22.3% 15.5% 35.1% 20.6% 6.1% 0.4% $9.94 mNon-Gain Schools 22.5% 13.4% 38.7% 18.7% 6.2% 1.9% $6.38 m
However, an analysis of the distribution of SIG resources by districts suggests that districts are allocating funds for staffing, time, and resources in different ways, stemming from contextual differences (e.g., the amount of funds needed to pay for extended time) and variance in district needs among Level 4 schools.
Table 2. Percent district14 allocation of SRG funding, by Staffing, Time and Resources, 2010-2012
Staffing Stipends: Non-Extended Time
Stipends: Extended Time Consulting Materials Other $ Amount; # of
Schools
Boston 25.7% 10.6% 34.9% 22.6% 5.5% 0.6% $13.17 m; 11 schools
Springfield 17.8% 23.4% 36.6% 14.5% 8.3% 0.6% $7.11 m; 9 schools
13 Increasing learning time for adults and students by altering schedules or extending the school day by approximately 300 hours over the school year was a requirement of the Turnaround and Transformation models.14 Districts with 2 or more SRG funded schools are included in tables displaying district information.
$6.45 m,
24%
$4.06 m,
15%
$9.44 m, 34%
$5.24 m, 19%
$1.94 m, 7%$0.34 m, 1%
Chart 1: The percent allocation and dollar amount (in millions) of total SRG and Bridge Grant funds by Staffing, Time, and Re-
sources, 2010 to 2012
Staffing
Stipends: Non-Extended Time
Stipends: Extended Time
Consulting
Materials
Other
Page 18 of 24
Emerging and Sustaining Practices for School Turnaround
Worcester 9.4% 15.9% 69.6% 5.0% 0.0% 0.0% $1.20 m; 2 schools
Holyoke 4.7% 8.6% 54.4% 25.5% 1.1% 5.7% $1.23 m; 2 schools
All Districts 23.6% 14.8% 34.5% 19.1% 7.1% 1.2%
During the first two years of the SRG program, Worcester and Holyoke allocated significantly more funds to pay for extended time as compared to Boston, Springfield and other districts. Also, Worcester allocated a smaller percent of funds for consultants. In contrast, Holyoke allocated over 25% of its SRG funds to consultants, specifically for the Educational Management Organization (EMO) responsible for Dean Vocational Technical School. Boston’s Level 4 schools allocated over 20% of SIG funds to consultants and Springfield’s schools allocated almost 15% towards consultants.
Improvement Focus: What was the focus and target of SIG funds?
Excluding fringe benefits and funding for extended learning time15, districts and schools had the ability to strategically allocate approximately $17.92 million of SRG and Bridge Grant funding to specific improvement efforts, during 2010-11 and 2011-12. The following analysis focuses exclusively on how schools allocated non-extended learning time, discretionary funds.
Chart 2 clarifies the purpose and focus of SRG allocations, in the aggregate, displayed as the percent of total funds allocated to each of the nine Improvement Focus categories. Districts and schools allocated the largest portion of non-extended learning time SRG funds to the direct instruction of students (33%, $5.92 million). After direct instruction to students, districts and schools tended to use funds to address students’ social and emotional health (13.1%, $2.36 million), to support implementation oversight and coordination (12.4%, 2.22 million), and to provide job-embedded professional development (11.3%, 2.02 million). The next largest allocation of funds went towards materials (1.94 million), of which approximately 50% went towards technology and software and 50% towards textbooks and print material.
Improvement Focus: Analysis
There are important differences in how Achievement Gain schools allocated SRG and Bridge Grant funds, compared to the allocation of funds by non-Gain schools that warrant additional research. Additionally, the differences in resource allocation align with the emerging and sustaining practices, suggesting that how schools
15 Funding for extended time and fringe was removed from this portion of the analysis because these are not monies that can be manipulated by the schools. We want to examine how schools use discretionary funding.
$0.31 m, 2%$2.22 m, 13%
$5.92 m, 34%
$1.62 m, 9%
$2.02 m, 11%
$0.89 m, 5%
$1.94 m, 11%
$2.36 m, 13%
$0.31 m, 2%
Chart 2: The percent allocation and dollar amount (in millions) of SRG and Bridge Grant funds by Improvement Focus, excluding stipends for
Extended Time, 2010 to 2012Redesign Team PlanningImplementation Oversight and CoordinationInstruction and Direct Support to StudentsFormal Teacher PDJob-Embedded PDDataMaterialsSocial-Emotional HealthOther
Page 19 of 24
Emerging and Sustaining Practices for School Turnaround
allocate resources directly impacts the practices used and employed by schools and that result in achievement gains.
In the aggregate, Achievement Gain schools allocated significantly more funds towards instruction and direct support to students, compared to Non-Gain schools.
Non-Gain schools allocated significantly more funds towards issues related to behavior and providing formal professional development to teachers, compared to Achievement Gain schools.
Table 3 displays the percent of SRG funding allocated to each Improvement Focus category, by Achievement Gain, Non-Gain, and All Schools.
Table 3. Percent allocation of SRG funding (excluding stipends for extended learning time) in Achievement Gain and Non-Gain schools by Improvement Focus, 2010-2012
Implementation Oversight and Coordination
Instruction and Direct Support to
Students
Formal Teacher PD
Job-Embedded
PDData Materials
Social-Emotional
HealthOther
Ach. Gain Schools 8.5% 41.8% 7.7% 9.5% 5.2% 9.4% 12.6% 5.3%
Non-Gain Schools 12.2% 25.5% 14.3% 7.0% 6.7% 10.1% 18.0% 6.1%
All Schools 12.4% 33.0% 9.1% 11.3% 5.0% 10.8% 13.1% 5.3%
In Achievement Gain schools, over 41% of non-extended learning time SRG funds were targeted towards the direct instruction to students, compared to 25.5% of funds in Non-Gain schools16. In contrast, Non-Gain schools allocated 18% of funds towards social-emotional health and 14.3% of funds to formal teacher professional development. This finding—that Non-Gain schools are spending more funds on social-emotional health and on formal professional development compared to other schools—tends to support our earlier finding regarding the importance of a safe and orderly environment as a prerequisite for rapid improvement. We know that Non-Gain schools continue to be challenged by issues related to behavior and school climate, so it makes sense that they allocated a higher percent of funds to attend to behavioral issues. As a result, Non-Gain schools are less inclined to prioritize and target resources (e.g., people and funding) on direct instruction for students.
Per Pupil Expenditures. To more closely examine the extent to which Achievement Gain schools are allocating SRG funds towards the direct instruction of students, we calculated the per pupil expenditure of SRG funds by district and schools, for each Improvement Focus category. Over a two-year period (2010 to 2012), Achievement Gain schools allocated $504 per student towards direct instruction compared to $242 per student in Non-Gain schools. The differences in allocation are also evident within districts, as displayed in Table 4.
Table 4. Two-year per pupil allocation of SRG funding (excluding stipends for extended learning time), by district and Improvement Focus, 2010-2012
Per Pupil Expenditure towards Direct Instruction to Students
Per Pupil Expenditure towards Social and Emotional Needs
Boston – Ach. Gain schools (n=5 schools) $786 $214
16 Among Achievement schools, Orchard Gardens allocated just under 1 million to the direct instruction of students, through a variety of contracts with providers and consultants. After removing Orchard Gardens from the data, gain schools still allocated a significantly higher percent of funds (33.1%) to direct instruction, compared to loss schools.
Page 20 of 24
Emerging and Sustaining Practices for School Turnaround
Boston – Non-Gain schools (n=2 schools) $496 $363
Springfield – Ach. Gain schools (n=4 schools) $271 $90
Springfield – Non-Gain schools (n=3 schools) $141 $87
Boston’s Achievement Gain schools allocated $786 per student to direct instruction, compared to an allocation of $496 per student on Boston’s non-gaining schools. Similarly, Springfield’s Achievement Gain schools allocated $271 per student toward direct instruction, while its Non-Gain schools allocated $141 per student. The differences in per pupil expenditures between districts, and in particular between Boston and Springfield, stems from overall differences in how districts allocated funds.
Table 5 displays the percent of SRG funds allocated to each Improvement Focus category in Boston, Springfield, Worcester, and Holyoke.
Table 5. Percent allocation of SRG funding (excluding stipends for extended learning time) in Achievement Gain and Non-Gain schools, by district and Improvement Focus, 2010-2012
Implementation Oversight and Coordination
Instruction and Direct Support to
Students
Formal Teacher PD
Job-Embedded
PDData Materials
Social-Emotional
HealthOther
Boston 11.8% 46.5% 2.3% 8.7% 3.8% 8.5% 15.2% 3.2%
Springfield 8.6% 24.8% 16.7% 9.2% 11.1% 13.1% 10.1% 6.4%
Worcester 0.0% 52.5% 0.0% 47.5% 0.0% 0.0% 0.0% 0.0%
Holyoke 41.8% 4.1% 9.5% 7.8% 1.7% 2.4% 20.1% 12.6%
Worcester, which spent almost 70% of total SRG funds on extended time, decided to allocate all of its remaining, funds to direct instruction for students (52.5%, $191 thousand) and job-embedded professional development (47.5%, $173 thousand.) Springfield, which used 36% of its SRG funds on extended learning time (and thus had a larger percent remaining for other uses), decided to allocate a higher percentage of funds to formal teacher professional development (16.7%, $752 thousand) and for data (11.1%, $500 thousand). Boston allocated a larger percent of funds towards social-emotional health, distributed relatively evenly across all of its schools. Holyoke targeted funds towards social-emotional health at one of its two schools.
What can we discern from how districts have allocated SRG funding?It is clear that districts in Massachusetts have allocated SRG funds in different ways, reflecting differences in local context as well as the different approaches used by districts to build district capacity and support local, school-based turnaround efforts17. There is also strong evidence, from site visits and supported by student data, that Level 4 schools in each district, and in particular in Springfield and Boston, are experiencing varied levels of success—some are on an upward achievement trajectory and some are not.
Our analysis suggests that there are different funding pathways that a district may take to support turnaround efforts. Successful and sustainable turnaround is likely the result of multiple factors, such as ensuring that schools have capable leadership, changing policies so that schools can recruit and retain high-quality and
17 A more comprehensive analysis of how districts are utilizing all funding—state and local, Title I and Race to the Top supplemental funding—would be required to state definitively that districts are using all “school improvement” dollars in fundamentally different ways.
Page 21 of 24
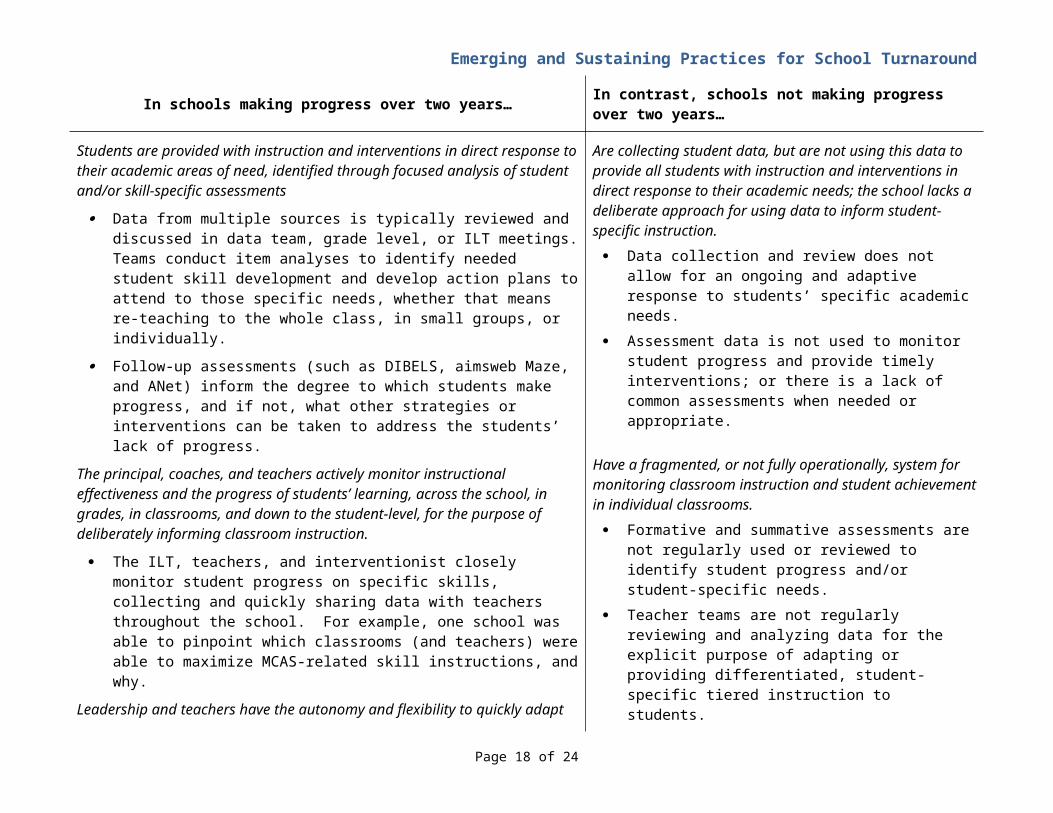
Emerging and Sustaining Practices for School Turnaround
engaged teachers, and cultivating key practices (as detailed in this report) both financially and through active support by the district, rather than the result of a cookie cutter approach to funding. That being said, there are some trends worth additional research and exploration, listed below along with related policy considerations.
Budget Analysis Finding Policy Considerations
Teacher stipends for extended learning time and non-extended time comprise approximately 50% of total SRG allocations.
Is this sustainable?
Page 22 of 24
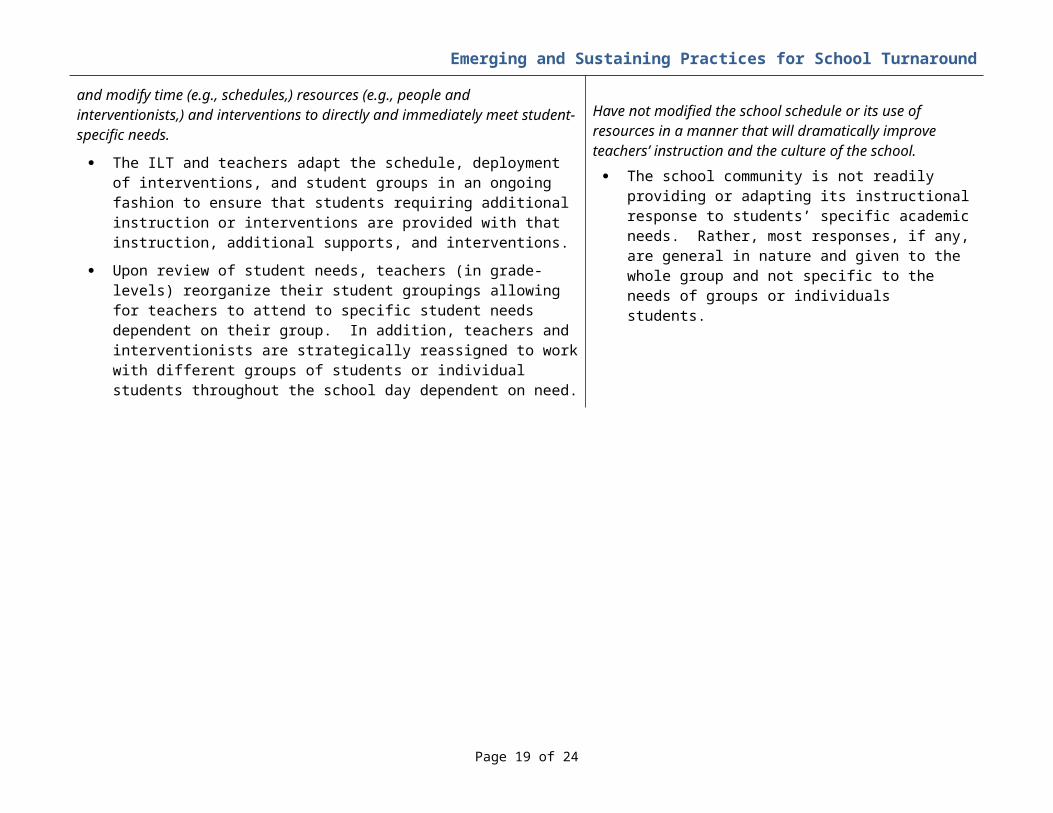
Emerging and Sustaining Practices for School Turnaround
Achievement Gain schools tend to allocate a higher percent of available funding to direct instruction for students, compared to Non-Gain schools.
How can “increased direct instruction for students” be institutionalized and inform budget considerations and policy?
Non-Gain schools tend to allocate a higher percent of available funding to social-emotional issues, compared to Achievement Gain schools.
How many years and how much funding is truly needed to fully address social-emotional and climate issues in particular schools?
Partners and Consultant Analysis
The use of high-quality educational providers, lead partners, and educational consultants is a central component of the federal SIG program. Schools using the Restart model are required to partner with an External Management Organizations (EMO) and schools using the Turnaround or Transformation models are encouraged to partner with external experts and consultants for professional development and direct services (e.g., after-school programming, tutoring, mentoring), aligned with the school’s priority areas for improvement. Massachusetts has taken a proactive approach to building the state’s pipeline of providers with the capacity to provide services and specialized expertise to Level 4 schools, by vetting and identifying Priority Partners for Turnaround, investing in building the capacity of partners to serve Level 3 and Level 4 schools, and convening regular networking among priority partners and district and school leaders.
Table 6 provides descriptive information to inform continued thinking about the role of external partners and consultants in district and school turnaround. Our analysis provides strong qualitative evidence that districts and many schools value the support provided by external partners and consultants and feel that partnerships have been crucial to turnaround efforts. However, the fact that many of the Non-Gain schools partner with the same providers suggests that the
Page 23 of 24
Table 6. SRG funding allocated to Partners and Consultants, 2010-2012Priority Partners for Turnaround
Total Amount
# of Schools
Total SIG funds Allocated to all External Partners and Consultants $3,261,305 30
Total SIG funds Allocated to all Priority Partners for Turnaround $1,640,380
City Connects Yes $483,000 6The Achievement Network Yes $389,630 15
City Year Yes $380,000 3Citizen Schools Yes $160,000 1
Unlocking Potential $125,000 1Talent Development $100,571 1
NIPD Behavioral Specialists $100,000 1Hyde Park $100,000 1
BELL Yes $94,000 1Playworks $70,000 3
Boston Medical $54,000 1Center for Collaborative Education Yes $48,750 2
Lesley University, Center for Reading Recovery and Literacy
Collaborative Yes
$45,000 2National Center for Time and
Learning/ Mass2020 Yes $40,000 2Responsive Classroom $31,150 2
The Writers’ Express $30,000 1May Institute $23,000 2
Generations Incorporated $20,000 2Boston Arts Academy $20,000 1
Professional Learning Communities $16,000 1
Miscellaneous Consultants $642,478 16Interventionists (unspecified) $243,726 7
Counseling (unspecified) $45,000 1
Emerging and Sustaining Practices for School Turnaround
use of external providers and consultants is necessary but not sufficient—the use of external providers does not automatically lead to success.18
Use of Turnaround Approaches and Flexibilities: The relationship between Federal Intervention Models, Teacher Turnover Rates, and School PerformanceMassachusetts’ state law provides for the identification of “Turnaround Schools” and affords identified districts and schools considerable flexibility to hire staff and change operating conditions. Even with the flexibilities provided by state law, there is evidence that the opportunity to apply for SRG funding and the required use of one of four federal intervention models19 has helped districts to further leverage state law and, in many instances, to make immediate changes in staffing and create the conditions needed to drive rapid achievement gains. Significant and intentional changes in staffing (i.e., 35% or higher teacher turnover rate in a single year) occurred in schools using the federal turnaround model as well as in many20 of the schools using the transformation model.
Table 7 provides a descriptive overview of the relationship between district and school use of intervention models and schools’ progress towards meeting MAGs. Table 8 displays the relationship between teacher turnover rates (irrespective of the intervention model used) and schools’ progress.
Table 7. Schools’ achievement trajectory by Intervention Model, 2010 to 2012.
Number and Percent of Schools…
Total # of Schools Using Model
On target to meeting MAGs
Partially on target
Not on target
Turnaround 12 7 (58%) 3 (25%) 2 (22%)Transformation 18 7 (39%) 7 (39%) 4 (22%)Restart 1 0 1 (100%) 0Closure 0 0 0 0Not Funded 3 0 1 (33%) 2 (67%)
Table 8. Schools’ achievement trajectory by one-year teacher turnover rates (2010-11) Number and Percent of Schools…
Turnover Rate during the 2010-11 school
year# of Schools On target to
meeting MAGsPartiallyon target
Noton target
50% or higher 9 8 (89%) 1 (17%) 035% to 49% 9 3 (33%) 5 (56%) 1 (11%)20% to 34% 11 2 (18%) 4 (36%) 5 (46%)19% or lower 5 1 (20%) 1 (20%) 3 (60%)
18 A deeper analysis of how districts have used SIG and Race to the Top (RTTT) funds may uncover stronger links between the use of external partners and consultants and student achievement. For instance, 18 % ($3.92 m) of non-extended learning time SIG funds (for 2010 – 2012) have been allocated to external partners and consultants. In contrast, districts across the state have used $6 million of RTTT funds to contract and purchase services from priority partners, focused primary on supporting Level 3 and Level 4 schools. 19 The four intervention models are: Turnaround, Transformation, Restart, and Closure.20 Three of the 18 Transformation schools replaced over 50% of teachers and 10 schools replaced over 35% of teachers in 2010-11.
Page 24 of 24
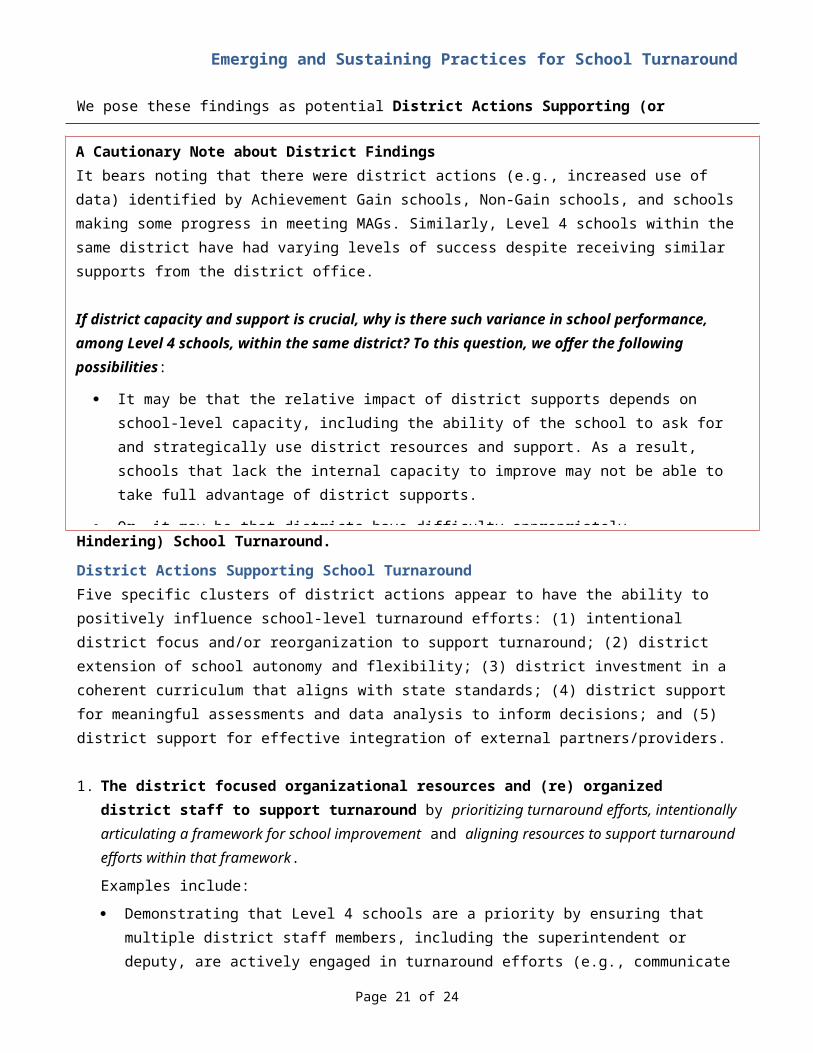
Emerging and Sustaining Practices for School Turnaround
There is a strong relationship between a school’s initial, single year teacher turnover rates and ability of the school to make rapid improvement (e.g., to be classified as an Achievement Gain school after two years).
The information in Tables 7 and 8 provides compelling evidence of a relationship between a school’s initial teacher turnover rate, indicative of district and school decisions regarding staffing and teacher capacity, and the likelihood that a school is able to embark on an improvement trajectory. Specifically, higher rates of teacher turnover appear to be linked with schools’ success in meeting MAGs. Eleven of the 14 Achievement Gain schools21 experienced turnover rates of 35 % or greater and 8 had turnover rates of over 50 %. Of the 9 schools not on target, 9 had turnover rates of 34 % or lower and none had a turnover rate of over 50%.
While Achievement Gain schools show signs of stabilizing teacher turnover over two years (after recruiting and hiring new teachers in year one of the turnaround effort), Non-Gain schools are experiencing increased rates of teacher turnover during year two and year three of turnaround efforts.
The teacher turnover rates among the 14 schools on an improvement trajectory declined by 28% between 2010-11 and 2011-12, suggesting that turnover rates in improving school are stabilizing. In contrast, the turnover rate among schools not making progress increased by 15% (from 23% to 38%) between 2010-11 and 2011-12. Table C2 in Appendix C provides detailed teacher turnover rates for all of the Achievement Gain and Non-Gain schools.
While there appears to be a strong relationship between teacher turnover rates and a school’s achievement trajectory, the meaning of this relationship is not clear. For instance, teachers may be departing a school because improvement efforts are not working or the school leader may be slowly encouraging particular teachers to look for work elsewhere. Additionally, district policies (e.g., bidding and bumping, other hiring practices) may be influencing turnover rates. Additional document analysis and interviews with school principals and district staff is necessary to better understand how teacher turnover is related to school turnaround efforts.
21 It is important to note that three of the Achievement Gain schools retained existing staff and provided a strong rationale for doing so.
Page 25 of 24
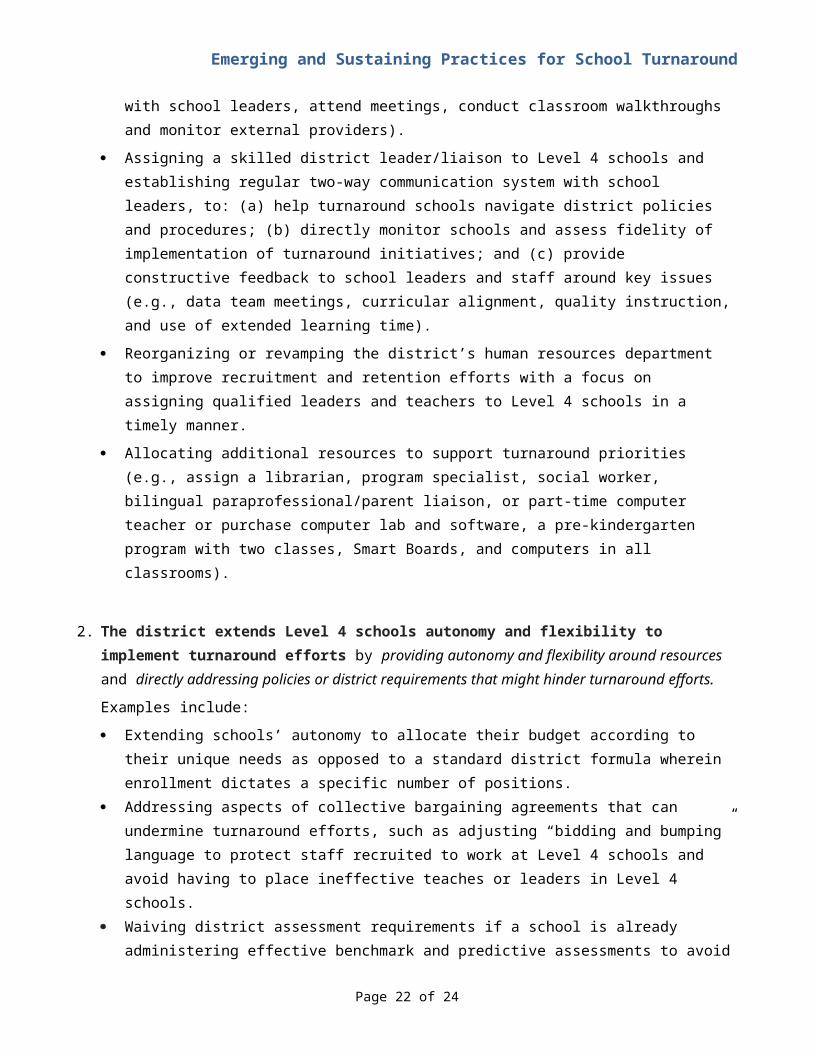
Emerging and Sustaining Practices for School Turnaround
Appendix A: List of Indicators of Measurable Annual Goals
Drop-out Rate
Graduation Rate 4yr
Composite Performance Index (CPI): ELA, all students in all grades
Composite Performance Index (CPI): ELA, high needs students in all grades
Composite Performance Index (CPI): Math, all students in all grades
Composite Performance Index (CPI): Math, high needs students in all grades
Percentage of students scoring Warning / Failing on MCAS: ELA, all students in all grades
Percentage of students scoring Warning / Failing on MCAS: ELA, high needs students in all grades
Percentage of students scoring Warning / Failing on MCAS: Math, all students in all grades
Percentage of students scoring Warning / Failing on MCAS: Math, high needs students in all grades
Median Student Growth Percentile (SGP): ELA, all students in all grades
Median Student Growth Percentile (SGP): ELA, high needs students in all grades
Median Student Growth Percentile (SGP): Math, all students in all grades
Median Student Growth Percentile (SGP): Math, high needs students in all grades
A
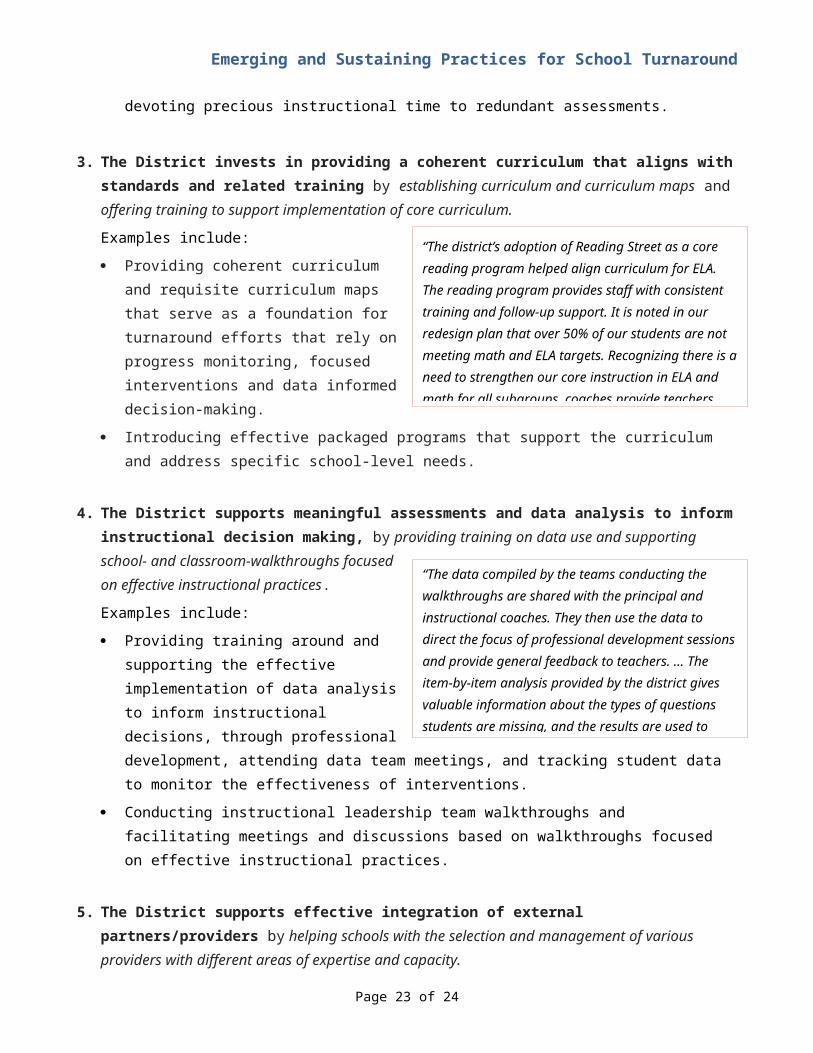
Emerging and Sustaining Practices for School Turnaround
Appendix B: Data Sources and Methodology
Data Sources: Monitoring Site Visit (MSV) Reports: Spring 2011 and 2012 School Renewal Applications: Spring 2011 and 2012 District and School Budgets: Amended Budgets, 2010-11 and 2011-12
Identification of Achievement Gain and Non-Gain schools1. The metric “percent remaining to achieve MAGs” was used to determine the initial list of schools for
consideration in the analysis; schools within 20% of attaining MAGs were identified as potential Achievement Gain schools and those 60% away were potential Non-Gain schools.
2. INSTLL then analyzed the ELA and math CPI achievement gap for each school (and for various subgroups). As a result of our analysis, we identified two additional Achievement Gain schools and two schools were removed from the Non-Gain set of schools. Additionally, we excluded three of the Achievement Gain schools from the qualitative analysis of emerging practices, due to these schools experiencing gains in only one of the past two years. The use of two metrics to classify schools into the comparison categories provided an added level of confidence that the identified patterns and practices attributed to successful turnaround efforts are valid.
Analysis of Emerging and Sustaining Practices1. Building upon the 2012 analysis, we conducted a detailed document analysis of monitoring site visit
reports and renewal applications, among Achievement Gain and Non-Gain schools, to identify common and discrepant themes and practices across schools, focusing on (a) the continued use of emerging practices and (b) identification of additional practices, or modifications to practices, across schools.
2. Once the significant themes and practices were identified and subsequently refined through an additional analysis of SRG renewal applications, each MSV report was again reviewed to test the assumption that each identified practice played a significant role in the gains made by Achievement Gain schools. In this iterative process, the articulation of themes and practices was further refined to include connections among various practices that could enhance the explanation of why certain Level schools are having success and other not, yielding the findings as presented in this report.
Budget Analysis Methodology Note1. We did not closely examine the extent to which budgets were aligned with proposed activities and
priorities as described in each school’s original proposal or renewal applications.2. Upon reviewing the SRG budgets, we realized that an analysis of budgets based on ESE defined budget
categories (e.g., administrators, instructional staff, and support staff) would not provide the nuance needed to understand exactly how schools were using SRG funds.
3. We carefully read the narratives provided in the budgets and budget amendments to develop two groupings of resource use (Implementation Focus and People and Resources) that provide different frames through which to analyze how schools are using SRG funds.
4. We then hand coded and categorized the budget allocations for 2010-11 and 2011-12 budget for Level and SRG schools, including Bridge Grant funds provided to some Level 4 schools in 2010-11.
5. Upon finding little trends or differences in how schools allocated funds from year one to year two, we decided to combine the budgets for 2010-11 and 2011-12 to provide a two year measure of how schools are allocating SRG and Bridge Grant funding.
6. Categories are based on a careful reading and coding of budget narratives through each lens, and our findings are likewise organized according to these two “analytic frames”.
B
Emerging and Sustaining Practices for School Turnaround
Appendix B: Data Sources and Methodology
Budget Allocation Analytic Frames
Two analytic frames were used to code budget items: (1) Staffing, Time and Resources and (2) Improvement Focus. Each analytic frame is comprised of specific categories, as follows.
(1) Staffing, Time and Resources: How and where schools allocate funds?• Direct Staffing: Hiring full/part time staff• Stipends for required extended time, for teachers
and para-professionals.• Stipends for administrators, teachers and
substitutes (not part of required extended time) for professional development
• Consultants• Materials, including technology • Other (e.g., Incentives, Travel)
(2) Improvement Focus: What was the foci and target of SIG funds?• Implementation and oversight• Redesign team planning• Direct instructional support to students• Formal professional development• Job-embedded professional development• Data (primarily new assessments)• Materials, including technology • Social-emotional programs and services• Parent and community engagement• Other/misc
Budget items were coded using each analytic frame. Table XX (on the following page) provides an overview of the Analytic Frames used to code each budget items, displaying the overlap between the Staffing, Time and Resources frame and the Improvement Focus frame. For instance, funding for an external consultant to provide one-on-one reading instruction to targeted students, during or after the school day, would be coded as Consultant and as Direct Instructional Support To Students. Similarly, a stipend for a math teacher to provide direct instructional support to students on Saturdays would be coded as Stipend and as Instruction and Direct Instructional Support to Students.
The following provides additional detail on how budget items were coded: Implementation and oversight : Staffing, stipends, and consultants for supporting, monitoring, and providing oversight of overall SRG efforts. Redesign team planning : Staffing, stipends, and consultants specifically focused on redesign team planning activities. Direct instructional support to students : Staffing, stipends, and consultants that provide direct (e.g., in-person, adult to student) instruction to students, such as
tutoring and classroom instruction. Formal professional development : Staffing, stipends, and consultants related to formal (e.g., external or after school) professional development. Job-embedded professional development : Staffing, stipends, and consultants that provide in-school, job-embedded professional development. For instance, the
hiring of, or use of stipend for, a literacy coach specifically designated to support reading teachers improve instruction would be coded as job-embedded professional development.
Data : Staffing, stipends, and consultants related to the use of data (e.g., a data coach or purchasing of assessments). Materials : Budget allocations for instructional materials (generic and targeted), technology, and non-instructional materials Social-emotional programs and services : Staffing, stipends, and consultants directly focused on supporting students’ social emotional health. Parent and community engagement : Staffing, stipends, and consultants focused on supporting and cultivating parent and community involvement.
B

Emerging and Sustaining Practices for School Turnaround
Table B1: Matrix of Analytic Frames used to code SRG Budgets.
Direct Staffing
Stipends
Consultants
Materials Other (Incentives,
Travel, Misc)
Stipends for professional development
Stipends for
Instruction
Stipends Extended
Day
Textbooks and
Materials: Generic
Targeted: Textbooks and
Materials: Targeted
Instructional Technology including Software
Non-Instructional
Implementation and Oversight X X X
Redesign Team Planning X X X
Direct Instructional Support to Students
X X X
Formal professional development
X X X
Job-embedded professional development
X X X
Data (primarily new assessments) X X X
Materials, including technology
X X X X
Social-emotional programs and services
X X X
Parent and community engagement
X X X
Other/Misc SRG X
An “X” represents areas in which budget items could be coded. For instance, a budget item could be coded as “Formal Professional Development” and Direct Staffing, Stipends, or Consultants.
B
Emerging and Sustaining Practices for School Turnaround
Appendix CTable C1. Overview of L4 schools making gains (Achievement Gain Schools) and those not making gains (Non-Gain Schools) in the 2010-11 and 2011-12 school years; by % needed to reach MAG and two-year
change in CPI Achievement Gap (e.g. Positive = Closing Achievement Gap)
Actual Change in closing CPI Achievement Gap between
2010 and 2012, math and ELA
District School % LEP
MAG % needed to
reach targetIn Analysis Model SIG
Cohort
ELAChange in CPI
MathChange in CPI
Combined 2 year
Change
Scho
ols m
akin
g ga
ins a
nd c
losi
ng
Ach
ieve
men
t Gap
s
Springfield Zanetti K-8 5.5 0% Yes Transformation 2 11.7 21.3 33.0Springfield Homer Street ES 17.5 0% Yes Turnaround 2 20.2 30.4 50.6Boston Trotter ES 6.6 0% Yes Turnaround 1 6.7 12.0 18.7Boston Harbor MS 9.4 1% No Turnaround 1 8.5 7.0 15.5Boston Orchard Gardens K-8 43.3 2% Yes Turnaround 1 9.1 19.3 28.4Boston Blackstone ES 58.8 3% Yes Turnaround 1 9.1 20.1 29.2Lowell Murkland ES 39.4 4% Yes Transformation 2 11 14.6 25.6Springfield Gerena ES 21.8 4% Yes Transformation 2 12.8 18.9 31.7Lynn Harrington ES 43.2 4% No Transformation 2 8.0 10.8 18.8Springfield Brookings ES 19.2 6% Yes Turnaround 2 9.0 16.4 25.4Lynn Connery ES 47.3 14% Yes Transformation 3 8.5 11.0 19.5Worcester Union Hill ES 43 20% Yes Transformation 2 11.6 9.1 20.7Boston J.F. Kennedy ES 57.0 26% No Transformation 1 0.6 10.7 11.3Boston Burke HS 26.8 26% Yes Turnaround 2 15.3 15.3 30.6
Scho
ols n
ot h
avin
g su
cces
s in
clo
sing
Ach
ieve
men
t
Lawrence SLEM MS 12 60% Yes Transformation 3 1.2 5.0 6.2Boston English HS 38.7 67% Yes Transformation 1 4.2 -3.8 0.4Boston E. Greenwood ES 25.4 74% Yes Transformation 1 1.8 -4.1 -2.3Springfield HS Of Commerce 20.5 74% Yes Turnaround 3 6.7 -7.9 -1.2Springfield Chestnut Street MS 24.3 82% Yes Transformation 2 -3.7 -2.7 -6.4New Bedford Parker ES 0 85% Yes N/A N/A -1.0 1.0 0.0Lawrence Arlington ES 49.2 97% Yes Transformation 2 -5.3 -3.0 -8.3Fall River Lord MS 0 105% Yes N/A N/A -5.4 -6.3 -11.7
Springfield Kennedy MS 1.4 106% Yes Turnaround 2 -8.4 -1.8 -10.2
Table C2. Overview of L4 schools making gains and closing achievement gaps and those not making gains in the 2010-11 and 2011-12 school years; by Federal Model, SIG Cohort, and Teacher Turnover Teacher Turnover Rate
C
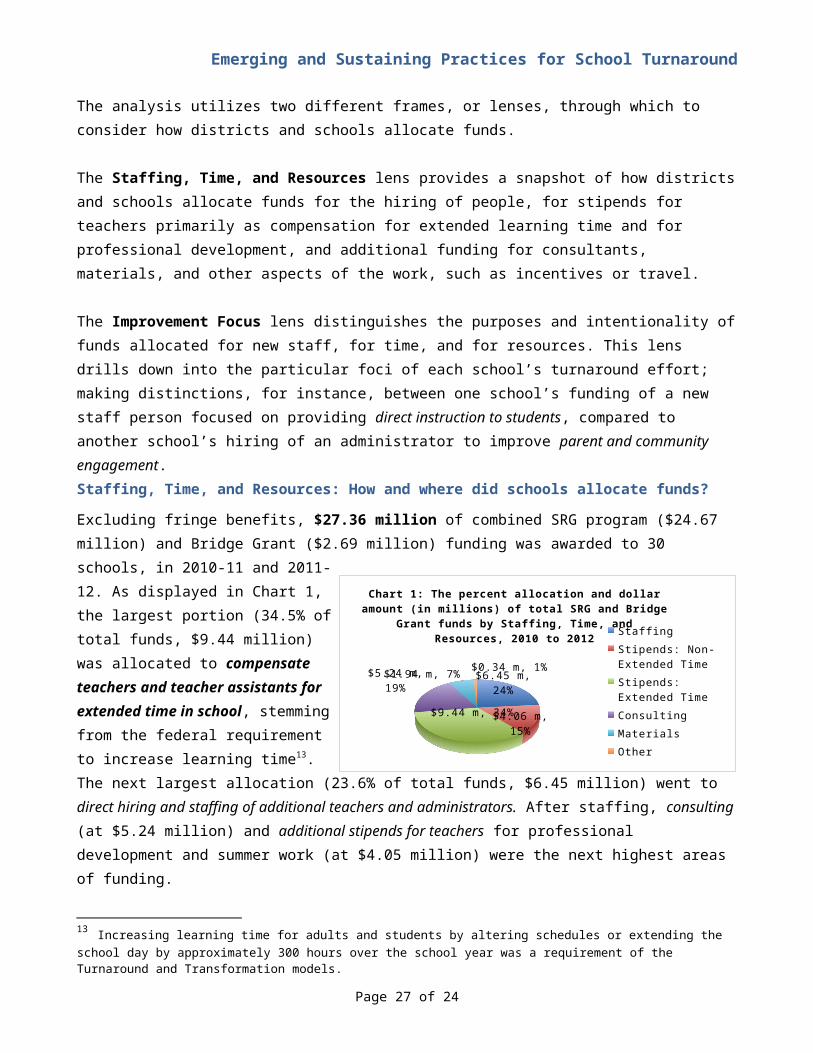
Emerging and Sustaining Practices for School Turnaround
Rate
District School % LEP
MAG % needed to
reach target Model SIG
Cohort 2009-10 2010-11 2011-12
Scho
ols m
akin
g ga
ins a
nd c
losi
ng
Ach
ieve
men
t Gap
s
Springfield Zanetti K-8 5.5 0% Transformation 2 18% 38% 12%
Springfield Homer Street ES 17.5 0% Turnaround 2 11% 68% 38%
Boston Trotter ES 6.6 0% Turnaround 1 34% 64% 19%
Boston Harbor MS 9.4 1% Turnaround 1 39% 48% 32%
Boston Orchard Gardens K-8 43.3 2% Turnaround 1 39% 78% 13%
Boston Blackstone ES 58.8 3% Turnaround 1 12% 82% 17%
Lowell Murkland ES 39.4 4% Transformation 2 18% 19% 25%
Springfield Gerena ES 21.8 4% Transformation 2 22% 41% 22%
Lynn Harrington ES 43.2 4% Transformation 2 30% 34% 15%
Springfield Brookings ES 19.2 6% Turnaround 2 33% 31% 38%
Lynn Connery ES 47.3 14% Transformation 3 37% 73% 31%
Worcester Union Hill ES 43 20% Transformation 2 5% 54% 32%Boston J.F. Kennedy ES 57.0 26% Transformation 2 18% 52% 18%
Boston Burke HS 26.8 26% Turnaround 2 16% 62% 42%
Scho
ols n
ot h
avin
g su
cces
s in
clos
ing
Ach
ieve
men
t Gap
s
Lawrence SLEM MS 12 65% Transformation 3 23% 15% 65%
Boston English HS 38.7 67% Transformation 1 27% 35% 55%
Boston E. Greenwood ES 25.4 74% Transformation 1 42% 12% 12%
Springfield HS Of Commerce 20.5 74% Turnaround 3 11% 23% 33%
Springfield Chestnut Street MS 24.3 82% Transformation 2 18% 24% 33%New Bedford Parker ES 0 85% N/A N/A 30% 25% 15%
Lawrence Arlington ES 49.2 97% Transformation 2 18% 19% 59%
Fall River Lord MS 0 105% N/A N/A 26% 21% 20%
Springfield Kennedy MS 1.4 106% Turnaround 2 26% 33% 25%
C