I B.Tech Academic regulations and Detailed syllabus - EEE, ECE ...

BES LAB EEE B.Tech. III Year I Sem
R16 B.TECH EEE.
EE506PC: BASIC ELECTRICAL SIMULATION LAB
B.Tech. III Year I Sem. L T P C 0 0 3 2
Prerequisite: Basic Electrical and Electronics Engineering & Network Theory. Course Objectives: To develop the simulation skills
. To generate various signals and synthesis for the engineering systems
. To analyze harmonics in the systems
. To analyze electrical circuit in simulation environment
Course Outcomes: After going through this lab the student will be able to Apply signal generation in different systems. Analyze networks by various techniques Analyze circuit responses Analyze bridge rectifiers
The following experiments are required to be con ducted compulsory experiments:
1. Basic Operations on Matrices 2. Generation of various signals and sequences (Periodic and Aperiodic), such as unit Impulse, Step, Square, Saw tooth, Triangular, Sinusoidal, Ramp, Sine. 3. Operations on signals and sequences such as Addition, Multiplication, Scaling, Shifting, Folding, Computation of Energy, and Average Power 4. Mesh and Nodal Analysis of Electrical circuits 5. Application of Network Theorems to Electrical Networks 6. Waveform Synthesis using Laplace Transform 7. Locating the Zeros and Poles and Plotting the Pole-Zero maps in S plane and Z-Plane for the given transfer function 8. Harmonic analysis of non sinusoidal waveformsIn addition to the above eight experiments, at least any two of the experiments from the following list are required to be conducted.
9. Simulation of DC Circuits 10. Transient Analysis 11. Measurement of active Power of three phase circuit for balanced and unbalanced load 12. Simulation of single phase diode bridge rectifiers with filter for R & RL load13. Simulation of three phase diode bridge rectifiers with R, RL load 14. Design of Low Pass and High Pass filters
ANRH Page 1

BES LAB EEE B.Tech. III Year I Sem
15. Finding the Even and Odd parts of Signal / Sequence and Real and imaginary parts of Signal 16. Finding the Fourier Transform of a given signal and plotting its magnitude and phase spectrum
ANRH Page 2

BES LAB EEE B.Tech. III Year I Sem
List of Experiments to be conducted in lab According to curriculum:
Experiments done using Mat lab software:
Exp1: Basic Operations on Matrices
Exp3: Operations on signals and sequences such as Addition, Multiplication, Scaling, Shifting, Folding, Computation of Energy, and Average Power.
Exp6: Waveform Synthesis using Laplace Transform
Exp7: Locating the Zeros and Poles and Plotting the Pole-Zero maps in S plane and Z-Plane for the given transfer function.
Experiments done using Pspice Software:
Exp2:Generation of various signals and sequences (Periodic and Aperiodic), such as unit Impulse, Step, Square, Saw tooth, Triangular, Sinusoidal, Ramp, Sine.
Exp4: Mesh and Nodal Analysis of Electrical circuits
Exp5: Application of Network Theorems to Electrical Networks
Exp8: Harmonic analysis of non sinusoidal waveforms
Exp9: Simulation of DC Circuits
Exp10: Transient Analysis.
1. BASIC OPERATIONS ON MATRICES
ANRH Page 3

BES LAB EEE B.Tech. III Year I Sem
AIM: - To write a MATLAB program to perform some basic operation on matrices such as addition, subtraction, multiplication.
SOFTWARE REQURIED:-
1. MATLAB R2010a.
2.Windows XP SP2
PROCEDURE:-
Open MATLAB1. Open new M-file2. Type the program3. Save in current directory4. Compile and Run the program5. For the output see command window\ Figure window
PROGRAM:- clc; close all; clear all; a=[1 2 -9 ; 2 -1 2; 3 -4 3]; b=[1 2 3; 4 5 6; 7 8 9]; disp('The matrix a= '); a disp('The matrix b= '); b % to find sum of a and b c=a+b; disp('The sum of a and b is '); c % to find difference of a and b d=a-b; disp('The difference of a and b is ');d %to find multiplication of a and b e=a*b; disp('The product of a and b is ');
Conclusion:
ANRH Page 4

BES LAB EEE B.Tech. III Year I Sem
Extension:
Result: MATLAB program to perform some basic operation on matrices such as addition, subtraction, multiplication is done.
3. Operation On Signals & Sequences
ANRH Page 5

BES LAB EEE B.Tech. III Year I Sem
AIM :- To performs operations on signals and sequences such as addition, multiplication,
scaling, shifting, folding, computation of energy and average power.
SOFTWARE REQURIED:-
1.MATLAB R2010a.
2.Windows XP SP2.
PROGRAM:-
%Addition and multiplication of two signals% clc;clear all; close all; t=0:0.001:2; s1=6*sin(2*pi*5*t); subplot(4,1,1);plot(t,s1,'g'); xlabel('time'); ylabel('amplitude'); title('first signal'); s2=8*sin(2*pi*5*t); subplot(4,1,2); plot(t,s2,'r'); xlabel('time'); ylabel('amplitude'); title('second signal'); s3=s1+s2; subplot(4,1,3); plot(t,s3,'g'); xlabel('time'); ylabel('amplitude'); title('sum of two signals'); s4=s1.*s2; subplot(4,1,4); plot(t,s4,'g'); xlabel('time');
ANRH Page 6
BES LAB EEE B.Tech. III Year I Sem
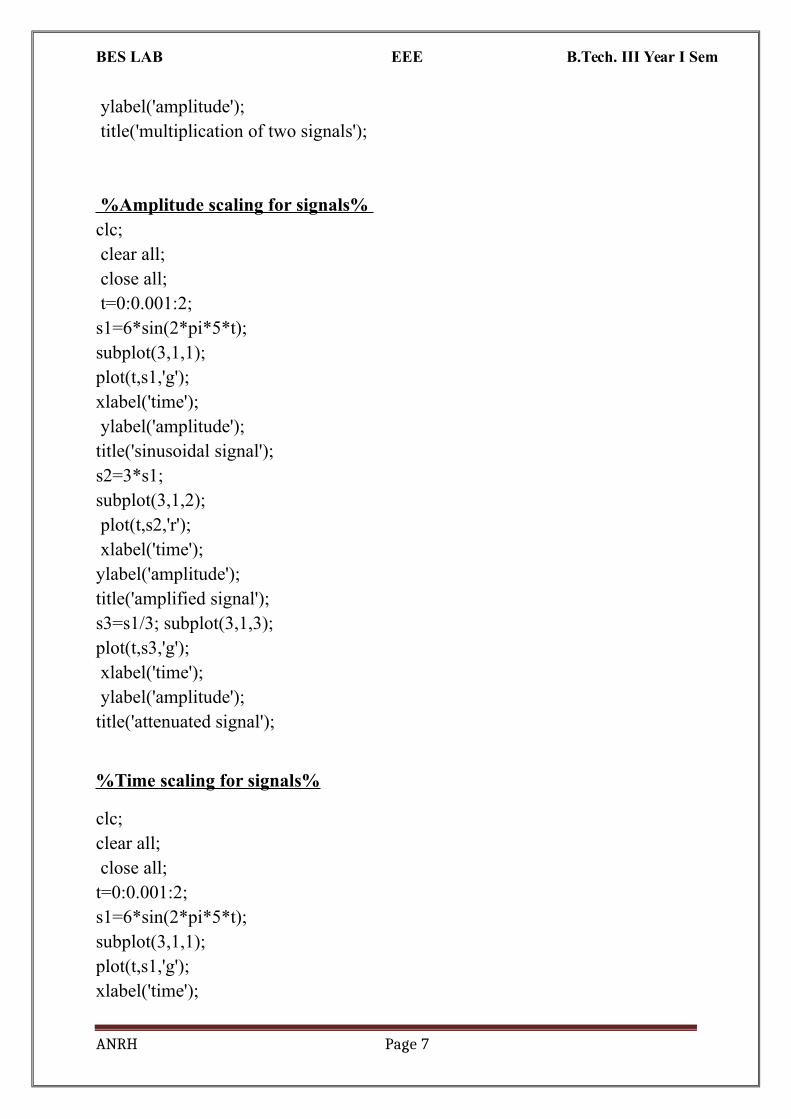
ylabel('amplitude'); title('multiplication of two signals');
%Amplitude scaling for signals% clc; clear all; close all; t=0:0.001:2; s1=6*sin(2*pi*5*t); subplot(3,1,1); plot(t,s1,'g'); xlabel('time'); ylabel('amplitude'); title('sinusoidal signal'); s2=3*s1;subplot(3,1,2); plot(t,s2,'r'); xlabel('time'); ylabel('amplitude'); title('amplified signal'); s3=s1/3; subplot(3,1,3); plot(t,s3,'g'); xlabel('time'); ylabel('amplitude'); title('attenuated signal');
%Time scaling for signals%
clc; clear all; close all; t=0:0.001:2; s1=6*sin(2*pi*5*t); subplot(3,1,1); plot(t,s1,'g'); xlabel('time');
ANRH Page 7

BES LAB EEE B.Tech. III Year I Sem
ylabel('amplitude'); title('sinusoidal signal'); t1=3*t; subplot(3,1,2); plot(t1,s1,'r'); xlabel('time'); ylabel('amplitude'); title('compressed signal'); t2=t/3; subplot(3,1,3); plot(t2,s1,'g'); xlabel('time'); ylabel('amplitude'); title('enlarged signal');
%Time shifting of a signal% clc; clear all; close all; =0:0.001:3; s1=6*sin(2*pi*5*t); subplot(3,1,1); plot(t,s1,'g');xlabel('time'); ylabel('amplitude'); title('sinusoidal signal'); t1=t+10; subplot(3,1,2); plot(t1,s1,'r'); xlabel('time'); ylabel('amplitude'); title('right shift of the signal'); t2=t-10; subplot(3,1,3); plot(t2,s1,'g'); xlabel('time'); ylabel('amplitude'); title('left shift of the signal');
%Time folding of a signal% clc; clear all; close all;
ANRH Page 8

BES LAB EEE B.Tech. III Year I Sem
t=0:0.001:2; s=sin(2*pi*5*t); m=length(s); n=[-m:m]; y=[0,zeros(1,m),s]; subplot(2,1,1); plot(n,y,'g'); xlabel('time'); ylabel('amplitude'); title('original signal'); y1=[fliplr(s),0,zeros(1,m)]; subplot(2,1,2); plot(n,y1,'r'); xlabel('time'); ylabel('amplitude'); title('folded signal');
Conclusion:
Extension:
Result: Operations on signals and sequences such as addition, multiplication, scaling,
shifting, folding, computation of energy and average power using mat lab software is done.
6.Waveform Synthesis using Laplace Transforms
AIM: - To perform waveform synthesis using Laplace Transforms of a given signal
SOFTWARE REQURIED:- 1.MATLAB R2010a.
ANRH Page 9

BES LAB EEE B.Tech. III Year I Sem
2.Windows XP SP2.
PROGRAM:- %Laplace Transform% clc clear all; close all; syms t; x=exp(-2*t)*heaviside(t); y=laplace(x); disp('Laplace Transform of input signal'); y z=ilaplace(y); disp('Inverse Laplace Transform of input signal'); zOUTPUT:- Laplace Transform Laplace Transform of input signal Y= 1/(s+2) Inverse Laplace Transform of input signal Z= 1/exp(2*t)
Conclusion:
Extension:
Result: Laplace and inverse Laplace transforms were verified using MATLAB functions.
7.LOCATING THE ZEROS AND POLES AND PLOTTING THE POLE ZERO MAPSIN S-PLANE AND Z-PLANE FOR THE GIVEN TRANSFER FUNCTION.
ANRH Page 10

BES LAB EEE B.Tech. III Year I Sem
AIM : - To locating the zeros and poles and plotting the pole zero maps in s-plane and z-plane
for the given transfer function.
SOFTWARE REQURIED:- 1.MATLAB R2010a. 2.Windows XP SP2.
PROGRAM:-
%locating poles of zero on s-plane% clc; clear all; close all;num=input('enter numerator co-efficients'); den=input('enter denominator co-efficients'); h=tf(num,den); poles=roots(den); zeros=roots(num); sgrid; pzmap(h); grid on; title('locating poles of zeros on s-plane');
%locating poles &zeros on z-plane% clc; clear all; close all; num=input('enter numerator coefficient'); den=input('enter denominator coefficient'); p=roots(den); z=roots(num); zplane(p,z); grid; title('locating poler and zeros on s-plane')
Conclusion:
ANRH Page 11

BES LAB EEE B.Tech. III Year I Sem
Extension:
Result:. Locating the zeros and poles and plotting the pole zero maps in s-plane and z-plane for the given transfer function is done using mat lab software.
ANRH Page 12

BES LAB EEE B.Tech. III Year I Sem
2.Generation of various signals and sequences
Aim: To generate various signals and sequence in simulation environmentusing pspice
Apparatus:
1.pspice software 2.Windows XP SP2.
Theory:
The basic signals that can be directly generated in pspice are exponential signal,sine wave signal, step signal, pulse signal.
From pulse signal various signals like square, saw tooth, triangular, ramp and unit impulse signals are generated.
The basic command for this signal generations are
Sine wave syntax:
Sin (v1 v2 frequency alpha theta)
Pulse wave syntax
Pulse (V1 V2 TD T R TF PW PER)TD time delayTFtime fallTRtime raisePWpulse widthPERperiodTo generate triangular wave make TD=0, Pw=0 &PER=TF+TRTo generate sawtooth wave make TD=0, Pw=0& PER=TF+TRFor impulse PW=1/v2Similarly other signals are also generated.
Exponential wave syntax:
Exp (V1 V2 TRD TRC TFD TFC)TRDRise Delay timeTRCRise Time ConstantTFCFall Time ConstantTFDFall Delay Time
ANRH Page 13

BES LAB EEE B.Tech. III Year I Sem
PROCEDURE:
1. Open pspice AD software2. Select file New Text file3. Enter the code4. Save the file as filename.cir5. Run the file6. Check for errors7. View the results.
Conclusion:
Extension:
Result: Generation of various signals is done using pspice software.
ANRH Page 14

BES LAB EEE B.Tech. III Year I Sem
PROGRAM IN PSPICE
1. STEP WAVE GENRATION:VIN 1 0 DC 200V.TRAN 1US 500US.PROBE.END2. EXPONENTIAL WAVE GENRATION:
VIN 1 0 EXP (0 10 2NS 20NS 60NS 30NS).TRAN 1NS 100NS.PROBE.END3. PULSE WAVE GENRATION:
VIN 1 0 PULSE (-1 1 20NS 10NS 10NS 50NS 100NS).TRAN 1NS 260NS.PROBE.END4. SINE GENRATION:VIN 1 0 SIN (0 10 5KHZ).TRAN 1US 500US.PROBE.END5. SQUARE GENRATION :VIN 1 0 PULSE (0 1 10NS 0 0 50NS 100NS).TRAN 1NS 260NS.PROBE.END6. TRIANGULAR WAVE GENRATION:VIN 1 0 PULSE (0 1 0 10NS 10NS 0 100NS).TRAN 1NS 260NS.PROBE.END7. SAW TOOTH WAVE GENRATION:
VIN 1 0 PULSE (0 1 0 10NS 2NS 0 15NS) .TRAN 1NS 260NS .PROBE .END
ANRH Page 15

BES LAB EEE B.Tech. III Year I Sem
8. RAMP SIGNAL GENRATION:VIN 1 0 PULSE (0 10 260NS 10NS 0 0 300NS).TRAN 1NS 260NS.PROBE.END
9. IMPULSE SIGNAL GENRATION:
VIN 1 0 PULSE (0 10 20NS 2NS 2NS 5NS 300NS).TRAN 1NS 260NS.PROBE.END
Conclusion:
Extension:
ANRH Page 16

BES LAB EEE B.Tech. III Year I Sem
4.Mesh and Nodal analysis of electric circuits
Aim: To perform mesh and nodal analysis of electric circuit using pspice software
Apparatus:
1.pspice software 2.Windows XP SP2.
Theory: Mesh analysis is used to find loop currents .Using Kirchhoff’s voltage law the loop currents and branch voltages are determined
Nodal analysis is used to find node voltages. using Kirchhoff’s current law the node voltages and branch currents are determined
PROCEDURE:
1. Open pspice AD software2. Select file New Text file3. Enter the code4. Save the file as filename.cir5. Run the file6. Check for errors7. View the results.
ANRH Page 17

BES LAB EEE B.Tech. III Year I Sem
MESH AND NODAL ANANALYSIS
Circuit diagram:
PROGRAM:
VS 1 0 DC 12VR1 2 3 10KOHMSR2 3 7 10KOHMSR3 4 6 10KOHMSR4 3 5 10KOHMSVX 1 2 0VVY 7 4 0VVZ 5 0 0VVM 6 0 0V.OP.END
ANRH Page 18

BES LAB EEE B.Tech. III Year I Sem
Output File:
Node Voltages:
NODE VOLTAGE NODE VOLTAGE NODE VOLTAGE NODE VOLTAGE
( 1) 12.0000 ( 2) 12.0000 ( 3) 4.8000 ( 4) 2.4000
( 5) 0.0000 ( 6) 0.0000 ( 7) 2.4000
Mesh currents:
VOLTAGE SOURCE CURRENTS
NAME CURRENT
VS -7.200E-04
VX 7.200E-04
VY 2.400E-04
VZ 4.800E-04
VM 2.400E-04
TOTAL POWER DISSIPATION 8.64E-03 WATTS
Conclusion:
Extension:
Result: Mesh and Nodal analysis of electric circuit using pspice software is performed.
ANRH Page 19

BES LAB EEE B.Tech. III Year I Sem
5.Verification Of
Thevenin’s And Reciprocity Theorems
AIM: To verify thevenin’s and reciprocity theorem using pspice software
Apparatus:
1. Personal computer2. Pspice software
THEVENIN’STHEOREM:
Statement: Thevenin’s Theorem :It states that “Any linear circuit containing several voltages and resistances canbe replaced by just one single voltage in series with a single resistance connected across the load.Reciprocity theorem:
It states that “In a linear bilateral network the ratio of excitation to response remains constant even their positions are inter changed”.
PROCEDURE:
1. Open pspice AD software2. Select file New Text file3. Enter the code4. Save the file as filename.cir5. Run the file6. Check for errors7. View the results.
Conclusion:
ANRH Page 20
BES LAB EEE B.Tech. III Year I Sem
Extension:
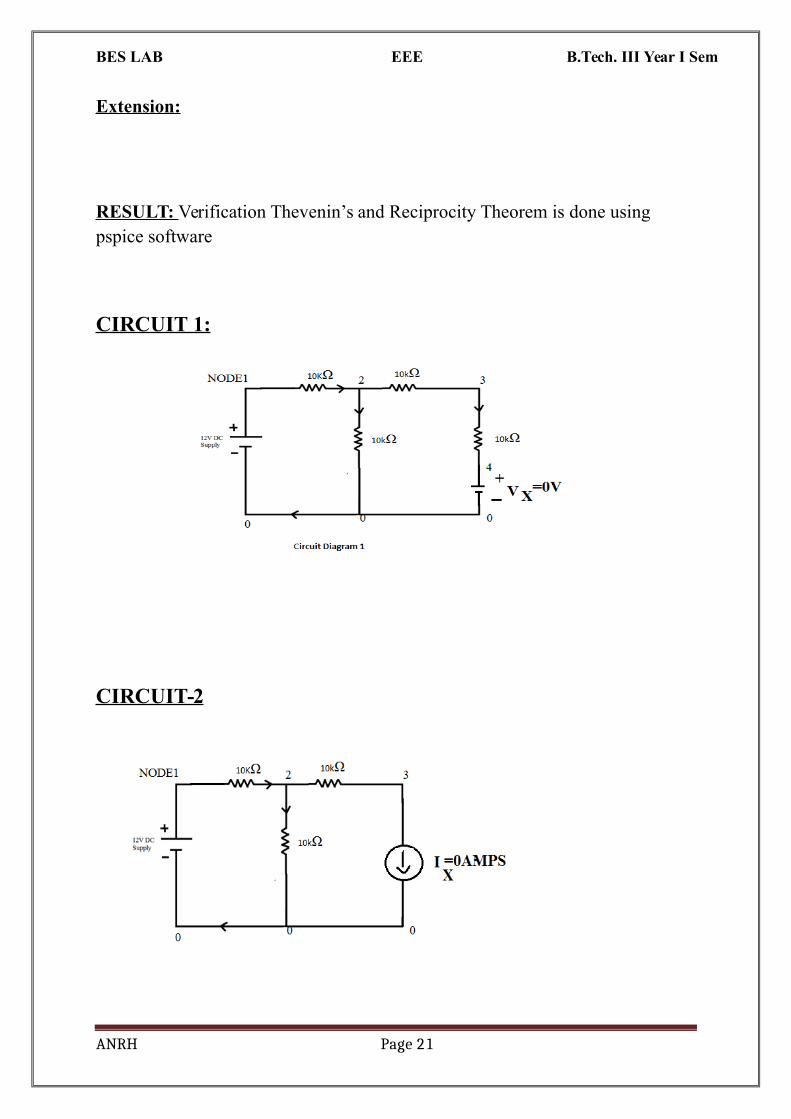
RESULT: Verification Thevenin’s and Reciprocity Theorem is done using pspice software
CIRCUIT 1:
CIRCUIT-2
ANRH Page 21

BES LAB EEE B.Tech. III Year I Sem
CIRCUIT-3
Verification Of Thevnins Theorem
Program:
Circuit-1: (finding current in Main circuit)
VS 1 0 DC 12VR1 1 2 10KOHMSR2 2 3 10KOHMSR3 2 0 10KOHMSRL 3 4 10KOHMSVX 4 0 0V.OP.END
Circuit-2( finding Vth)
ANRH Page 22

BES LAB EEE B.Tech. III Year I Sem
VS 1 0 DC 12VR1 1 2 10KOHMSR2 2 3 10KOHMSR3 2 0 10KOHMSI1 3 0 0AMPS.OP.END
Circuit-3: (finding current in equivalent circuit)
VTH 1 0 DC 6VRTH 1 2 15KOHMSRL 2 3 10KOHMSVX 3 0 0V.OP.END
OUTPUT FILE CIRCUIT -1:
NODE VOLTAGE NODE VOLTAGE NODE VOLTAGE NODE VOLTAGE
( 1) 12.0000 ( 2) 4.8000 ( 3) 2.4000 ( 4) 0.0000
VOLTAGE SOURCE CURRENTS NAME CURRENT
VS -7.200E-04 VX 2.400E-04
TOTAL POWER DISSIPATION 8.64E-03 WATTS
ANRH Page 23

BES LAB EEE B.Tech. III Year I Sem
OUTPUT FILE CIRCUIT -2:
NODE VOLTAGE NODE VOLTAGE NODE VOLTAGE NODE VOLTAGE
( 1) 12.0000 ( 2) 6.0000 ( 3) 6.0000
VOLTAGE SOURCE CURRENTS NAME CURRENT
VS -6.000E-04
TOTAL POWER DISSIPATION 7.20E-03 WATTS
OUTPUT FILE CIRCUIT -3:
NODE VOLTAGE NODE VOLTAGE NODE VOLTAGE NODE VOLTAGE
( 1) 6.0000 ( 2) 2.4000 ( 3) 0.0000
VOLTAGE SOURCE CURRENTS NAME CURRENT
VTH -2.400E-04 VX 2.400E-04
TOTAL POWER DISSIPATION 1.44E-03 WATTS
RECIPROCITY THEOREM
ANRH Page 24

BES LAB EEE B.Tech. III Year I Sem
CIRCUIT DIAGRAM1:
CIRCUIT DIAGRAM-2
VERIFICATION OF RECIPROCITY THEOREM
ANRH Page 25
BES LAB EEE B.Tech. III Year I Sem
Program:
Circuit-1:VS 1 0 DC 20VR1 1 2 3OHMSR2 2 0 4OHMSR3 2 3 2OHMSR4 3 4 2OHMSVX 4 0 0V.OP.END
Circuit-2:
VS 4 0 DC 20VR1 1 2 3OHMSR2 2 0 4OHMSR3 2 3 2OHMSR4 3 4 2OHMSVX 1 0 0V.OP.ENDVS 1 0 DC 20VR1 1 2 3OHMSR2 2 0 4OHMSR3 2 3 2OHMSR4 3 4 2OHMSVX 4 0 0V.OP.END
ANRH Page 26

BES LAB EEE B.Tech. III Year I Sem
Output File circuit-1:
NODE VOLTAGE NODE VOLTAGE NODE VOLTAGE NODE VOLTAGE
( 1) 20.0000 ( 2) 8.0000 ( 3) 4.0000 ( 4) 0.0000
VOLTAGE SOURCE CURRENTS NAME CURRENT
VS -4.000E+00 VX 2.000E+00
TOTAL POWER DISSIPATION 8.00E+01 WATTS
Output File circuit-2:
NODE VOLTAGE NODE VOLTAGE NODE VOLTAGE NODE VOLTAGE
( 1) 0.0000 ( 2) 6.0000 ( 3) 13.0000 ( 4) 20.0000
VOLTAGE SOURCE CURRENTS NAME CURRENT
VS -3.500E+00 VX 2.000E+00
TOTAL POWER DISSIPATION 7.00E+01 WATTS
Conclusion:
ANRH Page 27

BES LAB EEE B.Tech. III Year I Sem
Extension
Result
ANRH Page 28
BES LAB EEE B.Tech. III Year I Sem
8.Harmonic analysis of nonsinusoidal waveforms
Aim : To obtain harmonic analysis of non sinusoidal wave forms
Apparatus:
1. Personal computer2. Pspice software
Theory: Harmonic analysis is a mathematical procedure for describing andanalyzing the phenomena of a periodically recurrent nature. itconcerns with the representation of functions or signals as thesuperimposition of basic waves. The inputs for non sinusoidal can be pulse, square, triangle etc
PROCEDURE:
1. Open pspice AD software2. Select file New Text file3. Enter the code4. Save the file as filename.cir5. Run the file6. Check for errors7. View the results.
Conclusion:
Extension:
ANRH Page 29

BES LAB EEE B.Tech. III Year I Sem
Result: Harmonic analysis of non sinusoidal wave forms using pspice software is done
For the circuit apply different nonsinusoidal wave forms and obtain harmonic analysis
Program:
; Harmonic analysisVS 1 0 PULSE (0 1 0 10NS 10NS 0 100NS)RS 1 2 100OHMSE1 3 0 2 0 0.1 RL 4 5 20OHMVX 5 0 DC 0VS1 3 4 3 0 SMOD.MODEL SMOD VSWITCH (RON=5M ROFF=10E+9 VON=25M VOFF=0.0).TRAN 5US 1MS.FOUR 1KHZ 11 I(VX).END
ANRH Page 30

BES LAB EEE B.Tech. III Year I Sem
OUTPUT FILE: **** Voltage Controlled Switch MODEL PARAMETERS****************************************************************************** SMOD RON 5.000000E-03 ROFF 10.000000E+09 VON .025 VOFF 0
**** INITIAL TRANSIENT SOLUTION TEMPERATURE = 27.000 DEG C****************************************************************************** NODE VOLTAGE NODE VOLTAGE NODE VOLTAGE NODE VOLTAGE( 1) 0.0000 ( 2) 0.0000 ( 3) 0.0000 ( 4) 0.0000
( 5) 0.0000 VOLTAGE SOURCE CURRENTS NAME CURRENT
VS 0.000E+00 VX 0.000E+00
TOTAL POWER DISSIPATION 0.00E+00 WATTS
**** FOURIER ANALYSIS TEMPERATURE = 27.000 DEG C
******************************************************************************
FOURIER COMPONENTS OF TRANSIENT RESPONSE I(VX)
ANRH Page 31

BES LAB EEE B.Tech. III Year I Sem
DC COMPONENT = 1.989717E-18
Total job time (using Solver 1) = 11.79
ANRH Page 32

BES LAB EEE B.Tech. III Year I Sem
9.SIMULATION OF DC CIRCUIT
Aim: To Simulate a DC circuit using pspice software
Apparatus:
1. Personal computer2. Pspice software
Theory: Sources in DC circuits are constant voltages or currents. theydon’t vary with time. The simulation of DC circuit with passive elements require modeling of
1. Resistors2. Model parameters3. Operating temperature4. DC source5. Dc output variable6. Types of Dc analysis
The DC analysis is done by following commands
1. .op Dc operating point
2. .TF Transfer function analysis3. . DC sweepTransfer characteristics4. . Model gives variation of parameters
PROCEDURE:
1. Open pspice AD software2. Select file New Text file3. Enter the code4. Save the file as filename.cir5. Run the file6. Check for errors7. View the results.
Conclusion:
ANRH Page 33

BES LAB EEE B.Tech. III Year I Sem
Extension:
Result: Simulation of a DC circuit using pspice software is doneExample:
For the circuit with the values ofR1 &R2 increased by +5% and those of R3 &R4 decreased by 10% simulate DC circuit obtain transfer function at node (4,0) with respect to VS
SOLUTION : If R1 and R2 are increased by 5% means the value of R1 and R2 are to be multiplied By 1.05 i.e. (1+(5/100))=1.05Similarly if R3 and R4 are decreased by 10% means model R with (1(10/100))=0.9
.TF command gives the transfer function between V (4,0) and VS
Program:
; SIMULATION OF DC CIRCUIT
VS 1 0 DC 20VIS 0 4 DC 50MAR1 1 2 RMOD1 500R2 2 5 RMOD1 800
ANRH Page 34

BES LAB EEE B.Tech. III Year I Sem
.MODEL RMOD1 RES (R=1.05)R3 2 3 RMOD2 1KOHMR4 4 0 RMOD2 200.MODEL RMOD2 RES (R=.9)VX 3 0 DC 0VVY 5 4 DC 0V.OP.TF V(4,0) VS.END
OUTPUTFILE:
**** Resistor MODEL PARAMETERS
******************************************************************************
RMOD1 RMOD2 R 1.05 .9
**** 05/16/18 11:20:57 ****** PSpice Lite (October 2012) ****** ID# 10813 ****
**** SMALL SIGNAL BIAS SOLUTION TEMPERATURE = 27.000 DEG C
******************************************************************************
NODE VOLTAGE NODE VOLTAGE NODE VOLTAGE NODE VOLTAGE( 1) 20.0000 ( 2) 11.7410 ( 3) 0.0000 ( 4) 9.4836
( 5) 9.4836 VOLTAGE SOURCE CURRENTS NAME CURRENT
VS -1.573E-02 VX 1.305E-02 VY 2.687E-03
ANRH Page 35

BES LAB EEE B.Tech. III Year I Sem
TOTAL POWER DISSIPATION 3.15E-01 WATTS **** OPERATING POINT INFORMATION TEMPERATURE = 27.000 DEG C **** *** **** **** ****
**** SMALL-SIGNAL CHARACTERISTICS
V(4,0)/VS = 8.411E-02
INPUT RESISTANCE AT VS = 1.003E+03
OUTPUT RESISTANCE AT V(4,0) = 1.560E+02
JOB CONCLUDED
**** JOB STATISTICS SUMMARY***********************************************************************
Total job time (using Solver 1) = .02
ANRH Page 36
BES LAB EEE B.Tech. III Year I Sem
10. TRANSINT ANALYSIS
Aim: To obtain a Transient analysis of RLC series circuit for pulse in put
Apparatus:
1. Personal computer2. Pspice software
Theory: Whenever a circuit is excited with a periodic or non periodic input theresponse due to input is divide in to two parts
1. Transient response: It is the time take by the response before reaching its
final state. It is given by tr
2. Steady state Response: It is the time interval for which the response remains
in final steady state It is given by ts
Total time response is given as
T=tr +ts
Transient analysis deals with the response of output during transient period.
PROCEDURE:
1. Open pspice AD software2. Select file New Text file3. Enter the code4. Save the file as filename.cir5. Run the file6. Check for errors7. View the results.
ANRH Page 37

BES LAB EEE B.Tech. III Year I Sem
Conclusion:
Extension:
RESULT: Simulation of Transient analysis of RLC series circuit for pulse input is done using pspice software.
CIRCUIT DIAGRAM:
ANRH Page 38

BES LAB EEE B.Tech. III Year I Sem
PROGRAM:
; TRANSIENT RESPONSE OF RLC CIRCUIT
VIN 7 0 PULSE (-220V 220V 0 1NS 1NS 100US 200US)R1 7 5 2L1 5 3 50UHC1 3 0 10UF;.TRAN TSTEP TSTOP.TRAN 1US 400US.PRINT TRAN V(R1) V(L1) V(C1).PLOT TRAN V(3) I(R1).PROBE .END
OUTPUT FILE:
VivaVoce Questions:
ANRH Page 39

BES LAB EEE B.Tech. III Year I Sem
1. What is simulation?2. List different types of software’s Available to simulate a circuit?3. Why .op command used4. What is the use of .plot command5. .End command is used for what purpose?6. .probe command is used for what purpose?7. What is the use of Mat lab?8. How to save a file in mat lab?9. What is the use of mat lab editor?10..Trans command is used for what purpose?11.X (label) is used for what purpose?12. Give the command used to get Laplace transform of equation?13.Give the command used to get Inverse Laplace transform of equation?14.Give the command for addition of two matrices in mat lab15. If ; is not typed at the end of each line in mat lab editor what happens?16.What is the use of grid in graph plotted in the mat lab?17. Clc command is use for what?18.Clear command is use for what?19.How to clear a variable in Mat lab20.What is the command used to get inverse and transpose of a matlab21.Disp command is used for?22.Is mat lab command case sensitive
ANRH Page 40

BES LAB EEE B.Tech. III Year I Sem
ANRH Page 41