Beryllium Content of American Coals - USGS Content of American Coals By TAISIA STADNICHENKO, PETER...
54
Beryllium Content of American Coals GEOLOGICAL SURVEY BULLETIN 1084-K
-
Upload
dinhkhuong -
Category
Documents
-
view
216 -
download
0
Transcript of Beryllium Content of American Coals - USGS Content of American Coals By TAISIA STADNICHENKO, PETER...

Beryllium Content of American Coals
GEOLOGICAL SURVEY BULLETIN 1084-K


Beryllium Content of American CoalsBy TAISIA STADNICHENKO, PETER ZUBOVIC, and NOLA B. SHEFFEY
CONTRIBUTIONS TO GEOCHEMISTRY
GEOLOGICAL SURVEY BULLETIN 1084-K
UNITED STATES GOVERNMENT PRINTING OFFICE, WASHINGTON : 1961

UNITED STATES DEPARTMENT OF THE INTERIOR
STEWART L. UDALL, Secretary
GEOLOGICAL SURVEY
Thomas B. Nolan, Director
For sale by the Superintendent of Documents, U.S. Government Printing Office Washington 25, D.C. - Price 70 cents (paper cover)

CONTENTS
Page Abstract.__-__________________________________________________ 253Introduction. _____________________________________________________ 254
Purpose and scope___________________________-_________________ 254Acknowledgments _-_____---_-_--_-_______-_-_--_____-_-_____-_ 254Previous studies of beryllium in coal--_---_-_-------__--------___ 254
Geochemistry of beryllium________________________________________ 255Description of the coals. ___________________________________________ 259
Eastern province, Appalachian region.___________________________ 259Northern part___________________________________________ 259Southern part._________________________________________ 259
Interior province.._____________________________________________ 261Eastern region.___________________________________________ 261Western region____________________________________________ 262
Northern Great Plains province.________________________________ 262Rocky Mountain province._____________________________________ 262
Sampling and preparation of coals_____________-__-______------__-_-_ 263Method of analysis___----___-------__--------------_---_---------- 263Presentation of data.________-_----___--_-_-_-_------_---_----_-_-_ 263General remarks on the data________________________________________ 276Distribution of beryllium in coal.___________________________________ 278
Some petrographic constituents______________-__-___---_---___-- 278Float-sink fractions____------___--------_----____---____.-_ 279Columnar samples.____________________________________________ 281Between coal beds_______----_____--_-_-____------__--_-------- 282Coal ash of the provinces_--_____-_--_-----_-___--__-_---------- 284
Effects of position in the basin and proximity to source rocks----_--_-_- 286Probable method of beryllium accumulation in coal-_-______-----___--- 289Economics of beryllium in coal._____________________________________ 292Summary and conclusions__________________________________________ 293Literature cited_-__-_____-_-------___----_--__----_----_-----_---- 293
m

IV CONTENTS
ILLUSTKATIONS
[All plates in pocket]
PLATE 1. Distribution of beryllium in blocks of columnar samples.2. Relation of some high beryllium in coal areas to a possible
erosional source.Page
FIGURE 41. Map showing location of the provinces and regions referred to intext___.____________________________________ 260
42. Graphs showing beryllium distribution of the ash of float andsink fractions of coal.__________-___-_-_--_-_____--___- 280
43. Correlation chart showing distribution of the individual samplesby province and by the beryllium content of the ash_ _______ 284
44. Map showing beryllium distribution in bed 5 of Illinois and itscorrelatives in Indiana and western Kentucky ____________ 287
45. Diagram showing apparent solubility of beryllium hydroxide asa function of pH________________________-______-____-_ 290
TABLES
Page TABLE 1. Estimates of the beryllium content in different rock types and its
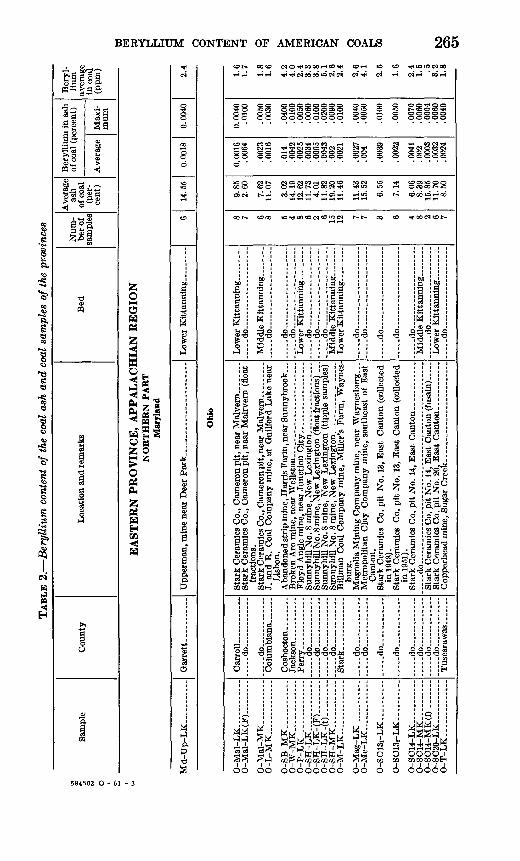
abundance in the earth's crust_-_____--_-_____-__________ 2562. Beryllium content of the coal ash and coal samples of the prov
inces _ _______________________________________________ 2653. Summary of maximum and minimum averages of the beryllium
content of beds given in table 2__________________________ 2764. Beryllium and ash content of vitrain and fusain samples_____ 2785. Float-sink experiments with coal samples showing the trend of
beryllium content_____________________________________ 2816. Beryllium content of various coal beds in limited areas._______ 2837. Beryllium content of the average ash in the coal samples of the
provinces. _ _-_____-__-______-_____----__----_-_-------_ 2858. Maximum beryllium concentration in the columnar coal samples. 292

CONTRIBUTIONS TO GEOCHEMISTRY
BERYLLIUM CONTENT OF AMERICAN COAL
By TAISIA STADNICHENKO, PETER ZUBOVIC, and NOLA B. SHEFFEY
ABSTRACT
The results of spectrochemical analyses of 1,385 coal ash samples suggest a significant distribution pattern for beryllium. The highest average beryllium content of coal ash (62 ppm) was found in the Appalachian region. An average content of beryllium in ash of 49 ppm was found in the Interior province. This figure for the Interior province is very close to the average for all the coal sam ples studied, 46 ppm. The average beryllium content of the samples from the northern Great Plains and Rocky Mountain provinces is about one-half the average for all the coal ash samples examined.
Considerable variation in beryllium concentration exists within each of the provinces. In the Eastern province very high concentrations of beryllium in ash are found in eastern Kentucky (0.067 percent and 0.081 percent). In the Interior province, the Eastern region has a higher beryllium content in the coal beds along the north and southeast edges and a lower content in the central parts; in the Western region, the coal beds of the McAlester Basin (Oklahoma and Arkansas) have a much lower content of the element than do the coal beds of the central and northern parts of the region. In the northern Great Plains province a similar distribution is found; the coal beds of the Great Falls and the Lewistown fields have a much higher beryllium content than do those of the rest of this province.
Large variations are found in concentrations of beryllium in different samples of the same bed. The beryllium content of bed 5 of Illinois ranges from 0.0011 percent (9.52 percent ash) to 0.0050 percent (6.52 percent ash). Similar varia tions are noted in other beds from which two or more samples were collected and analyzed. The distribution of beryllium in the blocks of columnar coal sam ples is reasonably uniform. In a few, however, concentrations were found in the top, center, or bottom part of the bed.
A study of the various types of coal indicates that beryllium is primarily con centrated in vitrain. Float-sink experiments clearly show that the concentra tion of beryllium is in the coal substance.
A study of the data has led to the belief that the accumulation of beryllium by coal was a syngenetic process. Conclusions have been reached that (a) the beryllium content of the coal is primarily dependent on the beryllium content of the rocks that contributed material to the coal-depositional sites, (b) the position in the basin determined the amount of beryllium in the coal samples, (c) rank and age of the coal bed is not related to the beryllium content of the coal, and (d) the chemical properties of beryllium suggest a way by which the element can be released from rocks, can be transported to a coal depositional site, and can be come fixed in the coal.
253

254 CONTRIBUTIONS TO GEOCHEMISTRY
INTRODUCTION
PURPOSE AND SCOPE
This report on beryllium is a part of a much broader study, which includes 15 other minor elements in coal. Work was started on a limited scale in 1948 and has gradually been expanded to cover most of the coal-producing areas of the United States.
Two kinds of reports are being prepared: One is a series dealing with individual elements, the other is a series on the content of all 16 elements as found in the analyses of coal ash from the coal-producing regions and provinces. This report is the second of the series deal ing with individual elements. A detailed background of this study is given in the first report, which is on the concentration of germanium in the ash of American coals (Stadnichenko and others, 1953).
The coal samples were collected from 22 States and generally rep resent the principal beds in the areas. Only unweathered coal sam ples were collected and, consequently, only those mines that were in operation or had recently been in operation were sampled. Channel, auger, grab, and other types of coal samples, as noted in the tables, were submitted to the authors for analysis.
This report, which gives the data accumulated to January 1958, is based on 1,342 determinations for beryllium; 43 additional analyses are not treated in the text (see p. 284).
ACKNOWLEDGMENTS
The authors express gratitude to the coal miners, the mine super intendents, and the coal-mine operators for their help and for per mission to collect samples in the mines; and to A. C. Fieldner, H. P. Greenwald, and K. F. Abernethy of the U.S. Bureau of Mines for their permission to use the laboratory facilities of the Pittsburgh Experimental Station. H. I. Smith and his associates and J. W. Huddle of the U.S. Geological Survey were very cooperative in giv ing assistance in the field.
Although most of the spectrographic analyses were made by Nola B. Sheffey, analyses in the early stages of the work were made by K. J. Murata, H. J. Kose, Jr., Janet D. Fletcher, and Elizabeth L. Hufschmidt of the U.S. Geological Survey.
PREVIOUS STUDIES OP BERYLLIUM IN COAL
Goldschmidt and Peters (1935) reported on the minor-element content in 17 samples of the ash of brown, bituminous, and anthracite coal from Germany and England. They gave 0.1 percent beryllium in ash as a maximum content and 0.03 percent beryllium in ash as an average. Goldschmidt (1935) found that some elements, including beryllium, are concentrated in forest humus and suggested that the

BERYLLIUM CONTENT OF AMERICAN COALS 255
high values for some of these elements in coal are a result of this type of accumulation.
Zilbermintz and Rusanov (1936) spectrographically determined the beryllium content of 602 coal samples from different fields of the U.S.S.R.; their limit of detectability was 0.001 percent or 5 clarkes. The clarke of an element is its average abundance in the earth's crust; for this report Sandell's (1952) figure of 2 ppm is used. The following tabulation gives the results summarized by Zilbermintz and Rusanov (1936, table 5):
Distribution of beryllium in coal samples from various basins in the U.S.S.R.
Coal basin
Donets ___________________
Tkvibuli..
Total- ___ . _ . _
Number of coal samples having beryllium in the various spectrographic ranges as indicated
0.01-0.1
1 1
1
3
0.001-0.01
18 5 4 3 6
36
<0.001
132 8
29 14 72
255
0
153 361
145
308
Total num ber of sam
ples
304 17 39 18
224
602
Headlee and Hunter (1955, p. 45, 55, 100) determined the content of beryllium and 35 other elements, in 594 ash samples of 35 columnar samples of coal beds from West Virginia. Beryllium was found in all but four of the samples. The limit of detectability was 0.0005 percent beryllium. The average beryllium content in the coal averaging 10.1 percent ash was 0.0029 percent. The data of Headlee and Hunter show a higher beryllium content in the coals of the south ern part of West Virginia than in those of the northern part.
Duel and Annell (1956) reported on the occurrence of beryllium in 319 samples of lignite and coal from Colorado, North Dakota, South Dakota, and Texas. They found that the beryllium content in ash commonly ranges from 0.0001 to 0.001 percent. Duel and Annell (1956, table 5) give 151 samples from Harding County, S. Dak., which showed a maximum concentration of beryllium ranging from 0.1 to 1.0 percent; however, the number of samples in this range was not stated.
GEOCHEMISTRY OF BERYLLIUM
The first estimate of the abundance of beryllium in the earth's crust (10 ppm) was made by Clarke and Washington (1924, p. 21). Since that time, especially in the past few years, many investigators have used improved methods of analysis on different rock types and min erals and have expanded the knowledge of the geochemical environ ment-of the element. A summary of the estimates of beryllium in different rock types is given in table 1.

256 CONTRIBUTIONS TO GEOCHEMISTRY
One of the first comprehensive geochemical studies of beryllium was made by Goldschmidt and Peters (1932). Many rock types and minerals were examined spectrographically, and the average abun dance of the element in the earth's crust was estimated to be less than 3.3 ppm and more likely to be 1.8 ppm. The latter figure is in close agreement with the estimate of 2 ppm by Sandell (1952). Later, Goldschmidt (1937, p. 656) estimated the abundance of beryllium in the earth's crust to be 6 ppm based on the analysis of composite sam ples of shale. This value has often been quoted by geochemists. Goldschmidt and Peters estimated a value of 3.6 ppm for granite, which is also in close agreement with estimates for the abundance of the element in granite given by Sandell (1952) and Beus (1956b, p. 76-79). Goldschmidt and Peters (1932) concluded that beryllium is a lithophile element, concentrated largely in residual melts and solutions.
TABLE 1. Estimates of the beryllium content in different rock types and its abun dance in the earth's crust
Rock type and earth's crust
Basalt ____ ____________Nepheline syenite. __________ .Diorites... ________________
Do.. .................. ...........Do..... .......................
Shales.. _ . _Shale and clay ______________
Do.. _ Do
Upper part of the lithosphere ______Do __ . ___ ...... .................
Beryllium content (ppm.)
6.2.3.65
1.61.83.6353.67
106423.5
Author
Borodin, 1956.Sandell, 1952.
Sandell, 1952.
Rankama and Sahama, 1950.
Clarke and Washington, 1924.Goldschmidt, 1937.
Sandell, 1952.Beus, 1956a.
Fersman (1939, p. 46-49) mentioned 32 beryllium-bearing minerals; most are associated with granitic pegmatite, some with nepheline syenite and syenitic pegmatite, and a few are hydrothermal postpeg- matitic contact-type minerals. Fersman concluded that beryllium was predominantly concentrated in the middle phase of the residual granitic crystallization of pegmatites and in the analogous phase of pneumatolytic minerals. He regarded the strong ionic polarization of beryllium to be the reason for its relatively poor capacity for migra tion and its crystallization in the median phases of pegmatitic proc esses; he believed that this was why beryllium does not reach the supergene phase in the course of its migration. Beryllium is, there fore, unknown in surface deposits in which its strong polarization would lead to very rapid absorption by soils.
BERYLLIUM CONTENT OF AMERICAN COALS 257
Fersman's estimate for the abundance of beryllium in the earth's crust is 4 ppm. He noted beryllium to be a deficient element in the earth's crust and that the bulk of it is in a dispersed state.
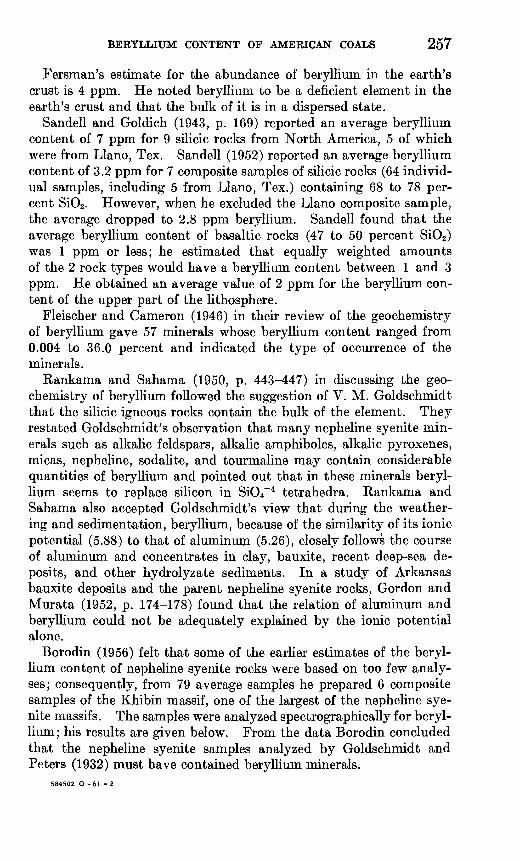
Sandell and Goldich (1943, p. 169) reported an average beryllium content of 7 ppm for 9 silicic rocks from North America, 5 of which were from Llano, Tex. Sandell (1952) reported an average beryllium content of 3.2 ppm for 7 composite samples of silicic rocks (64 individ ual samples, including 5 from Llano, Tex.) containing 68 to 78 per cent SiO2 . However, when he excluded the Llano composite sample, the average dropped to 2.8 ppm beryllium. Sandell found that the average beryllium content of basaltic rocks (47 to 50 percent SiO2 ) was 1 ppm or less; he estimated that equally weighted amounts of the 2 rock types would have a beryllium content between 1 and 3 ppm. He obtained an average value of 2 ppm for the beryllium con tent of the upper part of the lithosphere.
Fleischer and Cameron (1946) in their review of the geochemistry of beryllium gave 57 minerals whose beryllium content ranged from 0.004 to 36.0 percent and indicated the type of occurrence of the minerals.
Rankama and Sahama (1950, p. 443-447) in discussing the geo chemistry of beryllium followed the suggestion of V. M. Goldschmidt that the silicic igneous rocks contain the bulk of the element. They restated Goldschmidt's observation that many nepheline syenite min erals such as alkalic feldspars, alkalic amphiboles, alkalic pyroxenes, micas, nepheline, sodalite, and tourmaline may contain considerable quantities of beryllium and pointed out that in these minerals beryl lium seems to replace silicon in SiO4~4 tetrahedra. Rankama and Sahama also accepted Goldschmidt's view that during the weather ing and sedimentation, beryllium, because of the similarity of its ionic potential (5.88) to that of aluminum (5.26), closely follows the course of aluminum and concentrates in clay, bauxite, recent deep-sea de posits, and other hydrolyzate sediments. In a study of Arkansas bauxite deposits and the parent nepheline syenite rocks, Gordon and Murata (1952, p. 174-178) found that the relation of aluminum and beryllium could not be adequately explained by the ionic potential alone.
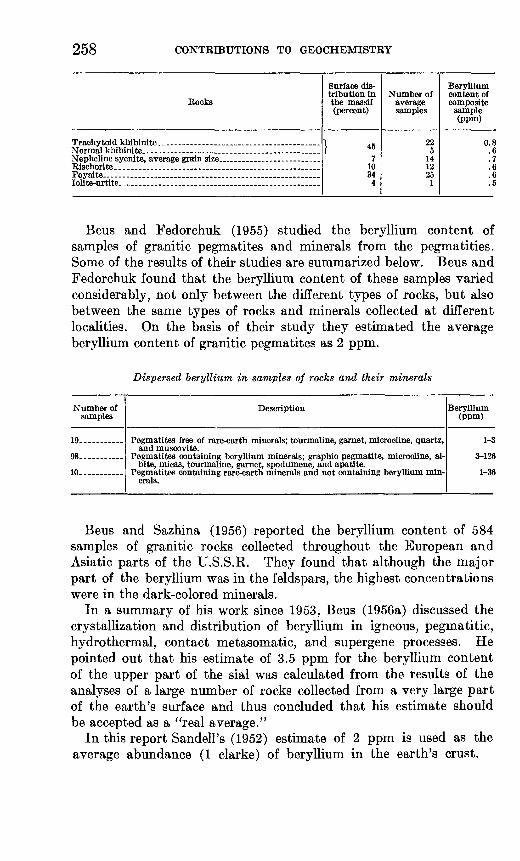
Borodin (1956) felt that some of the earlier estimates of the beryl lium content of nepheline syenite rocks were based on too few analy ses; consequently, from 79 average samples he prepared 6 composite samples of the Khibin massif, one of the largest of the nepheline sye nite massifs. The samples were analyzed spectrographically for beryl lium; his results are given below. From the data Borodin concluded that the nepheline syenite samples analyzed by Goldschmidt and Peters (1932) must have contained beryllium minerals.
584502 O -61 -2
258 CONTRIBUTIONS TO GEOCHEMISTRY
Rocks
Normal khibinite ________________________
Surface distribution inthe massif(percent)
} 457
10344
Number ofaveragesamples
225
141225
1
Berylliumcontent ofcomposite
sample(ppm)
0.8.6.7.6.6.5
Beus and Fedorchuk (1955) studied the beryllium content of samples of granitic pegmatites and minerals from the pegmatities. Some of the results of their studies are summarized below. Beus and Fedorchuk found that the beryllium content of these samples varied considerably, not only between the different types of rocks, but also between the same types of rocks and minerals collected at different localities. On the basis of their study they estimated the average beryllium content of granitic pegmatites as 2 ppm.
Dispersed beryllium in samples of rocks and their minerals
Number of samples
19
98..
10.
Description
and muscovite.
bite, micas, tourmaline, garnet, spodumene, and apatite.
erals.
Beryllium (ppm)
1-3
3-126
1-36
Beus and Sazhina (1956) reported the beryllium content of 584 samples of granitic rocks collected throughout the European and Asiatic parts of the U.S.S.K. They found that although the major part of the beryllium was in the feldspars, the highest concentrations were in the dark-colored minerals.
In a summary of his work since 1953, Beus (1956a) discussed the crystallization and distribution of beryllium in igneous, pegmatitic, hydro thermal, contact metasomatic, and supergene processes. He pointed out that his estimate of 3.5 ppm for the beryllium content of the upper part of the sial was calculated from the results of the analyses of a large number of rocks collected from a very large part of the earth's surface and thus concluded that his estimate should be accepted as a "real average."
In this report Sandell's (1952) estimate of 2 ppm is used as the average abundance (1 clarke) of beryllium in the earth's crust.
BERYLLIUM CONTENT OF AMERICAN COALS 259
DESCRIPTION OF THE COALS
The coal deposits that have been analyzed for beryllium range from Pennsylvanian to Eocene. The largest number of samples, collected from the Eastern and the Interior provinces, are from the coal of Pennsylvanian age. Coal deposits of the Northern Great Plains province are principally of Paleocene age, and some are from the Jurassic, Cretaceous, and Eocene. Coal deposits of the Rocky Mountain province are mostly of Cretaceous age with some Eocene. The subdivisions used in this report are shown in figure 41 and described below.
EASTERN PROVINCE, APPALACHIAN REGION
Coal samples collected from the Eastern province are of Penn sylvanian age, with the exception of one sample of anthracite of Mississippian age. All the samples are from the Appalachian region, which is divided for the purposes of this report into northern and southern parts.
NORTHERN PART
The coal samples are of the Lower and Middle Kittanning coal beds of the Allegheny formation. Of the 20 columnar samples reported, 17 are from Ohio, 2 from Pennsylvania, and 1 from Mary land. The coal samples are of bituminous rank, with those from the western part of the basin lower in rank than those from the eastern part; the increase in rank from west to east is gradual.
SOUTHERN PART
In this part of the Appalachian region are the coal fields of West Virginia, Virginia, eastern Kentucky, Tennessee, Georgia, and Alabama. The most extensively sampled coal beds were in Alabama, with 23 columnar samples of 14 different beds, and in eastern Ken tucky, with 19 columnar samples of 13 different beds. From the coal fields of the other States 9 columnar samples are reported from West Virginia, 7 from Tennessee, 3 from Georgia, and 2 from Virginia. All the coal beds of Alabama, West Virginia, and Virginia correspond in age to the Pottsville formation. In eastern Kentucky the coal corresponds in age to the Pottsville and Allegheny formations.
Generally the coal is similar in rank to those of the northern part of the Appalachian region. Coal of higher rank formed along the east edge of the basin. The coals are mostly of high- and medium- volatile bituminous rank with some of low-volatile bituminous rank in the extreme eastern part.
In Alabama the coal beds range in thickness from 2 to 5 feet; in eastern Kentucky the range is about 2 to 23 feet; in Tennessee,

260CONTRIBUTIONS TO GEOCHEMISTRY

BERYLLIUM CONTENT OF AMERICAN COALS 261
about 3 to 5 feet; and in West Virginia, the Pocahontas No. 3 bed is 12 to 15 feet thick.
INTERIOR PROVINCE
This province includes four regions, Northern (Michigan), Eastern (Illinois, Indiana, and western Kentucky), Western (Iowa, Missouri, Kansas, Oklahoma, and Arkansas), and Southwestern (Texas). Samples from only the Eastern and Western Interior regions have been collected and studied. Four samples of Texas and Arkansas lignite, which are actually in the Gulf province, are included in this province.
EASTERN REGION
The Eastern region is divided into two areas, the Illinois-Indiana and the western Kentucky areas. At the time of deposition these areas were probably continuous, but since that time structures have developed which do not permit them to be treated separately. The principal structures that separate these areas are fault zones and an uplift in southern Illinois. The generalized structural feature of the Illinois-Indiana coal fields is a broad shallow basin with its deepest part in southeastern Illinois. The dip of the formations from the margins of the deepest part is gradual. Many minor structures are present throughout the basin. In the southern part of this area the Shawneetown fault system and uplift cause the coal beds to dip very steeply and even to be overturned in some places.
In western Kentucky the deepest part of the basin of coal-bearing rocks is near the Ohio Kiver opposite the deepest part of the basin in Illinois. As in the Illinois-Indiana part of the region, the dip is very gradual from the margins to the center of the basin. All the coals of the region are found in equivalents of the Pottsville and Allegheny formations of Pennsylvanian age. All the coals are of high-volatile B and C bituminous rank; some are used in the pro duction of coke.
The principal beds that are being mined are No. 5 of Illinois, which is correlated with Bed V of Indiana and No. 9 of western Kentucky; and No. 6 of Illinois, correlated with Bed VI of Indiana and No. 11 of western Kentucky. Other beds which are being mined are the Davis, DeKoven, Murphysboro, and Nos. 2 and 7 in Illinois; Lower Block, Minshall, III and VII of Indiana, and Nos. 6, 12, and 14 of western Kentucky.
Beds No. 5 of Illinois, with its correlatives in Indiana and western Kentucky, and No. 6 of Illinois and its correlatives in the other States were the most thoroughly sampled by the authors.
262 CONTRIBUTIONS TO GEOCHEMISTRY
WESTERN REGION
The coal and lignite samples from the Western region come from Arkansas, Iowa, Missouri, Oklahoma, and Texas. Several samples that were collected in Kansas have not been analyzed. Although the coal from Arkansas and Oklahoma was the most thoroughly sampled, many of the samples are now being processed and the results are not available for this report.
The coal samples from Iowa, Missouri, Oklahoma, and most of Arkansas are bituminous in rank and are of Pennsylvanian age. The samples of lignite of Eocene age from the Gulf province were too few in number to warrant a separate description. For con venience they are included in this region.
Most coal in the Western region is high- or medium-volatile bi tuminous in rank. The coal of the McAlester basin in eastern Oklahoma and west-central Arkansas shows a progressive increase in rank from west to east. Coal in the southwestern part of the basin is high-volatile bituminous in rank; eastward it grades to medium-volatile bituminous. In the vicinity of the Oklahoma- Arkansas border, the rank has increased to low-volatile bituminous. Along the eastern part of the basin, coal is of semianthracite rank.
NORTHERN GREAT PLAINS PROVINCE
Coal samples from this province were collected in Montana, North Dakota, and Wyoming; most of the samples are from Montana, and the fewest are from Wyoming. In addition, 26 channel and auger samples were submitted to the authors by Survey geologists.
Four of the columnar samples are from coal of Jurassic age from central Montana; one is from coal of Cretaceous age from north-cen tral Montana; six are channel samples from coal of Eocene age from Wyoming; the rest of the samples are coal from the Tongue River member of the Fort Union formation.
The rank of the coal ranges from lignite in the eastern part of the province to subbituminous A to C on the western part; this transition is very gradual and no precise line of demarcation can be drawn.
ROCKY MOUNTAIN PROVINCE
Coal samples of this province were collected in Wyoming, Colorado, Utah, and New Mexico. Colorado is the most thoroughly sampled State. Although this province has been more adequately sampled than some of the others, little of the analytical work has been completed.
The coal samples range in age from Cretaceous to Eocene; most of the samples are from the Upper Cretaceous Mesaverde formation.
BERYLLIUM CONTENT OF AMERICAN COALS 263
Coal samples collected from the Raton formation in southeastern Colorado and New Mexico are of Cretaceous and Paleocene age, and those from the Hanna formation in Wyoming are of Eocene age. Although blocks of coal from only two mines in Utah are reported, other mines were sampled, but analyses have not been made.
SAMPLING AND PREPARATION OF COALS
The sampling and ashing of coal have been adequately explained by Stadnichenko and others (1953, p. 2-3). However, many of the samples used in this report have been cleaned by flotation methods, which were not previously described. Coal with an ash content greater than 5 percent was processed as follows: Forty grams of 100-mesh coal was distributed among four 100-ml centrifuge tubes. A mixture of carbon tetrachloride and ethyl alcohol of the proper specific gravity was added and the mixture thoroughly stirred. The tubes were centrifuged for 20 minutes at 800 rpm. After this, the tubes were removed and the float cakes and liquid decanted on to Whatman No. 42 filter paper placed in a Buchner funnel. The sink fraction was scraped out of the tubes into a porcelain crucible. The float fraction was also placed in a porcelain crucible. Both were then dried in an oven at about 70°C. After the fractions were dried and weighed, 10 grams of the float fraction was ashed in the same manner as described for raw coal.
METHOD OF ANALYSIS
The determination of beryllium in the ash of the coal samples was made by spectrochemical analysis. The method has been described for germanium and other minor elements (Stadnichenko and others, 1953), but beryllium was not present in the standards used in those analyses. A set of standards containing beryllium oxide in the same pegmatite-base material was used for beryllium determinations. In addition to these synthetic standards, two chemically and spectro- chemicalry analyzed samples of beryl containing 0.05 and 0.26 percent BeO were diluted in pegmatite base and used to validate the work ing curve.
For concentrations near the limit of detectability for beryllium (0.0001 percent) the spectral line Be 2348.61 A was used. The spectral line Be 3131.07 A was used for concentrations above 0.001 percent.
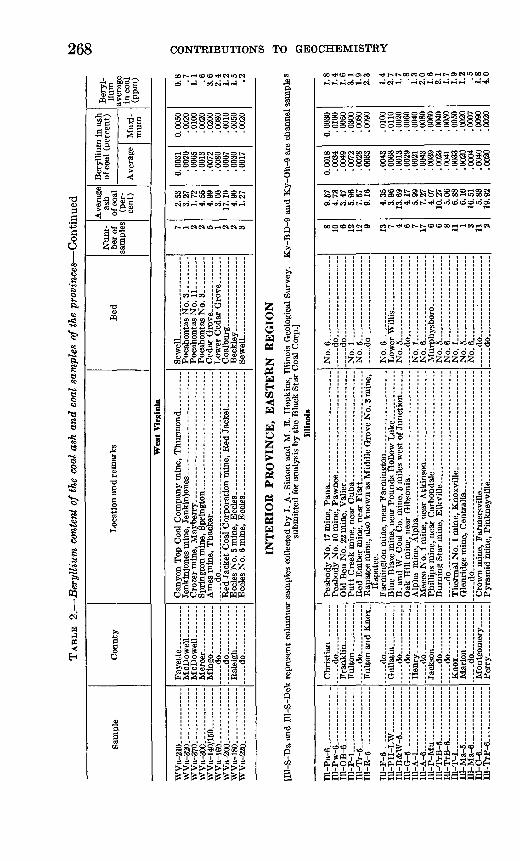
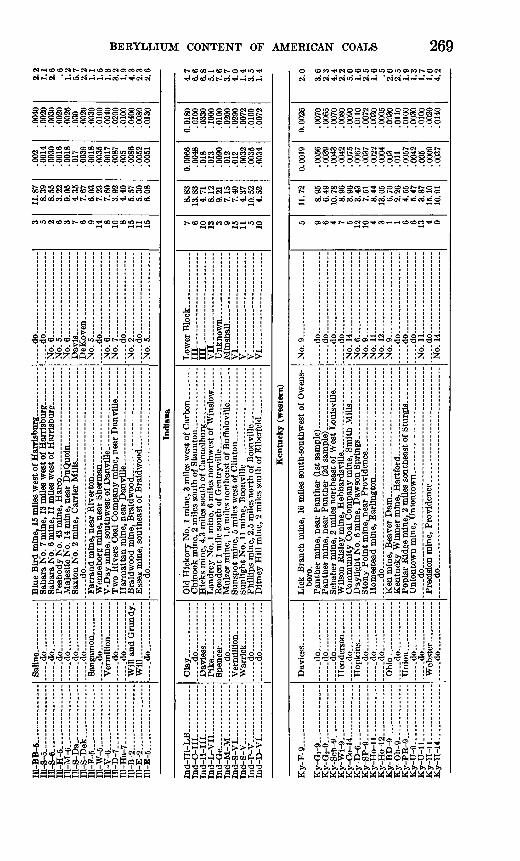
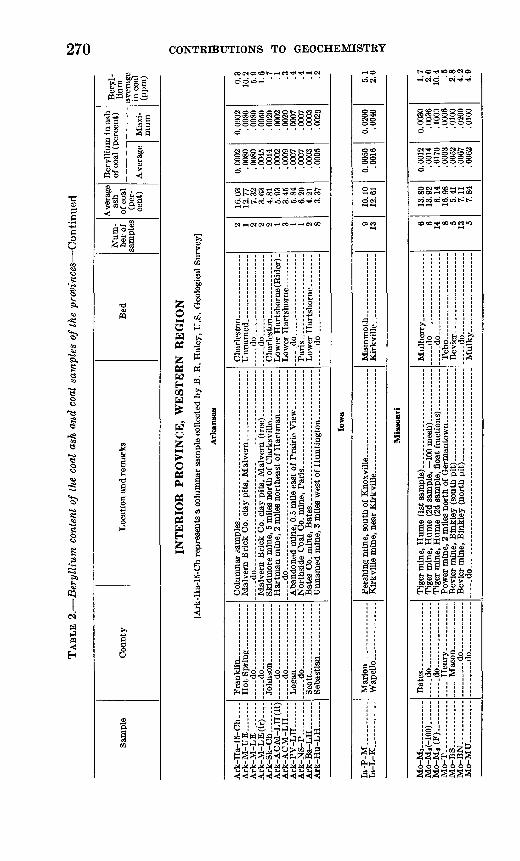
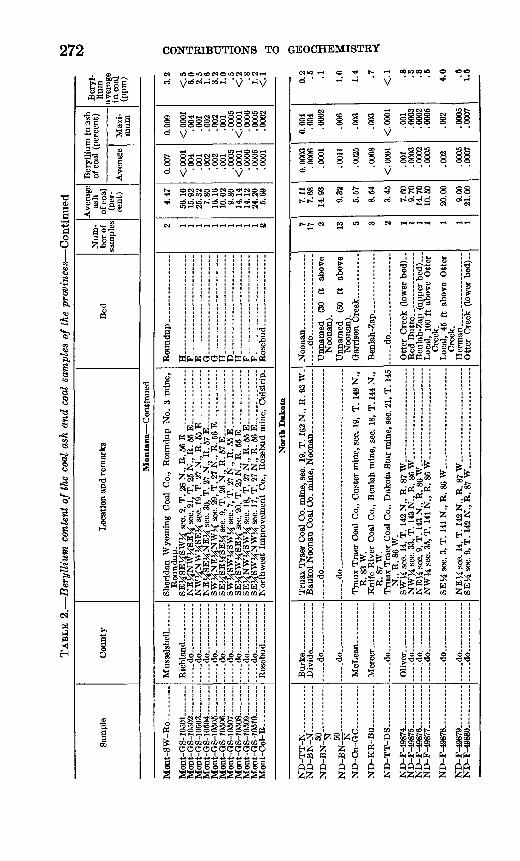
PRESENTATION OF DATA
The data (table 2) are arranged by provinces. States and counties are arranged alphabetically in each province. In addition the bed, mine, and location are used to identify the samples.

264 CONTRIBUTIONS TO GEOCHEMISTRY
The data are averages of the analyzed blocks of coal from each columnar sample of the bed. In the northern Great Plains and the Rocky Mountain provinces a large number of channel and auger samples were analyzed; and, since these are representative of the whole bed the one analysis is an average of the bed. The data shown are given for average ash, average beryllium in ash, maximum beryllium in ash, and average content of beryllium in coal (in parts per million).
In the northern Great Plains province and the Eastern Interior region, whenever more than 75 percent of a bed has been analyzed, the averages are weighted according to the sizes of the blocks. All others, including those from the other provinces, are arithmetic averages.
Additional information and more complete data will be available in the province reports.
TAB
LE 2
. B
eryl
lium
con
tent
of
the
coal
ash
and
coa
l sa
mpl
es o
f th
e pr
ovin
ces
Sam
ple
Cou
nty
Loc
atio
n an
d re
mar
ksB
edN
um
ber
of
sam
ples
Ave
rage
as
h of
coa
l (p
er
cent
)
Ber
ylli
um i
n as
h of
coa
l (p
erce
nt)
Ave
rage
Max
i
mum
Ber
yl
lium
av
erag
e in
coa
l (p
pm)
EA
STE
RN
PR
OV
INC
E,
AP
PA
LA
CH
IAN
RE
GIO
NN
OR
TH
ER
N P
AR
T
Mar
ylan
d
Md
-Up
-LK
. .
.... _
614
.55
0. 0
018
0.00
402.
4
Ohi
o
0-M
al-
LK
............
O-M
al-L
K(P
).........
O-M
al-M
K _
_ ..
....
0-L
-MK
....
....
....
..
0-S
B-M
K. .
....
....
..O
-W-M
K..
....
....
...
0-P
-LK
.. ...
....
....
.O
-SH
-LK
... _
__
__
.O
-SH
-LK
-(F
) ___
.___
.O
-SH
-LK
-(t)
. ...
....
.O
-SH
-MK
... _
_ ..
...
0-M
-LK
....
....
....
..
O-M
ag-L
K..........
..O
-Me-
LK
.. __ .
....
.
0-S
C13
i-L
K__
....
....
O-S
ClS
a-L
K.. ......
..
0-S
C1
4-L
K..
....
....
.O
-SC
14-M
K.. ......
..O
-SC
14-M
K(f
) .. ..
...
0-S
C20
-LK
... ..
....
..O
-T-L
K.. ...
....
....
.
....
.do..
....
....
...
....
.do
....
....
....
.
rin
. _ .d
o.... ..
.......
-do.... .
....
.S
tark
...... _
_ ..
.
-- d
o-..
...
.....d
o... ..
....
.
....
.do..... _
....
... .
.do....... .
....
.
. .d
o..
....
....
...
....
.do
....
....
....
. -d
o..
.. _
___ .
d
o
..
frac
tions
.
J. a
nd R
. C
oal
Com
pany
min
e, a
t G
uilf
ord
Lak
e ne
arL
isbo
n.
burg
.
Can
ton.
in 1
948)
.
in 1
951)
.
....
.do..
....
....
.
. ..
Mid
dle
Kit
tann
ing.
.......
d
o..
. . .
. __
do ... _
_ ..
. ....... .
..... d
o.... ..
....
....
....
...
... .
.do ..... .
.... ..
..
do.
__
_ . _
..
.......d
o ..
...........
Mid
dle
Kit
tan
nin
g..
.. ..
..
....
.do
. _
_ ..
....
....
...
....
.do.... ..
...............
.... .d
o .. .
....
. ..
. -
....
.do . ..
.
..... d
o
. -_
-M
iddl
e K
itta
nnin
g. ..
.....
d
o... _
....
.. _
. _ .
do ._
_
8 7 6 8 5 4 8 6 2 6 15 12 7 7 3 6 4 8 2 6 7
9.85
2.60
7.62
11.0
7
3.02
14.1
912
.62
11.7
34.
0111
.82
19.2
011
.46
11.4
315
.52
6.55
7.14
6.06
8.39
15.8
511
.70
8.50
0. 0
016
.006
4
.002
3.0
016
.014
.004
2.0
025
.003
4.0
095
.004
3.0
02.0
021
.002
7.0
04
.003
9
.002
2
.004
1.0
02.0
003
.003
2.0
024
0.00
40.0
100
.005
0.0
030
.040
0.0
100
.005
0.0
060
.010
0.0
200
.009
0.0
100
.004
0.0
050
.010
0
.005
0
.007
0.0
060
.000
4.0
060
.004
0
1.6
1.7
1.8
1.6
4.2
4.0
2.4
3.3
3.8
5.1
2.6
2.4
2.6
4.1
2.5
1.6
2.4
1.5 .5 3.2
1.8

TAB
LE 2
. B
eryl
lium
con
tent
of
the
coal
ash
and
coa
l sa
mpl
es o
f th
e p
rovi
nce
s C
onti
nued
Sam
ple
Cou
nty
Loc
atio
n an
d re
mar
ksB
edN
um
ber
of
sam
ples
Ave
rage
as
h of
coa
l (p
er
cent
)
Ber
ylli
um i
n as
h of
coa
l (p
erce
nt)
Ave
rage
Max
i
mum
Ber
yl
lium
av
erag
e in
coa
l (p
pm)
Pen
nsyl
vani
a
Pa
Pi-
LK
_._.
........
.P
a-W
a-L
K .
........
Pa-
Ash
-PS
U.. ........
Wat
erm
an N
o. 2
min
e, H
omer
Cit
y _
__
__
__
__
__
Pen
nsyl
vani
a an
thra
cite
coa
l ash
. Sa
mpl
es re
ceiv
ed fr
om
Pen
nsyl
vani
a S
tate
Uni
vers
ity.
__ d
o
3 6 4
11.8
3 6.
510.
0030
.0
028
.000
8
0.00
40
.010
0 .0
010
3.7
1.8
SO
UT
HE
RN
PA
RT
[Ky-
Pu,
Ky-
SX
, K
y-E
.T, a
nd K
y-IH
rep
rese
nt c
olum
nar
sam
ples
col
lect
ed b
y J.
W.
Hud
dle,
U.S
. G
eolo
gica
l Sur
vey]
A
laba
ma
Ala
-BD
-W .
..... .
..A
la-E
-BO
..... .
...... .
Ala
-FtP
..... ..
.. ..
.A
la-D
a-P
... .
.........
Ala
-Z-M
i- .
...
...
Ala
-Z-M
j.. _
...
A
la-Z
-Ms
. ... ..
....
.A
la-M
i-B
(R)
Ala
-Mi-
B.. ...........
Ala
-Mi-
M..
....
.......
Ala
-TH
-B.._
... .
......
Ala
-TH
-M... .
........
Ala
-T-M
.... ..
..... .
..A
la-T
-B__ ..
_. _
Ala
-De-
BC
-.. _
_ ..
.A
la-H
-BO
..... ........
Ala
-Oa-
BC
....
....
....
Ala
-Ma-
J. ...
....
....
.
Ala
-Oa-
ML
.... ..
....
.
Ala
-G-A
,.. .
..........
Ala
-Q-N
P ..
....
.A
la-Q
-P.. .
_..._
.
Bib
b..............
DeK
alb
.. _
.....
. .d
o......
St. O
lair
....
. __ .
- d
o. .
-.-.
.do-.
....
- .
... .
.do
....... .
....
.. .do. ...
do.
... .
.do
... .
....
.. ..
..d
o .
... .
.do....... .
....
.W
alke
r....
__
__
. .d
o
....
.d
o... ..
..do .
..... d
o.
.
..
. ..d
o..
. ...
....
. .
d
o
.....d
o .
....
....
do
Blo
cton
No.
9 m
ine,
Wes
t B
loct
on. _
__________
Mit
chel
l B
roth
ers
Con
stru
ctio
n C
o. m
ine,
nea
r B
rook
- w
ood.
..
do . -
do... _._ -. . ..
....
....
..
1 .d
o ..
..
.d
o............. .. . ..
........... .
....
Haw
k's
No.
4 m
ine,
Car
bon
Hil
l (1
st s
ampl
e) ..
....
....
.
Gal
low
ay C
oal
Min
ing
Co.
, In
c.,
No.
29,
min
e, C
arbo
n H
ill.
..... d
o... . ... ..
....
. ...
...
Pra
tt..
....
..
..... .
.. .
..d
o ..
. ..... .
-...d
o..... .
....
....
Mil
ldal
e-.-
. _
....
Mil
ldal
e- . . .
....
.
..-.
.do . ..
.. ..
...... -
Bla
ck C
reek
(Je
ffer
son)
....
-do
Jeff
erso
n (B
lack
Cre
ek).
..
..
do.. .
....
... .
....
Nic
kel P
late
.. ..
.. ..
..P
ratt
.... _
__
_ ..
....
...
2 2 2 3 2 4 2 1 4 2 3 4 3 3 6 4 7 4 2 2 4 1 1
4.89
5.
69
4.38
3.
58
4.42
4.
31
5.62
9.
06
7.93
3.
55
6.37
3.
64
4.47
3.
89
1.71
3.
15
3.96
7.
48
3.67
15
.05
5.78
6.
02
3.58
0.00
17
.005
5 .0
070
.003
0 .0
017
.001
1 .0
027
.003
7
.005
8 .0
100
.003
0 .0
123
.004
6 .0
070
.015
0 .0
040
.007
7 .0
045
.002
0 .0
012
.002
9 .0
030
.004
0
0.00
30
.007
0 .0
070
.005
0 .0
030
.003
0 .0
050
.003
7
.011
0 .0
170
.005
0 .0
290
.010
0 .0
160
.030
0 .0
080
.020
0 .0
070
.002
0 .0
020
.004
0 .0
030
.004
0
1.1
3.0
3.1
1.2 .8
.5
1.4
3.4
4.6
3.6
1.9
4.4
2.0
1.9
2.6
1.1
3.0
3.4 .7
1.
8
1.8
1.8
1.4

Geo
rgia
Qa
W-4
_ ..
. .....
Qa-B
-5-
...
. .
Qa-
Bl.
. ...
....
....
....
Ky-P
u........ ..
......
Ky-S
L... ..
....
....
Ky
GV
i ...
....
..K
y-B
&S
... ..
....
..K
y-H
op
. ..... ..
.K
y-W
.. .
... .
.......
Ky-I
H... ..
.
Ky-E
J-. . -
Ky-W
h...... ...
....
...
Ky-S
X. . .
....
...
Ky-O
oli
. ..
. -
.
Ky-H
ar.
.
Ky-D
ia_____.
Ky-L
e-.
...
....
..K
y-W
o
Ten
n-V
- ________
Ten
n-D
. ...
....
....
...
Ten
n-E
_ _
_______
Ten
n-R
e. .............
Va-3
...................
Va-3
40
... ..
....
....
.
Wal
ker
.. ..
... .
....
... .
.do
.
....
.do..
....
.. ..
...
Bell
Flo
yd. ..
. ......
- do
....
.do..
....
....
...
..
do
....
. ..
...
. .d
o-.
.. .
....
.
do
....
. .
...
....
.do..
....
. ...
...
do
.. d
o.. ..
....
.
..
do .
... -
do
....
. ... ---
... .
. do
. ..
. ...
Whi
tley
.d
o..
... .
....
. - d
o
. -do
..
..
.. d
o ... .
..
.....d
o...... ..
....
.
pris
on.
Ken
tuck
y (e
aste
rn)
Wils
on C
reek
Co.
min
e, M
anto
n __
. _ _
. _
__
_
Ten
ness
ee
vill
e.
Vir
gini
a
No
.4..
-..
...,
. ..
..N
o. 5
................
Unk
now
n ..
....
....
....
...
Hig
nit
e-.
..
-- _
Tip
Top.-
..
....
....
...
Elk
horn
No.
2 ..
. . .
do..-.
. ..
. . ..
. ...
Elk
horn
No.
3. ... .
Har
lan
(B).
. ... ......
Elk
horn
No.
2- _
_____
Elk
horn
No.
3(?
) ..
.. ..
.E
lkho
rn N
o. 3
_. _
_ - .....
-do..... .
.. ..
. ... ..
. ... .
Haz
ard
No.
7(?
) ....
Haz
ard
No.
9(?
)...
__
JeU
ico..
... _
_
Jell
ico.
..
.
2 1 3 1 6 10 2 7 2 4 1 2 5 2 1 5 8 4 8 15 3 1 6 6 5 4 4 3 1 4 1
1.47
3.12
3.73
4.02
4.31
3.83
9.32
4.54
5.72
2.85
3.72
3.70
9.03
4.34
13.9
06.
462.
541.
914.
638.
883.
181.
36
2.39
8.91
6.28
3.52
3.13
10.2
27.
58
10.2
86.
60
0. 0
035
.007
0
.004
7
0.00
02.0
010
.003
400
33.0
1.0
07.1
1.0
100
.002
5.0
053
.004
3.0
020
.081
.003
7.0
13.0
010
.001
6.0
031
.005
0
0.00
05.0
046
.002
6.0
011
.004
3.0
042
.003
3
0.00
18.0
007
0.00
50.0
070
0060
0.00
02
.020
0.0
036
.020
000
7oA
nn.0
100
.004
0.0
110
.008
0.0
020
.180
0.0
100
.030
0.0
040
.010
0.0
036
0050
0. 0
010
.020
0.0
110
.003
0
.006
0.0
090
.003
3
0.00
40.0
007
OQ
29
1.7
0.1
i ft
31
2.3
4.0
31 3.7 .9 4.8
1.9
2.8
1Q
.9 2.4 .5 1.3
1.1 .7 0.1
11 1.6 .6 1.6
2.3
2.5
1.9 .5
TAB
LE 2.
Ber
ylli
um c
onte
nt o
f th
e co
al a
sh a
nd c
oal
sam
ples
of
the
pro
vin
ces
Con
tinu
ed
Sam
ple
Cou
nty
Loc
atio
n an
d re
mar
ksB
edN
um
ber
of
sam
ples
Ave
rage
as
h of
coa
l (p
er
cent
)
Ber
ylliu
m in
ash
of
coa
l (p
erce
nt)
Ave
rage
Max
i
mum
Ber
yl
lium
av
erag
e in
coa
l (p
pm)
Wes
t V
irgi
nia
WV
a-2
10.-
WV
a-3
70.
WV
a-3
00
.-.
~
WV
a-1
60.-
. ~
WV
a-2
00 -
WV
a-1
80
.-.
-
WV
a-2
20.-
- . ..
..
. do
.___
.d
o-...
...-
-do
..-
d
o..
..
Sew
ell..
. _________
Poca
hont
as N
o. 3
.. _
__
_
Sew
elL
.... _
7 1 2 2 5 1 2 2 3
2.53
3.
27
1.72
4.
55
4.99
3.
00
17.1
0 4.
90
1.27
0.00
31
.002
0 .0
065
.001
3 .0
072
.008
0 .0
007
.003
0 .0
017
0. 0
050
.002
0 .0
100
.002
0 .0
200
.008
0 .0
010
.005
0 .0
020
0.8 .7
1.1 .6
3.6
2.4
1.2
1.5 .2
INT
ER
IOR
PR
OV
INC
E,
EA
STE
RN
RE
GIO
N[I
ll-S-
Da
and
Ill-
S-D
ek r
epre
sent
col
umna
r sa
mpl
es c
olle
cted
by
J. A
. Si
mon
and
M.
E.
Hop
kins
, Il
linoi
s G
eolo
gica
l Sur
vey.
subm
itted
for
ana
lysi
s by
the
Bla
ck S
tar
Coa
l C
orp.
]Il
linoi
s
Ky-B
D-9
an
d K
y-O
h-9
are
cha
nnel
sam
ples
Ill-
Pa-6
...
Ill-
Pw
-6
Ill-
OB
-6- .
Ill
-P
-1..
.
..... -
Ill-
Tr-
5-.
-
Ill-
E-5
-.. .
Ill-
F-6
Ill-
PH
-LW
. ...... .
....
I11-B
&W
-5-
...
111-0-5-
.
Il
l-A
-1. . _
Ill-
A-6
-...
Ill-
P-M
u..-
_
Ill-
TrB
-5. .
Ill-
TrB
-6.
m-T
-1........ ..
... .
Ill-
Ma-5
.
ni-
Ma-
6..
_ - _
Ill-
C-6
..... ..
....
Ill-
TrP
-6 .
....
. do.
-do
-d
o.
..d
o
....
....
d
o..
..
..... d
o..
....
..
d
o..
...
do.............
Per
ry...
Rap
atee
.
-do.. . - . . _ ..
........ ..
...
... .
.do..
...
.
....
....
....
....
....
....
. ..
. ...
.
Pyra
mid
inin
e. P
inkn
eyvi
lle .
No.
6..
..
.d
o.. ..
....
....
....
. d
o..
_ ..
. _ ..
No.
1 .
.... ..
. ..
..N
o. 5
d
o...... ..
....
No.
6 . _
Low
er W
illis
. _ .
No.
5 .. ..
...
....
.do..
..
. N
o. 1
... ..
....
....
....
....
.N
o. 6
.
No.
5 . _
No.
6..
...
. . . ...
No.
I..
....
. ...
_..
No.
5....
No.
6..
..
. .
do....... .....
. .d
o..
...
____ ..
.
8 10 6 12 12 9 13 7 4 6 7 17 6 6 8 11 1 3 11 2
9.57
4.73
3.47
5.96
7.57
9.16
4.35
3.96
13.6
94.
175.
997.
274.
0710
.27
5.06
6.88
6.10
16.5
15.
8319
.92
0.00
18.0
034
.004
9.0
072
.002
8.0
033
.004
3.0
068
.001
3.0
029
.002
1.0
043
.003
9.0
023
.004
1.0
033
.002
0.0
004
.004
0.0
020
0.00
30.0
100
.005
0.0
300
.008
0.0
090
.010
0.0
110
.002
0.0
060
.004
0.0
080
.006
0.0
040
.005
0.0
050
.002
0.0
007
.009
0.0
020
1. 1. 1. 3. 1. 2. 1. 2. 1. 1. 2. 1. 2. 1. 1. 1. 1. 4.
Hl-
BB
-5- _
_ ..
. _ -
IU-8
-5 - ...
Til
Q
A
Hl-
H-5
.. - _
Ill-
M-6
..
Ill
S-D
a. .
.. ..
. ...
.H
l-S
-Dek
...... _
.....
Hl-
F-5
. - ... .
.. ..
. ...
m-w
-5
ni-v
-6 ~
.» _
....
Ill-
D-7
.. - _
_ .
Ill-
Ha-7
. ~
mT
t 9
Ill-
E-2
....... .
....
....
.
.... .d
o..
....
... .
...
d
o.....
. .
do
....
....
-
... .
.do
...... ..
. d
o..
-
do. .
.... .d
o........ ..
. ..
... .
.do
....
....
... -
Will
and
Gru
ndy.
Will...
.... .d
o....... .
.. ..
.
Saha
ra N
o. 7
min
e, 1
3 m
iles
wes
t of
Har
risb
urg _____
d
o....
.d
o ..
d
o..
....
.. _
_ . _
....
. .d
o. ..
...............
No.
6..
..
....
.. ..
..
No.
5....-
__
..... .
... .
No.
6 ..... ..
.. ..
...
No.
5...... _
........
. .d
o........ ..
... .
....
. ..
No.
6 .
No.
7..... _
... ..
. ..d
o...... _
....
... _
..N
o. 2
... _
d
o.....
No.
5
3 5 2 6 3 7 6 9 14 8 10 8 15 11 15
11.8
78.
398.
553.
229.
054.
357.
676.
037.
237.
603.
924.
405.
575.
306.
08
.002
.001
4.0
030
.001
6.0
018
.017
.003
9.0
018
.003
5.0
017
.008
7.0
05.0
086
. 005
2.0
051
.004
0.0
020
.003
0.0
020
.002
5.0
30.0
020
0030
.010
0
.020
0.0
100
(\A
f\f\
.008
0.0
130
Q
Q
1.1
9
R .61
9
5.7
2O
1.1
1.5
1 Q
3.2
1.9
4Q
2.3
9
ft
Indi
ana
Ind-H
i L
B_..
. __
__
.In
d-C
-III
- - . ..
..In
d-H
-III
... ..
. ...
.In
d-L
-VII
... .
..... _
.In
d-O
e ..
..
Ind-S
-VI.
.. ..
. ..
.. .
Ind
-S-V
. .. .
Ind
-P-V
... .
... -
Ind
-D-V
I. .
.... ..
. .
Cla
y..
...
.. ..
. .
Pik
e..
..d
o.... ..
.
.d
o..
....
... .
...
Phi
llip
s m
ine,
2.5
mil
es n
ort
h o
f B
oo
nv
ille
..- .
..........
IIL
- _
_ . _
. _ ..
..Ill ..
.V
II.
VI..
V..... _
_ . ..
....
....
.V
.... ..
. ...... _
.........
VI.... .-.
7 6 10 13 15 5 10
Q
13.8
34.
718.
129
91
7.15
7.40
4.37
10.5
24.
52
Onn
fiAf\
(\A
Q
.013 00
90
.003
2.0
035
Afl
QA
0.01
80.0
100
.033
0.1
000
.010
0.0
200
.029
0nn
79.0
100
OO
79
4 6. 6. 5. 7. 3. 1. 3.
Ken
tuck
y (w
este
rn)
Ky-F
-9..
..
..
..
Ky
-Gi-
9 ..... ..
. .K
y-G
r-9
--
--- -
Ky-S
ch-9
... .
.. ..
. -K
y-W
i-9
....
... .
Ky-C
o-1
4.......... ..
..K
y-D
-6..
.............
Ky
-SP
-9.
-
Ky
-Ho
-11
. ..
..K
y-H
o-1
2.
Ky-B
D-9
....
..
...
Ky-O
h-9
. _
...
Ky
-PR
-9..
....
. ...
....
Ky
-U-9
.. ... .
Ky-U
-11... -
... .
Ky-H
-11...... ..... ..
.K
y-H
-14
-. ...
....
....
.
..
do... .. ..
-do.... ..
... .
.. .
-do.
... -
do
....
. -
-d
o..
....
... .
...
-d
o..
...
... -
Ohio
d
o..
. ..
.. ..
.
-d
o..
..
...
. .do..
. .
do
.....
boro
.
Scha
ber
min
e, 2
mile
s no
rthe
ast o
f W
est
Lou
isvi
lle .
...
Day
ligh
t N
o. 6
min
e, D
awso
n S
prin
gs. _
__
__
__
__
__
do _____ _
__
_ ..
. _
__
. _ . - .. .
Ken
min
e, B
eave
r D
am _
__ - _ .-
. _ _
. __ ..
. K
entu
cky
Win
ner
min
e, H
artf
ord-
- ...
....
...
.d
o... .. . ..
....
.Pr
ecis
ion
min
e, P
rovid
ence
..... . ..
........
No.
9..... _
.... ..
... .
... .
..d
o... ..
. ...
... .
.. ..
. ..d
o..... ........
- d
o..
.
....
... .
.. -do. ..
....
. ...
...
No.
14..
....
..
.........
No.
6 . .
No.
9. ..
. ... ..
. ... ..
.N
o. 1
1..... ..
.....
No.
12._
_._
..
No.
9.... ... .
.. ..... ..
..
..d
o-.. ... .
.. ..
... d
o... .. ..
....
....
.. -do..... .
.... ..
. ..... ..
.N
o. 1
1.... ..
...... _
. .d
o........ ..
... .
No.
14
..... _
. _ ..
....
5 6 4 7 5 12 10 3 1 1 6 6 13 4
11.7
2
0
QK
64.
Q
10.7
8o
Q
ft
3Q
fi
3.43
7C
1
Q
AA
13.0
56.
70
2.26
4 55
5.47
3.87
15.1
010
.91
.005
600
39.0
043
Oft
J.9
.007
5.0
067
Afl
Q7
.002
2<v
m4
.003
.0
11.0
057
*VM
O
.005 fw
iQ00
37
.007
0.0
065
.007
0on
onon
on.0
110
Aft
79
0030
.000
5.0
030
.011
0.0
100
0030
.010
0.0
020
0140
2 A
3.6
20
4.4
29
5.0
1.6
2.5
1.6 .5 2.0
2.5
1 9
i Q
1.7
1.0
4O
TAB
LE 2
. B
eryl
lium
con
tent
of
the
coal
ash
and
coa
l sa
mpl
es o
f th
e pro
vince
s C
onti
nued
Sam
ple
Cou
nty
Loc
atio
n an
d re
mar
ksB
edN
um
ber
of
sam
ples
Ave
rage
as
h of
coa
l (p
er
cent
)
Ber
ylli
um i
n as
h of
coa
l (p
erce
nt)
Ave
rage
Max
i
mum
Ber
yl
lium
av
erag
e in
coa
l (p
pm)
INT
ER
IOR
P
RO
VIN
CE
, W
EST
ER
N
RE
GIO
N[A
rk-H
a-15
-Ch
repr
esen
ts a
col
umna
r sa
mpl
e co
llect
ed b
y B
. R
. H
aley
, U
.S.
Geo
logi
cal
Surv
ey]
Ark
ansa
s
Ark-
Ha-1
5-Ch
... .
Ark-M-UE _
Ark-M-LE _ -
Ark-M-LE (t
r).
Ark-Sk-Ch_
Ark-ACM-LH(R)
Ark-ACM-LH
Ark-PV-LH _
Ark-NS-P-_ ..
.
Ark-
Hu-L
H___
... -do . ..
.. ..
. ... ..
.....
.do
..
- do ..
. ... ..
. .... .
.do .
__ do
..... . ......
-do
.d
o...
-. . ..
....
....
.
- .
do.. ..
....
. ....
-...do ..
.
..do.....
-do... ..
... .
... ..
...
2 2 1 3 1 1 2 8
16.0
312
.77
7.32
4.81
5QQ
5.84
6.20
4.21
3.37
.008
0.0
080
.004
5.0
014
.000
9.0
007
.0007
.0003
.000
5
.008
0.0
080
.002
0
.002
0.0
007
.000
7.0
003
.002
0
0. 10 5.
to
-^ o
Iow
a
Ia-P
-M..
....
....
.la
-L-K
,. -
Mar
ion.
..............
Wap
ello
_
_._
__
Kir
kvil
le
9 1310
.10
12.6
10.
0050
.001
60.
0200
.004
05. 2.
Mis
sour
i
MO-
MI..
_ ..
....
Mo-
Ma(
-100
) ......
Mo-
M,
(F)_
_. _
_ .
Mo-T
__ _
_ .
Mo-
BS
... ..
.. _
_ .
Mo-B
N... _
__
_M
o-M
U ..
_ ..
Bat
es
d
o ..
....
. ...
do
__
Hen
ry... .
....
....
....... -
do
..
. .... .
..
....
do
...
....
...
Pow
er m
ine,
2 m
iles
nort
h of
Oer
man
tow
n ...
....
....
...
Tebo .
.. ..
. ...
... .
do
]\£u
lkv
6 6 14 8 5 13 5
13.8
013
.92
6.14
16.9
8K
J.
1
7.11
7.84
0. 0
012
.001
4.0
170
.000
3,0
052
.006
7.0
062
0. 0
030
.003
6.1
000
.000
6.0
100
.020
0.0
100
1. 2. 10. 2. 4. 4.

Okl
ahom
a
Ok
Du-M
c(F
).. __
_O
k-P
a-B
A.. ..
.O
k-P
a-F
o .
... .
.
Ok-
LS
-UH
... ..
....
.O
k-L
S-L
H ..
....
Ok
-Ca-S
t--.
..
. .
Ok-K
-UH
..
......
Ok-
Da-
UH
... ..
.......
Ok-L
C-S
e -
Ok-B
H-H
...... ..
.....
Ok-L
-JC
..
.O
k-L
S-M
c
Ok-
MN
-BA
... ..
....
. .O
k-R
C-B
A-.
... ..
.
,. __ d
o _____
TT
flQ
lrol
l d
o.
.
- d
o .
...
d
o ... .
.. ..
.
*pit
tcK
iirc
r
do
Pat
ch N
o. 2
min
e, 1
2 m
iles
nort
hwes
t of
jun
ctio
n of
Hig
hway
Nos
. 60
and
66.
... .
.do
. . ..
. .... ..
. ...
... .
For
syth
e ..
....
....
Sti
gle
r..-
..............
d
o .
.. ..
. ...
d
o
5 6 5 1 1 2 2 1 1 1 6 3 8 6
3.56
3.97
4.12
7.60
4.40
7.55
4.96
5.02
4.56
9.70
2.68
4 11
4.93
3.14
9
79
0 00
21nn
Q9
.008
6
0002
ftnn
i.0
021
.001
100
30.0
006
.003
0.0
068
.001
9.0
003
.011
0
0 00
6000
40.0
100
0002
.000
100
40.0
020
.000
6.0
030
nn^n
.010
0.0
200
OQ
1 ^
3.5
1.5
<.l 1.6 .5 1.5 .3 2Q
1 ft .1 2.1
0
A
Tex
as
8.93
0 00
070
0007
0.6
NO
RT
HE
RN
G
RE
AT
P
LA
INS
PR
OV
INC
EM
ont
-P-1
thr
ough
Mon
t-P
-3 r
epre
sent
sam
ples
col
lect
ed b
y W
. T
. Pe
cora
, U
.S.
Oeo
logi
cal
Surv
ey;
Mon
t-O
S-10
501
thro
ugh
Mon
t-Q
S-10
510
repr
esen
t sa
mpl
es c
olle
cted
by
O.
E.
Pri
char
d, U
.S.
Oeo
logi
cal
Surv
ey;
ND
-F-1
9874
thr
ough
ND
-F-4
9880
rep
rese
nt s
ampl
es c
olle
cted
by
W.
D.
John
son,
U.S
. O
eolo
gica
l Su
rvey
; W
yo-C
h-H
e-1
thro
ugh
Wyo
-Ch-
He-
6 re
pres
ent
sam
ples
col
lect
ed b
y W
. J.
Map
el,
Jr.,
U.S
. G
eolo
gica
l Su
rvey
]M
onta
na
Mo
nt-
S..
....
..........
Mon
t-B
...
....
....
....
Mo
nt-
FC
-3..
.. _
....
Mont-
G-F
- ..
.......
Mon
t-R
B-F
__
__
_ .
Mo
nt-
P-1
. ..
......
.M
ont-
P-2
-. ..
.........
Mon
t-P
-3_ ..
....
......
Mo
nt-
AT
....
....
_ ..
Mon
t-C
MT
...........
Mont-
Qi-
BM
... _
_ .
Mon
t-K
e-C
C. .
....
...
Mont-
K-R
o .
......
.M
ont-
K-R
o-K
B&
Tr-
Mon
t-N
-Ro ..........
.M
ont-
N-R
o-K
B
.... .d
o..
. ...
.... ..
.
.... .d
o... .
.. --
----
... .
.do. ..
. ..
do
... .
.........
..d
o ... ..
. .
.....d
o... .
... .
..
Mus
sels
hell-
-
... -
do... .
... .
.. ..
.. -d
o...-
. __
....
. d
o -
..
do .
.. ..
.. ..
.... .
.do
... .
... .
Eas
t B
elt
min
e, B
elt _
__
__
__
__
__
__
__
__
__
__
Cyr
il M
. T
uss
min
e, 1
2 m
iles
sout
heas
t of
Lew
isto
wn.
.G
ildro
y m
ine,
19
mile
s so
uth
of R
ound
up. _
_______
Kee
ne N
o. 2
min
e, K
eene
. ________________
. __
do _
__
__
__
____________________
__
do _
__
----
----
__
__
__
__
_ . _
__
_..-_
_.
..... d
o .. ....
-d
o ... .. _
_ -
Bed
No.
3 ..
.. ..
. ...
.
-..
.do
d
o
Bul
l M
ount
ain ..
....
....
..
d
o-..
. ... .
do... .
.................
6 15 6 3 4 3 1 1 1 16 15 4 7 11 7 2 2
15.1
918
.25
5.95
4.44
5.39
4.99
26.4
813
.80
29.0
010
.01
10.5
74.
37
5.69
6.39
4.39
7.01
2.50
0.00
29.0
015
.009
4.0
002
.003
3.0
022
.000
3.0
004
.000
5.0
058
.003
9.0
025
.001
9.0
02.0
11.0
13.0
12
0.00
4.0
04.0
16.0
003
.009
.003
.000
3.0
004
.000
5.0
2.0
05.0
04
.01
.008
.030
.02
.013
4. 2. 5. 1. 1. 1. 5. 4. 1. 1. 4. 9. 3.
TAB
LE 2
. B
eryl
lium
con
tent
of
the
coal
ash
and
coa
l sa
mpl
es o
f th
e p
rovi
nce
s C
onti
nued
Sam
ple
Cou
nty
Loc
atio
n an
d re
mar
ksB
edN
um
ber
of
sam
ples
Ave
rage
as
h of
coa
l (p
er
cent
)
Ber
ylli
um i
n as
h of
coa
l (p
erce
nt)
Ave
rage
Max
i
mum
Ber
yl
lium
av
erag
e in
coa
l (p
pm)
Mon
tana
Conti
nued
Mon
t-S
W-R
o-.-
- _._
.
Mon
t-G
S-1
0501
. ..
. .M
ont-
GS-
1050
2... _ ..
Mon
t-G
S-1
0503
_ ..
Mon
t-G
S-1
0504
_ . .
Mon
t-G
S-1
0505
- .. .
Mon
t-G
S-10
506.
.. .....
Mon
t-G
S-1
0507
.....
Mon
t-G
S-10
508-
__
Mon
t-G
S-1
0509
Mont-
GS
-10510 ..
.
Ric
hlan
d ...
....
...
. .
do
...
....
...
..... d
o..
... .
....
... ..d
o ..
. . .d
o .
. .
do.
...
... .
.do.
.... .d
o..
. .... .
- .
... .
.do.
... .
.. ..
.... .
.do.
Rou
ndup
. SE
MSE
MSW
M s
ec.
2, T
. 26
N.,
R.
56 E
_ ..
....
....
....
.N
EJi
NW
MS
EM
sec
. 21,
T.
25 N
., R
. 55
E... .
....
. .....
NW
J£N
WJ£
SEM
sec
. 19
, T
. 27
N.,
R.
55 E
-. ..
....
.N
EJ£
SE
J£N
EJ£
sec
. 30,
T.
27 N
., R
. 57
E...............
SW
MN
EM
NW
Ji s
ec. 2
9, T
. 27
N.,
R.
56 E
..,.
_ ..
....
SE
J^S
EM
SE
Ji s
ec. 9
, T.
26 N
., R
. 57
E. .
..........
SW
JiS
W^S
WJi
sec
. 7,
T.
27 N
., R
. 55
E...............
SE
^SW
JiS
EM
sec
. 20
, T
. 25
N.,
R.
55 E
........ ... .
SE
J^N
WM
SW
^ se
c. 1
8, T
. 27
N.,
R.
55 E
..
. .... .
.SE
MSW
J^N
WM
sec
. 17,
T.
27 N
., R
. 56
E._
.
H _
_ ..
... _
..... .
..F
_. .......................
E. .
....
....
....
....
....
...
G ..
. .... .
... .
_ ..
. ...
G
. .....................
H. .
....
....
.. _
....... .
..D
....
. ...
... _
__
. _ ..
..H
....... .
.................
F. .
.......................
F...... _
........... _
..
1 1 1 1 1 1 1 1 1 2
4 47
56.1
6
25.3
27
an16
.16
10.0
29.
8014
.14
14.1
224
.20
5.69
0.00
7
<.00
0100
400
1A
no
nn9
nni
.000
5<C
000
1
.000
500
01
0 00
9
<0001
.004 00
1.0
02.0
02.0
01.0
005
<0
00
1.0
006
nnn^
.000
2
<. 6. 2. 1. 3. 1. <- I <.
Nor
th D
akot
a
ND
-TT
-N.
ND
-BN
-N. . _
_
30N
D B
N N
50N
D-B
N N
ND
-Cu
-GC
. -
ND
-KR
-Bu
..
...
ND
-TT
-DS
.......
.
ND
-F-4
9874
... _
.....
ND
-F-1
9875
. ..........
ND
-F-4
9876 .
. _ ..
.N
D-F
-49877 .
. _ ..
.
ND
-F-4
9878
ND
-F-4
98
79
. _
....
ND
-F-4
98
80
. _
___
Divide
..
do
....
. .
.... .do..... .
do... -
Oli
ver.
.. ..........
.... .d
o.....
..
do
....
.
.do.. ..
.
... .
.do.. .
.d
o..
. ..
.. -d
o..
...
.. ..
.
..d
o ................. _ __
....
.do
....
... _
.
K.
83 W
.
R.
87 W
.
N.,
R.
86 W
. S
WH
sec
. 14
, T.
142
N.,
R.
87 W
. ... .. ..
....
....
..N
WJ4
sec
. 33,
T.
143
N.,
R.
86 W
. ...
....
....
....
....
...
NE
H s
ec. 9
, T.
143
N.,
R.
86 W
..
_
__
_ ..
....
...
NW
M s
ec. 3
5, T
. 14
1 N
., R
. 86
W. .
....
....
... _
_ ..
....
SEM
sec
. 3,
T.
141
N.,
R.
86 W
_..
_ .
....
....
....
....
..
NE
H s
ec.
14, T
. 14
2 N
., R
. 87
W ..
....
....
....
....
.SE
J4 s
ec. 9
, T.
142
N.,
R.
87 W
.... _
__
. __ ..
__ . _
.
.do..
..
....
....
..
Noo
nan)
.
Noo
nan)
.
....
.do
.. .
...... ..
....
..
Red
But
te .__.
Cre
ek.
Cre
ek.
7 17 2 13 5 3 1 1 1 1 1 1 1
7.11
7.68
14.9
3
9.32
5.57
8.54
3.45
7.60
9.70
14.7
010
.50
20.0
0
9.00
21.0
0
.000
6.0
001
.001
1
.002
5
.000
8
<C 0
001
.001
.000
3.0
002
.000
5
.002
.000
5.0
007
0.00
4.0
04.0
002
.006
.003
.003
<.0
001
.001
.000
3.0
002
.000
5
.002
.000
5.0
007
0.2 . l.(
1. <. 4. 1.

Wyo
min
g
Wyo-W
y-S
S W
yo
-Ch
-He-
1
£ W
yo-C
h-H
e-2.........
O 0 W
yo
-Ch
-He-
3 -
-
i W
yo
-Ch
-He-5
.
.
Wy
o-C
h-H
e-6
- .d
o..
.
..
do... ..
d
o .
d
o..
. _
_
do..
Wyo
dak
min
e, e
ast o
f G
illet
te,
T.
50,
R.
71 W
_
.... .d
o..... . .. . ..
....
....
....
.
d
o.
..d
o . ........ . ..
....
... .
....
...
... .
.do...... .... . ..
................
. .
do
....
....
. .
................ ....___._
..
Sm
ith..... .
............. .
.
leve
l) .
Unn
amed
(2
4 ft
be
low
Hea
ly).
U
nnam
ed
(160
ft
be
low
Hea
ly).
Hea
ly).
Hea
ly).
3 1 1 1 1 1 1 6
6.93
23.4
022
.90
17.4
0
14.4
0
9.50
25.7
0
4.89
ft ftf
tftl
.000
1.0
001
.000
5
.000
1
.000
1
.000
2
.000
2
Q 0Q
01ftf
tftl
ftftft
l
.000
5
.000
1
.000
1
.000
2
.000
7
0.
RO
CK
Y
MO
UN
TA
IN
PR
OV
INC
E
[Col
o-50
0 to
Col
o-65
0, g
rab
sam
ples
exc
ept
Col
o-57
0, a
cha
nnel
sam
ple,
and
Wyo
-620
and
Wyo
-630
, gr
ab s
ampl
es,
wer
e co
llect
ed b
y L
arry
War
ner,
U.S
. G
eolo
gica
l Sur
vey]
Col
orad
o
Col
o-60
0
Col
D-6
10 .
... _
__
Col
o-Su
n-A
...........
Col
o-S
un-B
. _____ .
Col
o-S
un-C
. ._
_
_C
olo-
Sun
-D- _
__
_ .
Col
o-52
0.. _
____
Col
Q-5
30 _
__
.- _
- ...
Col
o-54
0.-
Col
o-So
m-B
_ ..
...
Col
o-So
m-C
...
.....
Co
lo-H
N-D
. ..
.....
Colo
-Oli
-D.. .
......
Colo
-CB
-UM
V.......
Col
o-50
0. _
... .
....
Col
o-K
e-W
n. .......
.C
olo-
590 _
______ ..
.C
olo-
Vi-
Mv-
Ri _
_ -
Col
o-V
i-M
v.. _
. __
.C
olo
-Vi-
Mv
' .......
Col
o-55
0 __
__
......
..C
olo-
560.
..... ..
....
Colo
-570 .
....
....
...
-d
o..
....
.. ..
...
Garf
leld
-.
...
... .
.do
....
.
.... .do .
...... -
do
d
o..
.. _
..
..... -
do....
-do... .
.. ..
.
.... .d
o..... ..
d
o....
.d
o
. d
o..
...
d
o........
..
do
...
La
Pla
ta _
__
. ..
. . .d
o ..
. -
d
o ...... ..
.
d
o..
-do...
..
do... .
...
d
o...
.d
o..
...
..
.......
- -do .. ..
... .
... .
... .
....
. ...
....
. do.. ..
. ..
. ....
But
te.
.
do... _
___ . _
.do
Exp
osur
e 2
mile
s so
uth
of D
uran
go _
___________
A..
. ..
..
B.. ..
. ..
.....
C_ ..
.. ..
.. ..
.. ..
..D
..
.. ..
.. ..
. ..... ..
...
.d
o..
. ... ..
....
. .d
o
B- .
C.
..
.. ..
... .
.... ..
..D
. .
.... ..
... .
.... _
. .
do.
..
... .
... .
...
_.
do... .
....
....
..... .
...
Mes
aver
de).
..
do........ ..
.. ..
...
..... d
o....... .
... .
.. ..
.....
1 1 11 4 4 8 1 1 1 5 1 4 1 4 1 1 1 2 4 1 1 1 1
6.30
8.20
13.6
08.
315.
254.
123.
5112
.90
8.60
9.80
5.16
4.21
4.94
4.95
3.77
16.8
0
20.7
221
.20
14.0
09.
7225
. 24
3.90
4.50
36.8
0
<0.
0001
.000
6.0
002
.000
4.0
010
.000
6.0
015
.000
9.0
009
.000
4.0
006
.003
0.0
003
.062
0.0
015
.000
4
.002
0.0
004
.001
3.0
017
.000
2
.000
3.0
006
.000
1
<0.
000
1.0
006
.000
2.0
007
.003
0.0
010
.009
0.0
009
.000
9.0
004
.000
9.0
030
.000
3.0
620
.005
0.0
004
.002
0.0
004
.002
0.0
060
.000
2
.000
3.0
006
.000
1
0 <
0 1. 1. 31 4. 1. 1. <.

fcO
TAB
LE 2
. B
eryl
lium
con
tent
of
the
coal
ash
and
coa
l sa
mpl
es o
f th
e pro
vince
s C
onti
nued
Sam
ple
Cou
nty
Loc
atio
n an
d re
mar
ksB
edN
um
ber
of
sam
ples
Ave
rage
as
h of
coa
l (p
er
cent
)
Ber
ylli
um i
n as
h of
coa
l (p
erce
nt)
Ave
rage
Max
i
mum
Ber
yl
lium
av
erag
e in
coa
l (p
pm)
Col
orad
o C
onti
nued
Col
o-R
W-C
O'_
_. ..
....
Colo
-RW
-Co'
..
.C
olo-
WH
-WH
_ ..
...
Col
o-51
0-. .. ...
Colo
-Key
-Pi
.
Col
o-R
a-P
i _ -
....
Co
lo-6
50
.. _
_ ..
....
Trt
Plata
Mof
fat. _
.... .
..d
o
.....d
o ..
...
.do.
. .do
Ro
utt
....
Weld
..
. ...
do ..
. .....
Exp
osur
e on
Sta
te R
oute
327
, 4 m
iles
sout
h of
Red
ston
e.W
ise
Hil
l..... ..
. ...
....
do ..
d
o ..... .
.. ..
. .
1 2 1 2 3 8 1 1 3 9 1 1
16.5
0 13
.13
1.30
1.
96
4.31
5.
12
11.7
0 5.
20
5.48
4.
88
4.16
7.
80
5.63
0. 0
003
.000
9 .0
040
.000
3 .0
002
.000
4 .0
005
<.00
01
.001
2 .0
024
.002
0 .0
003
.000
8
0.00
03
.001
0 .0
040
.000
4 .0
003
.000
8 .0
005
<.00
01
.003
0 .0
080
.002
0 .0
003
.003
0
0.5
1.2 .5 '.2
.6 '.7
1.1 .8
.2
.4
New
Mex
ico
NM
-MaA
-WA
.
NM
-MaB
-WA
_
do ..
....
... .
Alb
uque
rque
and
Cer
rillo
s C
oal
Co.
min
e, M
adri
d (a
n
thra
cite
coa
l).
Alb
uque
rque
and
Cer
rillo
s C
oal
Co.
min
e. M
adri
d (b
i-
Whi
te A
sh- . ..
.
. .
do .
....
..... .
....
2 2
36.1
5
13.2
0
<0.
000
1
.000
2
<0.0
001
.000
2
<0.
4 .3
Uta
h
U-S
u-S
u--
. ..
. ...
U-S
u-S
u(-
100)
_ .
U-S
u-S
u(F
) ...........
U-K
e-K
e. ..
...........
Car
bon.
...
....
...
d
o. . .
..d
o ... .
.. ..
do....... .
....
.
Sunn
ysid
e N
o. 2
min
e, S
unny
side
.......................
Sunn
ysid
e N
o. 2
min
e, S
unny
side
( 1
00 m
esh).
.. ..
....
Low
er S
unny
side
-. ...
....
.d
o........... ..
.. ..
.
5 6 20 2
7.85
6.07
2.
356.
73
0.00
04
.002
4<.
0001
0.00
08
UU
U«7
.006
0<
.00
01
0. <^_

Wyo
min
g
Wyo
-UP
Ha» -
----
-
Wyo-6
30 .
__
Wyo
-El
El.
.. _
_ ..
...
Wyo
-St
1_ .
Wyo-S
t-7^ --
-W
yo-R
e-7-
__
"Wtr
ft
1? o
Q
Wyo
-Re-
ll.-
__
__
_
Wyo
-620
......
....
....
.
..
do
... ..
....
. d
o
.do
d
o
..... d
o
do..
.. _
. do
.... .d
o...... _
....
..d
o.... .
d
o .
d
o.... .
do .
.....d
o. _
. ___ .
..
do
... .
..... .
...
d
o
d
o
__ d
o... . - -
d
o
..do . . . _
d
o..
. ..
. ...
.. .do _
__ - _
- - _
Supe
rior
D.
O.
Cla
rkem
ine,
Sup
erio
r. ..
....
.
Fin
ch N
o. 1
... .
...........
Fin
ch N
o. 2
. ..............
Fin
ch N
o. 3
. ....... .
Fin
ch N
o. 4
....
....
....
...
Elk
ol.. ...................
Roc
k Sp
ring
s N
o. 7
VS --
---
Roc
k Sp
ring
s N
o. 7
.......
Roc
k Sp
ring
s N
o. 9
.. .....
5 3 5 2 3 2 13 1 4 1 1 7 3 2 1 2 1
2.58
5.30
4.80
4.97
1.35
7 fU
4.60
4.38
2.30
3.38
2.71
5.09
2.82
4.25
1.72
10.2
0
<^A
ft
fift
l
0003
.000
2.0
016
.00u
6.0
005
nnni
.000
3.0
001
0007
nnft^
.011
0.0
023
0300
.038
0.0
004
<0
. 00
01.0
010
.000
500
30.0
010
0008
fWll
.000
200
07nn
n^i
.020
0.0
060
.030
003
00.0
700
(V¥U
<0.
1 .1 <.l
<.l .1 <.l .2 .1 3.1
1.2
7.0
19
7
6.5 .4
to
-^ Cn

276 CONTRIBUTIONS TO GEOCHEMISTRY
GENERAL REMARKS ON THE DATA
A summary of the maximum and minimum averages of beryllium content in ash and in coal for beds given in table 2 is presented in table 3. In several instances, table 2 gives samples with a higher beryllium content than those given in table 3; such samples usually were selected or floated and, therefore, could not be considered as being representa tive of a bed. The maximum and minimum averages of the beryllium in ash are not necessarily the same as those for parts per million in coal.
In the northern part of the Appalachian region the Lower Kittan- ning and the Middle Kittanning were the only two beds sampled. The percentage of beryllium in ash seems to indicate dissimilarity between the beds, but this is explained by the different concentration
TABLE 3. Summary of maximum and minimum averages of the beryllium contentof beds given in table 2
Maximumberylliumin ash
Average
ash ofcoal
Minimumberyllium
in ash
Ashaverage of
coal
Percent
Beryllium incoal (ppm)
Maximum
Minimum
Number of
Bedaverages
Individualsamples
Eastern province, Appalachian region
Northern part:
Middle Kittanning bed...... ....Southern part:
TennesseeVirginia and West Virginia ......
0.0041.014
.015
.11
.0046
.0072
6.063.02
1.712.858.914.99
0. 0016.0016
.0011
.001
.0005
.0007
9 QK
11.07
4.314.312.396.60
4.14.2
4.631113.6
1.61.6
.5
.4
.1
.2
146
23197
11
1fU46
68872930
Interior province
Eastern region: Illinois (all samples) ______
Bed 5 . ,_Bed 6...... ...............
Western Kentucky (all samples). Bed 9 .....................
Western region: McAlester Basin. ...............
0.011.011
.017
.0093
.0057
.003
.011
5.723.206.285.25
10.18 5.87
5.022.72
0.0004.0011.0004.0032.0004 .0013
.0001
.0003
16.219.52
16.216.30
13.05 13.28
4.4016.98
6.33.24
129.5 4.3
2.95.1
0.71.7
1.5.5
1.7
<.l.5
3512121017 10
1812
25390748396 47
44110
Northern Great Plains province
0. 0094.013
5.957.01
0. 0015<.0001
18.253.45
5.89.1
2.7<.l
543
58131
Rocky Mountain province
Sweetwater County, Wyo . .. ... 0.038AR9
1.724 QK
0. 0003<. 0001
3.385.20
1331
0.1<.l
753
r17'

BERYLLIUM CONTENT OF AMERICAN COALS 277
effect of the low-ash content of coals. However, on a parts-per- million basis the beds are quite similar.
In the southern part of the Appalachian region, the greatest var iations in the beryllium content of the coal ash are found in eastern Kentucky. The sample with the highest content, 0.24 percent in 1.00 percent ash, is found in block 1-b of columnar sample Ky-IH. The bed with the highest average of beryllium, 0.11 percent in 2.85 percent ash (31 ppm in coal) is also found in the same columnar sample. Columnar sample Ky-SX, has the next highest beryllium content in coal (19 ppm).
In Alabama only 68 of about 200 block samples of coal were ana lyzed. In this group, as well as in samples from Georgia, no unusual concentrations of beryllium are found. In table 2 the averages of the columnar samples from Alabama range from less than 1 to 4.6 ppm beryllium in coal. These averages show some similarity to the averages of coal from the northern part of the Appalachian region.
In the Interior province, the eastern region shows two persistent trends. On the basis of the percentage of beryllium in ash as well as parts per million in coal, the Indiana coal beds contain noticeably more beryllium than those of western Kentucky and Illinois; and the coal samples collected from the perimeter of the basin contain more beryllium than do the samples of the central part.
Coals from the Western region of this province also show a differ entiated distribution pattern. Coal beds of northern Oklahoma, Missouri, and Iowa contain 1.3 to 5 ppm beryllium and have more beryllium than the coal beds of the McAlester basin in Oklahoma and Arkansas. The latter beds range from less than 0.1 to 2.9 ppm in beryllium content, but only four of the bed samples average more than 1 ppm. However, two Eocene lignite beds from Arkansas aver aged 10.2 and 5.9 ppm beryllium in coal, and a group of float fractions of sample Mo-M, averaged 10 ppm.
In the northern Great Plains province the Jurassic coal beds of the Lewistown and Great Falls fields have the highest content of beryllium, 2.7 to 5.8 ppm; the sample of Cretaceous coal of the Milk River field is also in this range. With a few exceptions, averages of beds of Paleocene coal are less than 2 ppm. All the samples of this province from Wyoming have less than 1 ppm beryllium.
Most of the coal samples of the Eocky Mountain province have a low beryllium content. Only one group of samples from Sweetwater County, Wyo., has any beryllium enrichment. The maximum amount of beryllium (31 ppm) given in table 3 was found in a block of bone coal from the top of the bed and should not be considered as significant.

278 CONTRIBUTIONS TO GEOCHEMISTRY
DISTRIBUTION OF BERYLLIUM IN COAL
SOME PETROGRAPHIC CONSTITUENTS
During the examination of blocks of coal, selections of samples of vitrain, fusain, and other petrographic constituents of coal were made, and some of these were analyzed for beryllium. The data are presented in table 4.
The data show that the ash of vitrain is enriched in beryllium com pared with the ash of the whole coal. The data also show that on a parts-per-million basis the vitrain contains more beryllium than does the whole coal. Because the major petrographic component in banded coal beds is vitrain, it follows that the bulk of the beryllium that is found in coal of this type is associated with vitrain.
TABLE 4. Beryllium and ash content of vitrain and fusain samples
Code
O-Mal-Mk-4 .. .O-368 I... ... _Va-310 ... .... ...WVa-215-- . -m-p-i-9 .--Mont-Ki-6.. ......
Ash (percent)
Whole coal
6.56 10.803.42
5.26
Vitrain
3.50
3.00 .90
22.02 3.98
Fusain
13.04 19.60 5.80 9.60
7.08
Be in ash (percent)
Whole coal
0.001 .002 .002
.005
Vitrain
0.01
.01
.004 2.03
.003
Fusain
0. 0004 .0005 .0006
<. 0001
.0001
Be in coal (ppm)
Whole coal
0.66 2.2 .7
2.6
Vitrain
3.5
3.0 .4
6.1 1.2
Fusain
0.52 1.0 .4
<-l
<.07
1 Fusain sample containing some durain.2 Sample rich in vitrain.
Vitrain and fusain are probably derived from similar plant com ponents; however, they have undergone different chemical changes to create these constituents that are now found in coal. A com prehensive report on this subject is given by Francis (1954). In addition to the lower beryllium content of fusain, the contents of the elements oxygen, nitrogen, and hydrogen are also lower and have pre sumably been lost during the metamorphism of the plant components to fusain. This relationship suggests two possible causes for the lower beryllium content of the fusain samples. Most or all the beryllium now found in the coal may be there as a result of plant accumulation. In the formation of beryllium-organic complexes, beryllium is known to have a tendency to combine with oxygen as the donor element (Martell and Calvin, 1952, p. 169). The loss of beryllium in fusains parallels a similar loss of oxygen, and nitrogen, and could reflect the breakdown of beryllium-organic complexes and other compounds containing nitrogen and oxygen during fusinization. Another possi bility is that some of the beryllium found in coal is due to accumula tion by plants, but that some, or perhaps even a large part of it, origi nated in the coal beds as a result of fixation by either adsorption on the colloidal organic particles in the swamp or by the formation of beryl-
BERYLLIUM CONTENT OF AMERICAN COALS 279
lium-organic complexes with the decomposition products of the plant tissues.
The beryllium complexes are very stable; so they probably have a much greater role than does adsorption by colloidal particles. There fore, it is reasonable to propose that during vitrinization, an addition of beryllium is retained, whereas, if fusinization takes place, very little chance is given for the accumulation of beryllium by adsorption or by formation of organic beryllium complexes. In the vitrinization proc ess numerous organic compounds are released with which beryllium could form complexes, whereas in the more drastic fusinization process, it is possible that these compounds are destroyed.
It has been shown by Hoagland (1952) that beryllium can be very toxic to plants particularly at low pH values. The fact that some coal contains much beryllium raises the question as to why the beryllium did not prove toxic to the plants growing where these amounts of beryllium accumulated, provided, of course, that the accumulation of beryllium was syngenetic with swamp development. As beryllium complexes are very stable, it would be possible to have large amounts of the element enter the swamp and not prove toxic to the plants grow ing there because of the formation of these beryllium complexes. Under this last proposal larger amounts of beryllium would be ex pected to be found near the perimeter of basins rather than in the interior parts (p. 286).
FLOAT-SINE FRACTIONS
Of the many samples that were floated, two are used to illustrate the distribution of beryllium in ash of various float and sink fractions of coal. The results for these two samples, Ky-U-9-1 and Ky-PR-9- 2, are shown in figure 42. The coals were ground to pass through a 100-mesh sieve. Forty grams of the coal was evenly distributed into four 100-ml centrifuge tubes, and a carbon tetrachloride-alcohol mixture with a specific gravity of 1.28 was added. The samples were centrifuged at 800 rpm for 20 minutes. The float cake and liquid were decanted into a Buchner funnel. The sink fraction was then floated at a specific gravity of 1.32. The procedure was repeated at specific gravities of 1.36 and approximately 1.6.
Two significant features are evident from the graph (fig. 42), the abrupt increase of beryllium in the light float fractions and the asymp totic approach of the curve to the 0 line as the ash content approaches and goes beyond 50 percent of the sample. In the region of low-ash content the coal substance contains almost all the beryllium. This is further indicated by the approach of the curve to the 0 line in the region of high-ash content. It is obvious that the maximum beryllium that can be contributed bv the extraneous ash of the coal is less than
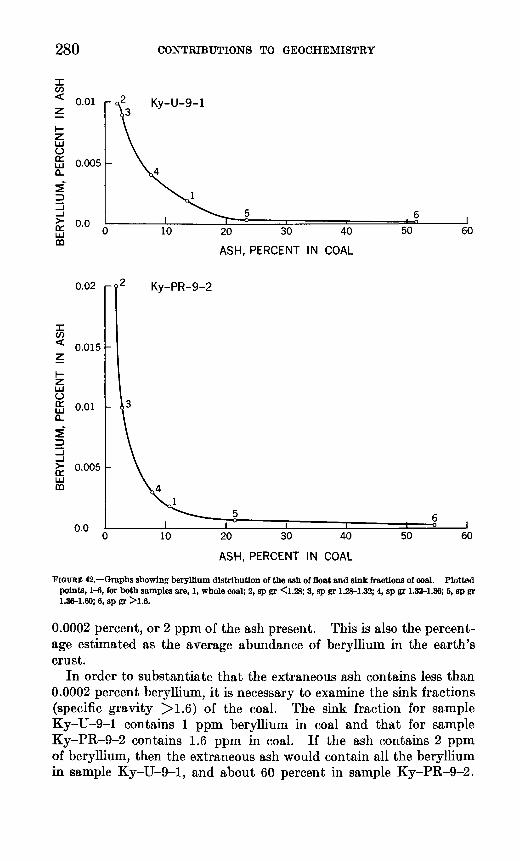
280 CONTRIBUTIONS TO GEOCHEMISTRY
CO<
UJO
>- DC.
m
0.01
0.005
0.0
Ky-U-9-1
10 20 30 40
ASH, PERCENT IN COAL
50 60
CO<
0.02 r
0.015
UJO2] 0.01Q.
UJm
0.005
0.0
Ky-PR-9-2
10 20 30 40
ASH, PERCENT IN COAL
50 60
FIGUBE 42. Graphs showing beryllium distribution of the ash of float and sink fractions of coal. Plotted points, 1-6, for both samples are, 1, whole coal; 2, sp gr <1.28; 3, sp gr 1.28-1.32; 4, sp gr 1.32-1.36; 5, sp gr 1.36-1.60; 6, sp gr >1.6.
0.0002 percent, or 2 ppm of the ash present. This is also the percent age estimated as the average abundance of beryllium in the earth's crust.
In order to substantiate that the extraneous ash contains less than 0.0002 percent beryllium, it is necessary to examine the sink fractions (specific gravity >1.6) of the coal. The sink fraction for sample Ky-U-9-1 contains 1 ppm beryllium in coal and that for sample Ky-PR-9-2 contains 1.6 ppm in coal. If the ash contains 2 ppm of beryllium, then the extraneous ash would contain all the beryllium in sample Ky-U-9-1, and about 60 percent in sample Ky-PR-9-2.
BERYLLIUM CONTENT OF AMERICAN COALS 281
Therefore, little or no beryllium may be present in the coal of the sink fractions, which would be contradictory to the finding that most of the beryllium is in the coal substance. An alternative is that the beryllium content of the extraneous ash is well below 0.0002 or even 0.0001 percent; and, therefore, the beryllium content of the ash-free coal of these fractions approaches that of the original sample and its float fractions.
Table 5 gives several additional samples that yielded similar results.In all these, it is apparent that the beryllium content of the inor
ganic constituents of coal is extremely low and that most of the beryllium in coal samples is associated with the organic matter of the coal.
Horton and Aubrey (1950, p. s46) also show that all or almost all beryllium in the coal samples they examined is associated with the organic matter.
TABLE 5. Float-sink experiments with coal samples showing the trend of berylliumcontent
Sample
Ky-SX-13-_-_ --- ---_--
Ok-Mc-D-l_ ____-. _ ._.._____._.
O-Mal-LK-7__ ................. _.
U-Su-Su-6A____. _-__..__._._.____
U-Su-Su-10... _________ _____._._.
Specific gravity
<1. 32>1. 32 <1. 32>1. 32 <1. 26
1. 26-1. 30 1. 30-1. 32
>1. 32 <1. 24
1. 24-1. 28 1. 28-1. 32
>1. 32 <1. 24
1. 24-1. 28 1. 28-1. 32
>1. 32
Ash (percent)
1.987.00 3.40
21.50 1.562.28 4.70
40.02 .85
1. 14 1.80
15. 17 1. 171.54 3.90
18.90
Be in ash (percent)
0. 17.006 .002.0001 .01.008 .003 .0002 .005.005 .003 .0002 .003.002 .001
<. 0001
Be in coal (Ppm)
354.2 .68.22
1.61.8 1.4 .8 .43.57 .54 .30 .35.31 .39
<. 19
COLUMNAR SAMPLES
Plate 1 shows the distribution of beryllium hi coal blocks of colum nar samples from various coal beds of the Interior province. The effect of dilution of the high-ash content of coal on the beryllium con tent of the ash is shown by the graphs. Almost invariably the higher the ash figure becomes, the lower is the beryllium content of the ash. As a result of the varying ash content of the coal it is difficult to ascertain the distribution of the beryllium in the coal from the beryl- lium-in-ash data; consequently, the results were calculated in parts per million in coal and are presented in the third column of the graphs. Several beds show a somewhat higher beryllium content at the top
282 CONTRIBUTIONS TO GEOCHEMISTRY
and bottom of the beds; however, quite often the central parts of the beds are enriched. This is particularly noticeable in the two Indiana beds. It has been suggested that large concentrations of elements in the top and bottom parts of a coal bed were accumulated after burial of the beds. The assumption is that percolating solutions transfer these elements from the enclosing strata into the coal. The authors' data do not suggest that such a process took place for beryllium. There is no pronounced overall large-scale increase of beryllium con tent toward any part of a bed; rather there is an erratic distribution of the element, and blocks of coal with a large degree of variance in their beryllium content can be found adjacent to one another. Proba bly no secondary redistribution of beryllium took place. No redistri bution of beryllium in vitrains and fusains was observed. It is be lieved that these observations substantiate the premise that the beryllium now found in the coal and its constituent parts is the result of syngenetic rather than postdepositional processes.
BETWEEN COAL BEDS
Samples of beds from the Rocky Mountain and the northern Great Plains provinces (as well as beds 5 and 6 of Illinois and the Lower and Middle Kittanning beds of Ohio) provide the best example of beryllium in the different coal beds in limited areas. Table 6 has been compiled from data in table 2.
Table 6 shows that the average beryllium content of coal in the Finch beds (samples Wyo-Ga-Fj to -F5) ranges from 0.1 to 0.8 ppm. No systematic variation is apparent in these samples. In a series of beds in the Eock Springs formation, the upper beds (samples Wyo-Re-9 and -11) contain much more beryllium than do the lower beds; but, as some of these beds are represented by the analysis of only one of several blocks of the columnar sample of the bed, the distribution of the beryllium content in these beds cannot be determined with certainty.
Auger samples of beds in four areas of the northern Great Plains province were analyzed (table 6). However, these samples do not represent the entire sequence of coal beds in these areas because there probably are beds stratigraphically lower and higher than the ones sampled. In three of the four areas the lowermost and the uppermost beds have less beryllium than do some of the inter mediate beds. In the other area (Mont-P) there is little difference in the three beds; in fact the Flatness bed has a greater range in the averages of three of its samples than exists between the beds. In area Mont-GS there is also a similarity in the average beryllium content of the following beds: E, 2.5 ppm; F, 2.7 ppm; and G, 2.4 ppm.

BERYLLIUM CONTENT OF AMERICAN COALS
TABLE 6. Beryllium content of various coal beds in limited areas
283
Position of beds Sample Bed
Beryllium in coal (ppm)
Rocky Mountain province
to
lower
to
Wyo-Ga-F4 . -
Wyo-Re-11.. _______ __ ....
Wyo-St-7^ -Wyo-Re-7 Wyo-St-1
Finch No. 5 . _ . _ ....... _ ......
Finch No. 3 ...........................Finch No. 2 _______________Finch No. 1 .. ........ ... _ .
No. 11... _ . .....No. 9--. No. 9 No. 7H - No. 7 No. 1 ... ... ... ... ... ....
<o.<
12.7.6.3.1.
Northern Great Plains province
to
to
to
TTirnpr
to
Mont-P-2 .
Mont-G-F. ...........................Mont-P-3... __ . . .. _ - __ ..
Mont-GS-10501... _ ... ............Mont-GS-10506.. Mont-GS-10508. . ... _ .... _ Mont-GS-10504 .--..- ..-- ... ..Mont-GS-10505 ... ... ... ...Mont-GS-10502. _-.___ _._- _____Mont-GS-10509- __ . _ -..-.. .....Mont-GS-10510 __ -. Mont-GS-10503.-.. .... __ ........Mont-GS-10507 .... _ ... ...
ND F 49877ND-F-49878. ....................ND-F-49874 . - _ .-.....ND-F-49880.... ...... ..............
Wyo-Ch-He-1 ......................
Wyo-Ch-He-6 .
Wyo-Ch-He-5 - _ ... .. _ ....
do-.. . .....do.... ... ... ...
H do .....do . ......... ...G_ -__ -..- . . - ..do..... . . __F___ . .do ..do-.. E.... ....... ...... . . . D.-.
.do .
Healy
. do ....... . . . ... ... -do ...
0.8.6
1.11.81.5
<.51.0
<.21.63.26.0.8
1.22.5.5
.54.0.8
1.5
.2
.8
.5
.1
.1
The similarity in beryllium content that would probably exist for beds in the same general area if a large number of samples of the same bed were analyzed is best shown by the following table.
Bed
Illinois No. 5 _________Illinois No. 6..... ..... ..... .Ohio Lower Kittanning. .... Ohio Middle Kittanning....
Number of bed samples
121210 6
Average beryllium in coal (ppm)
1.61.82.52.6
These comparisons are made of beds that are stratigraphically rel atively close together. The similarity in their beryllium content serves as an indicator that source material during the deposition of these different beds changed very little. It is probable that these similarities in succeeding beds are found only in the Paleozoic basins

284 CONTRIBUTIONS TO GEOCHEMISTRY
of the eastern and central United States where coal beds were de posited in large continuous sheets. Perhaps the great differences in the western basins are the result of the nature of the depositional basins. Coal was deposited in small isolated basins that had little or no continuity, and as a result some sites could receive a large in flux of material whereas others could be completely cut off from a source.
The examples given in the preceding table indicate that from an analysis of one or only a few samples of an extensive coal bed, no significant prediction can be made as to the average amount of beryl lium in a bed nor can any comparison be made between beds. Thus, beds with an unusual beryllium content such as those of eastern Kentucky and Indiana should be studied in more detail.
COAL ASH OF THE PROVINCES
There are 1,385 analyses given in table 2; however, 43 of them were late additions for the Eastern region of the Interior province. Only the results of the earlier 1,342 analyses are discussed in this bulletin. The 43 additional samples analyzed are not discussed because they would not change the results to any large degree. The summary shown in figure 43 indicates that a significant difference exists between the average beryllium content of the coal ash of the different provinces. These differences would also apply to the beryllium content of the coal as the difference between the ash averages are small (table 7). Figure
Eastern Province 376 samples
Interior Province 586 samples
Northern GreatPlains Province
189 samples
Rocky MountainsProvince
191 samplesCombined totals
1342 samples
Less than 2
2-5
0 5-10
g£ z.
- 20-40t/>< z.
^ ______ ^
m
More than80
^,--~"~
_ ---''"
^^'^
^*-*' ^
.s'
-
-
-___ ~~~
-
\h \
, \ \V \ \
x s \ \\\
X \
\ x-X\
-- "\
\.^
-x\
^^. ""\
~--._^"~--~-^_
-
xx
\ \\\ \- \\
\ \ _ xx
X \
\^\
x^^
-
/// /
/~ ,'
/ /t /
/ / /
/ / /
// // /- //
- 50
- 40
- 30
- 10
- 0
FIGURE 43. Correlation chart showing distribution of the individual samples by province and by theberyllium content of the ash.

BERYLLIUM CONTENT OF AMERICAN COALS 285
43 shows that the Rocky Mountain province has the largest number of analyses in the lower beryllium ranges (72 percent have less than 10 ppm), whereas the Interior province has only 18.6 percent in the same category. Data on page 255 compiled by Zilbermintz and Rusanov (1936) show a range in this category from 5.6 to 64.7 percent for various deposits in the U.S.S.R. Thus, there seems to be a general similarity between the American coals and those of the U.S.S.R.
The averages by province for beryllium in ash further accentuate these differences (table 7). The Rocky Mountain province has the lowest average content (24 ppm or 12 clarkes), the northern Great Plains province has one slightly higher, the Interior province has double that of the Rocky Mountain province, and the Eastern prov ince has an average content still higher (62 ppm or 32 clarkes). Because the average ash content of the coal is about the same, ap proximately the same ratios would be maintained i£ the beryllium con tent in coal was determined in parts per million.
TABLE 7. Beryllium content of the average ash in the coal samples of the provinces
Province
Eastern ___ _.__ _ _. ______ _
Northern Great Plains ___ _Rocky Mountain. _ _____ ___
Total or average _ ___ ___
Number of samples
376 586 189 191
1,342
Average ash (percent)
7.59 7. 71 9.83 6.22
7. 74
Average beryllium content of the ash
(ppm)
62 49 2724
46
(clarkes)
3124.5 13.5 12
23
Table 7 infers that the beryllium content of the coal beds of the provinces depends upon the rank and the age of the coal. The older (Pennsylvanian) and higher rank coal of the Eastern and Interior provinces contains on the average much more beryllium than does the younger (Cretaceous to Eocene) and lower rank coal of the other two provinces. A closer inspection of the data invalidates such a relation ship. The Jurassic coal beds of Montana contain approximately the same amount of beryllium as do the Pennsylvanian coal beds. In Sweetwater County, Wyo., coal beds contain much more beryllium than do any of the other coal beds of their age, and more than many Pennsylvanian coal beds. The coal beds of Oklahoma and Arkansas, although all are of Pennsylvanian age, differ greatly in their beryllium content. Although the coal beds of Arkansas are of higher rank, it is particularly noticeable that they contain much less beryllium than do those of northern Oklahoma. The data show extreme differences in the beryllium content of coal beds of the same rank and age, as well as
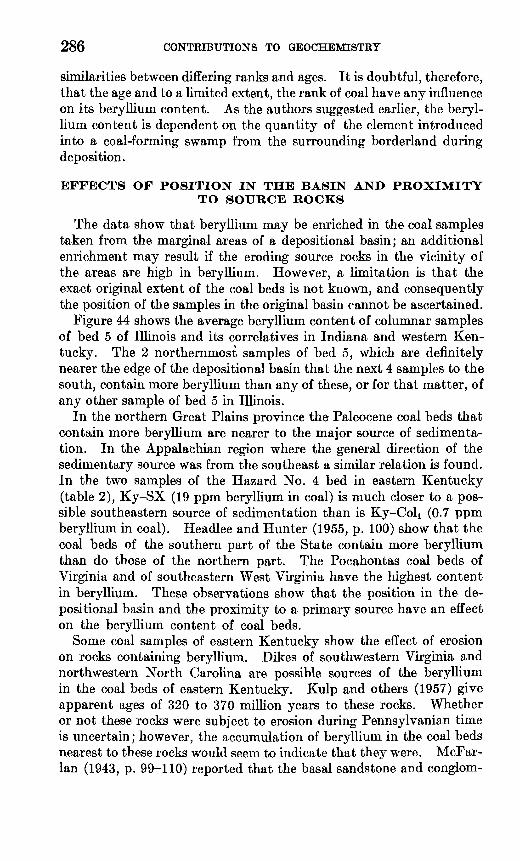
286 CONTRIBUTIONS TO GEOCHEMISTRY
similarities between differing ranks and ages. It is doubtful, therefore, that the age and to a limited extent, the rank of coal have any influence on its beryllium content. As the authors suggested earlier, the beryl lium content is dependent on the quantity of the element introduced into a coal-forming swamp from the surrounding borderland during deposition.
EFFECTS OF POSITION IN THE BASIN AND PROXIMITY TO SOURCE ROCKS
The data show that beryllium may be enriched in the coal samples taken from the marginal areas of a depositional basin; an additional enrichment may result if the eroding source rocks in the vicinity of the areas are high in beryllium. However, a limitation is that the exact original extent of the coal beds is not known, and consequently the position of the samples in the original basin cannot be ascertained.
Figure 44 shows the average beryllium content of columnar samples of bed 5 of Illinois and its correlatives in Indiana and western Ken tucky. The 2 northernmost samples of bed 5, which are definitely nearer the edge of the depositional basin that the next 4 samples to the south, contain more beryllium than any of these, or for that matter, of any other sample of bed 5 in Illinois.
In the northern Great Plains province the Paleocene coal beds that contain more beryllium are nearer to the major source of sedimenta tion. In the Appalachian region where the general direction of the sedimentary source was from the southeast a similar relation is found. In the two samples of the Hazard No. 4 bed in eastern Kentucky (table 2), Ky-SX (19 ppm beryllium in coal) is much closer to a pos sible southeastern source of sedimentation than is Ky-Coli (0.7 ppm beryllium in coal). Headlee and Hunter (1955, p. 100) show that the coal beds of the southern part of the State contain more beryllium than do those of the northern part. The Pocahontas coal beds of Virginia and of southeastern West Virginia have the highest content in beryllium. These observations show that the position in the de positional basin and the proximity to a primary source have an effect on the beryllium content of coal beds.
Some coal samples of eastern Kentucky show the effect of erosion on rocks containing beryllium. Dikes of southwestern Virginia and northwestern North Carolina are possible sources of the beryllium in the coal beds of eastern Kentucky. Kulp and others (1957) give apparent ages of 320 to 370 million years to these rocks. Whether or not these rocks were subject to erosion during Pennsylvanian time is uncertain; however, the accumulation of beryllium in the coal beds nearest to these rocks would seem to indicate that they were. McFar- lan (1943, p. 99-110) reported that the basal sandstone and conglom-

BERYLLIUM CONTENT OF AMERICAN COALS 287
erate of the Pennsylvanian formations of the eastern and western basins of Kentucky contain pebbles of vein quartz and suggested that the source of the pebbles was from outside Kentucky. This is a further indication that erosion of the dikes could have been taking place by Pennsylvanian time.
KENTUCKY
1.4 Approximate locations
of samplesFigures denote beryllium
in coal, in parts per million
0 25 50 _75___lOOMILES^J
FIGURE 44. Map showing beryllium distribution in bed 5 of Illinois and its correlatives in Indiana andwestern Kentucky.

288 CONTRIBUTIONS TO GEOCHEMISTRY
The reason coal beds in the same general areas and having a similar source of weathering products have very different beryllium contents can be attributed to the changing strand lines for the different depo- sitional cycles, and the changing drainage pattern from the erosional site through the depositional site to the sea. These would also differ from formation to formation and bed to bed and thus influence the beryllium contents of succeeding beds of coal in any single locality.
The coal samples from Indiana show unusually high contents of beryllium; these samples are difficult to explain if attempts to cor relate the coal beds of the Interior region with those of the Appalachian region are assumed to have some validity. McFarlan (1943, p. 136- 137) suggests that the beds were continuous. Any such widespread eastward continuity of bed 5 would place these samples far in the central part of the depositional basin. This is also true of the other beds of this area. Many of the correlation attempts were based on lithologic similarities of the enclosing rocks, but in a basin of repeated cyclic sedimentation these similarities should be easy to find. McFar lan (1943, p. 108-109) reports that the Kyrock conglomerate of the western Kentucky basin can be traced as channel-fill outliers to the Rockcastle conglomerate of the Appalachian basin and suggests a source east of the latter basin. These conglomerates can be equiva lent rock units, but not necessarily equivalent time units. The abrupt thinning of the Pottsville and other Pennsylvanian units toward the Cincinnati arch and the thickening westward from the arch suggest that this arch was a topographic high during most of Pennsylvanian time. As such the Cincinnati arch could have acted as a dam that may have prevented the deposition of similar rock units which are equivalent in time. Siever (1951, p. 570-578) suggests that the basal Pennsylvanian sandstones of the Interior province are westward extensions of large alluvial fans in the Appalachian geosyn- cline. It is entirely possible that when coal beds were being deposited in the Interior basin, clastic material was being deposited in the Appalachian region; it is doubtful that conditions would exist which would be conducive to the simultaneous deposition of coal beds in the Appalachian and the Interior regions.
Potter and Olson (1954, p. 66) in a study of crossbedding in some basal Pennsylvanian sandstone beds of the eastern Interior basin suggest a northeastern source for these sandstone beds. They also suggest that the southwestward trend of sedimentary transport may be the result of southward deflection by the LaSalle anticline of sediments derived from an eastern source.
The higher values for the beryllium content in samples of bed 5 in western Kentucky and Indiana (fig. 44), as well as the very high values of Indiana coal beds in general, seems to indicate that these
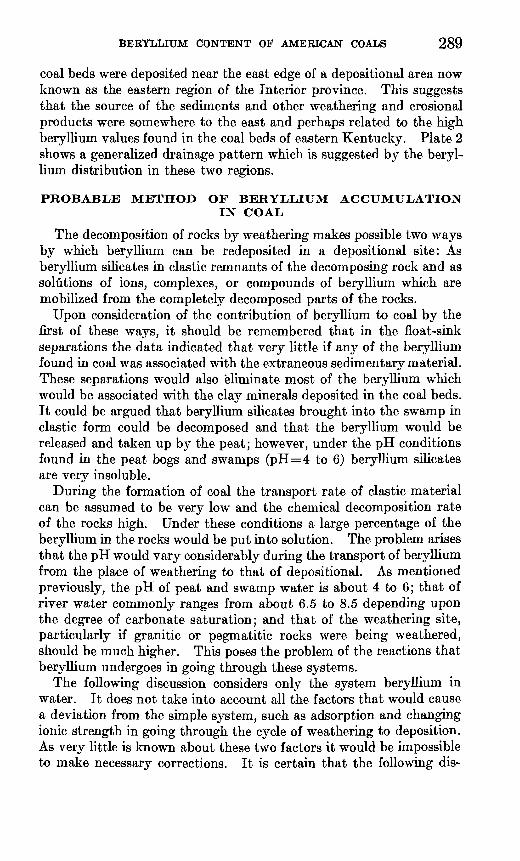
BERYLLIUM CONTENT OF AMERICAN COALS 289
coal beds were deposited near the east edge of a depositional area now known as the eastern region of the Interior province. This suggests that the source of the sediments and other weathering and erosional products were somewhere to the east and perhaps related to the high beryllium values found in the coal beds of eastern Kentucky. Plate 2 shows a generalized drainage pattern which is suggested by the beryl lium distribution in these two regions.
PROBABLE METHOD OF BERYLLIUM ACCUMULATIONIN COAL
The decomposition of rocks by weathering makes possible two ways by which beryllium can be redeposited in a depositional site: As beryllium silicates in clastic remnants of the decomposing rock and as solutions of ions, complexes, or compounds of beryllium which are mobilized from the completely decomposed parts of the rocks.
Upon consideration of the contribution of beryllium to coal by the first of these ways, it should be remembered that in the float-sink separations the data indicated that very little if any of the beryllium found in coal was associated with the extraneous sedimentary material. These separations would also eliminate most of the beryllium which would be associated with the clay minerals deposited in the coal beds. It could be argued that beryllium silicates brought into the swamp in clastic form could be decomposed and that the beryllium would be released and taken up by the peat; however, under the pH conditions found in the peat bogs and swamps (pH=4 to 6) beryllium silicates are very insoluble.
During the formation of coal the transport rate of clastic material can be assumed to be very low and the chemical decomposition rate of the rocks high. Under these conditions a large percentage of the beryllium in the rocks would be put into solution. The problem arises that the pH would vary considerably during the transport of beryllium from the place of weathering to that of depositional. As mentioned previously, the pH of peat and swamp water is about 4 to 6; that of river water commonly ranges from about 6.5 to 8.5 depending upon the degree of carbonate saturation; and that of the weathering site, particularly if granitic or pegmatitic rocks were being weathered, should be much higher. This poses the problem of the reactions that beryllium undergoes in going through these systems.
The following discussion considers only the system beryllium in water. It does not take into account all the factors that would cause a deviation from the simple system, such as adsorption and changing ionic strength in going through the cycle of weathering to deposition. As very little is known about these two factors it would be impossible to make necessary corrections. It is certain that the folio whig dis-

290 CONTRIBUTIONS TO GEOCHEMISTRY
cussion is adequate as a first approximation for the general behavior of beryllium.
The relation of the solubility of beryllium hydroxide as a function of pH (Chariot, 1954, p. 160) is shown on figure 45. The diagram shows that at higher pH values the complex anions predominate whereas at the low pH values the cations Be+2 and Be2O+2 are found in solution. Concentrations of 1X10~5 mole (approximately 1 ppm) or higher are found below a pH of 7.4 or above 10.5. The average beryllium content of rocks in the earth's crust is 2 ppm; that of the enriched rocks is somewhat more. Upon weathering and solution of beryllium minerals this small quantity is further reduced several times. All the beryllium could easily be put in solution hi a complex-ion form at a pH of 12, if such a pH value can be reached in nature. Some Be(OH) 2 could precipitate between pH values of 8 to 10. Below a pH of about 8 some of the beryllium if previously precipitated could redissolve. At a pH of about 6.7 approximately 100 ppm of beryllium cations could exist in a saturated solution. Below this pH value it is doubtful that the beryllium content of rock could supply enough of the element to cause a precipitate.
The relative amounts of the cations Be2O+2 and Be+2 in the acid region of the diagram (fig. 45) can be determined from the equilibrium constants given by Chariot. The ratio of Be2O+2 to Be+2 would range between 10 and 100. These ratios are independent of pH and indicate that beryllium would be present principally as the complex cation.
00:D
8
10
10
Be262 Be(OH)
HBeOo
and
8
PH
10 12 14
FIGTJEE 46. Diagram showing apparent solubility of beryllium hydroxide as a function of pH. (AfterChariot, 1954, p. 160.)

BERYLLIUM CONTENT OF AMERICAN COALS 291
Therefore, disregarding the formation of organic complexes during transport, it is easy to follow the course of the beryllium. It is put into solution as complex anions by weathering at higher pH values. As the pH values drop in stream water, some Be(OH) 2 may be formed, but because of the initial low content of this element little accretion could take place. The particles would be of colloidal or subcolloidal size and would be transported into the swamp. Because of the lower pH of the swamp water, the particles would redissolve and the beryl lium would be available to plants and for the formation of organic complexes.
In general, beryllium forms very stable inert metallo-organic com plexes with hydroxylated organic compounds. Whether such complexes would form and be retained in the coal depends upon the solu bility of the complexes and the concentration of beryllium. Because most coals have some beryllium in their organic part, and some have quite large amounts, it is possible that plant adsorption and formation of complexes are responsible for the beryllium in coal.
This is a simplified picture of a complex process. It is certain that vegetation was growing in the areas of weathering and it is known that plants growing where there are beryllium-rich rocks can accumulate the element. Upon death and decomposition of this vegetation, beryl lium could be transported to the coal swamp in fragments of the de composing material or as dispersed metallo-organic complexes formed in the decomposing media. Either way, the beryllium would be incorporated into the growing peat moss.
An interesting corollary to the explanation just given is observed in the Arkansas lignite beds (sample Ark-M-UE and -LE, table 2) which contain above-average quantities of beryllium. Gordon and Murata (1952, p. 178) observed that beryllium found in parent nepheline syenite rocks did not follow aluminum into bauxite according to ionic- potential principles; rather beryllium was found to be less concen trated in most of the bauxite in the Wilcox group of Eocene age. The lignite samples given in table 2 of this report are also from the Wilcox group, but farther south. These Arkansas lignite beds are presumed to have an allochthonous origin. It is possible that they are remnants of the vegetation growing in the nepheline syenite weathering zone and that the beryllium now found in the lignite beds is a result of plant or plant humus accumulation of beryllium as it weathered out of the parent rock. The explanation could account for the small accumulation of beryllium in bauxite, but its validity cannot be proven until more data are accumulated.
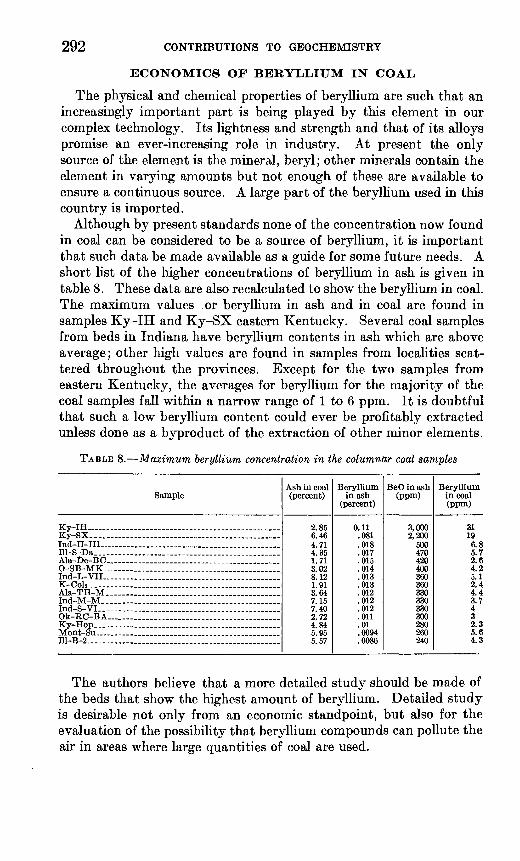
292 CONTRIBUTIONS TO GEOCHEMISTRY
ECONOMICS OF BERYLLIUM IN COAL
The physical and chemical properties of beryllium are such that an increasingly important part is being played by this element in our complex technology. Its lightness and strength and that of its alloys promise an ever-increasing role in industry. At present the only source of the element is the mineral, beryl; other minerals contain the element in varying amounts but not enough of these are available to ensure a continuous source. A large part of the beryllium used in this country is imported.
Although by present standards none of the concentration now found in coal can be considered to be a source of beryllium, it is important that such data be made available as a guide for some future needs. A short list of the higher concentrations of beryllium in ash is given in table 8. These data are also recalculated to show the beryllium in coal. The maximum values .or beryllium in ash and in coal are found in samples Ky-IH and Ky-SX eastern Kentucky. Several coal samples from beds in Indiana have beryllium contents in ash which are above average; other high values are found in samples from localities scat tered throughout the provinces. Except for the two samples from eastern Kentucky, the averages for beryllium for the majority of the coal samples fall within a narrow range of 1 to 6 ppm. It is doubtful that such a low beryllium content could ever be profitably extracted unless done as a byproduct of the extraction of other minor elements.
TABLE 8. Maximum beryllium concentration in the columnar coal samples
Sample
Ky-IH.................................................Ky-SX-... - . . . .-..-_..-____......Ind-H-ni........ ......................................Ill-S-Da.. ....... __ _.._.-_..-_._.__.___________.__.__Ala-De-BC ____ . ____________________O-SB-MK........... ..................................Ind-L- VII..... ...... ...............................K-Col2 - _ ..........................Ala-TH-M. . _ - ._.____.._____.._._.Ind-M-M.... _ ......................................Ind-S-VI.. ............................................Ok-RC-BA........ ....................................Ky-Hop...... . .....................................Mont-Su _________________________m-B-2 ..............................................
Ash in coal (percent)
2.856.464.714.351.713.028.121.913.647.157.402.724.845.955.57
Beryllium in ash
(percent)
0.11.081.018.017.015.014.013.013.012.012.012.011.01.0094.0086
BeO in ash (ppm)
3,0002,200
win470420400360360330330330300280260240
Beryllium in coal (ppm)
31196.85.72.64.25.12.44.43.7432.35.64.3
The authors believe that a more detailed study should be made of the beds that show the highest amount of beryllium. Detailed study is desirable not only from an economic standpoint, but also for the evaluation of the possibility that beryllium compounds can pollute the air in areas where large quantities of coal are used.

BERYLLIUM CONTENT OF AMERICAN COALS 293
SUMMARY AND CONCLUSIONS
The study of 1385 samples of coal from most of the coal-producing regions of the United States shows a wide variation in beryllium con tent. The areal distribution of the sample localities shows beryllium- rich and beryllium-poor regions. The rich and the poor distribution of beryllium in coal beds depends upon the availability of beryllium to the swamps at the time of deposition of the coal. This availability was dependent upon the type of rock being eroded in the surrounding borderlands.
There is also a pattern in the distribution of beryllium in coal in a basin. Coal sampled near the edge of a basin has a higher beryllium content than that sampled in the center. Coal that was deposited near eroding rocks rich in beryllium, or that had access to water from such areas is also high in beryllium.
In sink-float experiments, beryllium is consistently associated with the lighter organic-rich fractions. The beryllium content of the sink fractions, particularly those with a high percentage of ash, consist ently is below the average for that of the earth's crust. The analysis of petrographic constituents of coal shows that beryllium is most often associated with vitrain and least with fusain.
The accumulation of beryllium in coal is concluded to be a syn- genetic process. The beryllium now present in the coal probably is a result of accumulation by plants and (or) by the adsorption from solution by the organic matter in the coal-forming swamps to form metallo-organic complexes. Although some of the original beryllium may have been lost, there is no possible way to ascertain this. Fur ther studies should be made of coal beds which contain large amounts of beryllium. The economic aspects of the beryllium in coal are not predictable.
LITERATURE CITED
Beus, A. A., 1956a, Berilii; otsenka mestorozhdenii pri poiskakh i razvedkakh [Beryllium, evaluation of the deposits during the search and reconnaissance]: Moscow, Gosgeoltekhizdat, 148 p.
1956b, Geokhimiya berilliya [The geochemistry of beryllium]: Geokhi- miya, No. 5, p. 75-92.
Beus, A. A., and Fedorchuk, S. N., 1955, O klarke berilliya v granitnykh pegma- titakh [On the clarke of beryllium in granite pegmatites]: Akad. Nauk SSSR Doklady, n.s., v. 104, no. 1, p. 108-111.
Beus, A. A., and Sazhina, L. I., 1956, O klarke berilliya v keslykh magmatiches- kikh porodakh SSSR [The clarke of beryllium in acid igneous rocks of the USSR]: Akad. Nauk SSSR Doklady, n.s., v. 109, no. 4, p. 807-810.
Borodin, L. S., 1956, O rasprostranenni berilliya v khibinskom shchelochnom massive i o klarke berilliya nefelinovykh sienitakh [On the distribution of beryllium in Khibin alkali massif and the clarke of beryllium in nepheline syenites]: Akad Nauk SSSR Doklady, n.s., v. 109, no. 4, p. 811-812.
294 CONTRIBUTIONS TO GEOCHEMISTRY
Chariot, Gaston, 1954, Qualitative inorganic analysis; a new physico-chemical approach (authorized translation of 4th French ed., by Murray, R. C.): London, Methuen and Co. Ltd.; New York, John Wiley and Sons, Inc., 354 p.
Clarke, F. W., and Washington, H. S., 1924, The composition of the earth's crust: U.S. Geol. Survey Prof. Paper 127, 117 p.
Deul, Maurice, and Annell, C. S., 1956, The occurrence of minor elements in ash of low-rank coal from Texas, Colorado, North Dakota, and South Dakota: U.S. Geol. Survey Bull. 1036-H, p. 155-172.
Fersman, A. E., 1939, Geokhimiya [Geochemistry], v. 4, 355 p.: Leningrad, Goskhimtekhizdat.
Fleischer, Michael, and Cameron, E. N., 1946, Geochemistry of beryllium (report to Manhattan Project 1945, revised as MDDC-643, 1946); 1955, p. 80-92, in Quill, L. L., ed., The chemistry and metallurgy of miscellaneous materials: U.S. Atomic Energy Comm. TID-5212, U.S. Atomic Energy Comm. Tech. Inf. Service, Oak Ridge, Tenn.
Francis, Wilfrid, 1954, Coal, its formation and composition: London, E. Arnold and Co.; New York, St. Martins Press, 567 p.
Goldschmidt, V. M., 1935, Rare elements in coal ashes: Indus, and Eng. Chem istry, v. 27, p. 1100-1102.
1937, The principles of distribution of chemical elements in minerals androcks: Chem. Soc. London Jour., p. 655-673.
Goldschmidt, V. M., and Peters, C., 1932, Zur Geochemie des Berylliums [Thegeochemistry of beryllium]: Gesell. Wiss. Gottingen, Nachr., Math.-phys.Kl., Heft 4, p. 371-387.
1933, Uber die Anreicherung seltener Elemente in Steinkohlen [Concentra tion of rare elements in coal]: Gesell. Wiss. Gottingen, Nachr., Math.-phys. Kl., Heft 4, p. 371-387.
Gordon, Mackenzie, Jr., and Murata, K. J., 1952, Minor elements in Arkansas bauxite: Econ. Geology, v. 47, no. 2., p. 169-179.
Headlee, A. J. W., and Hunter, R. G., 1955, Characteristics of minable coals of West Virginia, pt. 5, The inorganic elements in the coals: West Virginia Geol. Survey [Rept.], v. 13A, p. 36-122.
Hoagland, M. B., 1952, The effect of beryllium on plant growth, pt. 2 of Beryllium and growth: Archives Biochemistry and Biophysics, v. 35, no. 2, p. 249-258.
Horton, L., and Aubrey, K. V., 1950, The distribution of minor elements in vitrain three vitrains from the Barnsley seam: Soc. Chem. Industry Jour. [London], v. 69, supp. no. 1, p. s41-s48.
Kulp, J. L., Long, L. E., and Eckelmann, F. D., 1957, Age of the Piedmont and Southern Appalachians [abs.]: Geol. Soc. America Bull., v. 68, no. 12, p. 1758-1759.
McFarlan, A. C., 1943, Geology of Kentucky: Lexington, Ky., Univ. of Kentucky 531 p.
Martell, Arthur, and Calvin, Melv^n, 1952, Chemistry of the metal chelate com pounds: New York, Prentice Hall, Inc., 613 p.
Potter, P. E., and Olson, J. S., 1954, Geological application, pt. 2 of Variance components of cross-bedding direction in some basal Pennsylvanian sand stones of the Eastern Interior Basin: Jour. Geology, v. 62, p. 50-73.
Rankama, Kalervo, and Sahama, Th. G., 1950, Geochemistry: Chicago, Univ Chicago Press, 912 p.
Sandell, E. B., 1952, The beryllium content of igneous rocks: Geochim. et Cosmochim. Acta, v. 2, no. 4, p. 211-216.
BERYLLIUM CONTENT OF AMERICAN COALS 295
Sandell, E. B., and Goldich, S. S., 1943, The rarer metallic constituents of some American igneous rocks: Jour. Geology, v. 51, no. 2, p. 99-115; no. 3, p. 167-189.
Siever, Raymond, 1951, The Mississippian-Pennsylvanian unconformity in southern Illinois: Am. Assoc. Petroleum Geologists Bull., v. 35, no. 3, p. 542-581.
Stadnichenko, Taisia, Murata, K. J., Zubovic, Peter, and Hufschmidt, E. L., 1953, Concentration of germanium in the ash of American coals, a progress report: U.S. Geol. Survey Circ. 272, 34 p.
Vinogradov, A. P., 1956, The regularity of distribution of the chemical elements in the earth's crust: Geokhimiya, no. 1, p. 1-52 [in Russian]; English transla tion by Botcharsky, S., 1957, Atomic Energy Research Establishment AERE-Lib./Trans-795, Harwell, England, 64 p.
Zilbermintz, V. A., and Rusanov, A. K., 1936, The occurrence of beryllium in fossil coals: Acad. Sci. URSS Comptes rendus, v. 2 (n.s., v. 11), no. 1, p. 27-31.


Contributions toGeochemistry1958
GEOLOGICAL SURVEY BULLETIN 1084
This volume was printed as separate chapters A-K
UNITED STATES GOVERNMENT PRINTING OFFICE, WASHINGTON : 1961

UNITED STATES DEPARTMENT OF THE INTERIOR
STEWART L. UDALL, Secretary
GEOLOGICAL SURVEY
Thomas B. Nolan, Director

CONTENTS
[The letters in parentheses preceding the titles designate separately published chapters]Page
A) Natural radioactive disequilibrium of the uranium series, by John N.Rosholt, Jr_________________________________________________ 1
(B) Rapid analysis of chromite and chrome ore, by Joseph I. Dinin__-__- 31(C) Selenium content of some volcanic rocks from Western United States
and Hawaiian Islands, by D. F. Davidson and H. A. Powers._____ 69(D) Geochemistry of uranium in phosphorites and black shales of the
Phosphoria formation, by Richard P. Sheldon_________________ 83(E) Distribution of chemical elements in the Salt Wash member of the
Morrison formation, Jo Dandy area, Montrose County, Colorado, by William L. Newman and Donald P. Elston_____-_-_-_-______ 117
(F) Spectrophotometric determination of traces of lead in igneous rocks,by C. E. Thompson and H. M. Nakagawa____-_______---_---_-_ 151
(G) Method for the quantitative spectrochemical analysis of rocks, miner als, ores, and other materials by a powder d-c arc technique, by Harry Bastion, Paul R. Barnett, and K. J. Murata______________ 165
(H) An evaluation of whole order, )_-order, and ^i-order reporting in semi- quantitative spectrochemical analysis, by Paul R. Barnett__-_-_ 183
(I) A spectrochemical method for the semiquantitative analysis of rocks, minerals, and ores, by A. T. Myers, P. G. Havens, and P. J. Dunton___________________________________ 207
(J) A constant-feed direct-current arc, by C. S. Annel and A. W. Helz___ 231(K) Beryllium content of American Coals, by Taisia Stadnichenko, Peter
Zubovic, and Nola B. Sheffey_________________________________ 253m
U. S. GOVERNMENT PRINTING OFFICE : 1961 O - 584502