Bernstein Innovative Energy Technologies Conference · PDF fileTrends Driving Industry Change....
21
EDISON INTERNATIONAL® Leading the Way in Electricity SM March 25, 2014 Bernstein Innovative Energy Technologies Conference March 25, 2014
Transcript of Bernstein Innovative Energy Technologies Conference · PDF fileTrends Driving Industry Change....

EDISON INTERNATIONAL®
Leading the Way in Electricity SM
March 25, 2014 0
Bernstein Innovative Energy Technologies Conference
March 25, 2014

EDISON INTERNATIONAL®
Leading the Way in Electricity SM
March 25, 2014 1
Statements contained in this presentation about future performance, including, without limitation, operating results, asset and rate base growth, capital expenditures, San Onofre Nuclear Generating Station (SONGS), EME bankruptcy, and other statements that are not purely historical, are forward-looking statements. These forward-looking statements reflect our current expectations; however, such statements involve risks and uncertainties. Actual results could differ materially from current expectations. These forward-looking statements represent our expectations only as of the date of this presentation, and Edison International assumes no duty to update them to reflect new information, events or circumstances. Important factors that could cause different results are discussed under the headings “Risk Factors” and “Management’s Discussion and Analysis” in Edison International’s Form 10-K and other reports filed with the Securities and Exchange Commission, which are available on our website: www.edisoninvestor.com. These filings also provide additional information on historical and other factual data contained in this presentation.
Forward-Looking Statements
EDISON INTERNATIONAL®
Leading the Way in Electricity SM
March 25, 2014 2
• Public policy prioritizing sustainability
• Technology and financing innovation facilitating conservation and self-generation
• Electric demand growth leveling off creating upward pressure on customer rates
• Regulation supporting competition
Trends Driving Industry Change

EDISON INTERNATIONAL®
Leading the Way in Electricity SM
March 25, 2014 3
Generation Transmission RetailDistribution
50 Years Ago Utility Utility Utility Utility
15 Years Ago Utility, Competitive Utility Utility Utility, Competitive
Today Utility, Competitive Utility, Competitive Utility Utility, Competitive
Changes in market structure are expanding opportunities for competitive players
Electric Power Industry Value Chain

EDISON INTERNATIONAL®
Leading the Way in Electricity SM
March 25, 2014 4
Role of the Utility in a Changing IndustryKey California Energy Mandates and Legislation:• Renewables – 33% by 2020 • Global Warming – AB32 greenhouse gas emissions reductions to 1990 levels by 2020 • California Solar Initiative – 1,940 MW residential solar installations by 2017• Energy Storage – 1,300 megawatts by 2020 • Energy Efficiency, Demand Response, Smart Meters
The electric power industry is going through a period of transformative change,driven simultaneously by technology and public policy
Utility Role:Grid of the
Future
• Provide the backbone distribution system• Create a ‘plug and play’ system capable of two-way electricity flows• Facilitate integration of distributed energy resources• Ensure grid reliability and power quality• Support continued growth and investment

EDISON INTERNATIONAL®
Leading the Way in Electricity SM
March 25, 2014 5
Solar PV Cost Trends
$4.00
$5.00
$6.00
$7.00
$8.00
$9.00
$10.00
$11.00
$12.00
1998 2000 2002 2004 2006 2008 2010 2012
Med
ian
Val
ue p
er W
att
(201
2$ )
≤ 10 kW 10-100 kW > 100 kW
Over the past decade, real installed solar system prices have fallen by nearly 50%
Note: Dollar values are in real 2012 dollars before state/local incentives. Median installed prices are shown only if 15 or more observations are available for the individual size range.Source: Lawrence Berkeley National Laboratory, “Tracking the Sun VI: An Historical Summary of the Installed Price of Photovoltaics in the United States from 1998 to 2012,” Figure 7

EDISON INTERNATIONAL®
Leading the Way in Electricity SM
March 25, 2014 6
($/T
hous
and
Cub
ic F
eet)
$0.00
$2.00
$4.00
$6.00
$8.00
$10.00
$12.00
$14.00
U.S. Natural Gas Prices, 2008 – 2013
Source: U.S. Energy Information Agency
(Electric Power Market)

EDISON INTERNATIONAL®
Leading the Way in Electricity SM
March 25, 2014 7
All Generation Cost Trends, Unsubsidized
$0.149
$0.109
$0.065 $0.061
$0.086 $0.089
$0.045
$0.123
$0.067
$0.108
$0.144
$0.086
$0.000
$0.050
$0.100
$0.150
$0.200
$0.250
Solar PV(Distributed)
Fuel Cell Coal Gas(CCGT)
Nuclear Solar PV(Utility Scale)
Wind(Utility Scale)
Lazard 2012 Levelized Cost of Energy (range) EIA 2012 Levelized Cost of Energy
$0.087
$0.122
$0.095
$0.204 $0.206
$0.145
$0.104
$/kW
h
Distributed Generation Central Station / Utility Scale Generation
Sources: Lazard Levelized Cost of Energy Version 7.0 August 2013; EIA Levelized Cost of Energy Analysis 2013
The levelized cost of energy for distributed generation resourcescontinues to move toward equilibrium with other generation sources

EDISON INTERNATIONAL®
Leading the Way in Electricity SM
March 25, 2014 8
$82$91 $92
$103
$177
$223
$11
> 20 MWTracking
> 20 MWFixed Tilt
< 20 MWTracking
< 20 MWFixed Tilt
Range ofTransmission
Cost
CommercialRooftop
ResidentialRooftop
Rooftop to Ground Mount
Ratio = 2.2
Central Station Rooftop
Central Station vs. Rooftop Solar Economics($/MWh)
Notes:• Average PPA prices for projects installed in 2013 from E3 Study, Investigating a Higher Renewables Portfolio Standard in California, January 2014, page 69; found at
http://www.ethree.com/documents/E3_Final_RPS_Report_2014_01_06_with_appendices.pdf• Assumes rooftop has no distribution upgrade costs• Range of transmission cost is based on RAM 4 RFO data

EDISON INTERNATIONAL®
Leading the Way in Electricity SM
March 25, 2014 9
SCE Residential Net Metering Rate Structure
8.2¢
28.3¢20.1¢
0
5
10
15
20
25
30
¢/kW
h
Solar Subsidies1,2
GenerationRate
Subsidy Paid by Other Ratepayers
EquivalentSolar Rate
1 Based on average home usage of 1,150 kwh/month, a 4-tier rate structure, and a 4.8kW solar system with a 18% capacity factor that generates 620 kWh per month of electricity2 Net metering limited to 5% under current formula – currently represents 1%
Residential solar customers receive a subsidyfunded by all other non-solar customers in higher tiers
• Residential solar customer generation offsets total retail rate
• Average retail rate of 28.3¢/kWh vs. actual generation cost of 8.2¢/kWh
• Resulting 20.1¢/kWh is a subsidy funded by all other non-solar customers in Tiers 3 and 4
EDISON INTERNATIONAL®
Leading the Way in Electricity SM
March 25, 2014 10
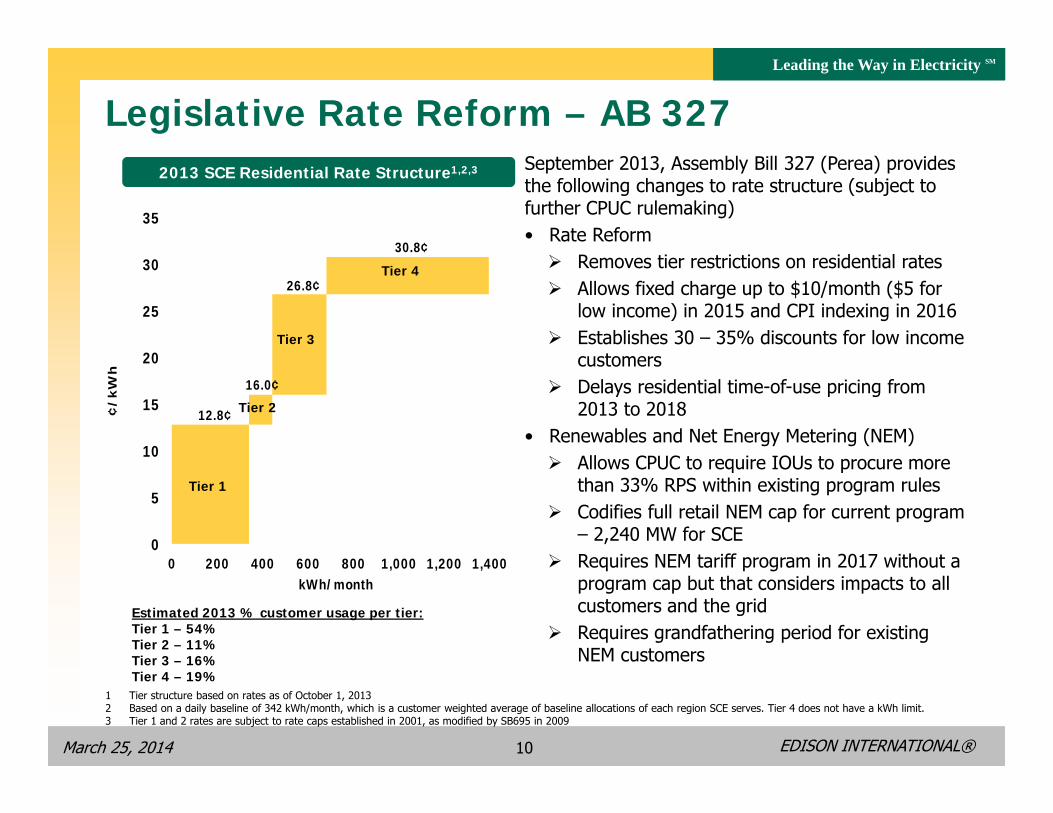
Legislative Rate Reform – AB 327September 2013, Assembly Bill 327 (Perea) provides the following changes to rate structure (subject to further CPUC rulemaking)• Rate Reform Removes tier restrictions on residential rates Allows fixed charge up to $10/month ($5 for
low income) in 2015 and CPI indexing in 2016 Establishes 30 – 35% discounts for low income
customers Delays residential time-of-use pricing from
2013 to 2018• Renewables and Net Energy Metering (NEM) Allows CPUC to require IOUs to procure more
than 33% RPS within existing program rules Codifies full retail NEM cap for current program
– 2,240 MW for SCE Requires NEM tariff program in 2017 without a
program cap but that considers impacts to all customers and the grid
Requires grandfathering period for existing NEM customers
12.8¢
16.0¢
26.8¢
30.8¢
0
5
10
15
20
25
30
35
0 200 400 600 800 1,000 1,200 1,400
¢/k
Wh
kWh/month
Tier 1
Tier 2
Tier 3
Tier 4
2013 SCE Residential Rate Structure1,2,3
1 Tier structure based on rates as of October 1, 20132 Based on a daily baseline of 342 kWh/month, which is a customer weighted average of baseline allocations of each region SCE serves. Tier 4 does not have a kWh limit.3 Tier 1 and 2 rates are subject to rate caps established in 2001, as modified by SB695 in 2009
Estimated 2013 % customer usage per tier:Tier 1 – 54%Tier 2 – 11%Tier 3 – 16%Tier 4 – 19%

EDISON INTERNATIONAL®
Leading the Way in Electricity SM
March 25, 2014 11
CAISO Net LoadRenewables
• Current 33% RPS by 2020 set as floor for CPUC per AB327
• More variable and less predictable output
• Output does not fully match demand
• Need for flexible, dispatchable capacity
Resource Adequacy
• 1-year forward
• 10-year forward long-term procurement process for new resources
• Need intermediate (3 – 5 years) forward capacity market with right mix of operational attributes
Increasing renewable generation creates need forsubstantial amount of flexible, dispatchable capacity
Source: CA Independent System Operator, “2013 Special Reliability Assessment”, September 18, 2013 and represents a single day in March of each year
CAISO ‘Peaking’ Duck Chart
10,000
12,000
14,000
16,000
18,000
20,000
22,000
24,000
26,000
28,000
0 1 2 3 4 5 6 7 8 9 10 11 12 13 14 15 16 17 18 19 20 21 22 23
MW
CAISO Net Load --- 2012 through 2020
2012 (Actual) 2013 (Actual) 2014 2015 2016 2017 2018 2019 2020Hour Ending
Net Load = Load - Wind - Solar

EDISON INTERNATIONAL®
Leading the Way in Electricity SM
March 25, 2014 12
Energy Storage• September 2010, AB2514 (Skinner) directs
CPUC to establish procurement targets and policies for energy storage
• October 2013, CPUC final decision in Energy Storage OIR (R.10-12-007)
1,325 MW target for IOUs by 2024(580 MW SCE share)
Three types: transmission (53%), distribution (32%), customer-sited (15%)
Utility ownership limited to 50% of total target (290 MW SCE share)
First procurement cycle in December 2014
Broad range of technologies as defined in AB2514, excluding large hydro (>50 MW)
Energy Storage Procurement Guiding Principles:
• Optimization of the grid, including peak reduction, contribution to reliability needs, or deferment of transmission and distribution upgrade investments
• Integration of renewable energy
• Reduction of GHG emissions to 80% below 1990 levels by 2050, per California’s goals
SCE’s rate base investment opportunity in energy storageto be integrated into future capital expenditure requests

EDISON INTERNATIONAL®
Leading the Way in Electricity SM
March 25, 2014 13
Plug-In Electric Vehicles
California represents 10% of electric vehicle demand,driven by State air quality and GHG reduction policies
Source: Southern California Edison December 2013 PEV Market Report

EDISON INTERNATIONAL®
Leading the Way in Electricity SM
March 25, 2014 14
EIX – Positioned for Industry Change
EIX will respond and adapt to industry trends byadvancing flexible use of the grid and investing in new business opportunities
while continuing to provide safe, reliable, affordable electric service
Long-TermIndustry Trends
• Public policy prioritizing environmental sustainability
• Technology and financing innovations facilitating conservation and self-generation
• Regulation supporting new forms of competition
• Flattening domestic demand for electricity
EIXStrategy
• Invest in, build, and operate the next generation electric grid
• Pursue new growth opportunities in the electric sector
• Operational and service excellence
Responding to change

EDISON INTERNATIONAL®
Leading the Way in Electricity SM
March 25, 2014 15
• One of the nation’s largest electric utilities
Nearly 14 million residents in service territory
Approximately 5 million customer accounts
50,000 square-mile service area• Significant infrastructure investments:
1.4 million power poles
700,000 transformers
103,000 miles of distribution and transmission lines
3,700 MW owned generation – 21% of Total kWh Energy Requirement
• 7 – 9% projected average annual rate base growth 2014 – 2017 driven by: System reliability and infrastructure
replacement
California Renewables Portfolio Standard
Technology improvements
SCE Highlights

EDISON INTERNATIONAL®
Leading the Way in Electricity SM
March 25, 2014 16
Note: forecasted capital spending subject to timely receipt of permitting, licensing, and regulatory approvals. Forecast range reflects an average variability of 12%.
SCE Capital Expenditures Forecast($ billions)
2014-17Total
Requested $4.1 $4.5 $4.4 $4.2 $17.2
Range $3.6 $3.9 $3.9 $3.7 $15.1
• CPUC GRC focused on infrastructure replacement
• Includes known scope changes for FAA requirements and preliminary estimate of $360 million for Tehachapi Chino Hills undergrounding
$15.1 – $17.2 billion forecasted capital program
2014 – 2017
$4.1$4.5 $4.4
$4.2
2014 2015 2016 2017
Distribution Transmission Generation

EDISON INTERNATIONAL®
Leading the Way in Electricity SM
March 25, 2014 17
($ billions)
SCE Rate Base Forecast
• Driven by infrastructure replacement, reliability investments, and public policy requirements
• FERC rate base includes CWIP and is approximately 22% of 2014 rate base forecast, increasing to 24% in 2017
• Excludes SONGS rate base
7 – 9% CAGR projected rate base
2014 – 2017
Requested
Range
$21.9$23.4
$25.5$27.1
$22.4
$24.4
$27.0
$29.2
2014 2015 2016 2017
Note: Weighted-average year basis, including forecasted 2014 FERC and 2015-2017 CPUC rate base requests and consolidation of CWIP projects. Rate Base forecast range reflects capital expenditure forecast range.

EDISON INTERNATIONAL®
Leading the Way in Electricity SM
March 25, 2014 18
Distributed Generation
Investments
• Small, targeted investments SoCore Energy (acquisition) – commercial / industrial DG developer Optimum Energy (investment) – energy optimization SCIenergy (investment) – energy efficiency and software Clean Power Finance (investment) – solar industry financial services and
software provider Proterra (investment) – electric buses

EDISON INTERNATIONAL®
Leading the Way in Electricity SM
March 25, 2014 19
Edison International's earnings are prepared in accordance with generally accepted accounting principles used in the United States. Management uses core earnings internally for financial planning and for analysis of performance. Core earnings are also used when communicating with investors and analysts regarding Edison International's earnings results to facilitate comparisons of the Company's performance from period to period. Core earnings are a non-GAAP financial measure and may not be comparable to those of other companies. Core earnings (or losses) are defined as earnings or losses attributable to Edison International shareholders less income or loss from discontinued operations and income or loss from significant discrete items that management does not consider representative of ongoing earnings, such as: exit activities, including sale of certain assets, and other activities that are no longer continuing; asset impairments and certain tax, regulatory or legal settlements or proceedings.
A reconciliation of Non-GAAP information to GAAP information is included either on the slide where the information appears or on another slide referenced in this presentation.
Use of Non-GAAP Financial Measures
EIX Investor Relations Contacts
Scott Cunningham, Vice President (626) 302-2540 [email protected]
Felicia Williams, Senior Manager (626) 302-5493 [email protected]
EDISON INTERNATIONAL®
Leading the Way in Electricity SM
March 25, 2014 20