Bernstein Energy Finding Petroleum: The Significance … Bernstein - Significance... ·...
29
BernsteinResearch.com European/Russian Oil & Gas – September 2012 Bernstein Energy Finding Petroleum: The Significance of Deep Water to Global Supply September 2012 See Disclosure Appendix of this publication for important disclosures and analyst certifications Oswald Clint Senior Research Analyst European & Russian Oil & Gas Oswald Clint PhD, ACA Senior Research Analyst [email protected] +44 20 7959 5089 Iain Pyle, CFA, ACA Senior Research Associate [email protected] +44 20 7170 0564 Rob West Senior Research Associate [email protected] +44 20 7170 0589
-
Upload
phungkhanh -
Category
Documents
-
view
223 -
download
1
Transcript of Bernstein Energy Finding Petroleum: The Significance … Bernstein - Significance... ·...
BernsteinResearch.com European/Russian Oil & Gas – September 2012
Bernstein Energy
Finding Petroleum: The Significance of Deep Water to Global Supply
September 2012
See Disclosure Appendix of this publication for important disclosures and analyst certifications
Oswald Clint
Senior Research Analyst
European & Russian Oil & Gas
Oswald Clint PhD, ACA Senior Research Analyst
[email protected] +44 20 7959 5089
Iain Pyle, CFA, ACA Senior Research Associate
[email protected] +44 20 7170 0564
Rob West Senior Research Associate
[email protected] +44 20 7170 0589
BernsteinResearch.com European/Russian Oil & Gas – September 2012
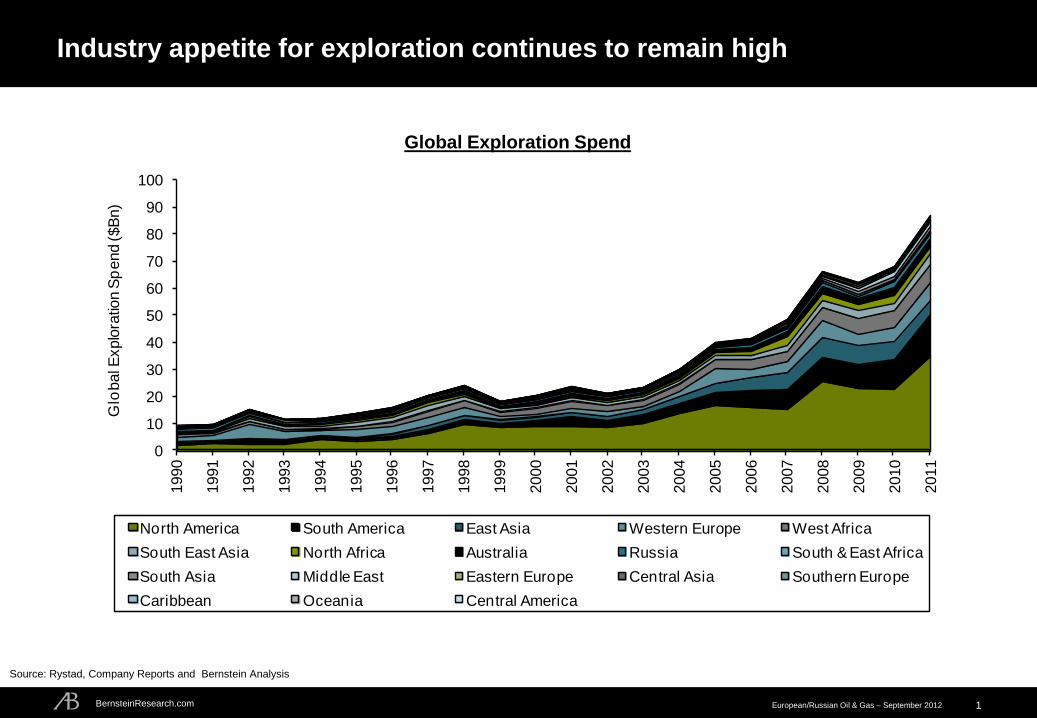
Industry appetite for exploration continues to remain high
1
Source: Rystad, Company Reports and Bernstein Analysis
Global Exploration Spend
0
10
20
30
40
50
60
70
80
90
1001990
1991
1992
1993
1994
1995
1996
1997
1998
1999
2000
2001
2002
2003
2004
2005
2006
2007
2008
2009
2010
2011
Glo
bal E
xplo
ratio
n S
pend ($B
n)
North America South America East Asia Western Europe West Africa
South East Asia North Africa Australia Russia South & East Africa
South Asia Middle East Eastern Europe Central Asia Southern Europe
Caribbean Oceania Central America
BernsteinResearch.com European/Russian Oil & Gas – September 2012
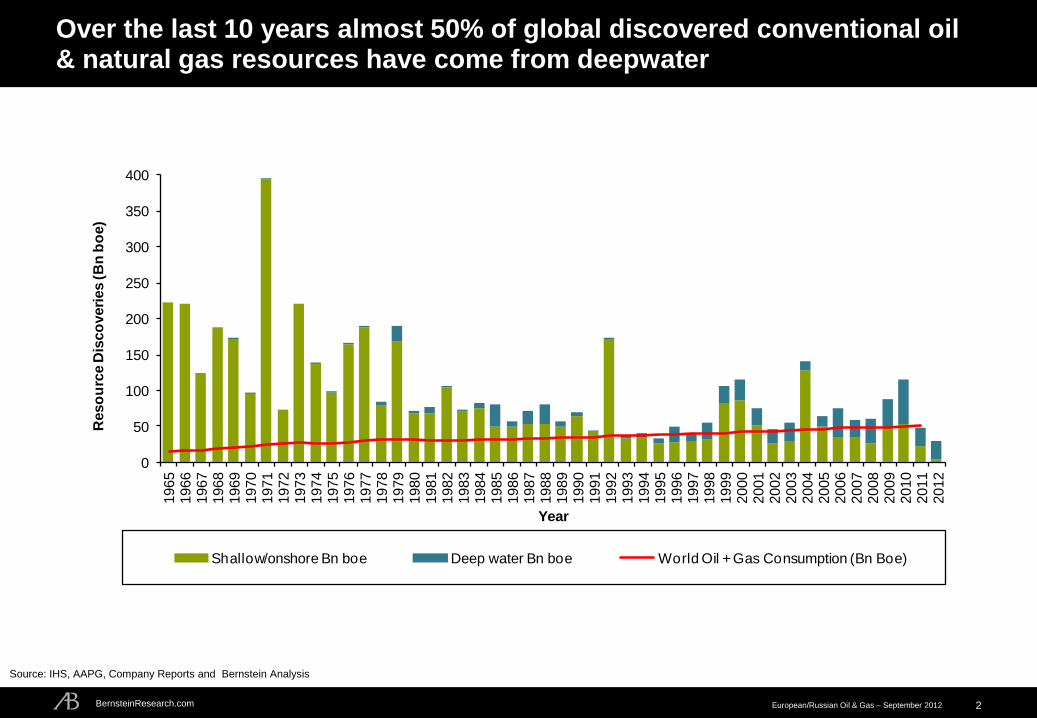
Over the last 10 years almost 50% of global discovered conventional oil & natural gas resources have come from deepwater
2
Source: IHS, AAPG, Company Reports and Bernstein Analysis
0
50
100
150
200
250
300
350
4001965
1966
1967
1968
1969
1970
1971
1972
1973
1974
1975
1976
1977
1978
1979
1980
1981
1982
1983
1984
1985
1986
1987
1988
1989
1990
1991
1992
1993
1994
1995
1996
1997
1998
1999
2000
2001
2002
2003
2004
2005
2006
2007
2008
2009
2010
2011
2012
Reso
urc
e D
isco
veri
es (B
n b
oe)
Year
Shallow/onshore Bn boe Deep water Bn boe World Oil + Gas Consumption (Bn Boe)
BernsteinResearch.com European/Russian Oil & Gas – September 2012
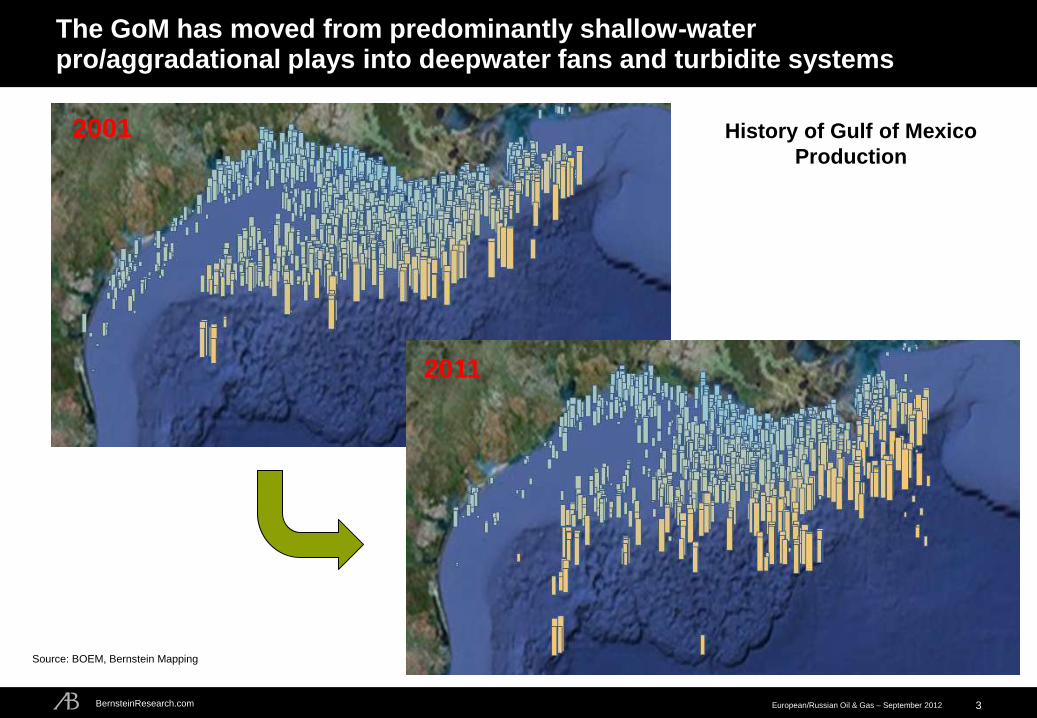
The GoM has moved from predominantly shallow-water pro/aggradational plays into deepwater fans and turbidite systems
3
2001
2011
Source: BOEM, Bernstein Mapping
History of Gulf of Mexico
Production
BernsteinResearch.com European/Russian Oil & Gas – September 2012
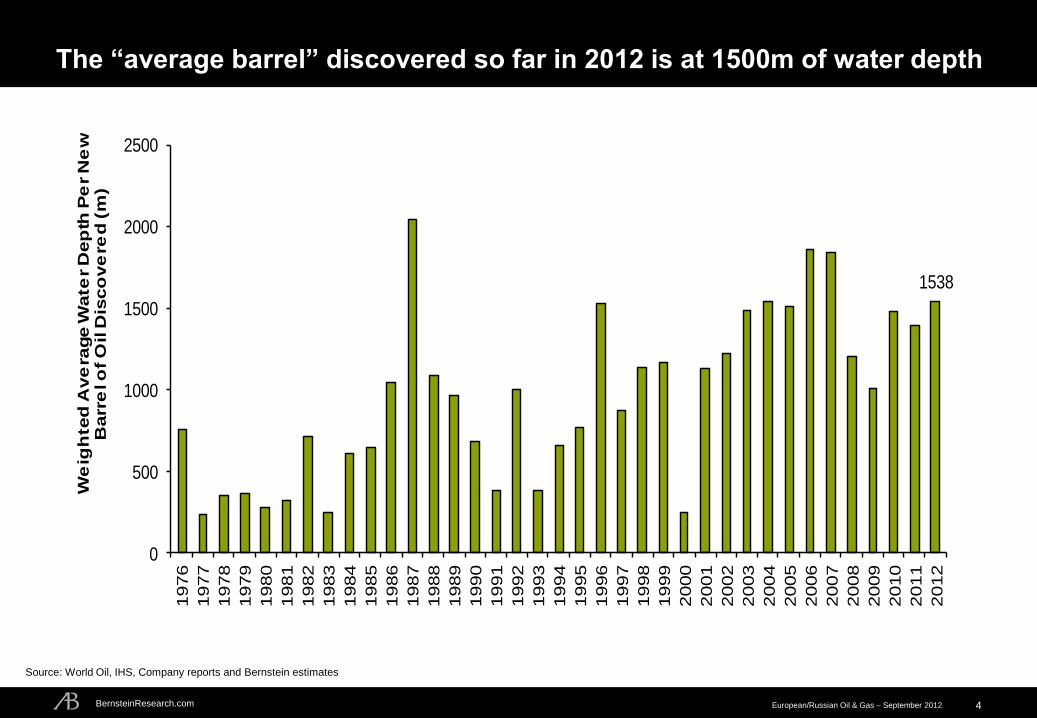
The “average barrel” discovered so far in 2012 is at 1500m of water depth
4
1538
0
500
1000
1500
2000
2500
1976
1977
1978
1979
1980
1981
1982
1983
1984
1985
1986
1987
1988
1989
1990
1991
1992
1993
1994
1995
1996
1997
1998
1999
2000
2001
2002
2003
2004
2005
2006
2007
2008
2009
2010
2011
2012
We
igh
ted
Ave
rage W
ate
r D
ep
th P
er N
ew
B
arr
el o
f O
il D
isco
ve
red
(m
)
Source: World Oil, IHS, Company reports and Bernstein estimates
BernsteinResearch.com European/Russian Oil & Gas – September 2012
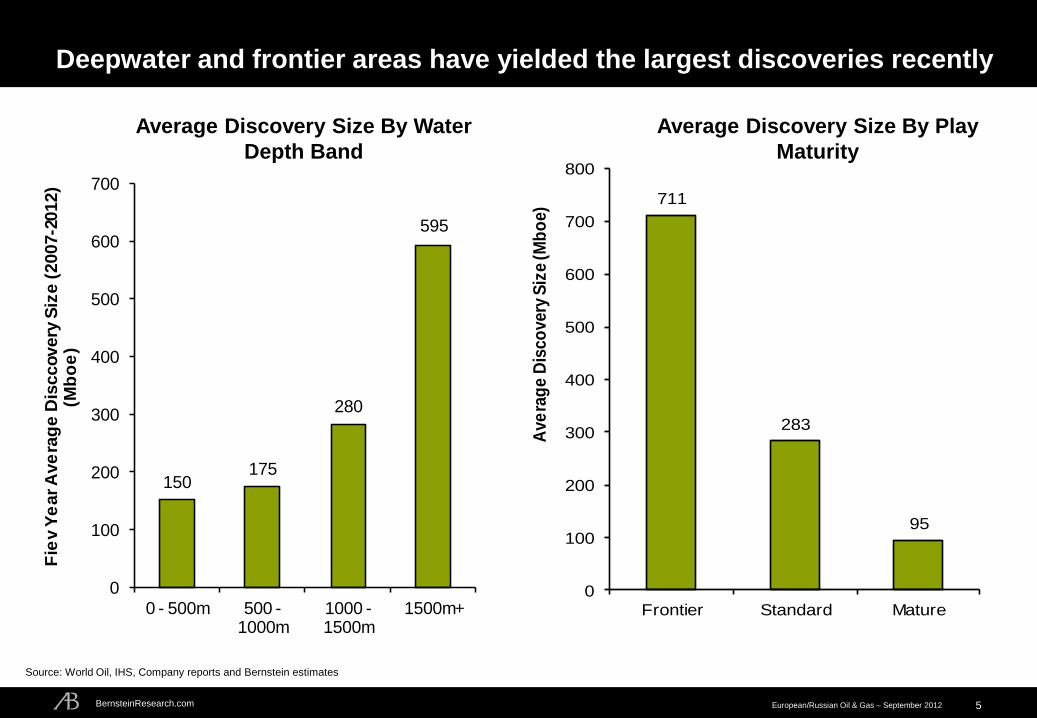
Deepwater and frontier areas have yielded the largest discoveries recently
5
150175
280
595
0
100
200
300
400
500
600
700
0 - 500m 500 -1000m
1000 -1500m
1500m+
Fie
v Y
ear A
ve
rag
e D
isccovery
Siz
e (2007-2
012)
(Mb
oe
)
711
283
95
0
100
200
300
400
500
600
700
800
Frontier Standard Mature
Ave
rag
e D
isco
very
Siz
e (M
bo
e)
Source: World Oil, IHS, Company reports and Bernstein estimates
Average Discovery Size By Water
Depth Band
Average Discovery Size By Play
Maturity
BernsteinResearch.com European/Russian Oil & Gas – September 2012 6
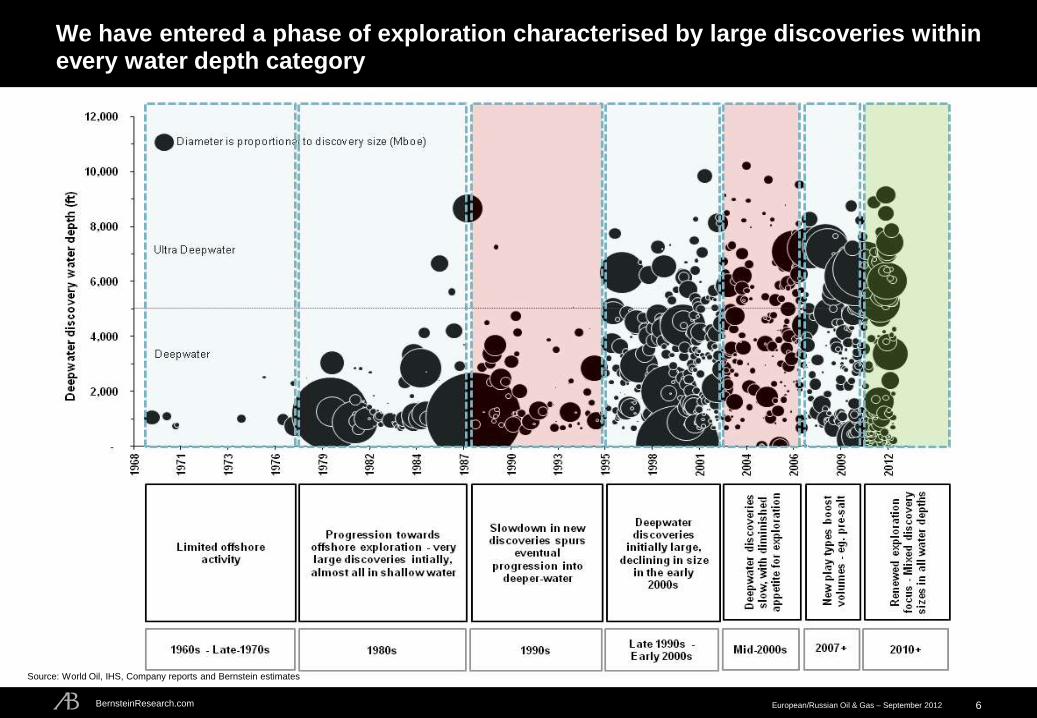
We have entered a phase of exploration characterised by large discoveries within every water depth category
Source: World Oil, IHS, Company reports and Bernstein estimates
BernsteinResearch.com European/Russian Oil & Gas – September 2012
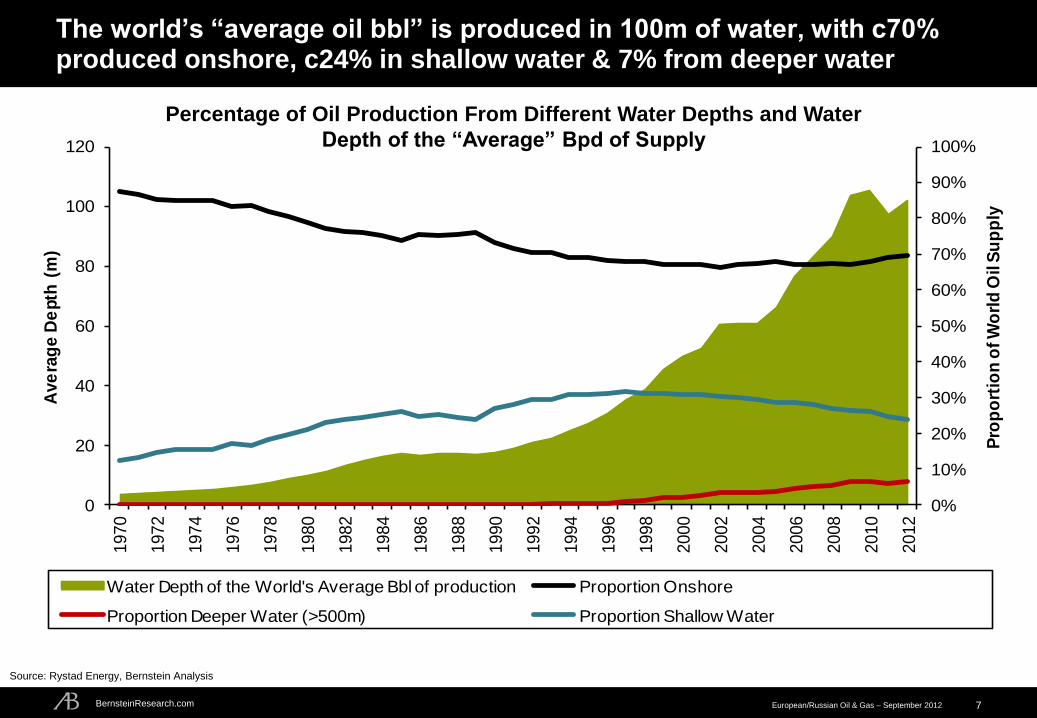
The world’s “average oil bbl” is produced in 100m of water, with c70% produced onshore, c24% in shallow water & 7% from deeper water
7
Source: Rystad Energy, Bernstein Analysis
0%
10%
20%
30%
40%
50%
60%
70%
80%
90%
100%
0
20
40
60
80
100
120
1970
1972
1974
1976
1978
1980
1982
1984
1986
1988
1990
1992
1994
1996
1998
2000
2002
2004
2006
2008
2010
2012
Pro
po
rtio
n o
f W
orl
d O
il S
up
ply
Ave
rag
e D
epth
(m
)
Water Depth of the World's Average Bbl of production Proportion Onshore
Proportion Deeper Water (>500m) Proportion Shallow Water
Percentage of Oil Production From Different Water Depths and Water
Depth of the “Average” Bpd of Supply
BernsteinResearch.com European/Russian Oil & Gas – September 2012 8
0%
10%
20%
30%
40%
50%
60%
70%
80%
90%
100%
0
10
20
30
40
50
60
70
1970
1971
1972
1973
1974
1975
1976
1977
1978
1979
1980
1981
1982
1983
1984
1985
1986
1987
1988
1989
1990
1991
1992
1993
1994
1995
1996
1997
1998
1999
2000
2001
2002
2003
2004
2005
2006
2007
2008
2009
2010
2011
2012
Pro
po
rtio
n o
f W
orl
d O
il S
up
ply
Avera
ge D
ep
th (
m)
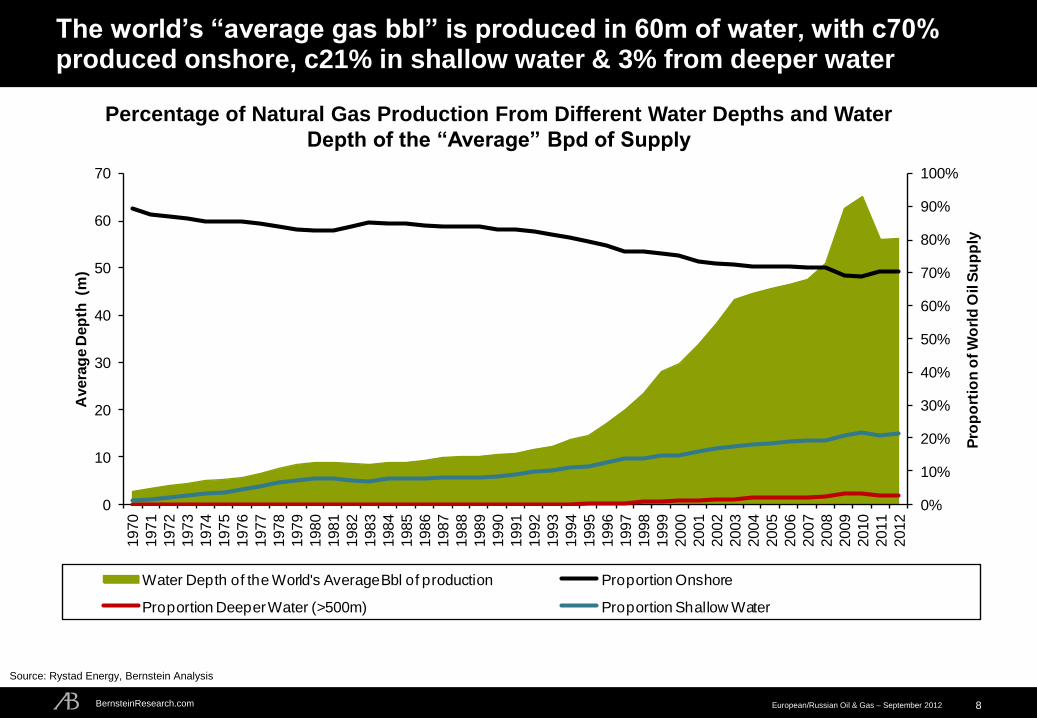
Water Depth of the World's Average Bbl of production Proportion Onshore
Proportion Deeper Water (>500m) Proportion Shallow Water
Source: Rystad Energy, Bernstein Analysis
Percentage of Natural Gas Production From Different Water Depths and Water
Depth of the “Average” Bpd of Supply
The world’s “average gas bbl” is produced in 60m of water, with c70% produced onshore, c21% in shallow water & 3% from deeper water
BernsteinResearch.com European/Russian Oil & Gas – September 2012
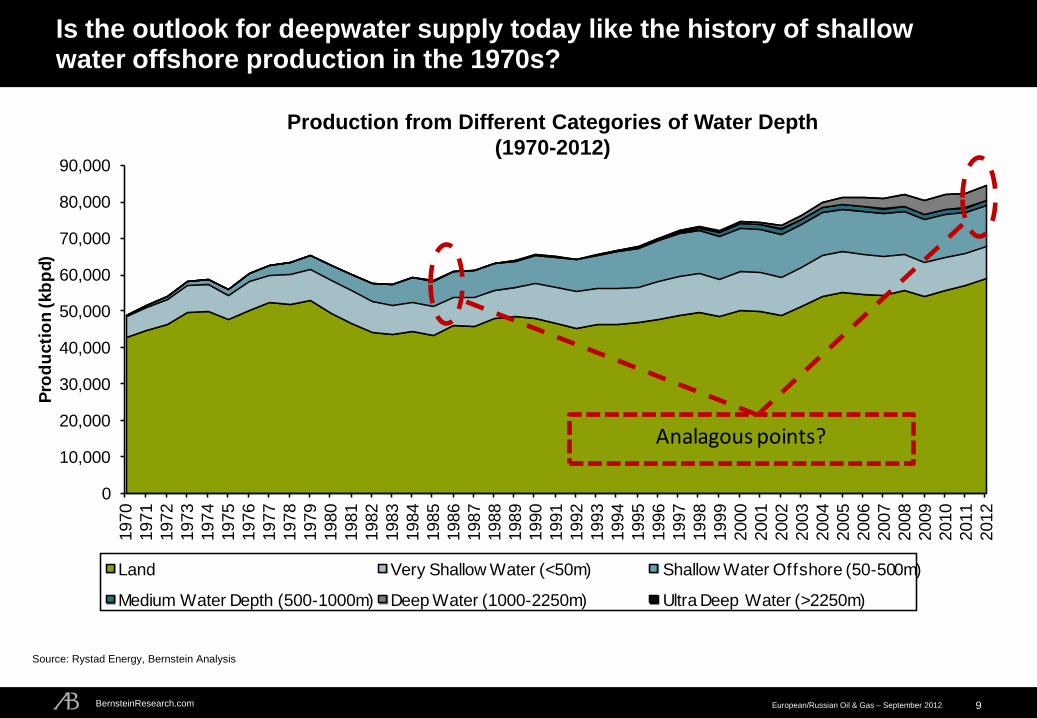
Is the outlook for deepwater supply today like the history of shallow water offshore production in the 1970s?
9
Source: Rystad Energy, Bernstein Analysis
0
10,000
20,000
30,000
40,000
50,000
60,000
70,000
80,000
90,000
1970
1971
1972
1973
1974
1975
1976
1977
1978
1979
1980
1981
1982
1983
1984
1985
1986
1987
1988
1989
1990
1991
1992
1993
1994
1995
1996
1997
1998
1999
2000
2001
2002
2003
2004
2005
2006
2007
2008
2009
2010
2011
2012
Pro
du
cti
on
(kb
pd)
Land Very Shallow Water (<50m) Shallow Water Offshore (50-500m)
Medium Water Depth (500-1000m) Deep Water (1000-2250m) Ultra Deep Water (>2250m)
Analagous points?
Production from Different Categories of Water Depth
(1970-2012)
BernsteinResearch.com European/Russian Oil & Gas – September 2012
0
500
1000
1500
2000
2500
3000
3500
4000
1970
1971
1972
1973
1974
1975
1976
1977
1978
1979
1980
1981
1982
1983
1984
1985
1986
1987
Oil P
rod
ucti
on
Fro
m F
ield
s a
bo
ve 1
00m
wate
r d
ep
th (kb
pd
)
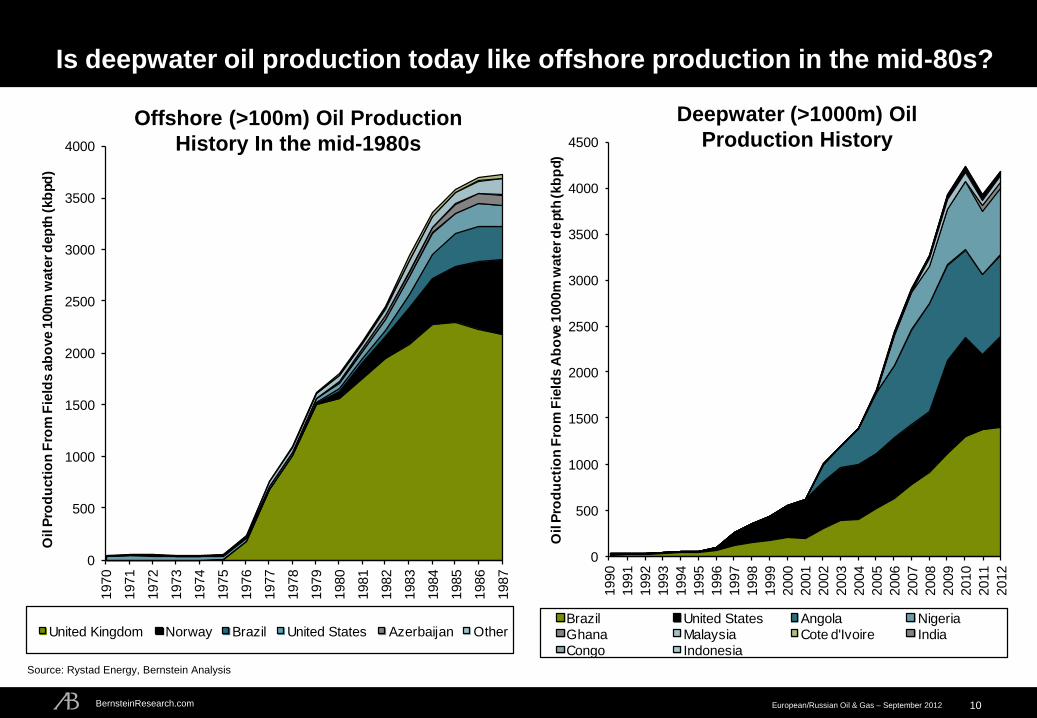
United Kingdom Norway Brazil United States Azerbaijan Other
Is deepwater oil production today like offshore production in the mid-80s?
10
0
500
1000
1500
2000
2500
3000
3500
4000
4500
1990
1991
1992
1993
1994
1995
1996
1997
1998
1999
2000
2001
2002
2003
2004
2005
2006
2007
2008
2009
2010
2011
2012
Oil P
rod
ucti
on
Fro
m F
ield
s A
bo
ve 1
000m
wate
r d
epth
(kb
pd)
Brazil United States Angola NigeriaGhana Malaysia Cote d'Ivoire IndiaCongo Indonesia
Source: Rystad Energy, Bernstein Analysis
Deepwater (>1000m) Oil
Production History Offshore (>100m) Oil Production
History In the mid-1980s
BernsteinResearch.com European/Russian Oil & Gas – September 2012
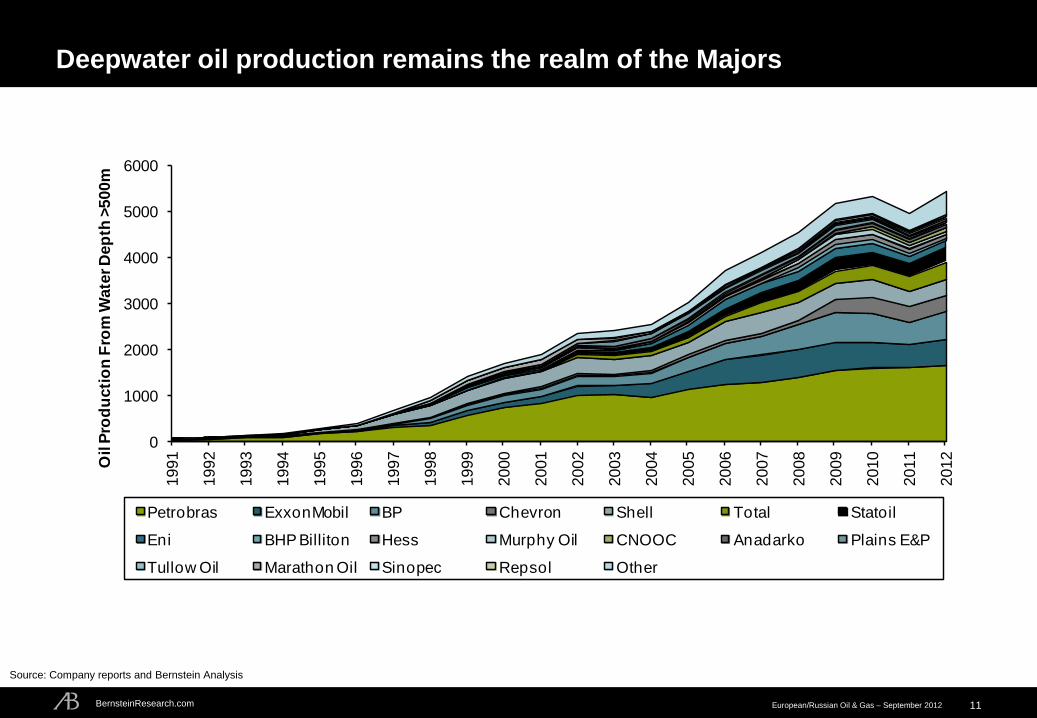
Deepwater oil production remains the realm of the Majors
11
0
1000
2000
3000
4000
5000
60001991
1992
1993
1994
1995
1996
1997
1998
1999
2000
2001
2002
2003
2004
2005
2006
2007
2008
2009
2010
2011
2012
Oil P
rod
ucti
on
Fro
m W
ate
r D
ep
th >
500m
Petrobras ExxonMobil BP Chevron Shell Total Statoil
Eni BHP Billiton Hess Murphy Oil CNOOC Anadarko Plains E&P
Tullow Oil Marathon Oil Sinopec Repsol Other
Source: Company reports and Bernstein Analysis
BernsteinResearch.com European/Russian Oil & Gas – September 2012
0%
5%
10%
15%
20%
25%
30%
1992
1993
1994
1995
1996
1997
1998
1999
2000
2001
2002
2003
2004
2005
2006
2007
2008
2009
2010
2011
2012E
Exp
lora
tio
n S
pend
/ O
rganic
Up
str
eam
Cap
ex
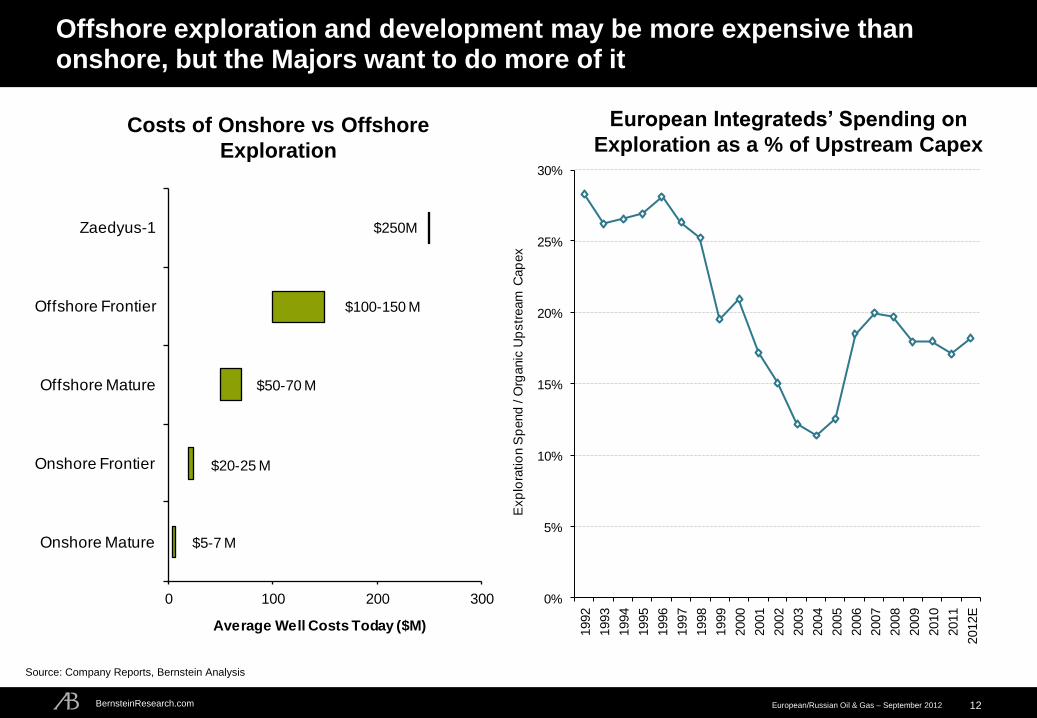
Offshore exploration and development may be more expensive than onshore, but the Majors want to do more of it
12
$5-7 M
$20-25 M
$50-70 M
$100-150 M
$250M
0 100 200 300
Onshore Mature
Onshore Frontier
Offshore Mature
Offshore Frontier
Zaedyus-1
Average Well Costs Today ($M)
Costs of Onshore vs Offshore
Exploration
European Integrateds’ Spending on
Exploration as a % of Upstream Capex
Source: Company Reports, Bernstein Analysis
BernsteinResearch.com European/Russian Oil & Gas – September 2012
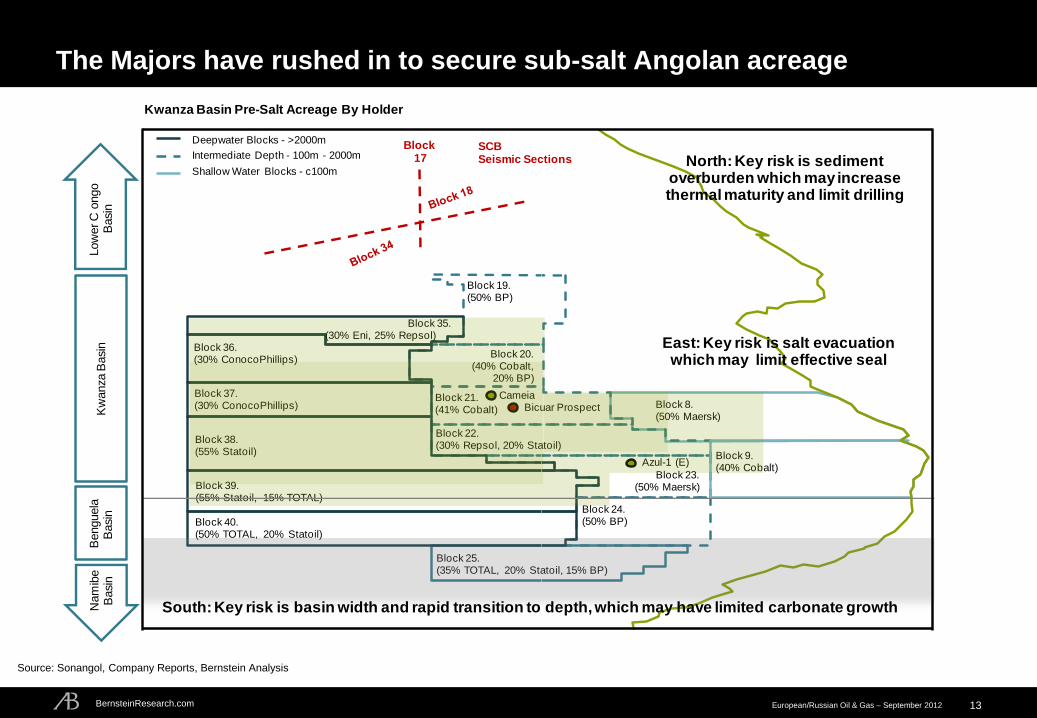
The Majors have rushed in to secure sub-salt Angolan acreage
13
Kwanza Basin Pre-Salt Acreage By Holder
Block 21. (41% Cobalt)
Block 23. (50% Maersk)
Block 22. (30% Repsol, 20% Statoil)
Block 8. (50% Maersk)
Block 9. (40% Cobalt)
CameiaBicuar Prospect
Azul-1 (E)
Block 24. (50% BP)
Block 25. (35% TOTAL, 20% Statoil, 15% BP)
Block 19. (50% BP)
Block 20. (40% Cobalt,
20% BP)
Block 36. (30% ConocoPhillips)
Block 35. (30% Eni, 25% Repsol) .
Block 37. (30% ConocoPhillips)
Block 38. (55% Statoil)
Block 39. (55% Statoil, 15% TOTAL)
Block 40. (50% TOTAL, 20% Statoil)
Deepwater Blocks - >2000m
Intermediate Depth - 100m - 2000m
Shallow Water Blocks - c100m
Kw
anza
Basi
nB
enguela
Basi
nN
am
ibe
Basi
nLow
er C
ongo
Basi
n
SCBSeismic Sections
Block17 North: Key risk is sediment
overburden which may increase thermal maturity and limit drilling
South: Key risk is basin width and rapid transition to depth, which may have limited carbonate growth
East: Key risk is salt evacuation which may limit effective seal
Source: Sonangol, Company Reports, Bernstein Analysis
BernsteinResearch.com European/Russian Oil & Gas – September 2012
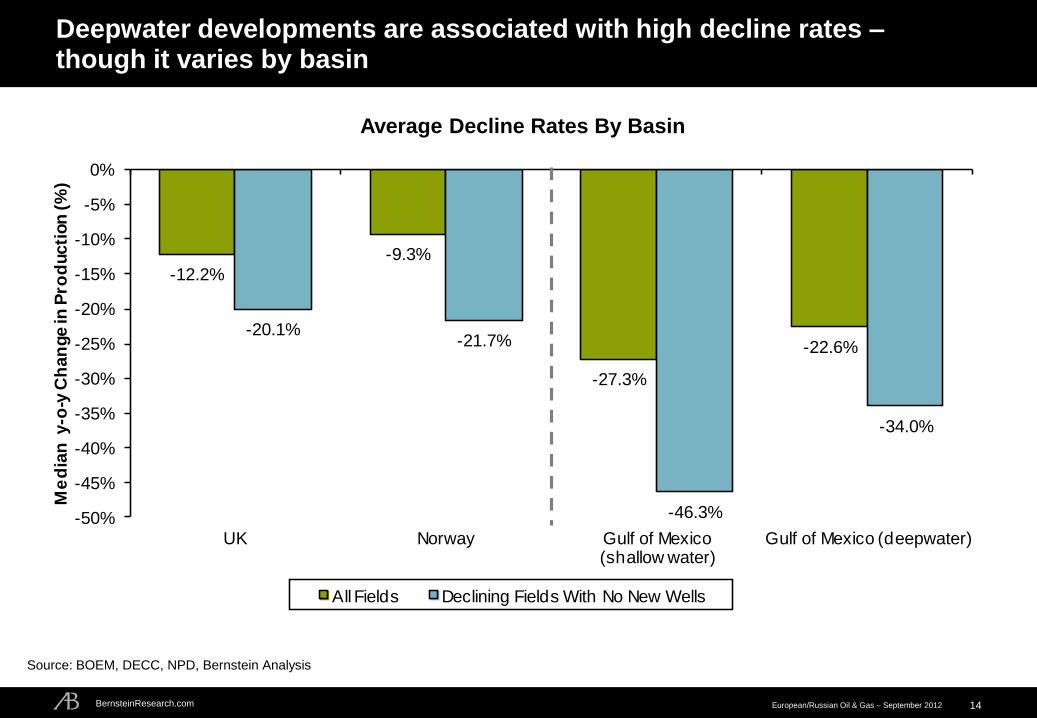
Deepwater developments are associated with high decline rates – though it varies by basin
14
-12.2%-9.3%
-27.3%
-22.6%-20.1%
-21.7%
-46.3%
-34.0%
-50%
-45%
-40%
-35%
-30%
-25%
-20%
-15%
-10%
-5%
0%
UK Norway Gulf of Mexico(shallow water)
Gulf of Mexico (deepwater)
Me
dia
n y
-o-y
Ch
an
ge in
Pro
ducti
on
(%
)
All Fields Declining Fields With No New Wells
Source: BOEM, DECC, NPD, Bernstein Analysis
Average Decline Rates By Basin
BernsteinResearch.com European/Russian Oil & Gas – September 2012
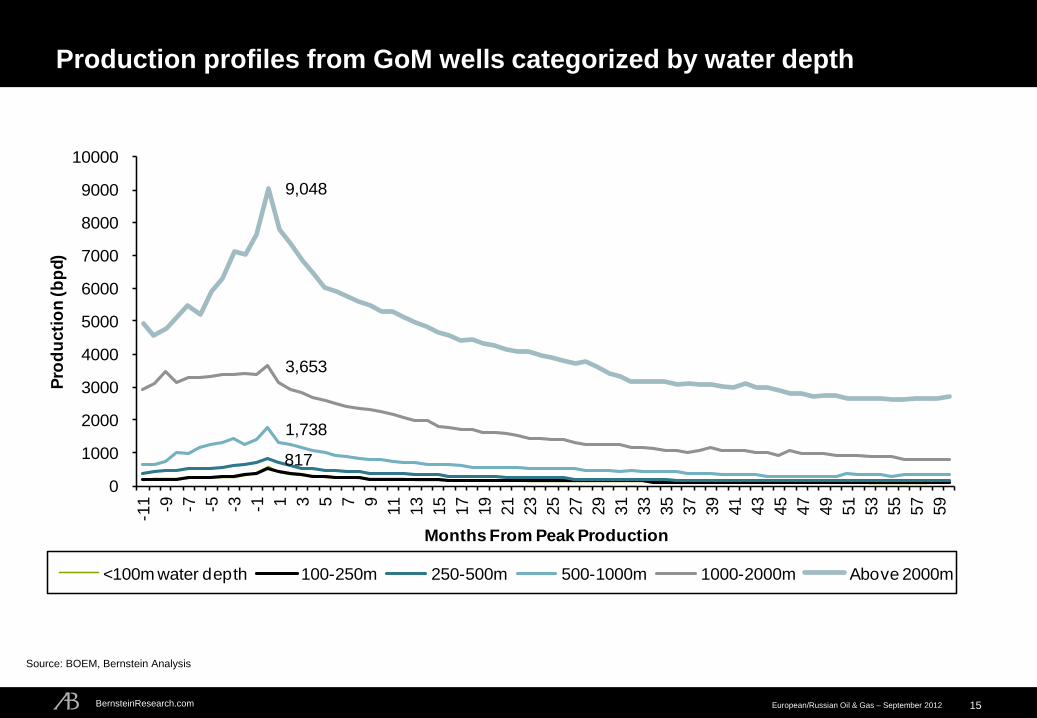
Production profiles from GoM wells categorized by water depth
15
817
1,738
3,653
9,048
0
1000
2000
3000
4000
5000
6000
7000
8000
9000
10000 -1
1 -9 -7 -5 -3 -1 1 3 5 7 9
11
13
15
17
19
21
23
25
27
29
31
33
35
37
39
41
43
45
47
49
51
53
55
57
59
Pro
du
cti
on
(b
pd)
Months From Peak Production
<100m water depth 100-250m 250-500m 500-1000m 1000-2000m Above 2000m
Source: BOEM, Bernstein Analysis
BernsteinResearch.com European/Russian Oil & Gas – September 2012
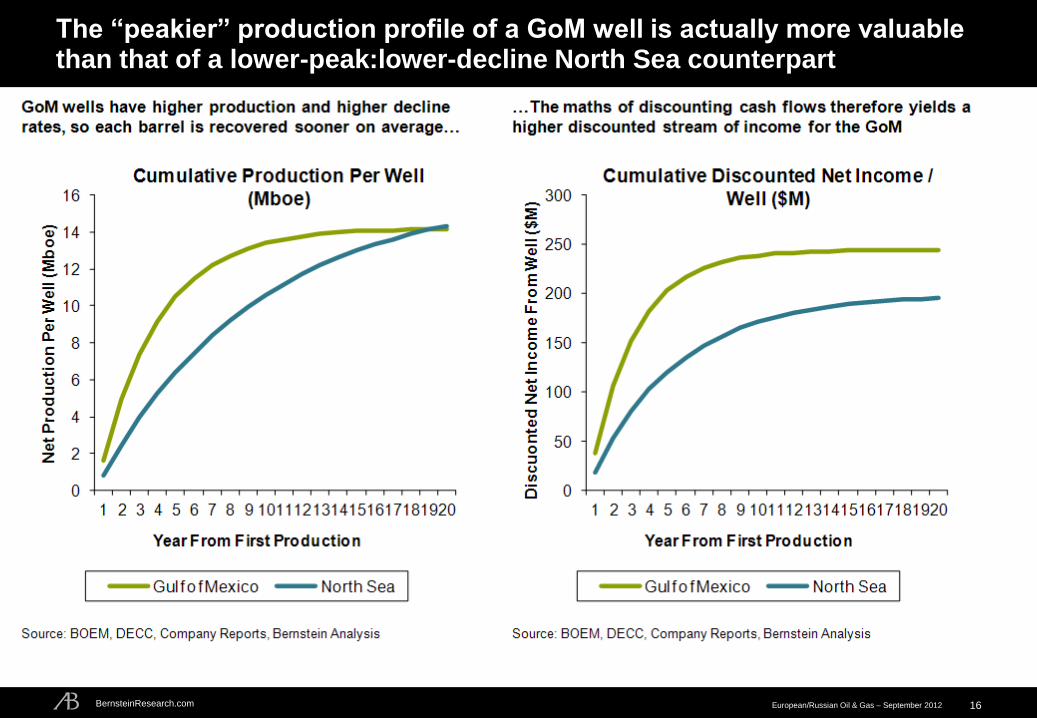
The “peakier” production profile of a GoM well is actually more valuable than that of a lower-peak:lower-decline North Sea counterpart
16
BernsteinResearch.com European/Russian Oil & Gas – September 2012
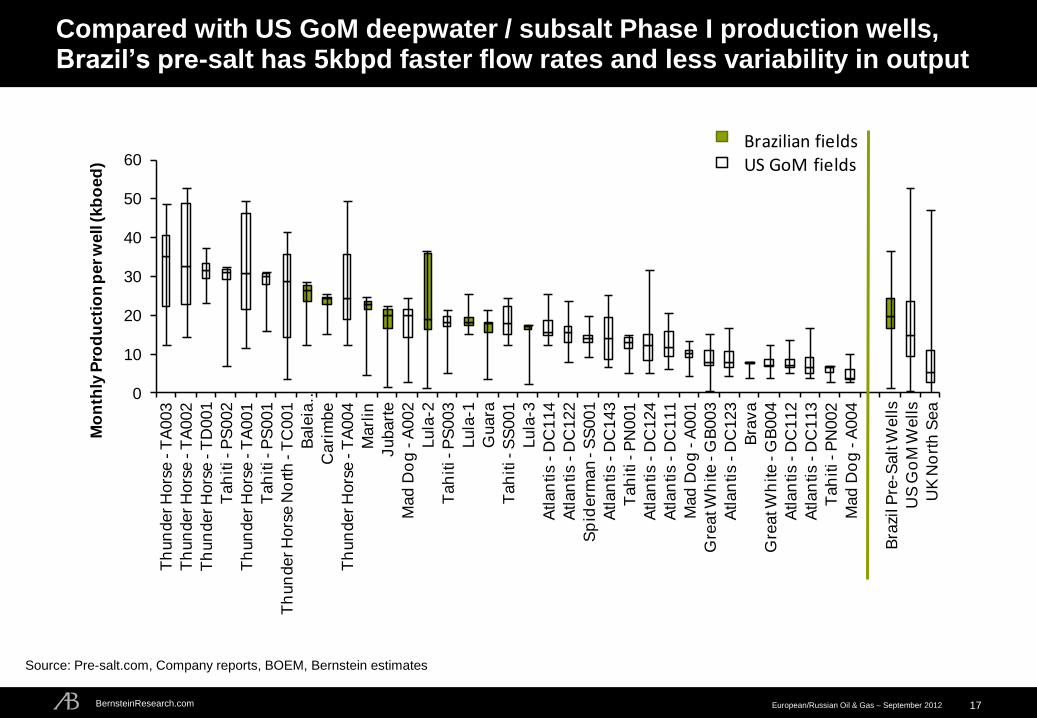
Compared with US GoM deepwater / subsalt Phase I production wells, Brazil’s pre-salt has 5kbpd faster flow rates and less variability in output
17
Source: Pre-salt.com, Company reports, BOEM, Bernstein estimates
0
10
20
30
40
50
60T
hun
der H
ors
e -
TA
003
Th
un
der H
ors
e -
TA
002
Th
un
der H
ors
e -
TD
001
Tah
iti -
PS
002
Th
un
der H
ors
e -
TA
001
Tah
iti -
PS
001
Th
un
der H
ors
e N
orth -
TC
001
Bale
ia…
Cari
mbe
Th
un
der H
ors
e -
TA
004
Marl
in
Jubart
e
Mad
Do
g -
A002
Lula
-2
Tah
iti -
PS
003
Lula
-1
Guara
Tah
iti -
SS
001
Lula
-3
Atlan
tis -
DC
114
Atlan
tis -
DC
122
Sp
iderm
an -
SS
001
Atlan
tis -
DC
143
Tah
iti -
PN
001
Atlan
tis -
DC
124
Atlan
tis -
DC
111
Mad
Do
g -
A001
Gre
at W
hite -
GB
003
Atlan
tis -
DC
123
Bra
va
Gre
at W
hite -
GB
004
Atlan
tis -
DC
112
Atlan
tis -
DC
113
Tah
iti -
PN
002
Mad
Do
g -
A004
Bra
zil P
re-S
alt W
ells
US
Go
M W
ells
UK
No
rth
Sea
Mo
nth
ly P
rod
ucti
on p
er w
ell (kb
oed
)
Brazilian fieldsUS GoM fields
BernsteinResearch.com European/Russian Oil & Gas – September 2012
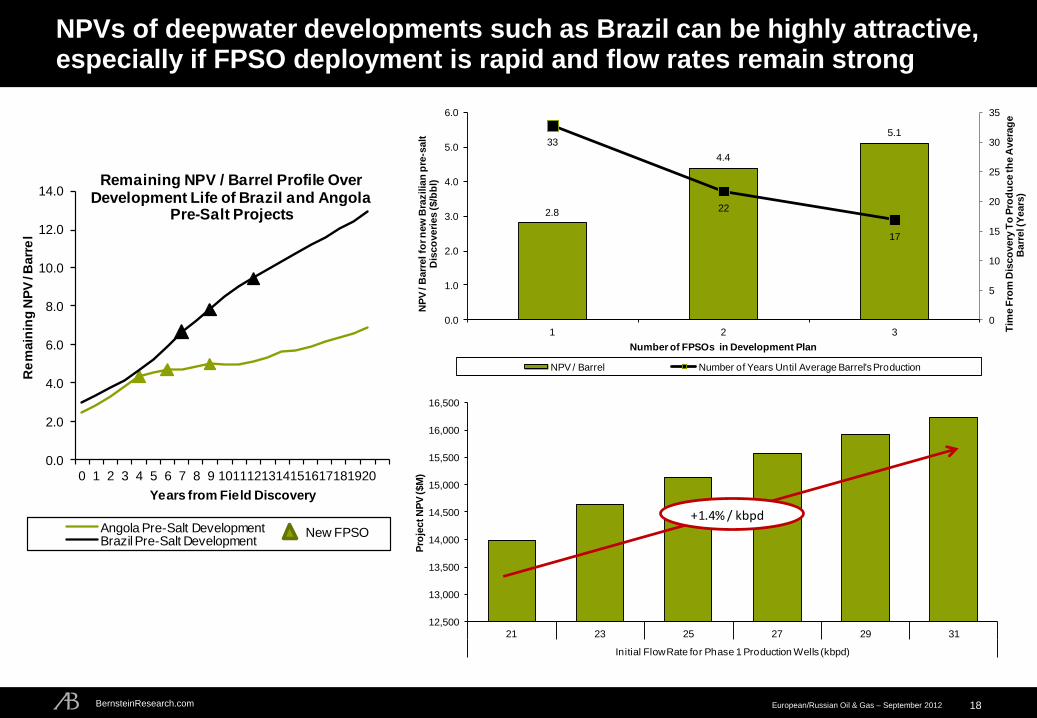
NPVs of deepwater developments such as Brazil can be highly attractive, especially if FPSO deployment is rapid and flow rates remain strong
18
0.0
2.0
4.0
6.0
8.0
10.0
12.0
14.0
0 1 2 3 4 5 6 7 8 9 1011121314151617181920
Re
main
ing
NP
V /
Barr
el
Years from Field Discovery
Remaining NPV / Barrel Profile Over Development Life of Brazil and Angola
Pre-Salt Projects
Angola Pre-Salt DevelopmentBrazil Pre-Salt Development
New FPSO
12,500
13,000
13,500
14,000
14,500
15,000
15,500
16,000
16,500
21 23 25 27 29 31
Initial Flow Rate for Phase 1 Production Wells (kbpd)
Pro
ject N
PV
($M
)
+1.4% / kbpd
2.8
4.4
5.133
22
17
0
5
10
15
20
25
30
35
0.0
1.0
2.0
3.0
4.0
5.0
6.0
1 2 3 Tim
e F
rom
Dis
co
very
To
Pro
du
ce th
e A
vera
ge
Barr
el (
Years
)
NP
V /
Barr
el fo
r n
ew
Bra
zilia
n p
re-s
alt
D
isco
veri
es ($/b
bl)
Number of FPSOs in Development Plan
NPV / Barrel Number of Years Until Average Barrel's Production
BernsteinResearch.com European/Russian Oil & Gas – September 2012 19
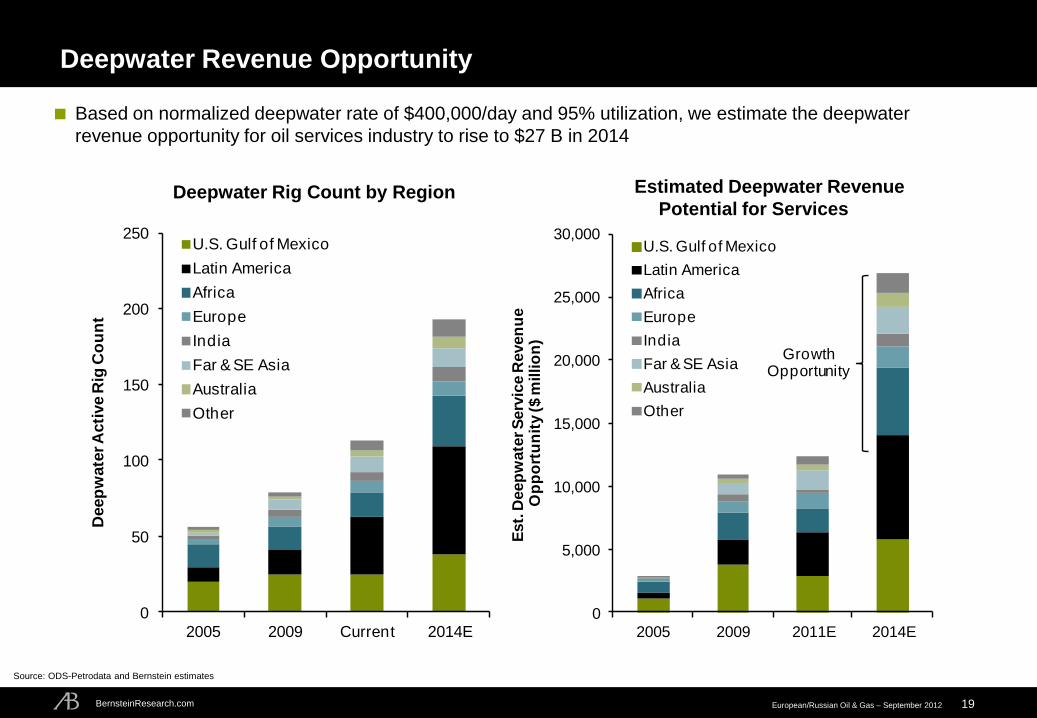
Deepwater Revenue Opportunity
Source: ODS-Petrodata and Bernstein estimates
Based on normalized deepwater rate of $400,000/day and 95% utilization, we estimate the deepwater
revenue opportunity for oil services industry to rise to $27 B in 2014
0
50
100
150
200
250
2005 2009 Current 2014E
Deep
wate
r A
cti
ve R
ig C
ou
nt
U.S. Gulf of Mexico
Latin America
Africa
Europe
India
Far & SE Asia
Australia
Other
0
5,000
10,000
15,000
20,000
25,000
30,000
2005 2009 2011E 2014E
Est.
Deep
wate
r S
erv
ice R
even
ue
Op
po
rtu
nit
y ($ m
illio
n)
U.S. Gulf of Mexico
Latin America
Africa
Europe
India
Far & SE Asia
Australia
Other
Growth Opportunity
Deepwater Rig Count by Region Estimated Deepwater Revenue
Potential for Services
BernsteinResearch.com European/Russian Oil & Gas – September 2012
0
20
40
60
80
100
120
0 3,000 6,000 9,000 12,000 15,000 18,000 21,000 24,000 27,000
Marg
inal C
ost ($
/bb
l)
Oil Production (mbd)
ECA,RIL,
BG
INPEX
WPL,PTTEP
XO
M
CE
O
STL
RD
SA
OSH
CV
X
TO
T
EN
I
DVN
PB
R CO
P
BP
TLW
PT
R ON
GC
NFX,NBL
DNR
SN
P
APC,ERF
PE
ME
X
NXY
OXY
APA
CNQ
PTR
PB
R
XO
M
TO
T
CV
X
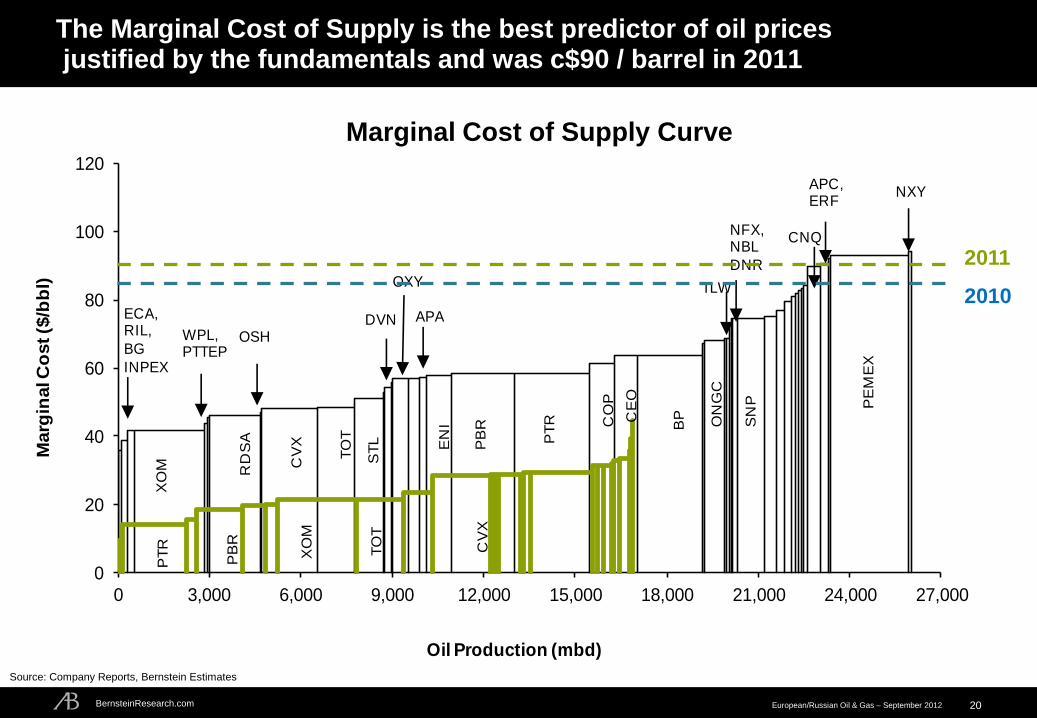
The Marginal Cost of Supply is the best predictor of oil prices justified by the fundamentals and was c$90 / barrel in 2011
20
Source: Company Reports, Bernstein Estimates
Marginal Cost of Supply Curve
2011
2010
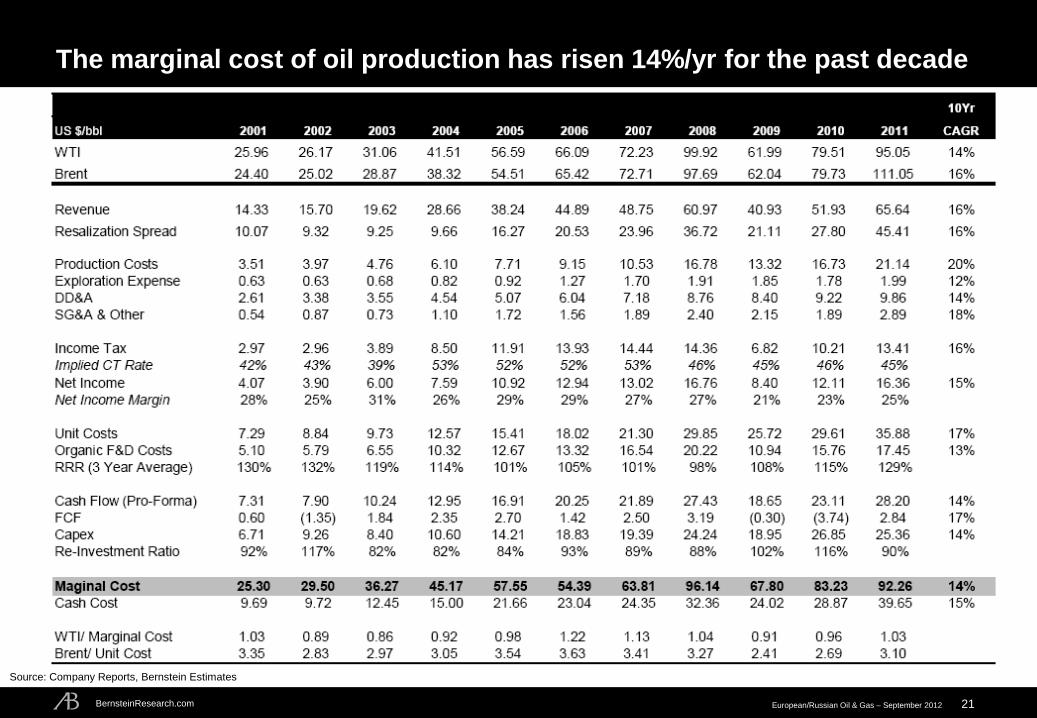
BernsteinResearch.com European/Russian Oil & Gas – September 2012 21
The marginal cost of oil production has risen 14%/yr for the past decade
Source: Company Reports, Bernstein Estimates
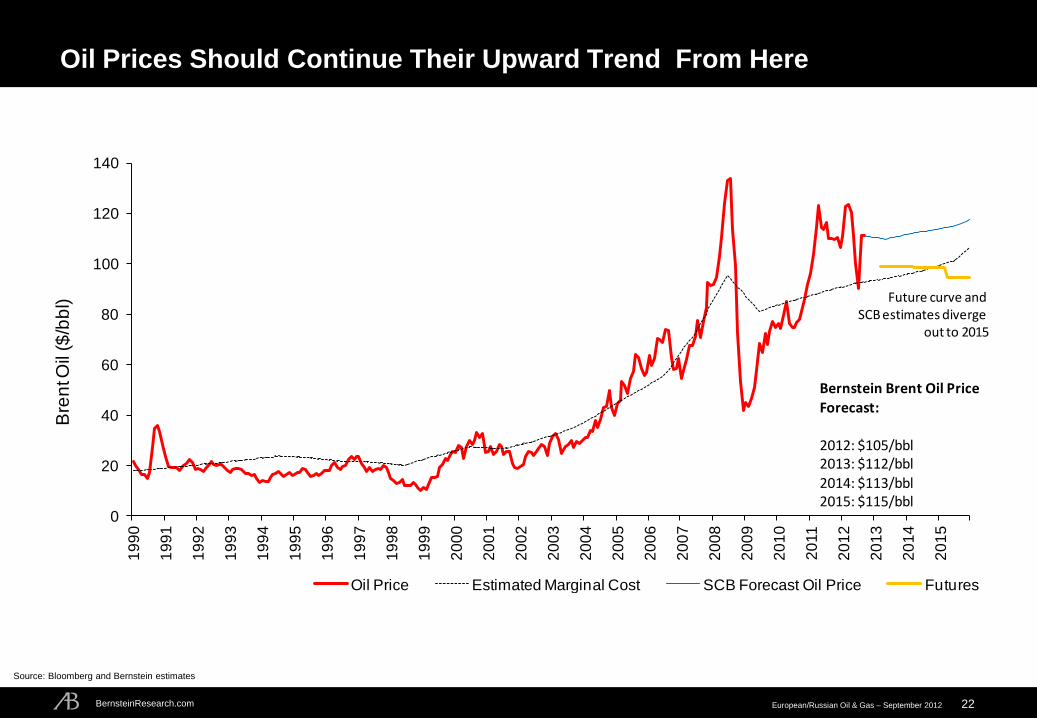
BernsteinResearch.com European/Russian Oil & Gas – September 2012 22
Oil Prices Should Continue Their Upward Trend From Here
Source: Bloomberg and Bernstein estimates
0
20
40
60
80
100
120
140
19
90
19
91
19
92
19
93
19
94
19
95
19
96
19
97
19
98
19
99
20
00
20
01
20
02
20
03
20
04
20
05
20
06
20
07
20
08
20
09
20
10
20
11
20
12
20
13
20
14
20
15
Bre
nt O
il ($
/bb
l)
Oil Price Estimated Marginal Cost SCB Forecast Oil Price Futures
Bernstein Brent Oil Price Forecast:
2012: $105/bbl2013: $112/bbl2014: $113/bbl2015: $115/bbl
Future curve and SCB estimates diverge
out to 2015
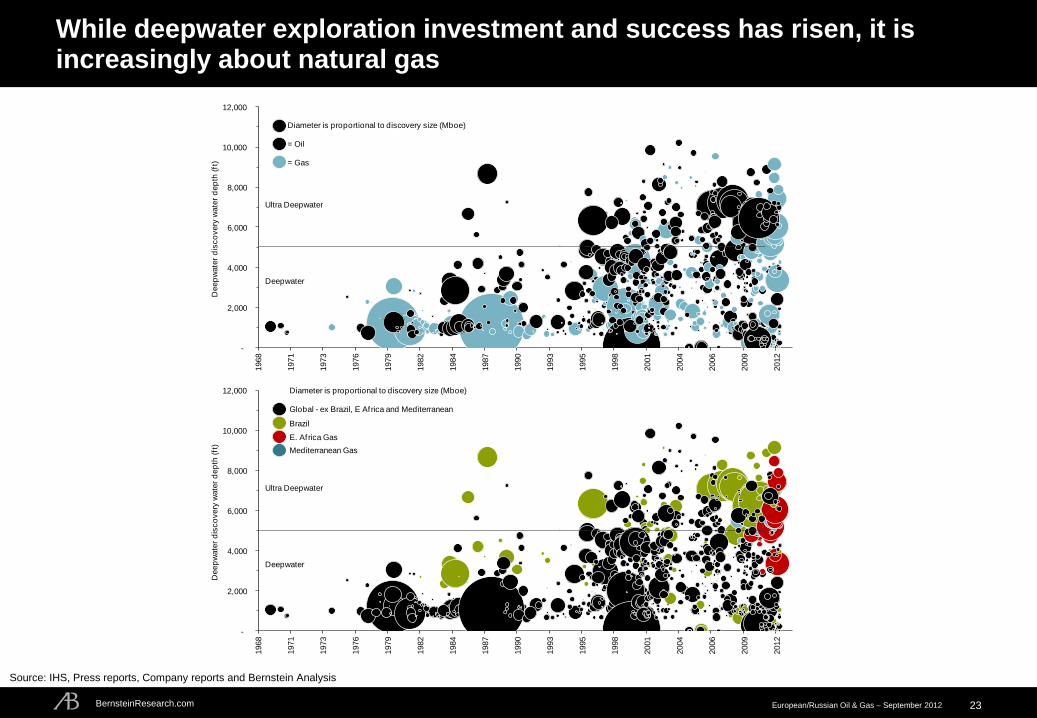
BernsteinResearch.com European/Russian Oil & Gas – September 2012
While deepwater exploration investment and success has risen, it is increasingly about natural gas
23
-
2,000
4,000
6,000
8,000
10,000
12,000
1968
1971
1973
1976
1979
1982
1984
1987
1990
1993
1995
1998
2001
2004
2006
2009
2012
Deep
wate
r d
isco
very
wate
r d
ep
th (
ft)
Diameter is proportional to discovery size (Mboe)
= Oil
= Gas
Ultra Deepwater
Deepwater
-
2,000
4,000
6,000
8,000
10,000
12,000
1968
1971
1973
1976
1979
1982
1984
1987
1990
1993
1995
1998
2001
2004
2006
2009
2012
Deep
wate
r d
isco
very
wate
r d
ep
th (
ft)
Diameter is proportional to discovery size (Mboe)
Global - ex Brazil, E Africa and Mediterranean
Brazil
E. Africa Gas
Mediterranean Gas
Ultra Deepwater
Deepwater
Source: IHS, Press reports, Company reports and Bernstein Analysis
BernsteinResearch.com European/Russian Oil & Gas – September 2012 24
1
3
5
7
9
11
13
15
17M
ar-
05
Jun
-05
Sep
-05
Dec-0
5
Mar-
06
Jun
-06
Sep
-06
Dec-0
6
Mar-
07
Jun
-07
Sep
-07
Dec-0
7
Mar-
08
Jun
-08
Sep
-08
Dec-0
8
Mar-
09
Jun
-09
Sep
-09
Dec-0
9
Mar-
10
Jun
-10
Sep
-10
Dec-1
0
Mar-
11
Jun
-11
Sep
-11
Dec-1
1
Mar-
12
Jun
-12
Natu
ral
gas p
rice ($/m
cf)
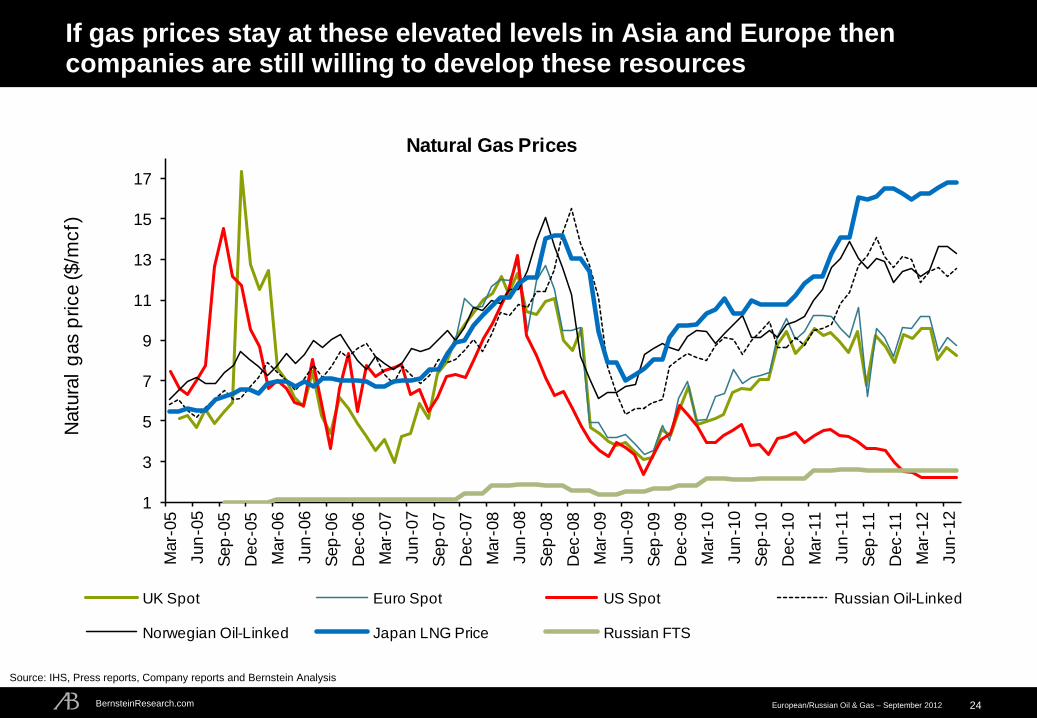
Natural Gas Prices
UK Spot Euro Spot US Spot Russian Oil-Linked
Norwegian Oil-Linked Japan LNG Price Russian FTS
If gas prices stay at these elevated levels in Asia and Europe then companies are still willing to develop these resources
Source: IHS, Press reports, Company reports and Bernstein Analysis
BernsteinResearch.com European/Russian Oil & Gas – September 2012
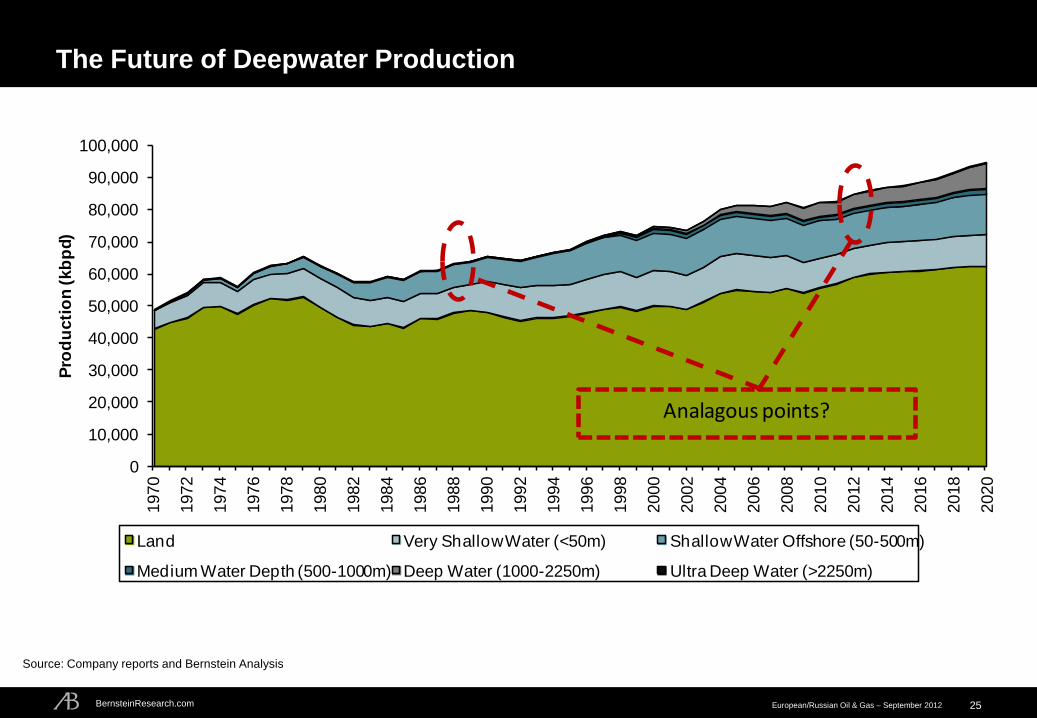
The Future of Deepwater Production
25
0
10,000
20,000
30,000
40,000
50,000
60,000
70,000
80,000
90,000
100,0001970
1972
1974
1976
1978
1980
1982
1984
1986
1988
1990
1992
1994
1996
1998
2000
2002
2004
2006
2008
2010
2012
2014
2016
2018
2020
Pro
du
cti
on
(kb
pd)
Land Very Shallow Water (<50m) Shallow Water Offshore (50-500m)
Medium Water Depth (500-1000m) Deep Water (1000-2250m) Ultra Deep Water (>2250m)
Analagous points?
Source: Company reports and Bernstein Analysis
BernsteinResearch.com European/Russian Oil & Gas – September 2012 26
Disclosure Appendix
BernsteinResearch.com European/Russian Oil & Gas – September 2012 27
Disclosure Appendix
SRO REQUIRED DISCLOSURES
References to "Bernstein" relate to Sanford C. Bernstein & Co., LLC, Sanford C. Bernstein Limited, and Sanford C. Bernstein, a unit of AllianceBernstein Hong Kong Limited, collectively.
Bernstein analysts are compensated based on aggregate contributions to the research franchise as measured by account penetration, productivity and proactivity of investment ideas. No analysts are
compensated based on performance in, or contributions to, generating investment banking revenues.
Bernstein rates stocks based on forecasts of relative performance for the next 6-12 months versus the S&P 500 for stocks listed on the U.S. and Canadian exchanges, versus the MSCI Pan Europe Index for
stocks listed on the European exchanges (except for Russian companies), versus the MSCI Emerging Markets Index for Russian companies and stocks listed on emerging markets exchanges outside of
the Asia Pacific region, and versus the MSCI Asia Pacific ex-Japan Index for stocks listed on the Asian (ex-Japan) exchanges - unless otherwise specified. We have three categories of ratings:
Outperform: Stock will outpace the market index by more than 15 pp in the year ahead.
Market-Perform: Stock will perform in line with the market index to within +/-15 pp in the year ahead.
Underperform: Stock will trail the performance of the market index by more than 15 pp in the year ahead.
Not Rated: The stock Rating, Target Price and estimates (if any) have been suspended temporarily.
As of 02/03/2011, Bernstein's ratings were distributed as follows: Outperform - 42.9% (1.6% banking clients) ; Market-Perform - 49.4% (1.4% banking clients); Underperform - 7.7% (0.0% banking clients); Not
Rated - 0.0% (0.0% banking clients). The numbers in parentheses represent the percentage of companies in each category to whom Bernstein provided investment banking services within the last twelve
(12) months.
David Vos maintains a long position in Cadaogan Petroleum (CAD.LN)
Accounts over which Bernstein and/or their affiliates exercise investment discretion own more than 1% of the outstanding common stock of the following companies BG/.LN / BG Group PLC, PMO.LN / Premier
Oil PLC, TLW.LN / Tullow Oil PLC, BP / BP PLC, BP/.LN / BP PLC, FP.FP / TotalFinaElf SA, TOT / Total SA, RDS/A / Royal Dutch Shell PLC, RDS/B / Royal Dutch Shell PLC, RDSA.LN / Royal Dutch
Shell PLC, RDSA.NA / Royal Dutch Shell PLC, RDSB.LN / Royal Dutch Shell PLC, RDSB.NA / Royal Dutch Shell PLC.
The following companies are or during the past twelve (12) months were clients of Bernstein, which provided non-investment banking-securities related services and received compensation for such services
BG/.LN / BG Group PLC, BP / BP PLC, BP/.LN / BP PLC, FP.FP / TotalFinaElf SA, TOT / Total SA.
In the next three (3) months, Bernstein or an affiliate expects to receive or intends to seek compensation for investment banking services from OGZD.LI / Gazprom OAO, LKOD.LI / LUKOIL, ROSN.LI / Rosneft
Oil Co, NVTK.LI / NovaTek OAO, SGGD.LI / Surgutneftegaz, BG/.LN / BG Group PLC, CNE.LN / Cairn Energy PLC, GALP.PL / Galp Energia SGPS SA, PMO.LN / Premier Oil PLC, TLW.LN / Tullow Oil
PLC, BP / BP PLC, BP/.LN / BP PLC, E / ENI SpA, EAD.FP / European Aeronautic Defense, ENI.IM / ENI SpA, FP.FP / TotalFinaElf SA, TOT / Total SA, RDS/A / Royal Dutch Shell PLC, RDS/B / Royal
Dutch Shell PLC, RDSA.LN / Royal Dutch Shell PLC, RDSA.NA / Royal Dutch Shell PLC, RDSB.LN / Royal Dutch Shell PLC, RDSB.NA / Royal Dutch Shell PLC.
This research publication covers six or more companies. For price chart disclosures, please visit www.bernsteinresearch.com, you can also write to either: Sanford C. Bernstein & Co. LLC, Director of
Compliance, 1345 Avenue of the Americas, New York, N.Y. 10105 or Sanford C. Bernstein Limited, Director of Compliance, Devonshire House, One Mayfair Place, London W1J 8SB, United Kingdom; or
Sanford C. Bernstein, a unit of AllianceBernstein Hong Kong Limited, Director of Compliance, Suite 3401, 34th Floor, One IFC, One Harbour View Street, Central, Hong Kong.
BernsteinResearch.com European/Russian Oil & Gas – September 2012
and wishing to effect securities transactions in any security discussed herein should do so only through Sanford C. Bernstein & Co., LLC.
To our readers in the United Kingdom: This publication has been issued or approved for issue in the United Kingdom by Sanford C. Bernstein Limited, authorised and regulated by the Financial Services
Authority and located at Devonshire House, 1 Mayfair Place, London W1J 8SB, +44 (0)20-7170-5000.
To our readers in member states of the EEA: This publication is being distributed in the EEA by Sanford C. Bernstein Limited, which is authorised and regulated in the United Kingdom by the Financial
Services Authority and holds a passport under the Investment Services Directive.
To our readers in Hong Kong: This publication is being issued in Hong Kong by Sanford C. Bernstein, a unit of AllianceBernstein Hong Kong Limited. AllianceBernstein Hong Kong Limited is regulated by the
Hong Kong Securities and Futures Commission.
To our readers in Australia: Sanford C. Bernstein & Co., LLC and Sanford C. Bernstein Limited are exempt from the requirement to hold an Australian financial services licence under the Corporations Act
2001 in respect of the provision of the following financial services to wholesale clients: providing financial product advice; dealing in a financial product; making a market for a financial product; and providing a
custodial or depository service.
Sanford C. Bernstein & Co., LLC, Sanford C. Bernstein Limited and AllianceBernstein Hong Kong Limited are regulated by, respectively, the Securities and Exchange Commission under U.S. laws, by the
Financial Services Authority under U.K. laws, and by the Hong Kong Securities and Futures Commission under Hong Kong laws, all of which differ from Australian laws.
One or more of the officers, directors, or employees of Sanford C. Bernstein & Co., LLC, Sanford C. Bernstein Limited, Sanford C. Bernstein, a unit of AllianceBernstein Hong Kong Limited, and/or their
affiliates may at any time hold, increase or decrease positions in securities of any company mentioned herein.
Bernstein or its affiliates may provide investment management or other services to the pension or profit sharing plans, or employees of any company mentioned herein, and may give advice to others as to
investments in such companies. These entities may effect transactions that are similar to or different from those recommended herein.
Bernstein Research Publications are disseminated to our customers through posting on the firm's password protected website, www.bernsteinresearch.com. Additionally, Bernstein Research Publications are
available through email, postal mail and commercial research portals. If you wish to alter your current distribution method, please contact your salesperson for details.
Bernstein and/or its affiliates do and seek to do business with companies covered in its research publications. As a result, investors should be aware that Bernstein and/or its affiliates may have a conflict of
interest that could affect the objectivity of this publication. Investors should consider this publication as only a single factor in making their investment decisions.
This publication has been published and distributed in accordance with Bernstein's policy for management of conflicts of interest in investment research, a copy of which is available from Sanford C. Bernstein
& Co., LLC, Director of Compliance, 1345 Avenue of the Americas, New York, N.Y. 10105, Sanford C. Bernstein Limited, Director of Compliance, Devonshire House, One Mayfair Place, LondonW1J 8SB,
United Kingdom, or Sanford C. Bernstein, a unit of AllianceBernstein Hong Kong Limited, Director of Compliance, Suite 3401, 34th Floor, One IFC, One Harbour View Street, Central, Hong Kong.
CERTIFICATIONS
I/(we), Oswald Clint, Ph.D., ACA, Senior Analyst(s)/Analyst(s), certify that all of the views expressed in this publication accurately reflect my/(our) personal views about any and all of the subject securities or
issuers and that no part of my/(our) compensation was, is, or will be, directly or indirectly, related to the specific recommendations or views in this publication.
Copyright 2011, Sanford C. Bernstein & Co., LLC, Sanford C. Bernstein Limited, and AllianceBernstein Hong Kong Limited, subsidiaries of AllianceBernstein L.P. ~ 1345 Avenue of the Americas ~ NY, NY 10105 ~ 212/756-4400. All rights reserved.
This publication is not directed to, or intended for distribution to or use by, any person or entity who is a citizen or resident of, or located in any locality, state, country or other jurisdiction where such distribution,
publication, availability or use would be contrary to law or regulation or which would subject Bernstein or any of their subsidiaries or affiliates to any registration or licensing requirement within such jurisdiction.
This publication is based upon public sources we believe to be reliable, but no representation is made by us that the publication is accurate or complete. We do not undertake to advise you of any change in
the reported information or in the opinions herein. This publication was prepared and issued by Bernstein for distribution to eligible counterparties or professional clients. This publication is not an offer to buy or
sell any security, and it does not constitute investment, legal or tax advice. The investments referred to herein may not be suitable for you. Investors must make their own investment decisions in consultation
with their professional advisors in light of their specific circumstances. The value of investments may fluctuate, and investments that are denominated in foreign currencies may fluctuate in value as a result of
exposure to exchange rate movements. Information about past performance of an investment is not necessarily a guide to, indicator of, or assurance of, future performance.