Bernoulli's Principle Demonstration (Lab Report)
22
ABSTRACT This experiment is about Bernoulli’s theorem. The objective of this experiment is to demonstrate the Bernoulli’s theorem. This experiment use the Bernoulli‘s Theorem Demonstration Apparatus. The apparatus contains of many part which are venture meter, pad of manometer tube, pump, and water tank equipped with pump water controller, water host and tubes. This experiment uses the venturi meter to measure the fluid flow through a pipe. The venturi tube has converging and diverging portion that function of increasing and decreasing the velocity of fluid and lower and higher the static pressure respectively. The experiment is conducted for three times with different flow rates starting the first after the level pressure of each manometer A, B, C, D, E and F is equal and stable. The flow rate was taken as the water indicator reached at 3 liters of water level. Level pressure of each manometer is measured as head loss. From the experiment conducted, we observed than when fluids moves from a region of higher pressure to lower pressure, the velocity of the fluid increases. There are a little bit differences on the speed of the flow and the pressure when we use Bernoulli’s equation and Continuity equation to calculate velocity. Thus, we concluded that the Bernoulli’s theorem is accepted. The experiment was a successfully and the objectives are obtained.
-
Upload
arey-ariena -
Category
Documents
-
view
4.781 -
download
208
description
to demonstrate Bernoulli's principle
Transcript of Bernoulli's Principle Demonstration (Lab Report)

ABSTRACT
This experiment is about Bernoulli’s theorem. The objective of this experiment is to
demonstrate the Bernoulli’s theorem. This experiment use the Bernoulli‘s Theorem
Demonstration Apparatus. The apparatus contains of many part which are venture meter, pad
of manometer tube, pump, and water tank equipped with pump water controller, water host
and tubes. This experiment uses the venturi meter to measure the fluid flow through a pipe.
The venturi tube has converging and diverging portion that function of increasing and
decreasing the velocity of fluid and lower and higher the static pressure respectively. The
experiment is conducted for three times with different flow rates starting the first after the
level pressure of each manometer A, B, C, D, E and F is equal and stable. The flow rate was
taken as the water indicator reached at 3 liters of water level. Level pressure of each
manometer is measured as head loss. From the experiment conducted, we observed than when
fluids moves from a region of higher pressure to lower pressure, the velocity of the fluid
increases. There are a little bit differences on the speed of the flow and the pressure when we
use Bernoulli’s equation and Continuity equation to calculate velocity. Thus, we concluded
that the Bernoulli’s theorem is accepted. The experiment was a successfully and the
objectives are obtained.
INTRODUCTION
Bernoulli’s principle tells us that windows tend to explode rather than implode when
hurricanes. During the hurricanes, a very high speed of air outside the window leading to low
air pressure compare to inside, which the air is still. The differences of forces causing the
windows push outward and explode. That it is why to better open all windows during the
hurricane.
Another example of Bernoulli’s principle application is to determine the flow speed of
a fluid. The devices such as venturi meter or an orifice plate is used and can be placed into a
pipeline to reduce the diameter of the flow. The reduction in diameter will cause an increase
in the fluid flow speed, thus according to Bernoulli’s there must be decrease in pressure.
In his book, Daniel Bernoulli states that “as the speed of a moving fluid (liquid or gas)
increases, the pressure within the fluid decreases. He comes up this principle and published in
his book Hydrodynamica in 1738. The book describes the theory of water flowing through a
tube and water flowing from a hole in a container which explained the hydronomic pressure.
In order to demonstrate the Bernoulli’s principle, model: FM 24 – Bernoulli’s
Theorem Demonstration apparatus is used. The apparatus consist of a classical Venturi made
of clear acrylic. A series of wall tapping allow measurement of the static pressure distribution
along the converging duct, while a total head tube is provided to transverse along the centre
line of the test section. These tapings are connected to a manometer bank incorporating a
manifold with air bleed valve. Pressurization of the manometers is facilitated by a hand pump.
This unit has been designed to be used with Hydraulics Bench for students to study the
characteristics of flow through both converging and diverging sections. During the
experiment, water is fed through a hose connector and students may control the flow rate of
the water by adjusting a flow regulator valve at the outlet of the test section.
AIM
This aim of the experiment is to determine Bernoulli’s theorem which can be applied to a
venturi meter consist of converging portion and diverging cone.

THEORY
Bernoulli’s principle is essentially a work energy conservation principle which states that an
ideal fluid or for situations where effects of viscosity are neglected, with no work being
performed on the fluid, the total energy is constant. This principle also states that the sum of
all forms of energy in a fluid flowing along an enclosed path (a streamline) is the same at any
two points in that path.
The pressure, speed and height (h) at two points in a steady-flowing, non-viscous,
incompressible fluid are related by the equation:
P1+12
ρ v12+ρgh1=P2+
12ρ v2
2+ρgh2
This equation is the sum of the kinetic energy, potential energy and gravitational energy at
height. If the equation was multiplied through by the volume, the density can be replaced by
mass and the pressure replaced by force times distance. As the replacement, we can see that
the difference in pressure does work which can be used to change the kinetic energy and the
potential energy of the fluid for this equation.
The continuity equation of continuity states that for an incompressible fluid flowing in a tube
of varying cross-section, the mass flow rate is the same everywhere in the tube. The equation
of continuity can be written as:
ρ1 A1 v1=ρ2 A2 v2
ρ = density , A = cross sectional area , v = velocity
The density stay at the constant and then it is simply the flow rate (Av) that is constant. The
velocity of fluid is greater in the narrow section as we applied the continuity equation.
Bernoulli's principle also states that if a non-viscous flow along a pipe of varying cross
section. Then, an increment in the speed of the fluid simultaneously with a drop in pressure or
a decrease in the fluid’s potential energy and the pressure increases when the pipe opens out
and the fluid stagnate. Thus, pressure would decreases when the velocity increases.
This is expressed with the following equation:
pρ g
+ v2
2 g+z=h¿=Constant

Where,
p = Fluid static pressure at the cross section
ρ = Density of the flowing fluid
g = Acceleration due to gravity
v = Mean velocity of fluid flow at the cross section
z = Elevation head of the center at the cross section with respect to a datum
h* = Total (stagnation) head
The sum of the pressure head (h), velocity head (hv ) and the elevation head (z) is known as
the total head (h*). The total head h* at any cross section is constant according to the
Bernoulli’s theorem of fluid flow through a pipe. The results will deviate from the theoretical
ones in real flow due to friction, other imperfections and the measurement uncertainties.
The centerline of all the cross sections we are considering lie on the same horizontal plane
(which we may choose as the datum, z = 0, and thus, all the ‘z’ values are zeros so that the
above equation reduces to:
pρ g
+ v2
2 g=h¿=Constant
This represents the total head at cross section.
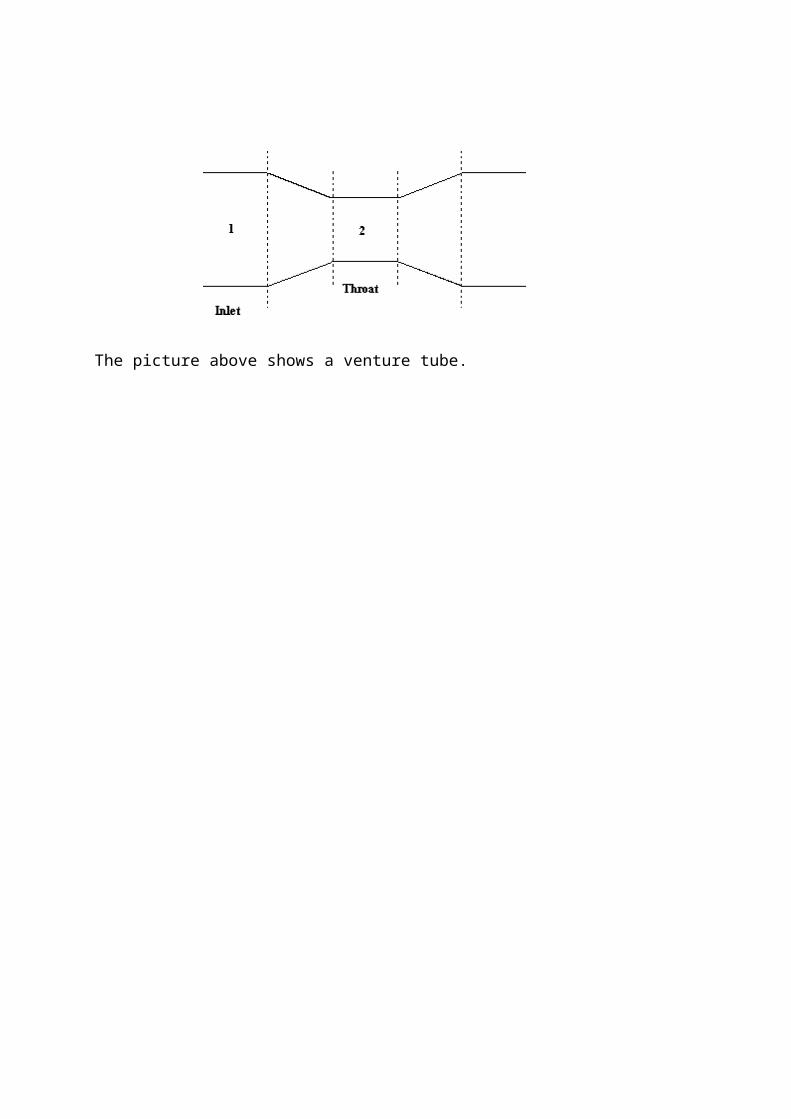
Venturi Meter
The venturi meter is a tool used to measure the flow through a pipeline. This apparatus
consists of a venturi tube and differential pressure gauge. The venturi tube has a converging
portion, a throat and a diverging portion as shown in the figure below. The converging
portion’s function is to increase the velocity of the fluid and lower its static pressure. A
pressure difference between inlet and throat is thus developed, which pressure difference is

correlated with the rate of discharge. The diverging cone serves to change the area of the
stream back to the entrance area and convert velocity head into pressure head.
The picture above shows a venture tube.
APPARATUS
Bernoulli’s Theorem Demostration Unit (FM 24)
Figure 1: Parts Identification Diagram
1 Manometer
2 Test Section
3 Water Inlet
4 Unions
5 Air Bleed Screw
6 Discharge Valve
7 Gland Nut
8 Hypodermic Probe
9 Adjustable Feet
PROCEDURE
General Start-Up Procedures
1. The clear acrylic is ensured that the test section is installed with the converging
section upstream. The unions are tighten
2. The apparatus is located on the flat top of the bench.
3. A spirit level is attached to baseboard and on top of the bench is levelled by adjusting
the feet.
4. The flexible inlet tube is connected using the quick release coupling in the bed of the
channel.
5. A flexible hose is connected to the outlet and directed into the channel.
6. The outlet flow control valve at the Bernoulli’s Theorem Demonstration Unit is
gradually opened to allow the volumetric tank of the hydraulic bench is filled.
7. The water is allowed to fill in the manometer tubes until all trapped air is removed.
8. Air bleed screw is opened and controlled to get a certain volumetric flow. The screw is
re-tightened when the manometer has reached a convenient height.
Experimental Procedures
1. The general Start-up Procedures is performed
2. All manometer tubes are checked properly connected to the corresponding pressure
taps are air-bubble free.
3. The discharged valve is adjusted to a high measureable flow rate.
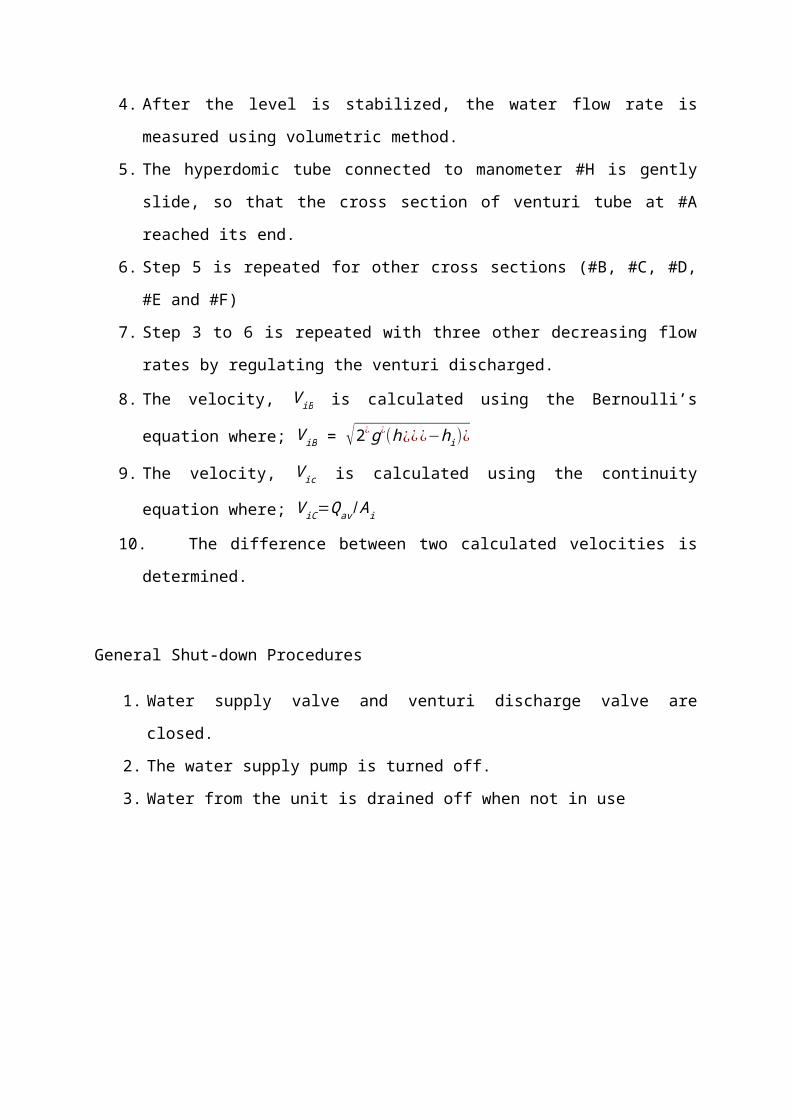
4. After the level is stabilized, the water flow rate is measured using volumetric method.
5. The hyperdomic tube connected to manometer #H is gently slide, so that the cross
section of venturi tube at #A reached its end.
6. Step 5 is repeated for other cross sections (#B, #C, #D, #E and #F)
7. Step 3 to 6 is repeated with three other decreasing flow rates by regulating the venturi
discharged.
8. The velocity, V iB is calculated using the Bernoulli’s equation where; V iB =
√2¿ g¿(h¿¿¿−hi)¿
9. The velocity, V ic is calculated using the continuity equation where; V iC=Qav /A i
10. The difference between two calculated velocities is determined.

General Shut-down Procedures
1. Water supply valve and venturi discharge valve are closed.
2. The water supply pump is turned off.
3. Water from the unit is drained off when not in use

RESULTS
1 st trial
Volume of water: 3L
Time taken: 43.2 s
Flowrate: 6.944 x 10⁻⁵ m3/s
Cross Section
Using Bernoulli’s equation Using Continuity Difference
ih¿=¿ hH
(mm)
h f
(mm)V iB=√2 g¿¿
(m/s)Ai=
π Di2
4(m2¿
V ic=Q av
A i
(m/s)
V iB−V iC
(m/s)
A 161 156 0.3132 0.000531 0.1308 0.1824
B 159 154 0.3132 0.000366 0.1897 0.1235
C 158 145 0.505 0.000201 0.3455 0.1595
D 157 150 0.3706 0.000314 0.2211 0.1495
E 156 151 0.3132 0.000380 0.1827 0.1305
F 156 153 0.2426 0.000531 0.1308 0.1118
2 nd Trial
Volume of water: 3L
Time taken: 31.55 s
Flowrate: 9.509 x 10⁻⁵ m3/s
Cross Section
Using Bernoulli’s equation Using Continuity Difference
ih¿=¿ hH
(mm)
h f
(mm)V iB=√2 g¿¿
(m/s)Ai=
π Di2
4(m2¿
V ic=Q av
A i
(m/s)
V iB−V iC
(m/s)
A 162 155 0.3706 0.000531 0.1791 0.1915
B 160 154 0.3431 0.000366 0.2598 0.0833
C 158 117 0.8969 0.000201 0.4731 0.4238
D 156 146 0.4429 0.000314 0.3028 0.1401
E 156 140 0.5609 0.000380 0.2502 0.3107
F 154 144 0.4429 0.000531 0.1791 0.2638

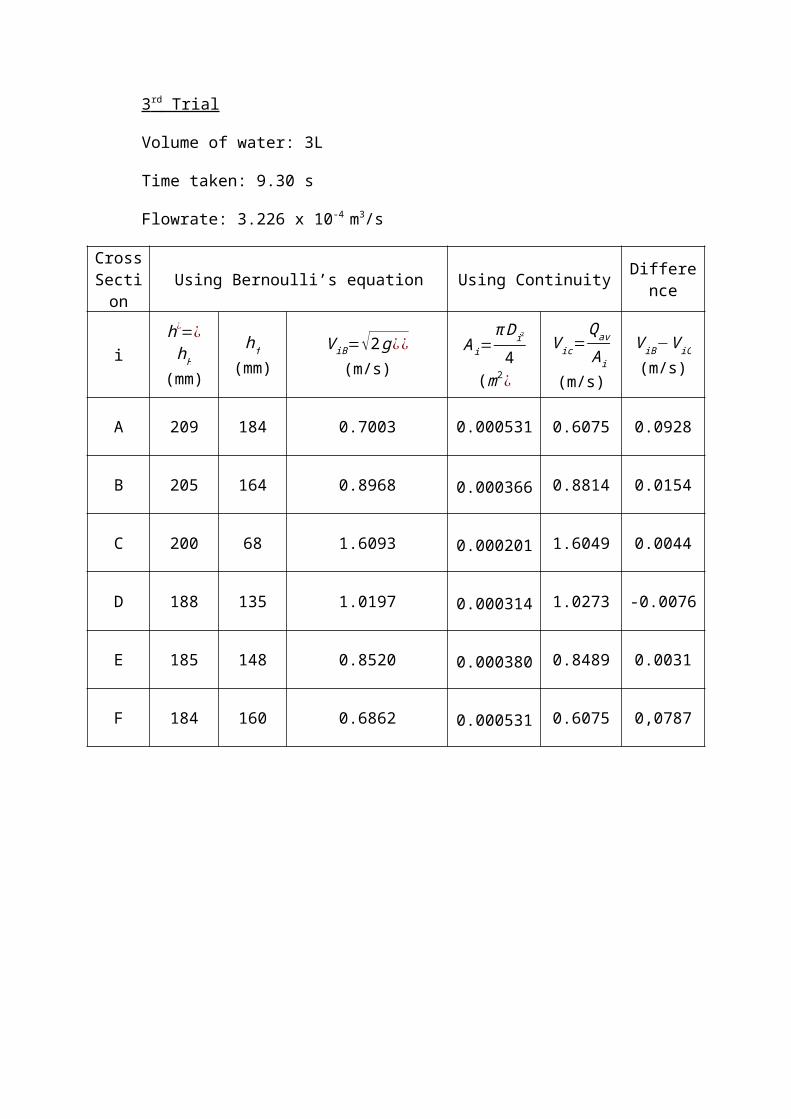
3 rd Trial
Volume of water: 3L
Time taken: 9.30 s
Flowrate: 3.226 x 10⁻⁴ m3/s
Cross Section
Using Bernoulli’s equation Using Continuity Difference
ih¿=¿ hH
(mm)
h f
(mm)V iB=√2 g¿¿
(m/s)Ai=
π Di2
4(m2¿
V ic=Q av
A i
(m/s)
V iB−V iC
(m/s)
A 209 184 0.7003 0.000531 0.6075 0.0928
B 205 164 0.8968 0.000366 0.8814 0.0154
C 200 68 1.6093 0.000201 1.6049 0.0044
D 188 135 1.0197 0.000314 1.0273 -0.0076
E 185 148 0.8520 0.000380 0.8489 0.0031
F 184 160 0.6862 0.000531 0.6075 0,0787

CALCULATIONS
During the experiment, reading of h* , hi ,and time taken of water to be filled until 3L are recorded.
There are a few things need to be calculated in order to determine the difference value between ViB and ViC :
1. ViB by using the Bernoulli’s equation2. Area of each of the cross section (A, B, C, D, E and F)3. Volumetric flow rate of each trial ( 1st, 2nd and 3rd) 4. ViC by using continuity equation
1. To calculate ViB , using the Bernoulli’s equation
pρ g
+ v2
2 g+z=h¿=Constant
We eliminate the pressure and z , thus we have this equation :
V iB=√2 g(h∗−hi¿)¿
As for example, we calculated the ViB of the cross section A of the 1st trial experiment;
g = 9.81 m/s2
V iB=√2(9.81)(161−156¿)¿
¿ 0.3132 m/s
2. The area of each cross section of the tube are calculated using this equation
Ai=π Di2
4
As for example; DA = 26 m therefore Ai=π (26)2
4
= 0.000531 m2
DB = 21.6 m DF = 26.0 mDC = 16.0 mDD = 20.0 mDE = 22.0 m
3. Volumetric flow rate of each trial ( 1st, 2nd and 3rd) are calculated using equation;
Qav = volume of water(m3)
time taken(s)
As for example we calculated the Q of the cross section A of the 1st trial experiment;
Qav = 0.003m3
43.20 s
= 6.944 × 10⁻⁵ m3/s
4. Lastly, we substituted the value of Ai and Q into the continuity equation
Thus ViC = 0.3108 m/s
We calculated the difference value between ViB and ViC . For cross section A;
ViB - ViC = 0.1824 m/s
All of the calculations are repeated for every trial.
V ic=Q av
A i

DISCUSSION
We had demonstrated the Bernoulli’s Theorem and from the result we had calculated
that when the diameter of the cross section smaller, there were increasing in velocities along
the distribution tube. The smallest cross section (which is cross section C) gave huge pressure
difference and had the highest velocities. The results had shown that larger pressure
difference gave out the most speed of fluid flow. Furthermore through the experiment, we had
observed as fluid flow through the venturi meter, the head is higher at the narrower tube and
vice versa. The narrower tube leads to high velocities and low pressure.
The volumetric flow rates are calculated for each trial. The speed of water was
controlled by using valve and times taken are recorded as the volumetric tank reached 3L.
Every trial had different volumetric flow rate as to manipulate the result of the velocities and
the calculated volumetric flow rates were substituted into the continuity equation to determine
the velocities. From the calculation, the highest volumetric flow rates gave the highest
velocities.
In order to determine the velocities of each cross section, two different equation were
used; by using Bernoulli’s Equation (ViB) and by using continuity equation (ViC). From the
calculations we observed that all of calculated V iB had highest value compared to ViC . The
continuity equation is the conservation of mass on a steady flow process through a control
volume. With uniform density of water, the velocity is equal to volumetric flow rate over
area. ViC took area of cross section into consideration, which when area increase velocity
decrease. ViC is directly proportional to area.
Whereas the Bernoulli’s equation is when an increment in the speed of the fluid
simultaneously with a drop in pressure and the pressure increases when the pipe opens out and
the fluid stagnate. Thus, pressure would decreases when the velocity increases. This equation
took pressure difference into consideration. As we discussed about both equations, both
equations were suitable to be used to calculate the velocities. However, there some parameters
needed to be considered like pressure difference and area.
We also had calculated the difference between V iB and ViC (ViB - ViC ), to show that the
value of ViB are greater than ViC. As we calculated, there was one negative value which was
should not happen. This may be because of parallax error during taking the reading and air
bubble trapped inside the tube.

CONCLUSION
As Bernoulli state high velocity of fluid flow result in low pressure and based on
continuity equation, smaller area result in high velocity. Thus, the result proved both equation
could be used to determine the velocity of fluid flow in manometer. Even the value is not
exactly the same, but the pattern of increasing and decreasing at the converging and diverging
portion is same. So that, as the velocity increases, the total head pressure also increases for
both convergent and divergent flow.
RECOMMENDATIONS
In order to obtain accurate results, there are a few recommendations and precautions
that should be taken during undergo the experiment. Firstly, the equipment must be drained
before starting and after the experiment, to prevent the equipment damaged. Next, make sure
there is no air bubbles trapped before and during running the experiment. The air bubbles will
affect the result of the experiment. Other than that, the experiment should be run after we
have fully understands the unit and the procedures to avoid some simple mistakes. In addition,
to get the accurate results, the eye level must be perpendicular to the reading when recording
the data to avoid parallax error, by the reading at the right meniscus. Besides that, the control
valve should be maintained at a constant flow so that each at every readings of each
manometer has the same value of pressure. Furthermore, when taking the time taken using the
stopwatch, the suction pipe has to be started simultaneously to get the accurate volumetric
flow rate. Next, the experiment should be repeated for a few times so that an average value
could be obtained. Lastly, the leakage of water in the instrument must be avoided to reduce
the error during conducting the experiment.

REFERENCE
1. Coulson & Richardson’s Chemical Engineering, Volume 1, Sixth Edition, J.M.
Coulson, J.F. Richardson, J.R. Backhurst, J.H Harker, Elsevier Butterworth-
Heinemann (1954)
2. “Bernoulli’s Principle” from http://en.wikipedia.org/wiki/Bernoulli's_principle.
Retrieved on 13th Oct 2014
3. Elementary Fluid Mechanics 7th Edition, Robert L. Street, Gary Z. Watters, John K.
Vennard, John Wiley & Sons Inc.
4. “Bernoulli’s Equation” from
http://www.princeton.edu/~asmits/Bicycle_web/Bernoulli.html. Retrieved on 18th
May 2014
5. Venturi Meters from www.thermopedia.com/content/1241. Retrieved on 13h Oct 2014

APPENDIX

![BEXLEY CITY SCHOOLS Physics 2... · 2019-10-04 · to verify the prediction. [SP 4.2, 6.4] Fluids Inquiry Lab FLUID ILD ... Continuity, Bernoulli's Principle, Archimedes’ principle,](https://static.fdocuments.in/doc/165x107/5eb5bb750e04fd5aaa267830/bexley-city-schools-physics-2-2019-10-04-to-verify-the-prediction-sp-42.jpg)