
Bernd Manfred Gawlik E-mail: …publications.jrc.ec.europa.eu/repository/bitstream/JRC...2014 Carmen...
38
2014 Carmen Cristache, Sara Comero, Giovanni Locoro, Isabelle Fissiaux, Agustín Alonso Ruiz, Gergely Tóth and Bernd Manfred Gawlik Comparative study on open system digestion vs. microwave‐assisted digestion methods for trace element analysis in agricultural soils Report EUR 26636 EN
Transcript of Bernd Manfred Gawlik E-mail: …publications.jrc.ec.europa.eu/repository/bitstream/JRC...2014 Carmen...

2 014
Carmen Cristache, Sara Comero, Giovanni Locoro, Isabelle Fissiaux, Agustín Alonso Ruiz, Gergely Tóth and Bernd Manfred Gawlik
Comparative study on open system digestion vs. microwave‐assisted digestion methods for trace element analysis in agricultural soils
Report EUR 26636 EN
European Commission Joint Research Centre Institute for Environment and Sustainability Contact information Bernd Manfred Gawlik Address: Joint Research Centre, Via Enrico Fermi 2749, TP 290, 21027 Ispra (VA), Italy E-mail: [email protected] Tel.: +39 0332 78 9487 Fax: +39 0332 78 9831 http://ies.jrc.ec.europa.eu/ http://www.jrc.ec.europa.eu/
This publication is a Reference Report by the Joint Research Centre of the European Commission.
Legal Notice This publication is a Technical Report by the Joint Research Centre, the European Commission’s in-house science service. It aims to provide evidence-based scientific support to the European policy-making process. The scientific output expressed does not imply a policy position of the European Commission. Neither the European Commission nor any person acting on behalf of the Commission is responsible for the use which might be made of this publication.
JRC90183 EUR 26636 EN ISBN 978-92-79-38176-8 (PDF)
ISSN 1831-9424 (online)
doi: 10.2788/79443
Luxembourg: Publications Office of the European Union, 2014
© European Union, 2014
Reproduction is authorised provided the source is acknowledged.
Printed in Luxembourg

23/04/2014 Page 1 of 31
Abstract The aim of this work was to evaluate two different digestion procedures for the determination of the concentration of trace and major elements (As, Cd, Co, Cr, Cu, Fe, Mg, Mn, Ni, P, Pb, Sb, V, Zn) in five hundred randomly selected soil samples from LUCAS Soil Survey. The two procedures employed in sample preparation are the open vessel digestion, which is described in the ISO 11466:1995 [1], and the microwave assisted digestion, implemented in the prEN16174 document [2].
Certified Reference Materials (NIST 2711 and BCR 141R) were also analysed using both pre-treatment approaches in order to determine sample recoveries and assess quality assurance and quality control (QA/QC) of the methods.
Results obtained with samples and CRMs analysis are useful to compare the two tested digestion procedures for recovery rate, safety, cost and time taken.
The results obtained from reference materials and soil samples revealed a good agreement between both procedures and the certified values. T-test was also employed to evaluate the hypothesis of equal mean between concentration determined after the open vessel and microwave-assisted digestions. This test demonstrates that, for the majority of the elements, the hypothesis is verified. The microwave procedure was then recommended as the method for the digestion of the 22 000 soil samples of the LUCAS Soil Survey, based on good precision and accuracy, speed and safety.
Keywords: Microwave assisted digestion - Open system digestion - Soil samples

23/04/2014 Page 2 of 31
List of Abbreviations and Symbols Throughout this report the following abbreviations and symbols are used: BCR Community Bureau of Reference
CEN European Committee for Standardization
CRM Certified Reference Material
ESDAC European Soil Data Centre
EU European Union
ICP-OES Inductively Coupled Plasma-Optical Emission Spectrometry
ISO International Organization for Standardization
IUPAC International Union for Pure and Applied Chemistry
JRC Joint Research Centre
LIMS Laboratory Information Management System
LUCAS Land Use/Cover Area frame Statistical Survey
NIST National Institute of Standards and Technology
MW Microwave
OV Open Vessel
QA/QC Quality Assurance/Quality Control
SDV Standard Deviation
SRM Standard Reference Material
Note that chemical elements are identified and expressed according to IUPAC rules.
23/04/2014 Page 3 of 31
Table of Contents Abstract ..................................................................................................................... 1 List of Abbreviations and Symbols ................................................................................. 2 Table of Contents ........................................................................................................ 3 List of Figures ............................................................................................................. 4 List of Tables .............................................................................................................. 4 1. Introduction ....................................................................................................... 5 2. Experimental methods ........................................................................................ 6
2.1 Reagents ........................................................................................................ 6 2.2 Sample preparation .......................................................................................... 6 2.3 Microwave-assisted digestion ............................................................................ 6 2.4 Open vessel digestion ....................................................................................... 7 2.5 Inductively Coupled Plasma – Optical Emission Spectrometry (ICP-OES) ................. 7
3. Results and discussion ........................................................................................ 8 3.1 Reference materials results ............................................................................... 8 3.2 Soil sample results ......................................................................................... 11
4. Conclusions ..................................................................................................... 16 Annex A – Regression curves ...................................................................................... 17 Annex B – List of soil samples used in the comparison study .......................................... 19 References ............................................................................................................... 34

23/04/2014 Page 4 of 31
List of Figures Figure 1 - Micro-wave assisted digestion device .............................................................. 7 Figure 2 - Extraction of trace elements using aqua regia methods in accordance with ISO 11466 .......................................................................................................... 7 Figure 3 - Optima 2100 DV ICP-OES device operated at the JRC ....................................... 8 Figure 4 - Certified and measured concentrations in BRC 141R and NIST 2711 for both MW and OV digestion approaches ........................................................................ 10 Figure 5 - Pie charts representation of level of acceptance comparison between MW and OV techniques.................................................................................................. 15
List of Tables Table 1 - Operating conditions for the Optima 2100 DV ICP-OES ....................................... 8 Table 2 - Average recovery and standard deviation for BCR 141R (%) obtained with both MW and OV sample pre-treatment .......................................................................... 9 Table 3 - Average recovery and standard deviation for NIST 2711 (%) obtained with both MW and OV sample pre-treatment .................................................................... 9 Table 4 - t-test results for BCR 141R ........................................................................... 11 Table 5 - t-test results for NIST 2711 .......................................................................... 11 Table 6 - Comparison data between MW and OV, expressed in % ................................... 12

23/04/2014 Page 5 of 31
1. Introduction The LUCAS Programme - the periodic Land Use/Land Cover Area Frame Survey – organised and managed by Eurostat (the statistical office of the European Union) started in 2001. The survey is based on the visual assessment of land parameters that are deemed relevant for agricultural policy. Since 2006 the sampling design is based on the intersection of a regular 2 km x 2 km grid covering the territory of the EU. This results in around 1,000,000 geo-referenced points (Eurostat 2010). In 2009 the European Commission has extended the LUCAS from visual land cover assessment to sampling and analysis of the main properties of topsoil across the Union. This topsoil survey - although limited to the upper layer of soil cover (usually regarded as the uppermost 20-30 cm) - represents the first effort to build a consistent spatial database of the soil cover across the EU based on standard sampling and analytical procedures, with the analysis of all soil samples being carried out in a single laboratory. In addition, the LUCAS Topsoil Survey has the potential to be the basis for an EU wide harmonised soil monitoring. As a result, approximately 22.000 soil samples were collected and submitted for analysis. The first set of soil analysis targeted basic soil physical and chemical attributes, which are considered to be most relevant for agricultural and environmental indicators [1]. Next, the Inorganic Chemistry Laboratory of the Joint research Centre was commissioned to analyse the soil samples for trace elements. The studied elements include As, Cd, Co, Cr, Cu, Fe, Hg, Ni, Mg, Mn, P, Pb and V, Zn. The JRC laboratory performing this study is certified according to ISO 9001 and operates all its procedures in full alignment with the general requirements of the organization’s quality policy. All procedures are carefully documented and results of measurements are managed using a LIMS (Laboratory Information Management System), which fulfils the requirements of ISO 9001/ISO 17025. This work was completed in early 2014 and the result of the analyses will be integrated to the database of the European Soil Data Centre (ESDAC). The data set is of particular relevance to establish a baseline for diffuse pollution across the EU. The current study was preceded by a study on trace elements published by the JRC in 2006, which addressed the issue of establishing background values in European soils. The study of 2006 presented the results for the elements Cd, Cr, Cu, Hg, Ni, Pb, and Zn after harmonization to aqua regia basis by using conversion algorithms. Parallel to this study, a large-scale standardization project was mandated by the Commission to CEN (Mandate M 320), with the task to produce across-matrix applicable measurement standards for soil, sludge and bio-waste analyses. As the standard digestion method using aqua regia as extracting agent is rather costly, time consuming and also presents a higher safety risk due to the strong reagent, development of a rapid, safer and cheaper method was considered to be necessary. Therefore we applied an alternative digestion method - using microwave - on the same samples to assess the effect the pretreatment on the final accuracy and reliability of the results. The work presented in this report evaluated the equivalence between microwave-assisted digestion and open-vessel digestion. Both techniques were evaluated in a comparison on a subset of soils (500 samples). The findings of this comparison are published in the present technical report. The quantified accuracy measure of the employed alternative digestion method shows that it could be a reasonable substitute for the aqua regia based pre-treatment for detecting trace elements in soil on a long term. Thus, monitoring these elements in European soils can be performed safer in a more cost-effective manner.

23/04/2014 Page 6 of 31
2. Experimental methods
2.1 Reagents Deionized water with a resistivity of 18.2 MΩ cm, produced by a Milli-Q Plus pure water generating system from MILLIPORE Gradient A10, was used for standards and sample solutions preparation.
Trace analytical-grade 65% nitric acid (NO3, suprapur® - Merck) and 37% hydrochloric acid (HCl, suprapur® - Merck) were used for sample digestion.
Calibration solutions for ICP-OES were prepared by stepwise dilution: the calibration standard solutions were prepared by diluting single element stock standard solutions with single or double-Milli-Q water step by step to make the concentration of interest.
2.2 Sample preparation Prior to analytical determination, soil samples were air-dried in order to remove all water content. Obtained dried samples were grounded in an agate ball mixer up to a particle size of 630 µm in order to provide a homogenized powder.
Certified reference materials (CRMs) were furnished in homogeneous and dried powders at a size lower than 90 μm and no pre-treatment was necessary.
Trace and major elements analysis by ICP-OES technique also requires digested samples: digestion was made with both microwave-assisted and open vessel digestion.
2.3 Microwave-assisted digestion A Multiwave 3000 microwave device (Anton Paar) was employed for sample digestion. The followed procedure is descibed in the prEN16174 document [2]. About 0.1g of soil sample was weighed in a microwave vessel using an electronic balance (Mettler AT261, Mettler Instruments Corp) with a precision of 1 μg. The mixture of aqua regia, i.e. 1.5 mL of HNO3 and 4.5 mL HCl, was carefully added to each test portion and the vessel was gently shaken, sealed and placed in the microwave oven under previously optimized operating conditions [3]. Aqua regia mixture was used as blank solution.
The microwave autoclave can digest up to 48 samples in the reaction chamber simultaneously under identical experimental conditions. The maximum pressure of the reaction chamber with sample vessels inside was set to 1225 bar. Then, the vessels were heated in the microwave autoclave for 35 min reaching a temperature of maximum 140 °C and a pressure of approximately 20 bar. Before opening the reaction chamber, the digests were allowed to cool for about 180 min to well below the boiling point of the acid mixture at atmospheric pressure.
Each extract was filtered in a 50 mL glass flask using a vacuum pump system and a Millipore Millex® HN Nylon syringe Driven Filters with 0.45µm pore size. The vessel and the vessel cup were subsequently rinsed three times with Milli-Q water and the rinse water was filtered in the same flask. At the end, the flask was made up to volume. The experimental apparatus is shown in Figure 1. Digests were stored at 4 ºC until analyses by inductively coupled plasma-optical emission spectrometry.

23/04/2014 Page 7 of 31
2.4 Open vessel digestion The aqua regia extraction was based on the procedure recommended by the International Organization for Standardization (ISO) [4].
The samples were weighted in Teflon beakers with a pre-determined amount of acid mixture (9 ml of 37% hydrochloric acid and 3 ml of 65% nitric acid). Approximately 0.2 g of soil sample was used.
The pre-digestion step was done at room temperature for 16 h followed by boiling under reflux at 145 ºC for 2 h. The obtained suspension was filtered through an ashless Whatman 542 filter and then diluted to 100 ml with Milli-Q water. Extracted samples were stored in polyethylene bottles until analyses by inductively coupled plasma-optical emission spectrometry.
The apparatus for open vessel digestion is illustrated in Figure 2.
Figure 1 - Micro-wave assisted digestion device
Figure 2 - Extraction of trace elements using aqua regia methods in accordance with ISO 11466
2.5 Inductively Coupled Plasma – Optical Emission Spectrometry (ICP-OES) The concentrations of elements (As, Cd, Co, Cr, Cu, Fe, Mg, Mn, Ni, P, Pb, Sb, V, Zn) in digests were measured by optical emission spectrometry with inductively coupled argon plasma as the excitation source. The method was previously validated according to the ISO 17025 requirements [3] and the adopted operating procedure for sample analysis is based on the prEN16170 document [5].
The method describes the multi-elemental determination of elements in aqueous solutions and digests by simultaneous optical ICP-OES with axial or radial viewing of the plasma. The Optima 2100 DV ICP-OES device by Perkin Elmer was employed for this study (Figure 3). The operating conditions used for digests are listed in Table 1.

23/04/2014 Page 8 of 31
Table 1 - Operating conditions for the Optima 2100 DV ICP-OES
Instrument part Parameter Value
Plasma condition Plasma flow (Argon) 15 L/min
Auxiliary flow (Argon) 0.2 L/min
Nebulizer flow (Argon) 0.8 L/min
Power 1300 W
View distance 15
Plasma view axial
Peristaltic pump Sample flow rate 1.5 L/min
Autosampler Wash between samples 30s
Figure 3 - Optima 2100 DV ICP-OES device operated at the JRC
3. Results and discussion Microwave-assisted digestion and open vessel digestion approaches were both applied to 500 soil samples and CRMs. A CRM was added to every batch of sample measured in order to assure quality control and quality assurance of the methods. Measured concentrations of trace and major elements by ICP-OES were useful to gain information on the comparability of both sample pre-treatment procedures.
The effectiveness of the applied classical and microwave methods was assessed and discussed.
3.1 Reference materials results Certificate Reference Materials were analysed together with soil samples, using both digestion approaches. Measured concentrations were compared with certified values to account for method recovery.
Trace and major elements were analysed in BCR 141R (“Calcareous Loam Soil”) and NIST 2711 (”Montana Soil”) reference materials.
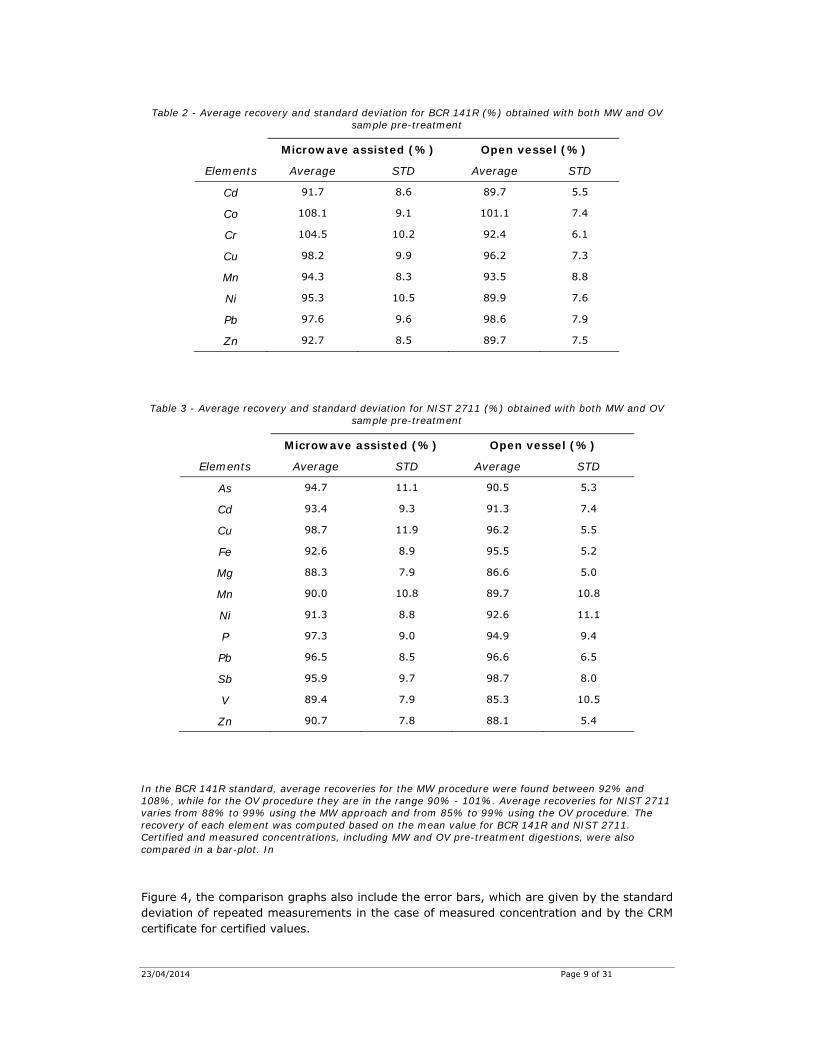
Average recovery for the elements Cd, Co, Cr, Cu, Mn, Ni, Pb and Zn were obtained using the BCR 141R material; recovery results for both MW and OV techniques are listed in Table 2.
Average recovery for the elements As, Cd, Cu, Fe, Mg, Mn, Ni, P, Pb, Sb, V and Zn were measured in NIST 2711 material; recovery results for both MW and OV approaches are listed in Table 3.
23/04/2014 Page 9 of 31
Table 2 - Average recovery and standard deviation for BCR 141R (%) obtained with both MW and OV sample pre-treatment
Microwave assisted (%) Open vessel (%)
Elements Average STD Average STD
Cd 91.7 8.6 89.7 5.5
Co 108.1 9.1 101.1 7.4
Cr 104.5 10.2 92.4 6.1
Cu 98.2 9.9 96.2 7.3
Mn 94.3 8.3 93.5 8.8
Ni 95.3 10.5 89.9 7.6
Pb 97.6 9.6 98.6 7.9
Zn 92.7 8.5 89.7 7.5
Table 3 - Average recovery and standard deviation for NIST 2711 (%) obtained with both MW and OV sample pre-treatment
Microwave assisted (%) Open vessel (%)
Elements Average STD Average STD
As 94.7 11.1 90.5 5.3
Cd 93.4 9.3 91.3 7.4
Cu 98.7 11.9 96.2 5.5
Fe 92.6 8.9 95.5 5.2
Mg 88.3 7.9 86.6 5.0
Mn 90.0 10.8 89.7 10.8
Ni 91.3 8.8 92.6 11.1
P 97.3 9.0 94.9 9.4
Pb 96.5 8.5 96.6 6.5
Sb 95.9 9.7 98.7 8.0
V 89.4 7.9 85.3 10.5
Zn 90.7 7.8 88.1 5.4
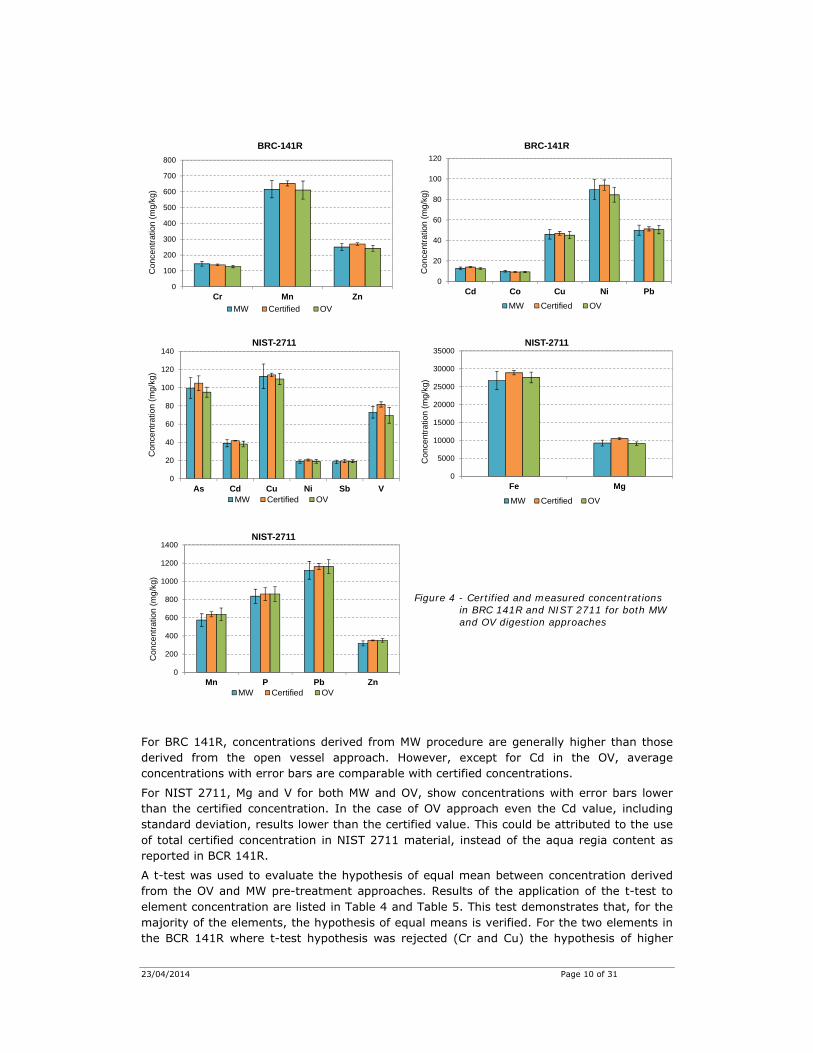
In the BCR 141R standard, average recoveries for the MW procedure were found between 92% and 108%, while for the OV procedure they are in the range 90% - 101%. Average recoveries for NIST 2711 varies from 88% to 99% using the MW approach and from 85% to 99% using the OV procedure. The recovery of each element was computed based on the mean value for BCR 141R and NIST 2711. Certified and measured concentrations, including MW and OV pre-treatment digestions, were also compared in a bar-plot. In
Figure 4, the comparison graphs also include the error bars, which are given by the standard deviation of repeated measurements in the case of measured concentration and by the CRM certificate for certified values.
23/04/2014 Page 10 of 31
0
100
200
300
400
500
600
700
800
Cr Mn Zn
Con
cent
ratio
n (m
g/kg
)BRC-141R
MW Certified OV
0
20
40
60
80
100
120
Cd Co Cu Ni Pb
Con
cent
ratio
n (m
g/kg
)
BRC-141R
MW Certified OV
0
20
40
60
80
100
120
140
As Cd Cu Ni Sb V
Con
cent
ratio
n (m
g/kg
)
NIST-2711
MW Certified OV
0
5000
10000
15000
20000
25000
30000
35000
Fe Mg
Con
cent
ratio
n (m
g/kg
)
NIST-2711
MW Certified OV
0
200
400
600
800
1000
1200
1400
Mn P Pb Zn
Con
cent
ratio
n (m
g/kg
)
NIST-2711
MW Certified OV
Figure 4 - Certified and measured concentrations in BRC 141R and NIST 2711 for both MW and OV digestion approaches
For BRC 141R, concentrations derived from MW procedure are generally higher than those derived from the open vessel approach. However, except for Cd in the OV, average concentrations with error bars are comparable with certified concentrations.
For NIST 2711, Mg and V for both MW and OV, show concentrations with error bars lower than the certified concentration. In the case of OV approach even the Cd value, including standard deviation, results lower than the certified value. This could be attributed to the use of total certified concentration in NIST 2711 material, instead of the aqua regia content as reported in BCR 141R.
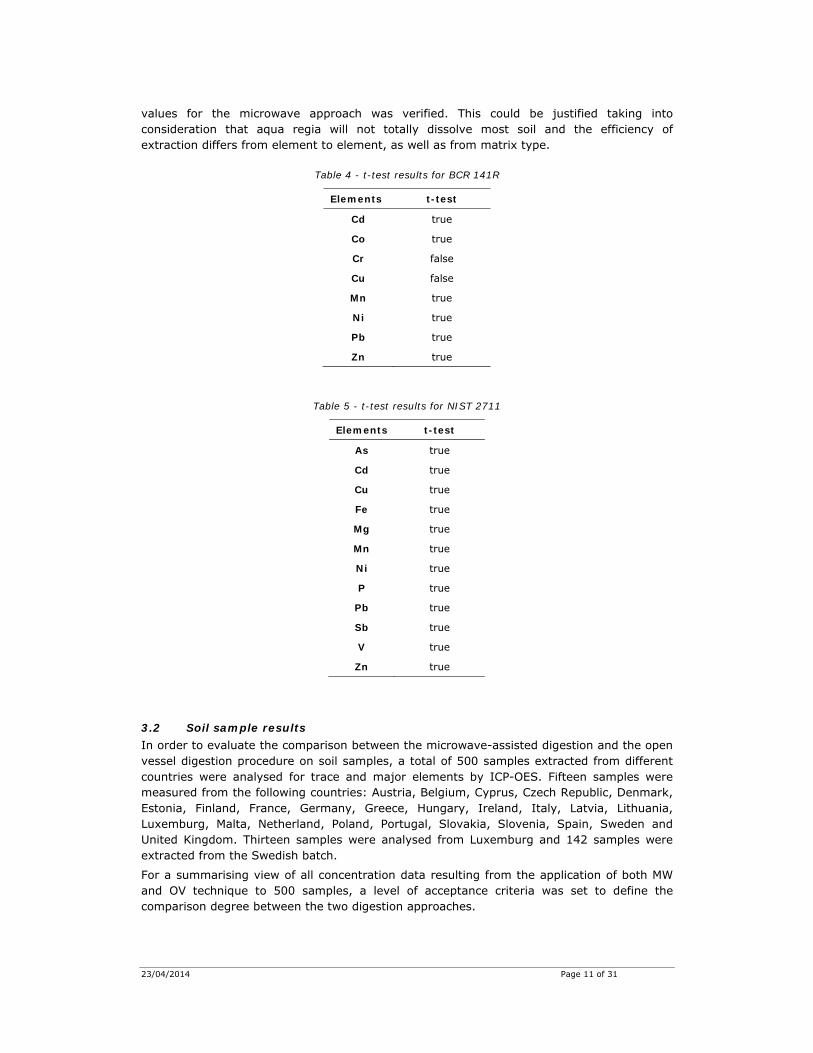
A t-test was used to evaluate the hypothesis of equal mean between concentration derived from the OV and MW pre-treatment approaches. Results of the application of the t-test to element concentration are listed in Table 4 and Table 5. This test demonstrates that, for the majority of the elements, the hypothesis of equal means is verified. For the two elements in the BCR 141R where t-test hypothesis was rejected (Cr and Cu) the hypothesis of higher
23/04/2014 Page 11 of 31
values for the microwave approach was verified. This could be justified taking into consideration that aqua regia will not totally dissolve most soil and the efficiency of extraction differs from element to element, as well as from matrix type.
Table 4 - t-test results for BCR 141R
Elements t-test
Cd true
Co true
Cr false
Cu false
Mn true
Ni true
Pb true
Zn true
Table 5 - t-test results for NIST 2711
Elements t-test
As true
Cd true
Cu true
Fe true
Mg true
Mn true
Ni true
P true
Pb true
Sb true
V true
Zn true
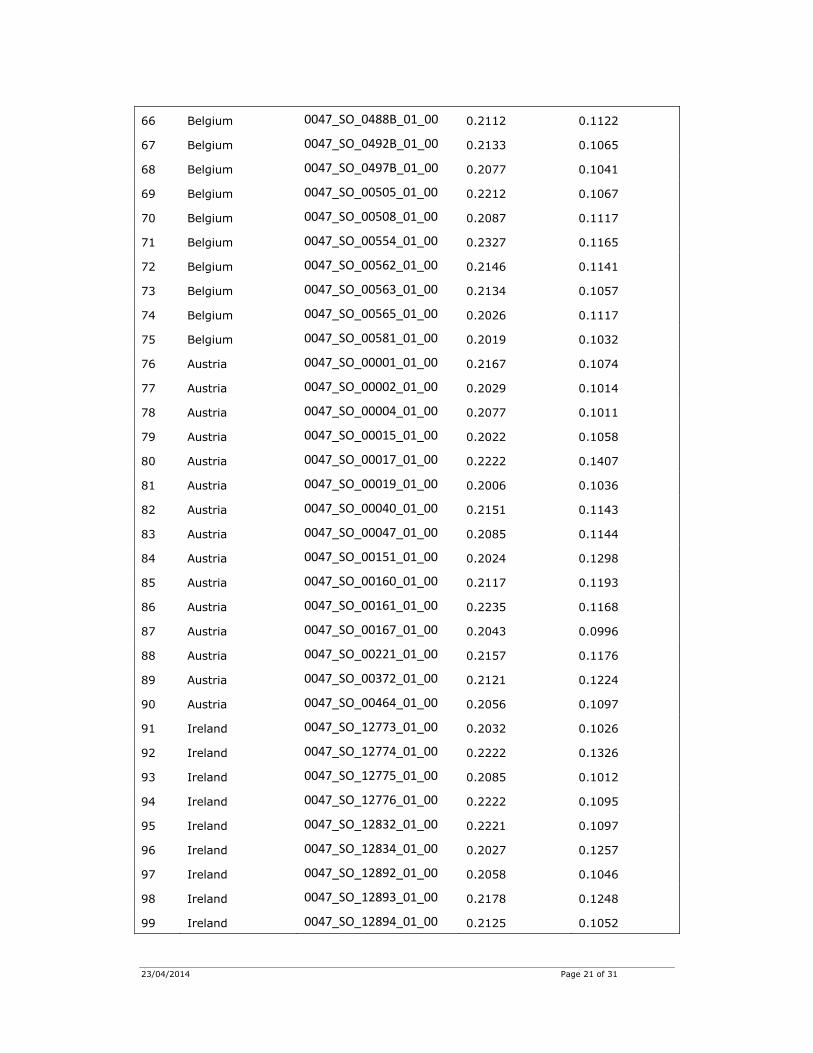
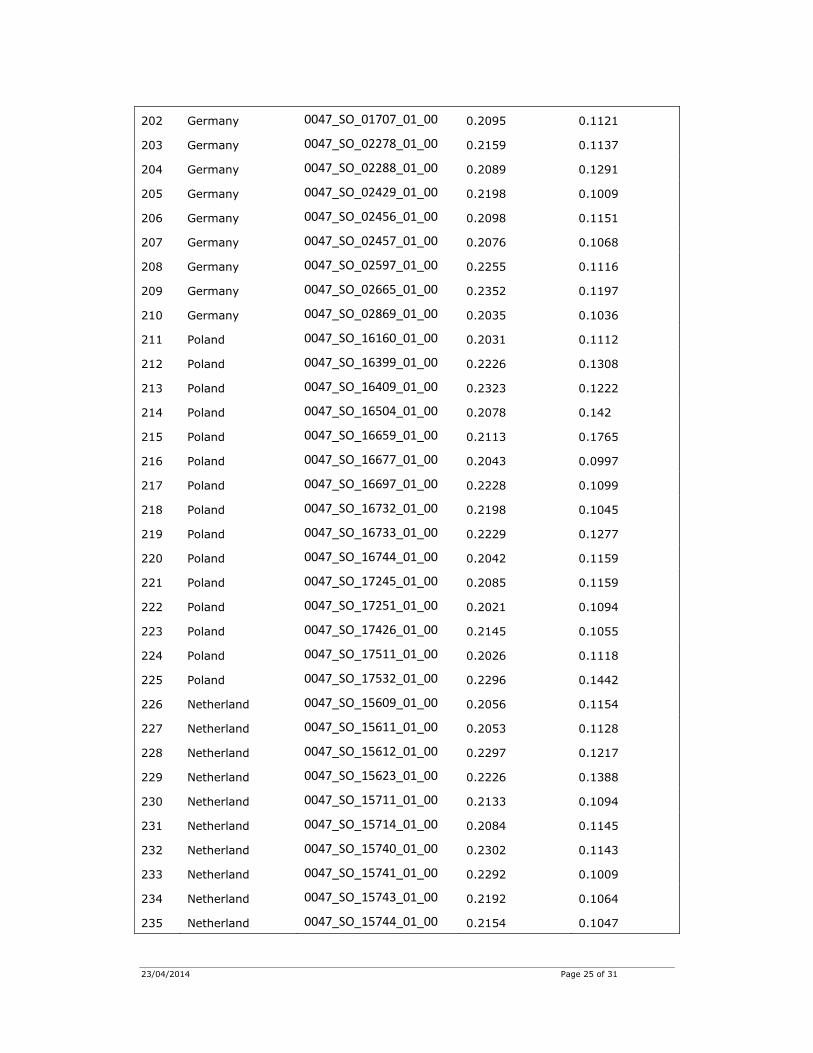
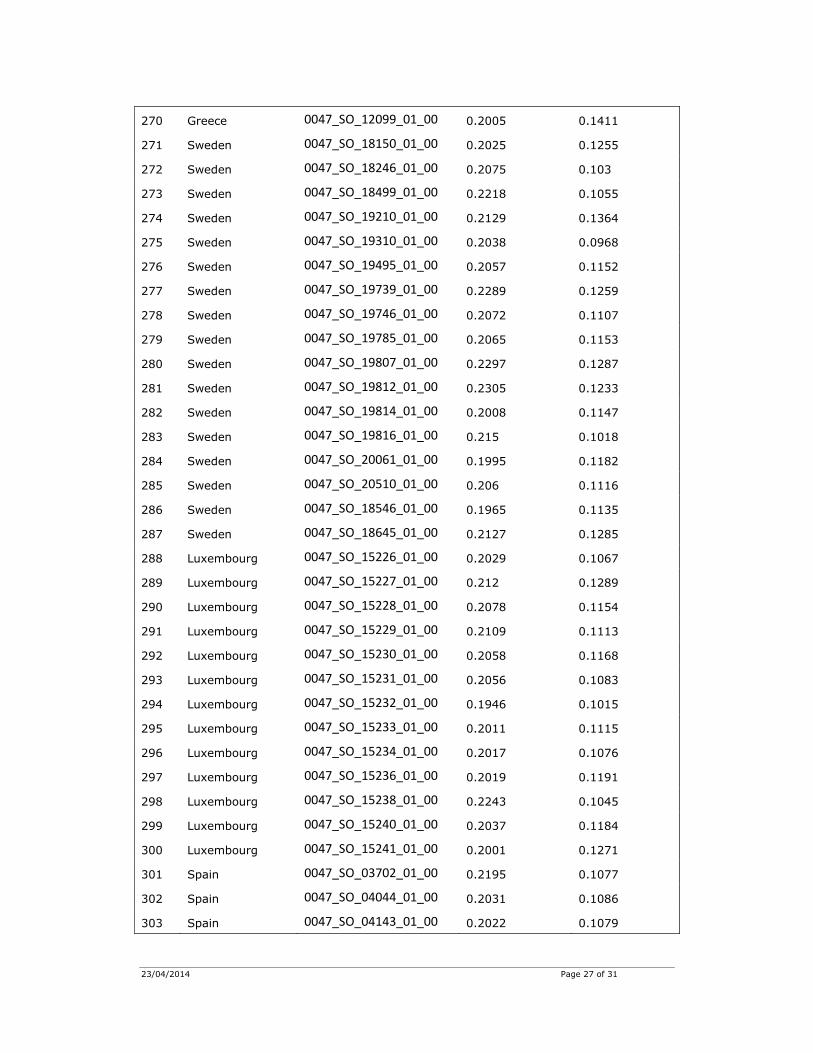
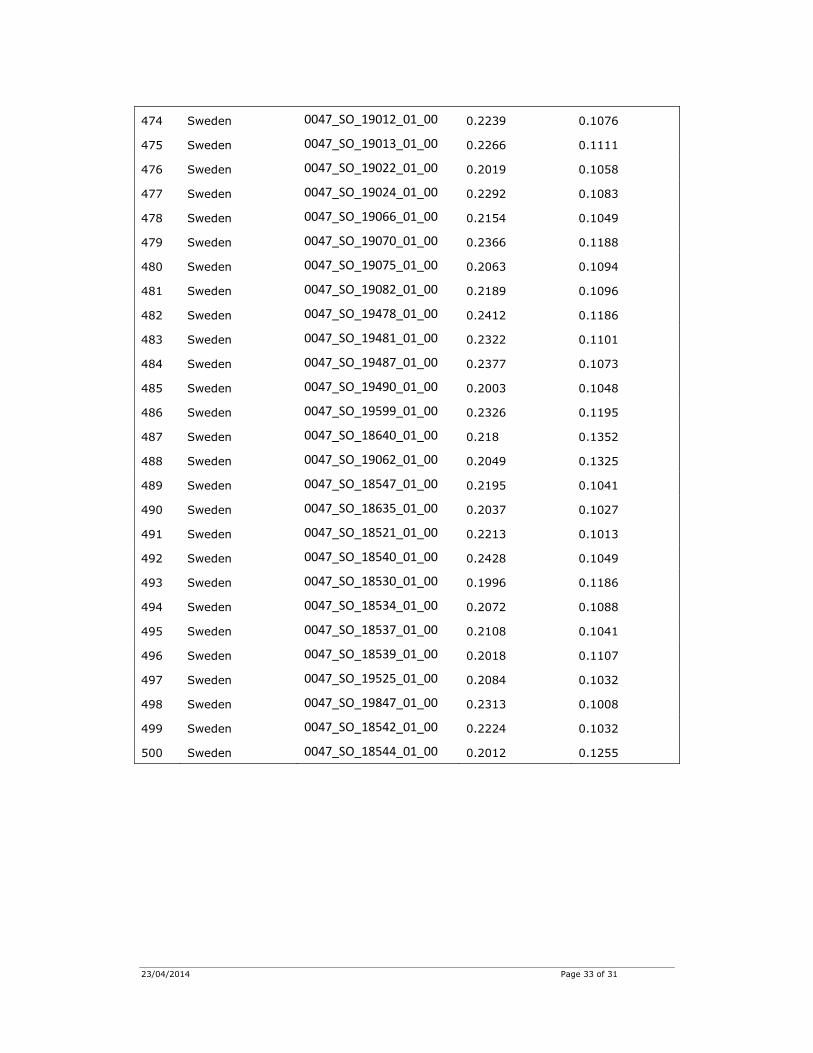
3.2 Soil sample results In order to evaluate the comparison between the microwave-assisted digestion and the open vessel digestion procedure on soil samples, a total of 500 samples extracted from different countries were analysed for trace and major elements by ICP-OES. Fifteen samples were measured from the following countries: Austria, Belgium, Cyprus, Czech Republic, Denmark, Estonia, Finland, France, Germany, Greece, Hungary, Ireland, Italy, Latvia, Lithuania, Luxemburg, Malta, Netherland, Poland, Portugal, Slovakia, Slovenia, Spain, Sweden and United Kingdom. Thirteen samples were analysed from Luxemburg and 142 samples were extracted from the Swedish batch.
For a summarising view of all concentration data resulting from the application of both MW and OV technique to 500 samples, a level of acceptance criteria was set to define the comparison degree between the two digestion approaches.
23/04/2014 Page 12 of 31
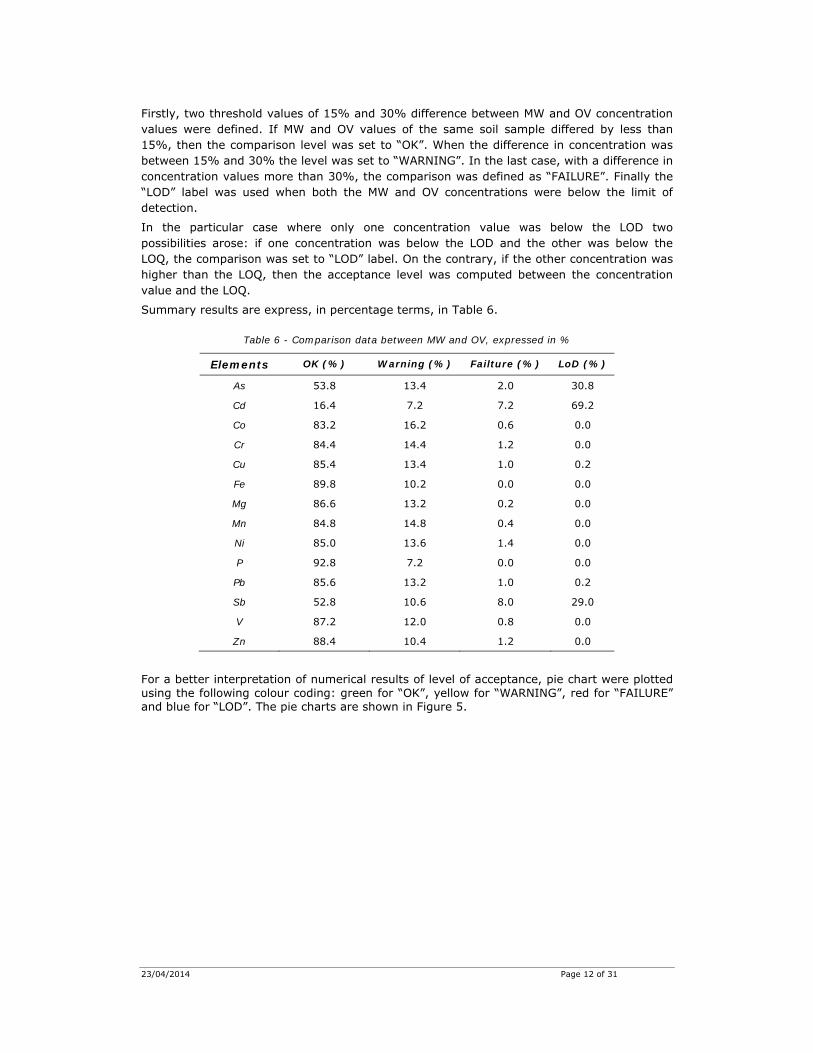
Firstly, two threshold values of 15% and 30% difference between MW and OV concentration values were defined. If MW and OV values of the same soil sample differed by less than 15%, then the comparison level was set to “OK”. When the difference in concentration was between 15% and 30% the level was set to “WARNING”. In the last case, with a difference in concentration values more than 30%, the comparison was defined as “FAILURE”. Finally the “LOD” label was used when both the MW and OV concentrations were below the limit of detection.
In the particular case where only one concentration value was below the LOD two possibilities arose: if one concentration was below the LOD and the other was below the LOQ, the comparison was set to “LOD” label. On the contrary, if the other concentration was higher than the LOQ, then the acceptance level was computed between the concentration value and the LOQ.
Summary results are express, in percentage terms, in Table 6.
Table 6 - Comparison data between MW and OV, expressed in %
Elements OK (%) Warning (%) Failture (%) LoD (%)
As 53.8 13.4 2.0 30.8
Cd 16.4 7.2 7.2 69.2
Co 83.2 16.2 0.6 0.0
Cr 84.4 14.4 1.2 0.0
Cu 85.4 13.4 1.0 0.2
Fe 89.8 10.2 0.0 0.0
Mg 86.6 13.2 0.2 0.0
Mn 84.8 14.8 0.4 0.0
Ni 85.0 13.6 1.4 0.0
P 92.8 7.2 0.0 0.0
Pb 85.6 13.2 1.0 0.2
Sb 52.8 10.6 8.0 29.0
V 87.2 12.0 0.8 0.0
Zn 88.4 10.4 1.2 0.0
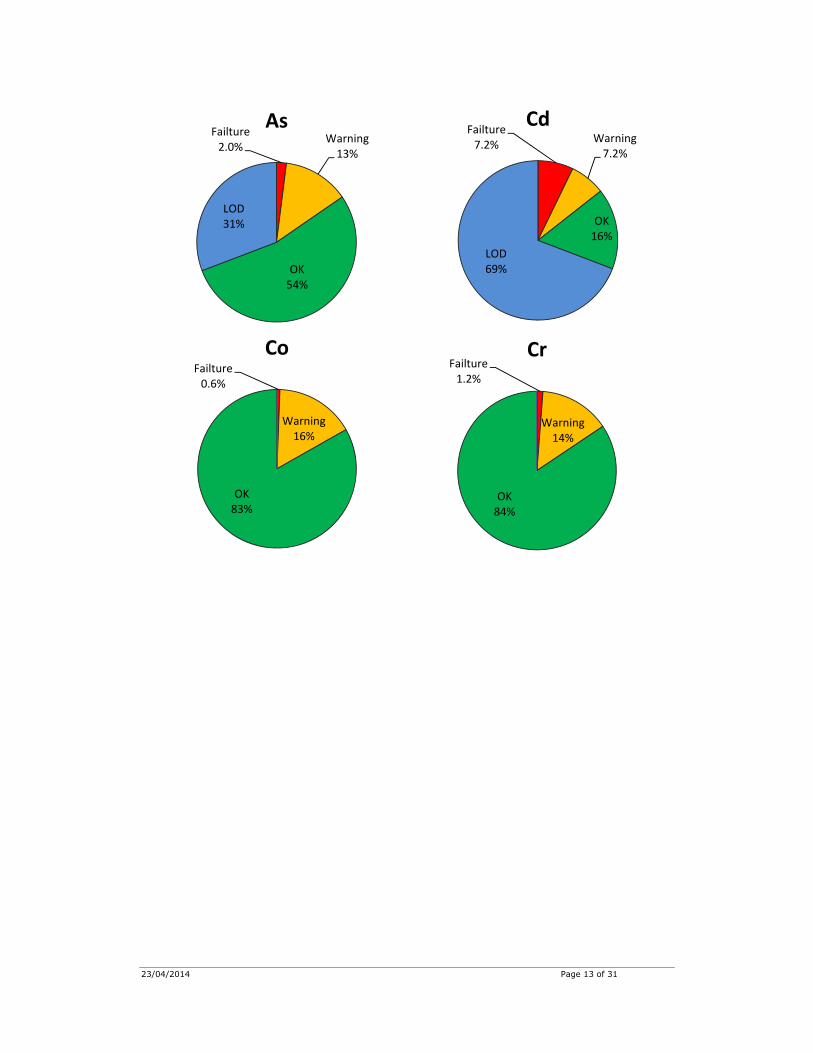
For a better interpretation of numerical results of level of acceptance, pie chart were plotted using the following colour coding: green for “OK”, yellow for “WARNING”, red for “FAILURE” and blue for “LOD”. The pie charts are shown in Figure 5.
23/04/2014 Page 13 of 31
Failture2.0%
Warning13%
OK54%
LOD31%
As Failture7.2% Warning
7.2%
OK16%
LOD69%
Cd
Failture0.6%
Warning16%
OK83%
CoFailture1.2%
Warning14%
OK84%
Cr

23/04/2014 Page 14 of 31
Failture1.0%
Warning13%
OK85%
LOD0.2%
CuWarning10%
OK90%
Fe
Failture0.2%
Warning13%
OK87%
Mg
Failture0.4%
Warning15%
OK85%
Mn

23/04/2014 Page 15 of 31
Failture1.4%
Warning14%
OK85%
NiWarning7.2%
OK93%
P
Failture1.0%
Warning13%
OK86%
LOD0.2%
Pb
Failture8%
Warning10%
OK53%
LOD29%
Sb
Failture0.8%
Warning12%
OK87%
V
Failture1.2%
Warning10%
OK88%
Zn
Figure 5 - Pie charts representation of level of acceptance comparison between MW and OV techniques
In Annex A, regression graphs for each analysed element are shown. X-axis represents element concentration obtained after microwave-assisted digestion, while y-axis is the concentration value after open vessel method. A red dot indicates the concentration value measured in the CRM used for QA/QC.

23/04/2014 Page 16 of 31
Correlation coefficients, which are also indicated in the graphical representation, range from 0.864 for Cd to 0.988 for Cr.
4. Conclusions Trace and major elements were investigated in 500 randomly selected soil samples from the Lucas Soil Survey. The final aim was to evaluate the comparison between two sample pre-treatment techniques: the open vessel digestion and the microwave-assisted digestion.
The first method is the conventional ISO approach widely used for its documented procedure, but it is time consuming (up to 18 hours for complete digestion) and requires more reagents and sample quantity.
On the contrary, the microwave-assisted approach is only draft-documented, but it takes less than 75 minutes for a complete 48 sample preparation; it is also safer than open vessel because the digestion procedure is applied in a closed system and requires lower reagent and sample usage.
The results obtained from the trace and major element analysis in CRMs provided a good agreement between both techniques. In general, recovery rates are slightly higher for microwave-assisted approach, but the t-test confirm the hypothesis of equal means between concentrations computed on CRMs with both MW and OV pre-treatment. An exception was for Cr and Cu in BCR 141R where MW concentrations were found higher than OV.
Soil samples analysis confirm the good agreement of both sample preparation techniques, where in the majority of cases, element concentration measured after both pre-treatment approaches differ by less than 15%.

23/04/2014 Page 17 of 31
Annex A – Regression curves The following graphs represent regression curves between soil samples treated with both microwave assisted digestion (x-axis) and open vessel system (y-axis). A red dot represents the concentration value of CRM used for QA/QC.
R² = 0.975
0
20
40
60
80
100
0 50 100 150
OV
conc
entra
tion
(mg/
kg)
MW concentration (mg/kg)
As
Soil sample
CRM
R² = 0.864
0
2
4
6
8
10
12
14
0 5 10 15
OV
conc
entra
tion
(mg/
kg)
MW concentration (mg/kg)
Cd
Soil sample
CRM
R² = 0.964
0
20
40
60
80
0 20 40 60 80 100
OV
conc
entra
tion
(mg/
kg)
MW concentration (mg/kg)
Co
Soil sample
CRM
R² = 0.988
0
100
200
300
400
500
600
0 200 400 600 800
OV
con
cent
ratio
n (m
g/kg
)
MW concentration (mg/kg)
Cr
Soil sample
CRM
R² = 0.987
0
40
80
120
160
200
0 50 100 150 200
OV
conc
entra
tion
(mg/
kg)
MW concentration (mg/kg)
Cu
Soil sample
CRM
R² = 0.976
0
10000
20000
30000
40000
50000
60000
70000
80000
90000
0 20000 40000 60000 80000 100000
OV
conc
entra
tion
(mg/
kg)
MW concentration (mg/kg)
Fe
Soil sample
CRM

23/04/2014 Page 18 of 31
R² = 0.984
0
10000
20000
30000
40000
50000
60000
70000
80000
0 20000 40000 60000 80000
OV
conc
entra
tion
(mg/
kg)
MW concentration (mg/kg)
Mg
Soil sample
CRM
R² = 0.979
0
500
1000
1500
2000
2500
3000
3500
4000
4500
0 1000 2000 3000 4000 5000
OV
conc
entra
tion
(mg/
kg)
MW concentration (mg/kg)
Mn
Soil sample
CRM
R² = 0.981
0
100
200
300
400
500
600
700
0 200 400 600 800
OV
con
cent
ratio
n (m
g/kg
)
MW concentration (mg/kg)
Ni
Soil sample
CRM
R² = 0.971
0
500
1000
1500
2000
2500
3000
0 500 1000 1500 2000 2500 3000
OV
conc
entra
tion
(mg/
kg)
MW concentration (mg/kg)
P
Soil sample
CRM
R² = 0.977
0
50
100
150
200
250
300
0 100 200 300
OV
conc
entra
tion
(mg/
kg)
MW concentration (mg/kg)
Pb
Soil sample
CRM
R² = 0.973
0
10
20
30
40
50
60
0 20 40 60
OV
conc
entra
tion
(mg/
kg)
MW concentration (mg/kg)
Sb
Soil sample
CRM
R² = 0.971
0
50
100
150
200
250
300
0 100 200 300
OV
con
cent
ratio
n (m
g/kg
)
MW concentration (mg/kg)
V
Soil sample
CRM
R² = 0.975
0
50
100
150
200
250
300
350
400
450
0 100 200 300 400
OV
conc
entra
tion
(mg/
kg)
MW concentration (mg/kg)
Zn
Soil sample
CRM

23/04/2014 Page 19 of 31
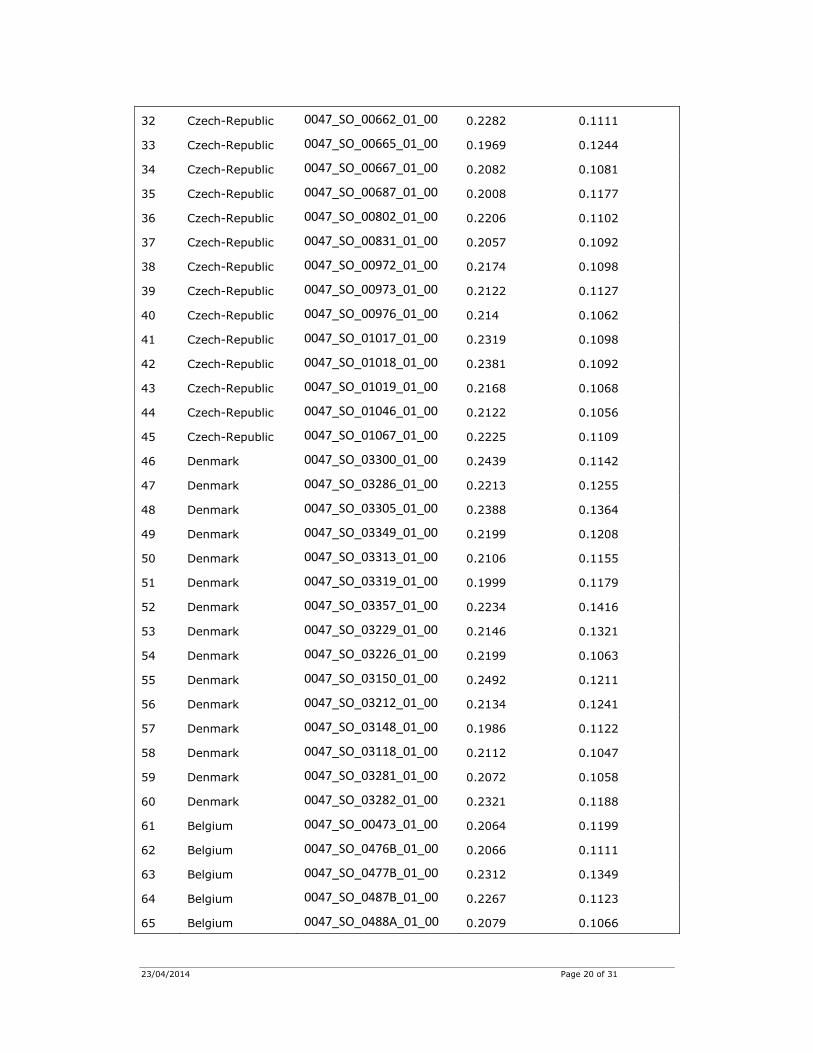
Annex B – List of soil samples used in the comparison study
N. Country Samples code OV weight(g) MW weight(g)
1 Estonia 0047_SO_03360_01_00 0.2304 0.1054
2 Estonia 0047_SO_03370_01_00 0.2320 0.1353
3 Estonia 0047_SO_03380_01_00 0.2084 0.1025
4 Estonia 0047_SO_03381_01_00 0.2208 0.1051
5 Estonia 0047_SO_03382_01_00 0.2078 0.1064
6 Estonia 0047_SO_03383_01_00 0.2191 0.1124
7 Estonia 0047_SO_03398_01_00 0.2072 0.1022
8 Estonia 0047_SO_03425_01_00 0.2474 0.1069
9 Estonia 0047_SO_03426_01_00 0.2114 0.1122
10 Estonia 0047_SO_03450_01_00 0.2036 0.1095
11 Estonia 0047_SO_03507_01_00 0.2092 0.1188
12 Estonia 0047_SO_03595_01_00 0.2019 0.1062
13 Estonia 0047_SO_03600_01_00 0.2088 0.1126
14 Estonia 0047_SO_03612_01_00 0.2244 0.1101
15 Estonia 0047_SO_03613_01_00 0.1999 0.1069
16 Finland 0047_SO_06481_01_00 0.2056 0.1027
17 Finland 0047_SO_06624_01_00 0.1973 0.1318
18 Finland 0047_SO_06937_01_00 0.2124 0.1014
19 Finland 0047_SO_07014_01_00 0.2063 0.1006
20 Finland 0047_SO_07031_01_00 0.2148 0.1135
21 Finland 0047_SO_07207_01_00 0.2101 0.1161
22 Finland 0047_SO_07213_01_00 0.2064 0.1179
23 Finland 0047_SO_07279_01_00 0.2021 0.1057
24 Finland 0047_SO_07546_01_00 0.2028 0.1025
25 Finland 0047_SO_07721_01_00 0.2041 0.1022
26 Finland 0047_SO_07750_01_00 0.2069 0.1226
27 Finland 0047_SO_07918_01_00 0.2079 0.1216
28 Finland 0047_SO_07944_01_00 0.2152 0.1268
29 Finland 0047_SO_08318_01_00 0.2038 0.1053
30 Finland 0047_SO_43025_01_00 0.2126 0.113
31 Czech-Republic 0047_SO_0646B_01_00 0.2031 0.1352
23/04/2014 Page 20 of 31
32 Czech-Republic 0047_SO_00662_01_00 0.2282 0.1111
33 Czech-Republic 0047_SO_00665_01_00 0.1969 0.1244
34 Czech-Republic 0047_SO_00667_01_00 0.2082 0.1081
35 Czech-Republic 0047_SO_00687_01_00 0.2008 0.1177
36 Czech-Republic 0047_SO_00802_01_00 0.2206 0.1102
37 Czech-Republic 0047_SO_00831_01_00 0.2057 0.1092
38 Czech-Republic 0047_SO_00972_01_00 0.2174 0.1098
39 Czech-Republic 0047_SO_00973_01_00 0.2122 0.1127
40 Czech-Republic 0047_SO_00976_01_00 0.214 0.1062
41 Czech-Republic 0047_SO_01017_01_00 0.2319 0.1098
42 Czech-Republic 0047_SO_01018_01_00 0.2381 0.1092
43 Czech-Republic 0047_SO_01019_01_00 0.2168 0.1068
44 Czech-Republic 0047_SO_01046_01_00 0.2122 0.1056
45 Czech-Republic 0047_SO_01067_01_00 0.2225 0.1109
46 Denmark 0047_SO_03300_01_00 0.2439 0.1142
47 Denmark 0047_SO_03286_01_00 0.2213 0.1255
48 Denmark 0047_SO_03305_01_00 0.2388 0.1364
49 Denmark 0047_SO_03349_01_00 0.2199 0.1208
50 Denmark 0047_SO_03313_01_00 0.2106 0.1155
51 Denmark 0047_SO_03319_01_00 0.1999 0.1179
52 Denmark 0047_SO_03357_01_00 0.2234 0.1416
53 Denmark 0047_SO_03229_01_00 0.2146 0.1321
54 Denmark 0047_SO_03226_01_00 0.2199 0.1063
55 Denmark 0047_SO_03150_01_00 0.2492 0.1211
56 Denmark 0047_SO_03212_01_00 0.2134 0.1241
57 Denmark 0047_SO_03148_01_00 0.1986 0.1122
58 Denmark 0047_SO_03118_01_00 0.2112 0.1047
59 Denmark 0047_SO_03281_01_00 0.2072 0.1058
60 Denmark 0047_SO_03282_01_00 0.2321 0.1188
61 Belgium 0047_SO_00473_01_00 0.2064 0.1199
62 Belgium 0047_SO_0476B_01_00 0.2066 0.1111
63 Belgium 0047_SO_0477B_01_00 0.2312 0.1349
64 Belgium 0047_SO_0487B_01_00 0.2267 0.1123
65 Belgium 0047_SO_0488A_01_00 0.2079 0.1066
23/04/2014 Page 21 of 31
66 Belgium 0047_SO_0488B_01_00 0.2112 0.1122
67 Belgium 0047_SO_0492B_01_00 0.2133 0.1065
68 Belgium 0047_SO_0497B_01_00 0.2077 0.1041
69 Belgium 0047_SO_00505_01_00 0.2212 0.1067
70 Belgium 0047_SO_00508_01_00 0.2087 0.1117
71 Belgium 0047_SO_00554_01_00 0.2327 0.1165
72 Belgium 0047_SO_00562_01_00 0.2146 0.1141
73 Belgium 0047_SO_00563_01_00 0.2134 0.1057
74 Belgium 0047_SO_00565_01_00 0.2026 0.1117
75 Belgium 0047_SO_00581_01_00 0.2019 0.1032
76 Austria 0047_SO_00001_01_00 0.2167 0.1074
77 Austria 0047_SO_00002_01_00 0.2029 0.1014
78 Austria 0047_SO_00004_01_00 0.2077 0.1011
79 Austria 0047_SO_00015_01_00 0.2022 0.1058
80 Austria 0047_SO_00017_01_00 0.2222 0.1407
81 Austria 0047_SO_00019_01_00 0.2006 0.1036
82 Austria 0047_SO_00040_01_00 0.2151 0.1143
83 Austria 0047_SO_00047_01_00 0.2085 0.1144
84 Austria 0047_SO_00151_01_00 0.2024 0.1298
85 Austria 0047_SO_00160_01_00 0.2117 0.1193
86 Austria 0047_SO_00161_01_00 0.2235 0.1168
87 Austria 0047_SO_00167_01_00 0.2043 0.0996
88 Austria 0047_SO_00221_01_00 0.2157 0.1176
89 Austria 0047_SO_00372_01_00 0.2121 0.1224
90 Austria 0047_SO_00464_01_00 0.2056 0.1097
91 Ireland 0047_SO_12773_01_00 0.2032 0.1026
92 Ireland 0047_SO_12774_01_00 0.2222 0.1326
93 Ireland 0047_SO_12775_01_00 0.2085 0.1012
94 Ireland 0047_SO_12776_01_00 0.2222 0.1095
95 Ireland 0047_SO_12832_01_00 0.2221 0.1097
96 Ireland 0047_SO_12834_01_00 0.2027 0.1257
97 Ireland 0047_SO_12892_01_00 0.2058 0.1046
98 Ireland 0047_SO_12893_01_00 0.2178 0.1248
99 Ireland 0047_SO_12894_01_00 0.2125 0.1052

23/04/2014 Page 22 of 31
100 Ireland 0047_SO_12895_01_00 0.2188 0.1041
101 Ireland 0047_SO_12901_01_00 0.2111 0.1072
102 Ireland 0047_SO_12903_01_00 0.2228 0.1022
103 Ireland 0047_SO_12946_01_00 0.2212 0.1208
104 Ireland 0047_SO_12950_01_00 0.2134 0.1138
105 Ireland 0047_SO_12951_01_00 0.2111 0.1132
106 France 0047_SO_08493_01_00 0.2204 0.1135
107 France 0047_SO_08525_01_00 0.2165 0.1341
108 France 0047_SO_08913_01_00 0.2068 0.1251
109 France 0047_SO_08966_01_00 0.2139 0.1287
110 France 0047_SO_09127_01_00 0.2295 0.1316
111 France 0047_SO_09309_01_00 0.2081 0.1155
112 France 0047_SO_09519_01_00 0.2168 0.1157
113 France 0047_SO_09649_01_00 0.2111 0.1225
114 France 0047_SO_10069_01_00 0.2005 0.1267
115 France 0047_SO_10220_01_00 0.2013 0.107
116 France 0047_SO_10519_01_00 0.2142 0.1334
117 France 0047_SO_10968_01_00 0.1996 0.108
118 France 0047_SO_10992_01_00 0.2187 0.1079
119 France 0047_SO_10995_01_00 0.2109 0.1027
120 France 0047_SO_10998_01_00 o.2123 0.1019
121 Latvia 0047_SO_15245_01_00 0.2011 0.1373
122 Latvia 0047_SO_15255_01_00 0.2003 0.1175
123 Latvia 0047_SO_15257_01_00 0.2095 0.1094
124 Latvia 0047_SO_15272_01_00 0.2184 0.1222
125 Latvia 0047_SO_15334_01_00 0.2141 0.1073
126 Latvia 0047_SO_15369_01_00 0.2266 0.1103
127 Latvia 0047_SO_15386_01_00 0.2094 0.1125
128 Latvia 0047_SO_15458_01_00 0.2088 0.1298
129 Latvia 0047_SO_15463_01_00 0.2341 0.1214
130 Latvia 0047_SO_15487_01_00 0.2294 0.11
131 Latvia 0047_SO_15497_01_00 0.2076 0.1268
132 Latvia 0047_SO_15499_01_00 0.2277 0.1142
133 Latvia 0047_SO_15501_01_00 0.2301 0.1097

23/04/2014 Page 23 of 31
134 Latvia 0047_SO_15502_01_00 0.2128 0.1182
135 Latvia 0047_SO_15503_01_00 0.2127 0.1092
136 Hungary 0047_SO_12232_01_00 0.2046 0.1145
137 Hungary 0047_SO_12249_01_00 0.2267 0.1115
138 Hungary 0047_SO_12260_01_00 0.1997 0.1134
139 Hungary 0047_SO_12332_01_00 0.2014 0.1134
140 Hungary 0047_SO_12343_01_00 0.2197 0.1078
141 Hungary 0047_SO_12350_01_00 0.2013 0.1175
142 Hungary 0047_SO_12441_01_00 0.1974 0.1199
143 Hungary 0047_SO_12444_01_00 0.2315 0.1129
144 Hungary 0047_SO_12474_01_00 0.2097 0.1189
145 Hungary 0047_SO_12497_01_00 0.2019 0.1037
146 Hungary 0047_SO_12502_01_00 0.2156 0.1154
147 Hungary 0047_SO_12504_01_00 0.2225 0.1134
148 Hungary 0047_SO_12654_01_00 0.2132 0.1065
149 Hungary 0047_SO_12711_01_00 0.2212 0.1172
150 Hungary 0047_SO_12716_01_00 0.2032 0.1135
151 Portugal 0047_SO_17635_01_00 0.2009 0.1042
152 Portugal 0047_SO_17650_01_00 0.2322 0.1234
153 Portugal 0047_SO_17762_01_00 0.2003 0.1238
154 Portugal 0047_SO_17769_01_00 0.2093 0.1113
155 Portugal 0047_SO_17795_01_00 0.205 0.1174
156 Portugal 0047_SO_17923_01_00 0.2145 0.1178
157 Portugal 0047_SO_17937_01_00 0.2146 0.1253
158 Portugal 0047_SO_17957_01_00 0.2149 0.1266
159 Portugal 0047_SO_18019_01_00 0.2275 0.1286
160 Portugal 0047_SO_18022_01_00 0.2122 0.1098
161 Portugal 0047_SO_18047_01_00 0.2117 0.1477
162 Portugal 0047_SO_18087_01_00 0.2031 0.1298
163 Portugal 0047_SO_18102_01_00 0.2159 0.1189
164 Portugal 0047_SO_18109_01_00 0.2192 0.1125
165 Portugal 0047_SO_18111_01_00 0.2063 0.1168
166 Slovakia 0047_SO_20936_01_00 0.2061 0.1328
167 Slovakia 0047_SO_20937_01_00 0.2055 0.1279

23/04/2014 Page 24 of 31
168 Slovakia 0047_SO_20938_01_00 0.2161 0.1189
169 Slovakia 0047_SO_20939_01_00 0.2173 0.1152
170 Slovakia 0047_SO_20940_01_00 0.2041 0.1421
171 Slovakia 0047_SO_20941_01_00 0.2028 0.1349
172 Slovakia 0047_SO_20942_01_00 0.2294 0.1357
173 Slovakia 0047_SO_20943_01_00 0.2038 0.1038
174 Slovakia 0047_SO_20944_01_00 0.2118 0.1133
175 Slovakia 0047_SO_20948_01_00 0.2092 0.1386
176 Slovakia 0047_SO_20951_01_00 0.2136 0.1291
177 Slovakia 0047_SO_20953_01_00 0.2095 0.1331
178 Slovakia 0047_SO_20963_01_00 0.2087 0.1239
179 Slovakia 0047_SO_21072_01_00 0.2088 0.1166
180 Slovakia 0047_SO_21073_01_00 0.2187 0.1064
181 Italy 0047_SO_13241_01_00 0.2228 0.1134
182 Italy 0047_SO_13245_01_00 0.2248 0.1228
183 Italy 0047_SO_13252_01_00 0.2156 0.1194
184 Italy 0047_SO_13256_01_00 0.2247 0.1092
185 Italy 0047_SO_13313_01_00 0.2301 0.1016
186 Italy 0047_SO_13354_01_00 0.2308 0.1397
187 Italy 0047_SO_13355_01_00 0.2173 0.1102
188 Italy 0047_SO_14148_01_00 0.2353 0.1077
189 Italy 0047_SO_14370_01_00 0.2091 0.1183
190 Italy 0047_SO_14371_01_00 0.2153 0.1088
191 Italy 0047_SO_14372_01_00 0.2013 0.1062
192 Italy 0047_SO_14390_01_00 0.2081 0.1438
193 Italy 0047_SO_14413_01_00 0.2153 0.1199
194 Italy 0047_SO_14565_01_00 0.2222 0.1245
195 Italy 0047_SO_14577_01_00 0.2111 0.1075
196 Germany 0047_SO_01269_01_00 0.2056 0.1247
197 Germany 0047_SO_01326_01_00 0.2257 0.1022
198 Germany 0047_SO_01339_01_00 0.2305 0.1055
199 Germany 0047_SO_01392_01_00 0.2217 0.1033
200 Germany 0047_SO_01640_01_00 0.2171 0.1287
201 Germany 0047_SO_01697_01_00 0.2352 0.0952
23/04/2014 Page 25 of 31
202 Germany 0047_SO_01707_01_00 0.2095 0.1121
203 Germany 0047_SO_02278_01_00 0.2159 0.1137
204 Germany 0047_SO_02288_01_00 0.2089 0.1291
205 Germany 0047_SO_02429_01_00 0.2198 0.1009
206 Germany 0047_SO_02456_01_00 0.2098 0.1151
207 Germany 0047_SO_02457_01_00 0.2076 0.1068
208 Germany 0047_SO_02597_01_00 0.2255 0.1116
209 Germany 0047_SO_02665_01_00 0.2352 0.1197
210 Germany 0047_SO_02869_01_00 0.2035 0.1036
211 Poland 0047_SO_16160_01_00 0.2031 0.1112
212 Poland 0047_SO_16399_01_00 0.2226 0.1308
213 Poland 0047_SO_16409_01_00 0.2323 0.1222
214 Poland 0047_SO_16504_01_00 0.2078 0.142
215 Poland 0047_SO_16659_01_00 0.2113 0.1765
216 Poland 0047_SO_16677_01_00 0.2043 0.0997
217 Poland 0047_SO_16697_01_00 0.2228 0.1099
218 Poland 0047_SO_16732_01_00 0.2198 0.1045
219 Poland 0047_SO_16733_01_00 0.2229 0.1277
220 Poland 0047_SO_16744_01_00 0.2042 0.1159
221 Poland 0047_SO_17245_01_00 0.2085 0.1159
222 Poland 0047_SO_17251_01_00 0.2021 0.1094
223 Poland 0047_SO_17426_01_00 0.2145 0.1055
224 Poland 0047_SO_17511_01_00 0.2026 0.1118
225 Poland 0047_SO_17532_01_00 0.2296 0.1442
226 Netherland 0047_SO_15609_01_00 0.2056 0.1154
227 Netherland 0047_SO_15611_01_00 0.2053 0.1128
228 Netherland 0047_SO_15612_01_00 0.2297 0.1217
229 Netherland 0047_SO_15623_01_00 0.2226 0.1388
230 Netherland 0047_SO_15711_01_00 0.2133 0.1094
231 Netherland 0047_SO_15714_01_00 0.2084 0.1145
232 Netherland 0047_SO_15740_01_00 0.2302 0.1143
233 Netherland 0047_SO_15741_01_00 0.2292 0.1009
234 Netherland 0047_SO_15743_01_00 0.2192 0.1064
235 Netherland 0047_SO_15744_01_00 0.2154 0.1047

23/04/2014 Page 26 of 31
236 Netherland 0047_SO_15745_01_00 0.2123 0.1075
237 Netherland 0047_SO_15804_01_00 0.2174 0.1075
238 Netherland 0047_SO_15811_01_00 0.2226 0.1109
239 Netherland 0047_SO_15814_01_00 0.2335 0.1113
240 Netherland 0047_SO_15819_01_00 0.2025 0.1181
241 UK 0047_SO_21081_01_00 0.2052 0.1122
242 UK 0047_SO_21095_01_00 0.1989 0.1061
243 UK 0047_SO_21096_01_00 0.2073 0.1024
244 UK 0047_SO_21241_01_00 0.2302 0.1065
245 UK 0047_SO_21386_01_00 0.2391 0.1053
246 UK 0047_SO_21405_01_00 0.224 0.1163
247 UK 0047_SO_21462_01_00 0.2201 0.1182
248 UK 0047_SO_21835_01_00 0.228 0.124
249 UK 0047_SO_21937_01_00 0.2006 0.1135
250 UK 0047_SO_21939_01_00 0.2176 0.1237
251 UK 0047_SO_22309_01_00 0.2205 0.1142
252 UK 0047_SO_22319_01_00 0.2279 0.1045
253 UK 0047_SO_22335_01_00 0.2325 0.1213
254 UK 0047_SO_22336_01_00 0.2176 0.1045
255 UK 0047_SO_22433_01_00 0.2147 0.1205
256 Greece 0047_SO_11547_01_00 0.2116 0.1155
257 Greece 0047_SO_11829_01_00 0.2023 0.1179
258 Greece 0047_SO_11832_01_00 0.2137 0.1224
259 Greece 0047_SO_11849_01_00 0.2067 0.1394
260 Greece 0047_SO_11851_01_00 0.2202 0.1118
261 Greece 0047_SO_11857_01_00 0.2065 0.1025
262 Greece 0047_SO_11869_01_00 0.2089 0.0996
263 Greece 0047_SO_11873_01_00 0.2236 0.1127
264 Greece 0047_SO_11883_01_00 0.2032 0.1106
265 Greece 0047_SO_11890_01_00 0.2038 0.1078
266 Greece 0047_SO_11914_01_00 0.2059 0.1295
267 Greece 0047_SO_11970_01_00 0.2161 0.125
268 Greece 0047_SO_12095_01_00 0.2074 0.1332
269 Greece 0047_SO_12097_01_00 0.2142 0.1133
23/04/2014 Page 27 of 31
270 Greece 0047_SO_12099_01_00 0.2005 0.1411
271 Sweden 0047_SO_18150_01_00 0.2025 0.1255
272 Sweden 0047_SO_18246_01_00 0.2075 0.103
273 Sweden 0047_SO_18499_01_00 0.2218 0.1055
274 Sweden 0047_SO_19210_01_00 0.2129 0.1364
275 Sweden 0047_SO_19310_01_00 0.2038 0.0968
276 Sweden 0047_SO_19495_01_00 0.2057 0.1152
277 Sweden 0047_SO_19739_01_00 0.2289 0.1259
278 Sweden 0047_SO_19746_01_00 0.2072 0.1107
279 Sweden 0047_SO_19785_01_00 0.2065 0.1153
280 Sweden 0047_SO_19807_01_00 0.2297 0.1287
281 Sweden 0047_SO_19812_01_00 0.2305 0.1233
282 Sweden 0047_SO_19814_01_00 0.2008 0.1147
283 Sweden 0047_SO_19816_01_00 0.215 0.1018
284 Sweden 0047_SO_20061_01_00 0.1995 0.1182
285 Sweden 0047_SO_20510_01_00 0.206 0.1116
286 Sweden 0047_SO_18546_01_00 0.1965 0.1135
287 Sweden 0047_SO_18645_01_00 0.2127 0.1285
288 Luxembourg 0047_SO_15226_01_00 0.2029 0.1067
289 Luxembourg 0047_SO_15227_01_00 0.212 0.1289
290 Luxembourg 0047_SO_15228_01_00 0.2078 0.1154
291 Luxembourg 0047_SO_15229_01_00 0.2109 0.1113
292 Luxembourg 0047_SO_15230_01_00 0.2058 0.1168
293 Luxembourg 0047_SO_15231_01_00 0.2056 0.1083
294 Luxembourg 0047_SO_15232_01_00 0.1946 0.1015
295 Luxembourg 0047_SO_15233_01_00 0.2011 0.1115
296 Luxembourg 0047_SO_15234_01_00 0.2017 0.1076
297 Luxembourg 0047_SO_15236_01_00 0.2019 0.1191
298 Luxembourg 0047_SO_15238_01_00 0.2243 0.1045
299 Luxembourg 0047_SO_15240_01_00 0.2037 0.1184
300 Luxembourg 0047_SO_15241_01_00 0.2001 0.1271
301 Spain 0047_SO_03702_01_00 0.2195 0.1077
302 Spain 0047_SO_04044_01_00 0.2031 0.1086
303 Spain 0047_SO_04143_01_00 0.2022 0.1079

23/04/2014 Page 28 of 31
304 Spain 0047_SO_04226_01_00 0.2049 0.1242
305 Spain 0047_SO_04810_01_00 0.2055 0.1022
306 Spain 0047_SO_05078_01_00 0.2115 0.1154
307 Spain 0047_SO_05120_01_00 0.2004 0.1072
308 Spain 0047_SO_05379_01_00 0.2112 0.1103
309 Spain 0047_SO_05406_01_00 0.2002 0.1067
310 Spain 0047_SO_05491_01_00 0.2024 0.1036
311 Spain 0047_SO_05648_01_00 0.2003 0.1157
312 Spain 0047_SO_05675_01_00 0.2109 0.1134
313 Spain 0047_SO_05751_01_00 0.2133 0.1184
314 Spain 0047_SO_06075_01_00 0.2028 0.1045
315 Spain 0047_SO_06155_01_00 0.2012 0.1147
316 Lithuania 0047_SO_14864_01_00 0.2014 0.1148
317 Lithuania 0047_SO_14868_01_00 0.2257 0.112
318 Lithuania 0047_SO_14873_01_00 0.2097 0.1017
319 Lithuania 0047_SO_14966_01_00 0.2134 0.1177
320 Lithuania 0047_SO_14967_01_00 0.2145 0.1287
321 Lithuania 0047_SO_14976_01_00 0.2068 0.1245
322 Lithuania 0047_SO_14977_01_00 0.2127 0.1111
323 Lithuania 0047_SO_14985_01_00 0.2178 0.1256
324 Lithuania 0047_SO_15089_01_00 0.2109 0.1295
325 Lithuania 0047_SO_15090_01_00 0.2136 0.1374
326 Lithuania 0047_SO_15177_01_00 0.2085 0.1289
327 Lithuania 0047_SO_15178_01_00 0.1961 0.1143
328 Lithuania 0047_SO_15179_01_00 0.2364 0.1119
329 Lithuania 0047_SO_15182_01_00 0.2081 0.1142
330 Lithuania 0047_SO_15186_01_00 0.2231 0.1037
331 Malta 0047_SO_30000_01_00 0.2143 0.1055
332 Malta 0047_SO_30001_01_00 0.2223 0.1102
333 Malta 0047_SO_30002_01_00 0.2148 0.1228
334 Malta 0047_SO_30003_01_00 0.2115 0.1331
335 Malta 0047_SO_30004_01_00 0.2241 0.1086
336 Malta 0047_SO_30005_01_00 0.2288 0.1015
337 Malta 0047_SO_30007_01_00 0.2242 0.1125

23/04/2014 Page 29 of 31
338 Malta 0047_SO_30008_01_00 0.215 0.1134
339 Malta 0047_SO_30009_01_00 0.2064 0.1094
340 Malta 0047_SO_30011_01_00 0.2253 0.1125
341 Malta 0047_SO_30012_01_00 0.2208 0.1071
342 Malta 0047_SO_30013_01_00 0.2177 0.1185
343 Malta 0047_SO_30015_01_00 0.2319 0.1112
344 Malta 0047_SO_30016_01_00 0.2043 0.1025
345 Malta 0047_SO_30017_01_00 0.1973 0.1021
346 Cyprus 0047_SO_31001_01_00 0.2025 0.1072
347 Cyprus 0047_SO_31002_01_00 0.2259 0.1068
348 Cyprus 0047_SO_31004_01_00 0.2103 0.1233
349 Cyprus 0047_SO_31006_01_00 0.2291 0.1254
350 Cyprus 0047_SO_31019_01_00 0.2094 0.1125
351 Cyprus 0047_SO_31023_01_00 0.216 0.1274
352 Cyprus 0047_SO_31025_01_00 0.2237 0.1172
353 Cyprus 0047_SO_31037_01_00 0.2288 0.1272
354 Cyprus 0047_SO_31044_01_00 0.2153 0.1134
355 Cyprus 0047_SO_31045_01_00 0.2396 0.1095
356 Cyprus 0047_SO_31048_01_00 0.2076 0.1089
357 Cyprus 0047_SO_31063_01_00 0.2138 0.1072
358 Cyprus 0047_SO_31084_01_00 0.2041 0.1033
359 Cyprus 0047_SO_31089_01_00 0.2354 0.1113
360 Cyprus 0047_SO_31101_01_00 0.2224 0.1282
361 Slovenia 0047_SO_20741_01_00 0.2081 0.1062
362 Slovenia 0047_SO_20742_01_00 0.2015 0.1138
363 Slovenia 0047_SO_20743_01_00 0.2005 0.1163
364 Slovenia 0047_SO_20744_01_00 0.2358 0.1063
365 Slovenia 0047_SO_20748_01_00 0.2092 0.1005
366 Slovenia 0047_SO_20751_01_00 0.2197 0.1125
367 Slovenia 0047_SO_20752_01_00 0.2154 0.1189
368 Slovenia 0047_SO_20753_01_00 0.2388 0.1035
369 Slovenia 0047_SO_20754_01_00 0.1957 0.1304
370 Slovenia 0047_SO_20758_01_00 0.2127 0.1095
371 Slovenia 0047_SO_20759_01_00 0.2069 0.1106

23/04/2014 Page 30 of 31
372 Slovenia 0047_SO_20760_01_00 0.2223 0.1147
373 Slovenia 0047_SO_20761_01_00 0.2126 0.1089
374 Slovenia 0047_SO_20764_01_00 0.2314 0.1028
375 Slovenia 0047_SO_20765_01_00 0.2164 0.1159
376 Sweden 0047_SO_18287_01_00 0.2251 0.1037
377 Sweden 0047_SO_18529_01_00 0.2024 0.1141
378 Sweden 0047_SO_18535_01_00 0.2056 0.1107
379 Sweden 0047_SO_18536_01_00 0.2125 0.1161
380 Sweden 0047_SO_18541_01_00 0.2033 0.1133
381 Sweden 0047_SO_18543_01_00 0.2011 0.1154
382 Sweden 0047_SO_18545_01_00 0.2075 0.1063
383 Sweden 0047_SO_19027_01_00 0.2346 0.1255
384 Sweden 0047_SO_19057_01_00 0.2151 0.1193
385 Sweden 0047_SO_19058_01_00 0.2066 0.1091
386 Sweden 0047_SO_19059_01_00 0.2226 0.1005
387 Sweden 0047_SO_19060_01_00 0.2142 0.1156
388 Sweden 0047_SO_19061_01_00 0.2105 0.1123
389 Sweden 0047_SO_19063_01_00 0.2088 0.1166
390 Sweden 0047_SO_19069_01_00 0.2173 0.1085
391 Sweden 0047_SO_19072_01_00 0.2289 0.1058
392 Sweden 0047_SO_19822_01_00 0.2059 0.1036
393 Sweden 0047_SO_19103_01_00 0.2131 0.1014
394 Sweden 0047_SO_19113_01_00 0.2144 0.1193
395 Sweden 0047_SO_19128_01_00 0.2061 0.1065
396 Sweden 0047_SO_19129_01_00 0.2415 0.1099
397 Sweden 0047_SO_19522_01_00 0.2294 0.1146
398 Sweden 0047_SO_19523_01_00 0.2179 0.1268
399 Sweden 0047_SO_19526_01_00 0.2297 0.1018
400 Sweden 0047_SO_19527_01_00 0.2314 0.1079
401 Sweden 0047_SO_19528_01_00 0.2147 0.1145
402 Sweden 0047_SO_19529_01_00 0.2182 0.1028
403 Sweden 0047_SO_19530_01_00 0.2322 0.1137
404 Sweden 0047_SO_19547_01_00 0.2351 0.1222
405 Sweden 0047_SO_19548_01_00 0.1977 0.1022

23/04/2014 Page 31 of 31
406 Sweden 0047_SO_19549_01_00 0.2289 0.1056
407 Sweden 0047_SO_19555_01_00 0.2098 0.1151
408 Sweden 0047_SO_19832_01_00 0.2206 0.1077
409 Sweden 0047_SO_19838_01_00 0.2134 0.1022
410 Sweden 0047_SO_19087_01_00 0.2402 0.1123
411 Sweden 0047_SO_19094_01_00 0.2034 0.1066
412 Sweden 0047_SO_19095_01_00 0.2146 0.1277
413 Sweden 0047_SO_19100_01_00 0.2111 0.1123
414 Sweden 0047_SO_19110_01_00 0.2043 0.1067
415 Sweden 0047_SO_19111_01_00 0.1995 0.1263
416 Sweden 0047_SO_19121_01_00 0.2385 0.1216
417 Sweden 0047_SO_19130_01_00 0.2372 0.1157
418 Sweden 0047_SO_19133_01_00 0.2324 0.1032
419 Sweden 0047_SO_19134_01_00 0.2138 0.1136
420 Sweden 0047_SO_19524_01_00 0.2281 0.1069
421 Sweden 0047_SO_19550_01_00 0.2213 0.1062
422 Sweden 0047_SO_19551_01_00 0.2182 0.1016
423 Sweden 0047_SO_19552_01_00 0.2057 0.1198
424 Sweden 0047_SO_19553_01_00 0.2077 0.1079
425 Sweden 0047_SO_19554_01_00 0.1974 0.1026
426 Sweden 0047_SO_19556_01_00 0.2368 0.1132
427 Sweden 0047_SO_20117_01_00 0.1997 0.1213
428 Sweden 0047_SO_20121_01_00 0.2313 0.1183
429 Sweden 0047_SO_20122_01_00 0.2123 0.1227
430 Sweden 0047_SO_20123_01_00 0.2148 0.1115
431 Sweden 0047_SO_20124_01_00 0.2013 0.1119
432 Sweden 0047_SO_20127_01_00 0.1968 0.1162
433 Sweden 0047_SO_20138_01_00 0.2051 0.1225
434 Sweden 0047_SO_20276_01_00 0.2228 0.1038
435 Sweden 0047_SO_20277_01_00 0.2215 0.1215
436 Sweden 0047_SO_20282_01_00 0.2122 0.1076
437 Sweden 0047_SO_20418_01_00 0.2243 0.1429
438 Sweden 0047_SO_20447_01_00 0.2132 0.1303
439 Sweden 0047_SO_20602_01_00 0.2376 0.1157

23/04/2014 Page 32 of 31
440 Sweden 0047_SO_20613_01_00 0.2323 0.1152
441 Sweden 0047_SO_20615_01_00 0.2033 0.1048
442 Sweden 0047_SO_20620_01_00 0.2138 0.1376
443 Sweden 0047_SO_20658_01_00 0.2147 0.1122
444 Sweden 0047_SO_20118_01_00 0.2206 0.1212
445 Sweden 0047_SO_20125_01_00 0.2256 0.1053
446 Sweden 0047_SO_20141_01_00 0.2246 0.1066
447 Sweden 0047_SO_20274_01_00 0.2288 0.1108
448 Sweden 0047_SO_20275_01_00 0.2156 0.1136
449 Sweden 0047_SO_20278_01_00 0.2333 0.1191
450 Sweden 0047_SO_20280_01_00 0.1957 0.1022
451 Sweden 0047_SO_20283_01_00 0.2057 0.1188
452 Sweden 0047_SO_20417_01_00 0.2231 0.0994
453 Sweden 0047_SO_19003_01_00 0.2287 0.1184
454 Sweden 0047_SO_19009_01_00 0.2211 0.1063
455 Sweden 0047_SO_19014_01_00 0.2292 0.1054
456 Sweden 0047_SO_19016_01_00 0.2453 0.1196
457 Sweden 0047_SO_19017_01_00 0.226 0.1261
458 Sweden 0047_SO_19020_01_00 0.2167 0.1061
459 Sweden 0047_SO_19026_01_00 0.2064 0.1035
460 Sweden 0047_SO_19034_01_00 0.2258 0.1079
461 Sweden 0047_SO_19477_01_00 0.2284 0.1109
462 Sweden 0047_SO_19479_01_00 0.2122 0.1084
463 Sweden 0047_SO_19482_01_00 0.1941 0.1212
464 Sweden 0047_SO_19483_01_00 0.2411 0.1028
465 Sweden 0047_SO_19485_01_00 0.2101 0.1088
466 Sweden 0047_SO_19600_01_00 0.2102 0.1101
467 Sweden 0047_SO_19602_01_00 0.1964 0.1039
468 Sweden 0047_SO_19603_01_00 0.1826 0.1071
469 Sweden 0047_SO_19604_01_00 0.2375 0.1127
470 Sweden 0047_SO_19006_01_00 0.2339 0.1039
471 Sweden 0047_SO_19007_01_00 0.2072 0.1046
472 Sweden 0047_SO_19008_01_00 0.2096 0.1073
473 Sweden 0047_SO_19011_01_00 0.2146 0.1074
23/04/2014 Page 33 of 31
474 Sweden 0047_SO_19012_01_00 0.2239 0.1076
475 Sweden 0047_SO_19013_01_00 0.2266 0.1111
476 Sweden 0047_SO_19022_01_00 0.2019 0.1058
477 Sweden 0047_SO_19024_01_00 0.2292 0.1083
478 Sweden 0047_SO_19066_01_00 0.2154 0.1049
479 Sweden 0047_SO_19070_01_00 0.2366 0.1188
480 Sweden 0047_SO_19075_01_00 0.2063 0.1094
481 Sweden 0047_SO_19082_01_00 0.2189 0.1096
482 Sweden 0047_SO_19478_01_00 0.2412 0.1186
483 Sweden 0047_SO_19481_01_00 0.2322 0.1101
484 Sweden 0047_SO_19487_01_00 0.2377 0.1073
485 Sweden 0047_SO_19490_01_00 0.2003 0.1048
486 Sweden 0047_SO_19599_01_00 0.2326 0.1195
487 Sweden 0047_SO_18640_01_00 0.218 0.1352
488 Sweden 0047_SO_19062_01_00 0.2049 0.1325
489 Sweden 0047_SO_18547_01_00 0.2195 0.1041
490 Sweden 0047_SO_18635_01_00 0.2037 0.1027
491 Sweden 0047_SO_18521_01_00 0.2213 0.1013
492 Sweden 0047_SO_18540_01_00 0.2428 0.1049
493 Sweden 0047_SO_18530_01_00 0.1996 0.1186
494 Sweden 0047_SO_18534_01_00 0.2072 0.1088
495 Sweden 0047_SO_18537_01_00 0.2108 0.1041
496 Sweden 0047_SO_18539_01_00 0.2018 0.1107
497 Sweden 0047_SO_19525_01_00 0.2084 0.1032
498 Sweden 0047_SO_19847_01_00 0.2313 0.1008
499 Sweden 0047_SO_18542_01_00 0.2224 0.1032
500 Sweden 0047_SO_18544_01_00 0.2012 0.1255
23/04/2014 Page 34 of 31
References [1] Tóth G., Jones A., Montanarella L., Alewell C., Ballabio C., Carre F., de Brogniez D., Guicharnaud R., Gardi C., Hermann T, Meusburger K., Nocita M., Panagos P., Rusco E., Stevens A., van Liedekerke M., van Wesemael B., Weynants M., Yigini Y., 2013. LUCAS Topsoil Survey - methodology, data and results. EUR - Scientific and Technical Research Reports, JRC83529. Doi: 10.2788/97922. [2] European standard prEN 16174:2010. Sludge, treated biowaste and soil – Digestion of aqua regia soluble fractions of elements. European Committee for Standardization, CEN/TC 400. [3] Cristache C., Comero S., Locoro G., Fissiaux I., Alonso Ruiz A., Tanet G., Gawlik B.M., 2013. Validation of a horizontal method for trace elements in soil sludge and biowaste. EUR - Scientific and Technical Research Reports, JRC79587. Doi:10.2788/85983 [4] International Standard, ISO 11466:1995. Soil Quality – Extraction of trace elements soluble in aqua regia. International Organization for Standardization, Genève, Switzerland. [4] European standard prEN 16170:2010. Sludge, treated biowaste and soil – Determination of trace elements by inductively coupled plasma optical emission spectrometry (ICP-OES). European Committee for Standardization, CEN/TC 400.

Europe Direct is a service to help you find answers to your questions about the European Union Freephone number (*): 00 800 6 7 8 9 10 11 (*) Certain mobile telephone operators do not allow access to 00 800 numbers or these calls may be billed.
A great deal of additional information on the European Union is available on the Internet. It can be accessed through the Europa server http://europa.eu/. How to obtain EU publications Our priced publications are available from EU Bookshop (http://bookshop.europa.eu), where you can place an order with the sales agent of your choice. The Publications Office has a worldwide network of sales agents. You can obtain their contact details by sending a fax to (352) 29 29-42758. European Commission EUR 26636 EU – Joint Research Centre – Institute for Environment and Sustainability Title: Comparative study on open system digestion vs. microwave-assisted digestion methods for trace element analysis in agricultural soils. Author(s): Carmen Cristache, Sara Comero, Giovanni Locoro, Isabelle Fissiaux, Agustín Alonso Ruiz, Gergely Tóth and Bernd Manfred Gawlik Luxembourg: Publications Office of the European Union 2014 – 33 pp. – 21.0 x 29.7 cm EUR – Scientific and Technical Research series – ISSN 1831-9424 (online) ISBN 978-92-79-38176-8 (PDF) doi: 10.2788/79443 Abstract The aim of this work was to evaluate two different digestion procedures for the determination of the concentration of trace and major elements (As, Cd, Co, Cu, Cr, Fe, Mg, Mn, Ni, P, Pb, Sb, V, Zn) in five hundred randomly selected soil samples from LUCAS Soil Survey. The two procedures employed in sample preparation are the open vessel digestion, which is described in theISO 11466:1995 [1], and the microwave assisted digestion, implemented in the prEN16174 document [2]. Certified Reference Materials (NIST 2711 and BCR 141R) were also analysed using both pre-treatment approaches in order to determine sample recoveries and assess quality assurance and quality control (QA/QC) of the methods. Results obtained with samples and CRMs analysis are useful to compare the two tested digestion procedures for recovery rate,safety, cost and time taken. The results obtained from reference materials and soil samples revealed a good agreement between both procedures and thecertified values. T-test was also employed to evaluate the hypothesis of equal mean between concentration determined after theopen vessel and microwave-assisted digestions. This test demonstrates that, for the majority of the elements, the hypothesis isverified. The microwave procedure was then recommended as the method for the digestion of the 22 000 soil samples of theLUCAS Soil Survey, based on good precision and accuracy, speed and safety.

ISBN 978-92-79-38176-8
LB-NA-26636-E
N-N


