Bermudagrass management for improved production AND stand maintenance Dr. Dennis Hancock Extension...
33
Bermudagrass management for improved production AND stand maintenance Dr. Dennis Hancock Extension Forage Specialist UGA – Dept. of Crop and Soil Sciences
-
Upload
polly-james -
Category
Documents
-
view
217 -
download
0
Transcript of Bermudagrass management for improved production AND stand maintenance Dr. Dennis Hancock Extension...
Bermudagrass management for improved production AND stand maintenance
Bermudagrass management for improved production AND stand maintenance
Dr. Dennis HancockExtension Forage Specialist
UGA – Dept. of Crop and Soil Sciences
Dr. Dennis HancockExtension Forage Specialist
UGA – Dept. of Crop and Soil Sciences

OutlineOutlineOverview of Bermudagrass Forage
Production
Variety Selection
Establishment and Grow-in
• Fertilization Needs for production Nitrate (NO3) accumulation in
bermudagrass Use of urea-based fertilizers Needs for stand maintenance
• Harvesting methods
• Effects of Extended Grazing
• Burning

Nutrients Removed/Acre With Bermudagrass Hay or Corn
Silage
Nutrients Removed/Acre With Bermudagrass Hay or Corn
Silage
Nitrogen Phosphate Potash Calcium Mag0
50
100
150
200
250
300 6 Tons Bermudagrass Hay30 Tons Corn Silage
lbs/
acre
rem
oved
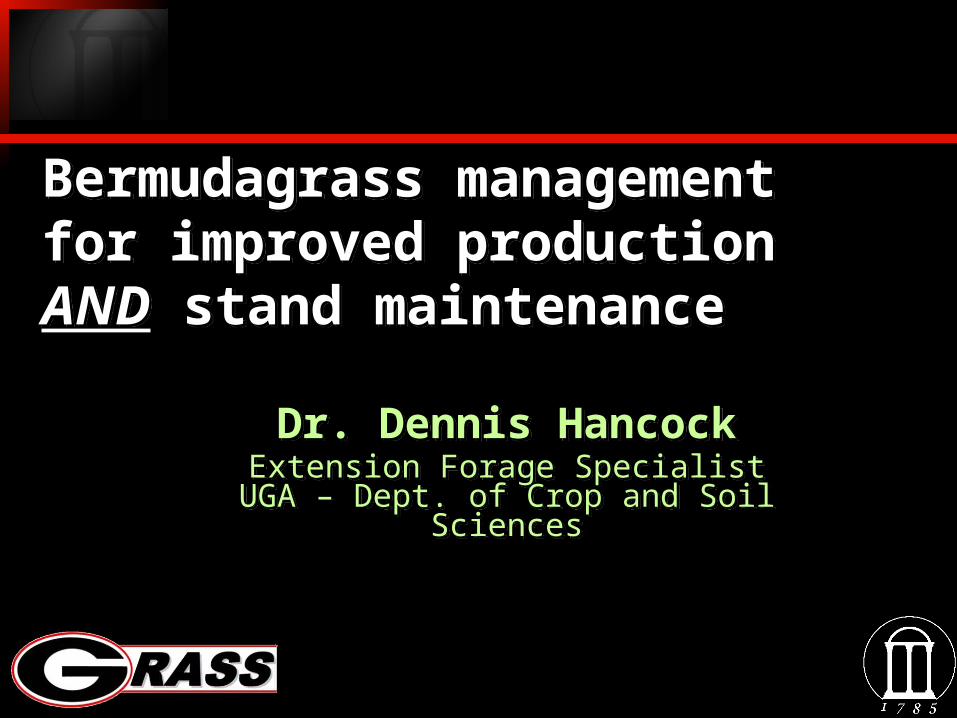
$44.50
$19.36 $3.62
$3.41
$8.95
$21.17
$4.26
Fertilizer Fuel & Repairs Interest on Var. CostsPesticides Labor Fixed & Mgmt CostsLime
Bermudagrass Hay Production – 2010Breakdown of Projected Costs
$105.27/ton
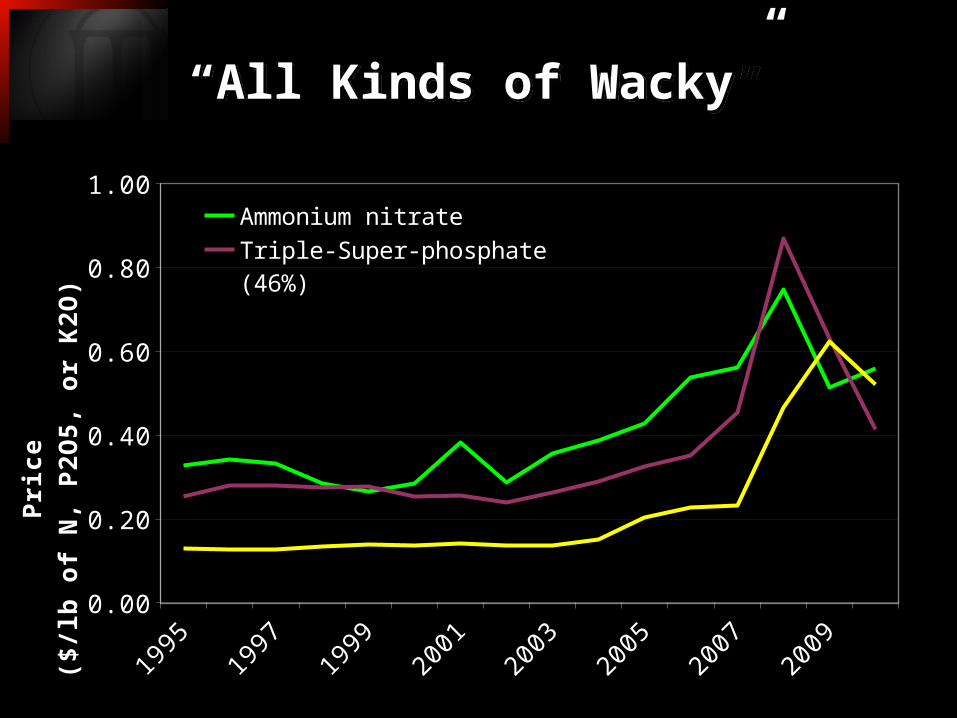
“All Kinds of Wacky”“All Kinds of Wacky”
1995
1996
1997
1998
1999
2000
2001
2002
2003
2004
2005
2006
2007
2008
2009
2010
0.00
0.20
0.40
0.60
0.80
1.00Ammonium nitrateTriple-Super-phosphate (46%)Potassium chloride (60%)
Pri
ce($
/lb o
f N
, P2O
5, o
r K
2O)

2001 2002 2003 2004 2005 2006 2007 2008 20090
10
20
30
40
50
60
70
80
90
100
Hay
Pric
es in
Geo
rgia
($/t
on o
f hay
)Georgia “Hay” Prices 2001-
2009Georgia “Hay” Prices 2001-
2009BE
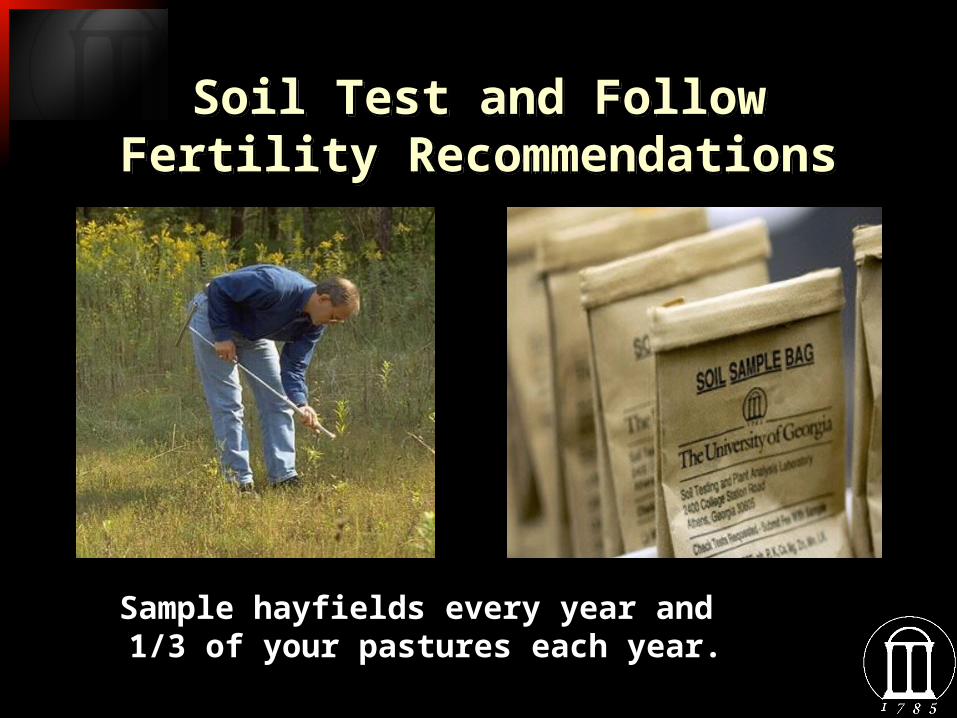
Soil Test and Follow Fertility Recommendations
Soil Test and Follow Fertility Recommendations
Sample hayfields every year and 1/3 of your pastures each year.
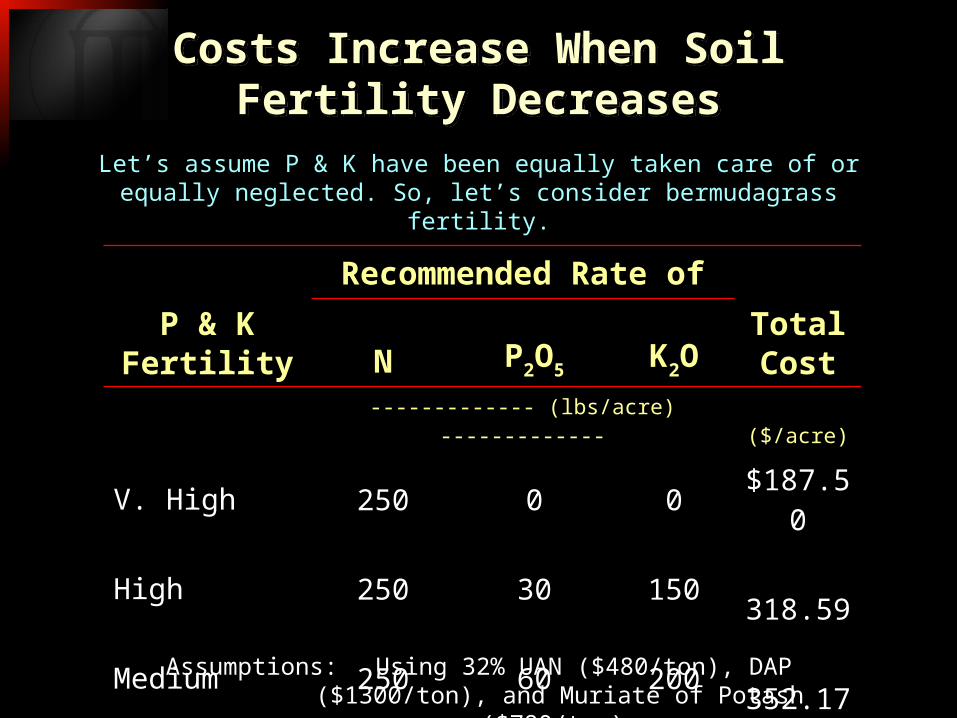
Costs Increase When Soil Fertility Decreases
Costs Increase When Soil Fertility Decreases
Recommended Rate of
P & K Fertility N P2O5 K2O
Total Cost
------------- (lbs/acre) ------------- ($/acre)
V. High 250 0 0 $187.50
High 250 30 150 318.59
Medium 250 60 200 352.17
Low 250 80 250 439.57
Assumptions: Using 32% UAN ($480/ton), DAP ($1300/ton), and Muriate of Potash ($780/ton).
Let’s assume P & K have been equally taken care of or equally neglected. So, let’s consider bermudagrass fertility.
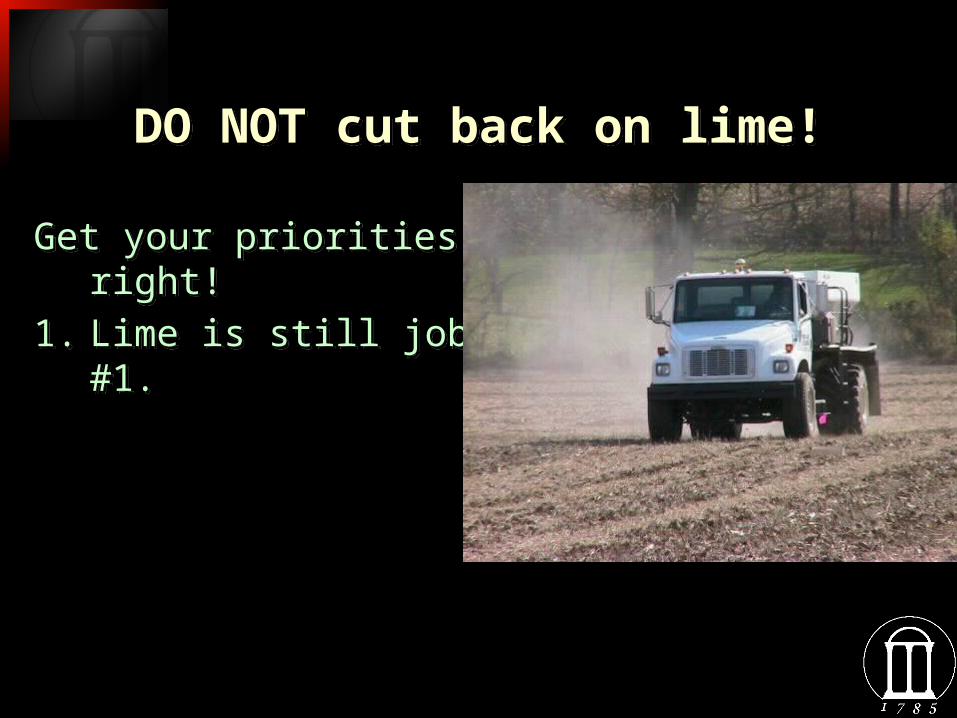
DO NOT cut back on lime!DO NOT cut back on lime!
Get your priorities right!
1. Lime is still job #1.
Get your priorities right!
1. Lime is still job #1.
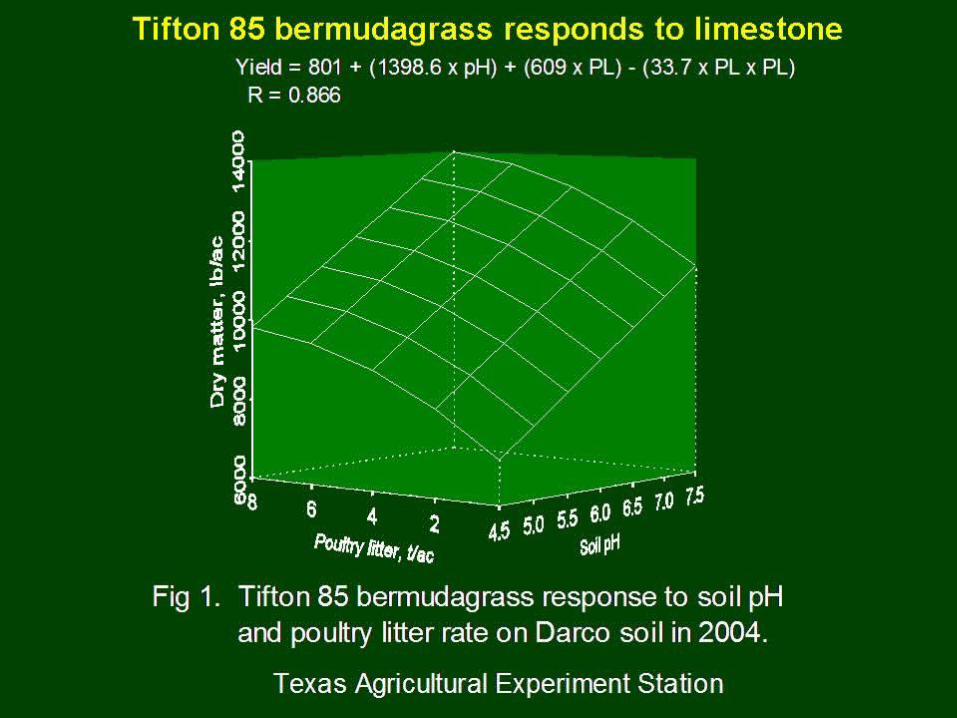

How Soil pH Affects Availability of Plant Nutrients
The difference of a soil pH of 5.6 vs. 6.2:
NutrientAmt. Used Annually
Unit Price
Dec. in Efficiency
Value of Decrease
(Lbs/acre) ($/lb) ($/acre)
N 200 $0.55 35% -$39
P2O5 50 $0.62 50% -$16
K2O 150 $0.63 10% -$9
Total -$64
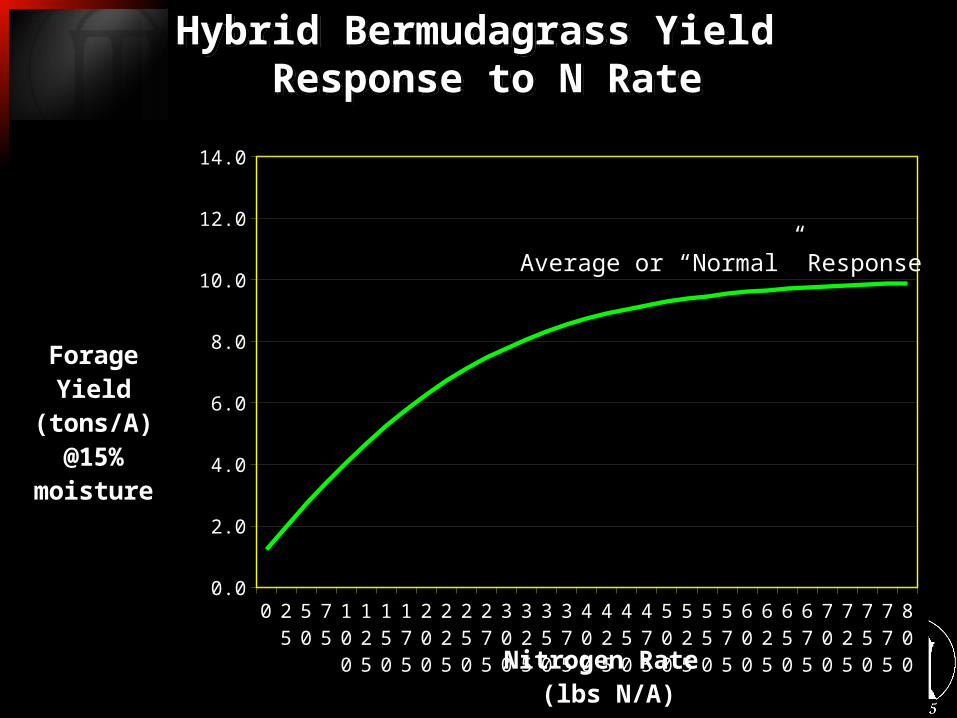
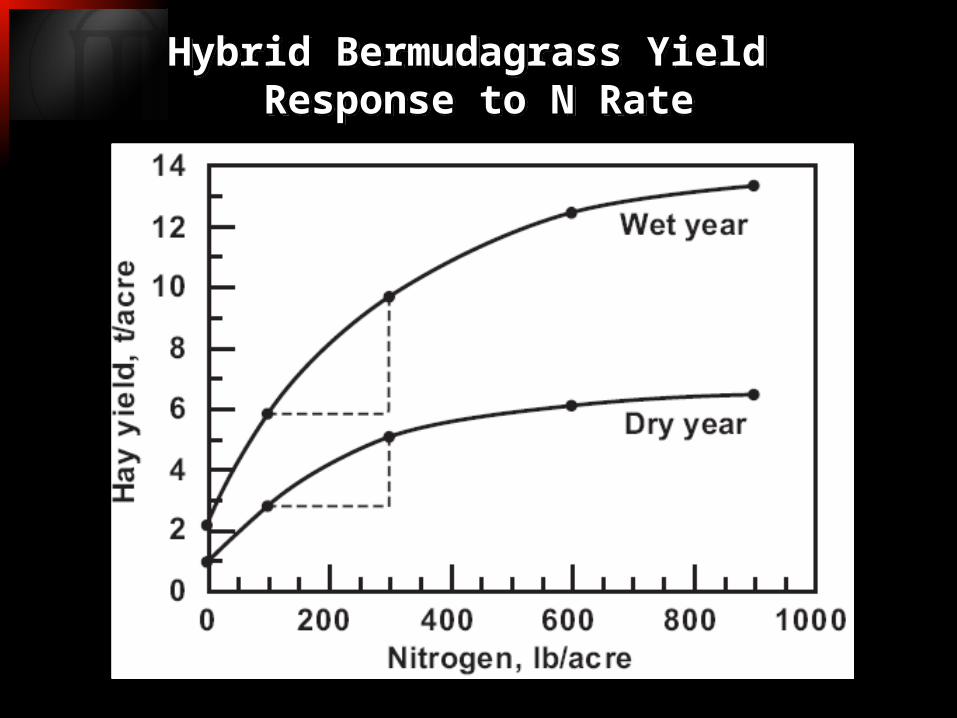
Hybrid Bermudagrass Yield Response to N Rate
Hybrid Bermudagrass Yield Response to N Rate
0 25
50
75
100
125
150
175
200
225
250
275
300
325
350
375
400
425
450
475
500
525
550
575
600
625
650
675
700
725
750
775
800
0.0
2.0
4.0
6.0
8.0
10.0
12.0
14.0
Nitrogen Rate (lbs N/A)
Forage Yield(tons/A)
@15% mois-ture
Average or “Normal” Response

Hybrid Bermudagrass Yield Response to N Rate
Hybrid Bermudagrass Yield Response to N Rate

Yield Response of Tifton 85 to N Rates2004-2007 on Fuquay (F) and Carnegie (C) soils in TiftonYield Response of Tifton 85 to N Rates
2004-2007 on Fuquay (F) and Carnegie (C) soils in Tifton
200 300 400 500 600 7005
6
7
8
9
10
11
12
f(x) = − 0.130892857142857 x² + 1.46425 x + 6.71700000000001f(x) = − 0.180178571428572 x² + 2.08839285714286 x + 4.955T 85 F
lbs N/A
Yiel
d(d
ry to
ns/A
)
Source: Dr. Bill Anderson, USDA-ARS Tifton
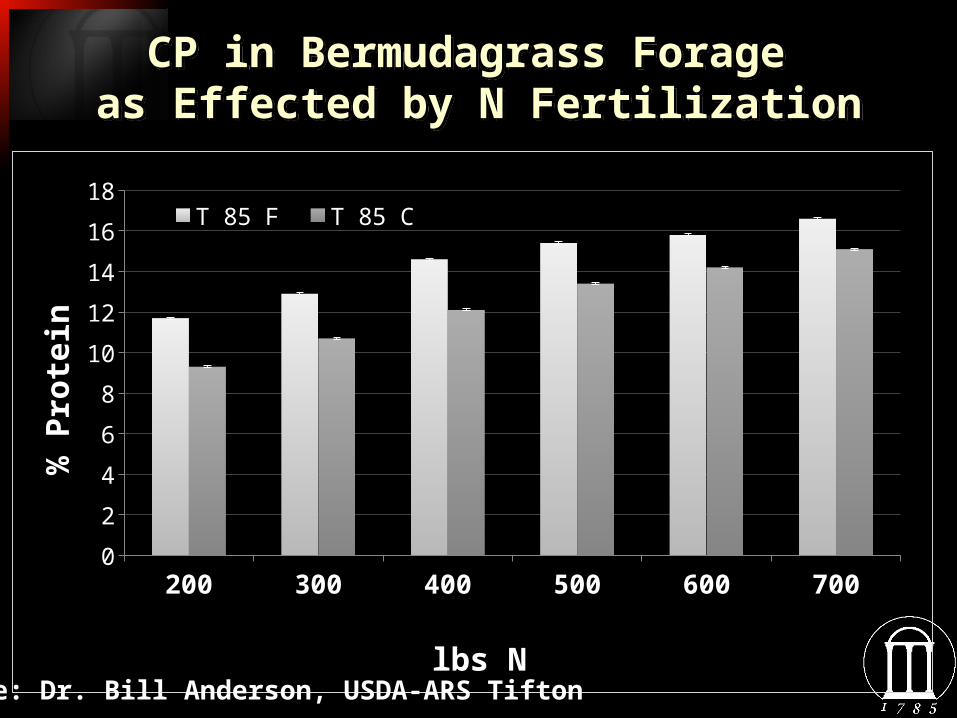
CP in Bermudagrass Forage as Effected by N FertilizationCP in Bermudagrass Forage as Effected by N Fertilization
200 300 400 500 600 7000
2
4
6
8
10
12
14
16
18T 85 F T 85 C
lbs N
% P
rote
in
Source: Dr. Bill Anderson, USDA-ARS Tifton
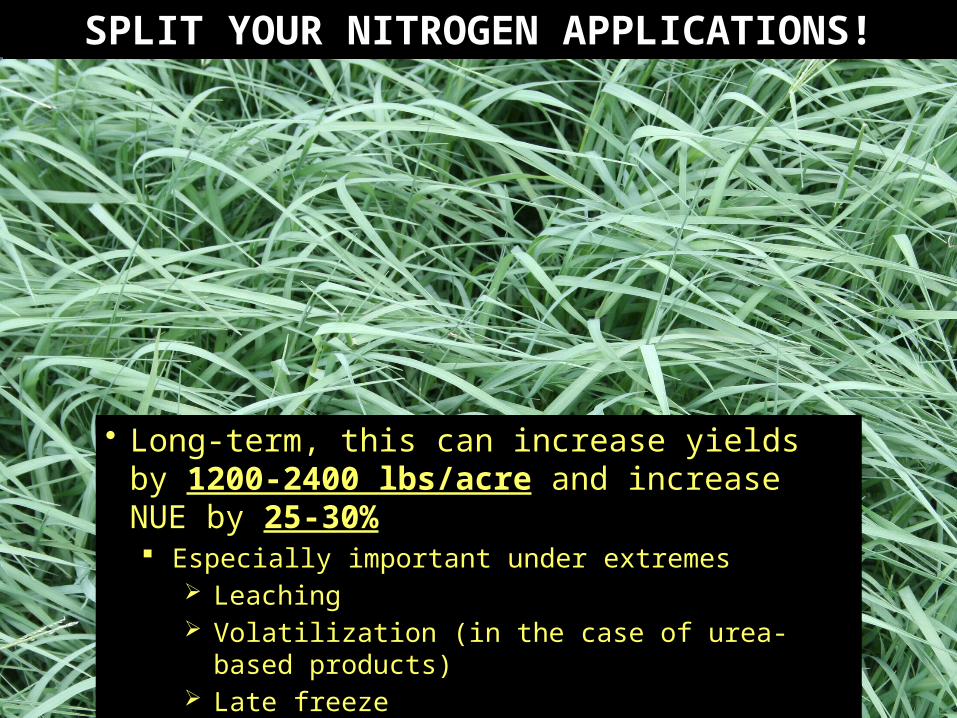
SPLIT YOUR NITROGEN APPLICATIONS!SPLIT YOUR NITROGEN APPLICATIONS!
• Long-term, this can increase yields by 1200-2400 lbs/acre and increase NUE by 25-30% Especially important under extremes
Leaching Volatilization (in the case of urea-based
products) Late freeze Drought
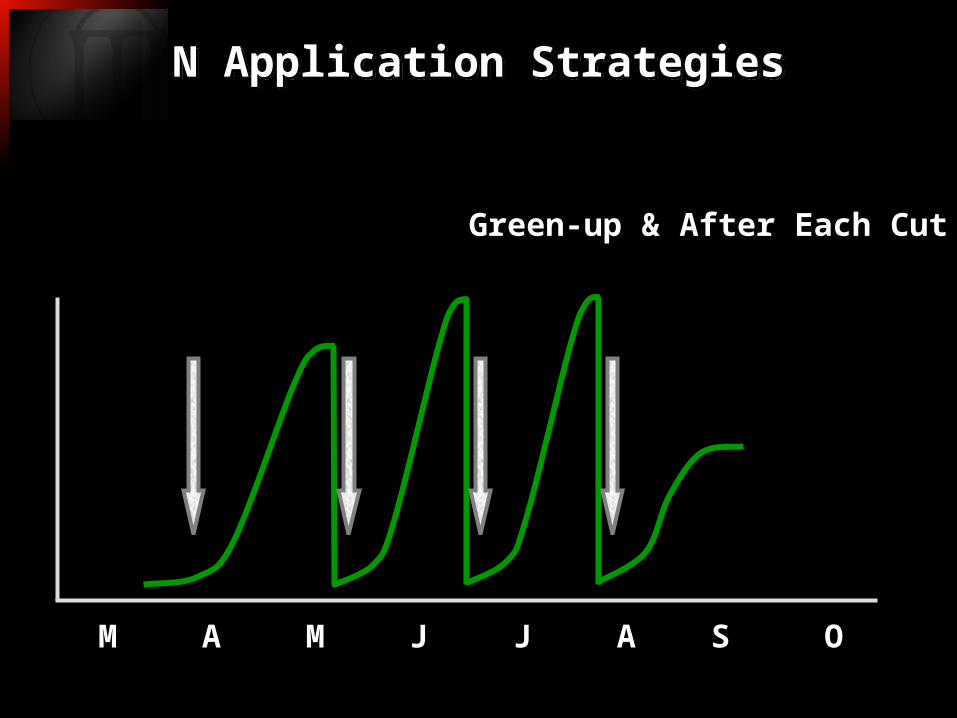
N Application StrategiesN Application Strategies
M A M J J A S O
Green-up & After Each Cut
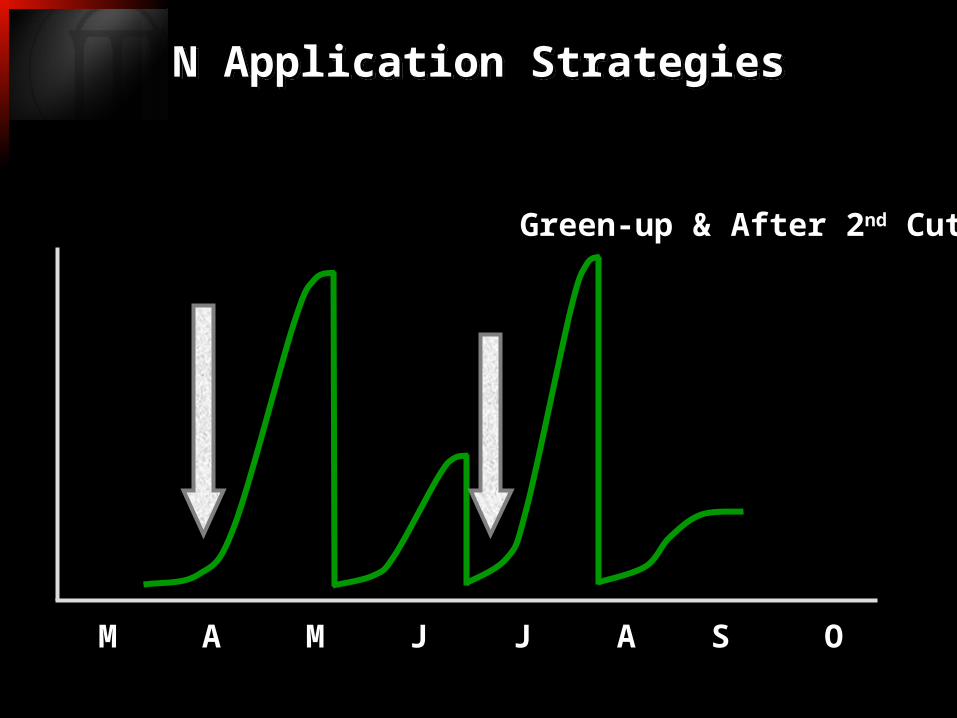
N Application StrategiesN Application Strategies
M A M J J A S O
Green-up & After 2nd Cut

N Application StrategiesN Application Strategies
M A M J J A S O
Green-up Only(Common Strategy with Poultry Litter)
Hybrid Bermudagrass Yield Response to N Rate
Hybrid Bermudagrass Yield Response to N Rate

N Concentration in the Forage Crop
N Concentration in the Forage Crop
Days of Growth
Gro
wth
of
the C
rop
Nitra
te C
on
c. in th
e
Cro
p
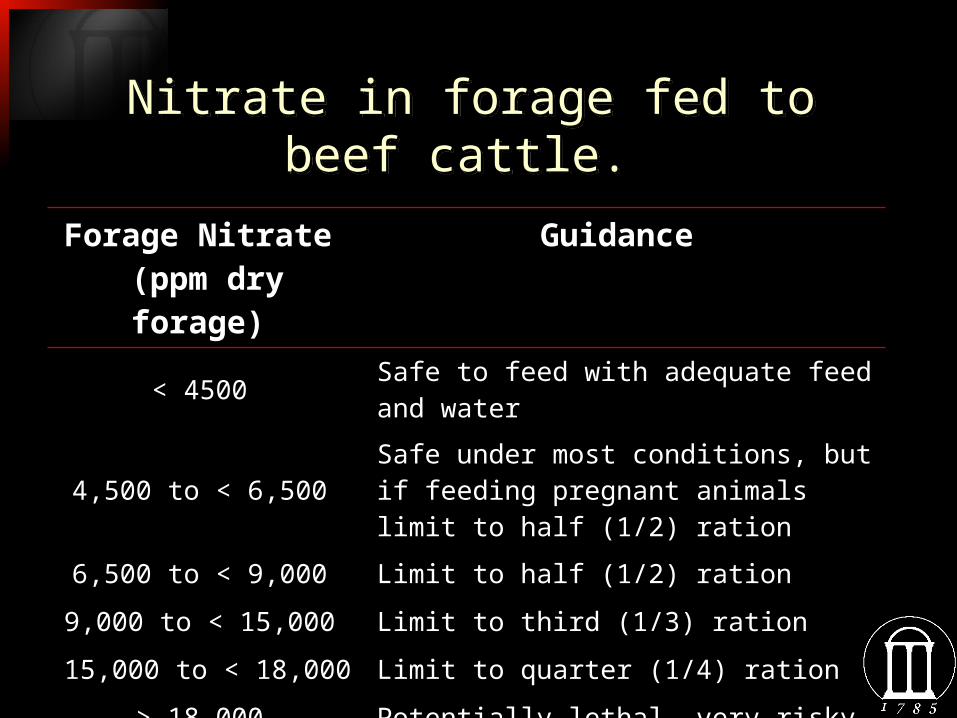
Nitrate in forage fed to beef cattle.
Nitrate in forage fed to beef cattle.
Forage Nitrate (ppm dry forage)
Guidance
< 4500 Safe to feed with adequate feed and water
4,500 to < 6,500 Safe under most conditions, but if feeding pregnant animals limit to half (1/2) ration
6,500 to < 9,000 Limit to half (1/2) ration
9,000 to < 15,000 Limit to third (1/3) ration
15,000 to < 18,000 Limit to quarter (1/4) ration
> 18,000 Potentially lethal, very risky

Subclinical Nitrate Toxicosis• Open cow that goes unexplained
• Lower milk production or gain.
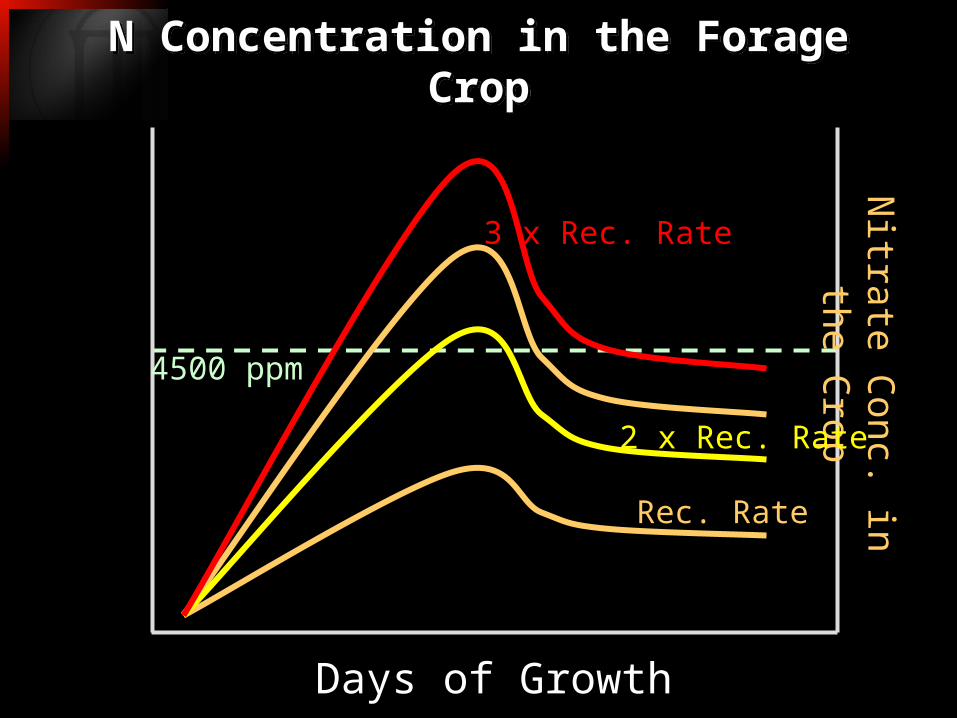
N Concentration in the Forage Crop
N Concentration in the Forage Crop
Days of Growth
Nitra
te C
on
c. in th
e
Cro
p4500 ppm
Rec. Rate
2 x Rec. Rate
3 x Rec. Rate
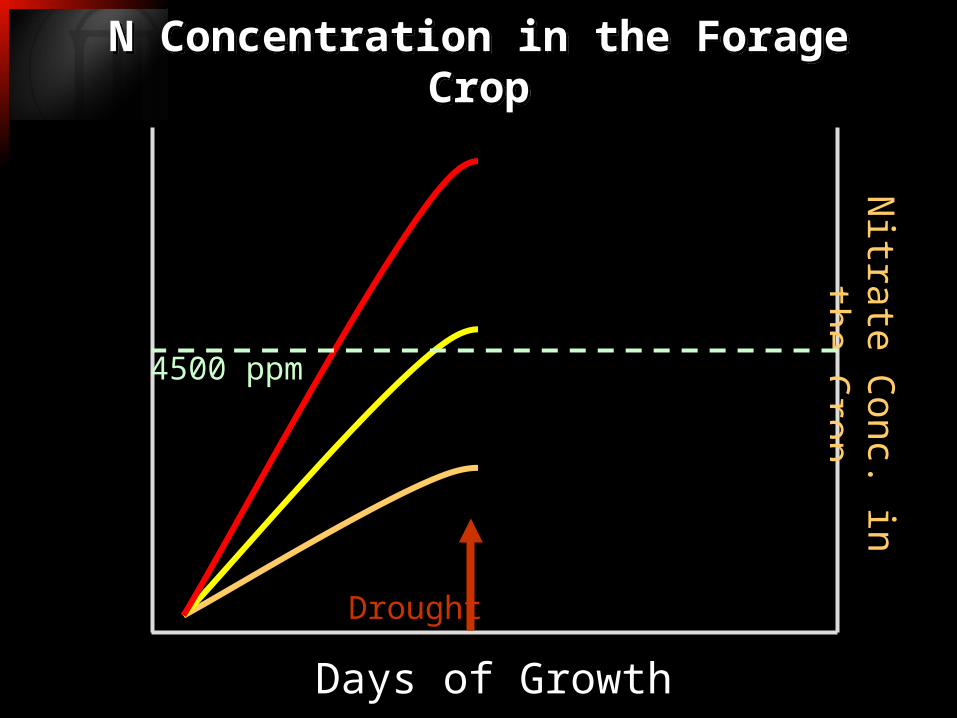
N Concentration in the Forage Crop
N Concentration in the Forage Crop
Days of Growth
Nitra
te C
on
c. in th
e
Cro
p4500 ppm
Drought

N Concentration in the Forage Crop
N Concentration in the Forage Crop
Days of Growth
Nitra
te C
on
c. in th
e
Cro
p4500 ppm
Rec. Rate
2 x Rec. Rate
3 x Rec. Rate

Drought Severity and Nitrates in Bermudagrass
Drought Severity and Nitrates in Bermudagrass
Jul-0
3Ju
l-04
Jul-0
5Ju
l-06
Jul-0
7Ju
l-08
0
10
20
30
40
50
60
70
80
90
100D2-D4 D3-D4
Perc
ent o
f Geo
rgia
Severeor worse
Extremeor worse

Drought Severity and Nitrates in Bermudagrass
Drought Severity and Nitrates in Bermudagrass
Growing Season Average
Confidence Interval
Standard Error of the Mean
----------------------------------- parts per million (ppm) -----------------------------------
2003-06 512 a† ± 32.6 16.792007 1170 c ±200.1 102.092008 626 b ±110.4 56.33
† Same letters within rows are not significantly different at P < 0.05.
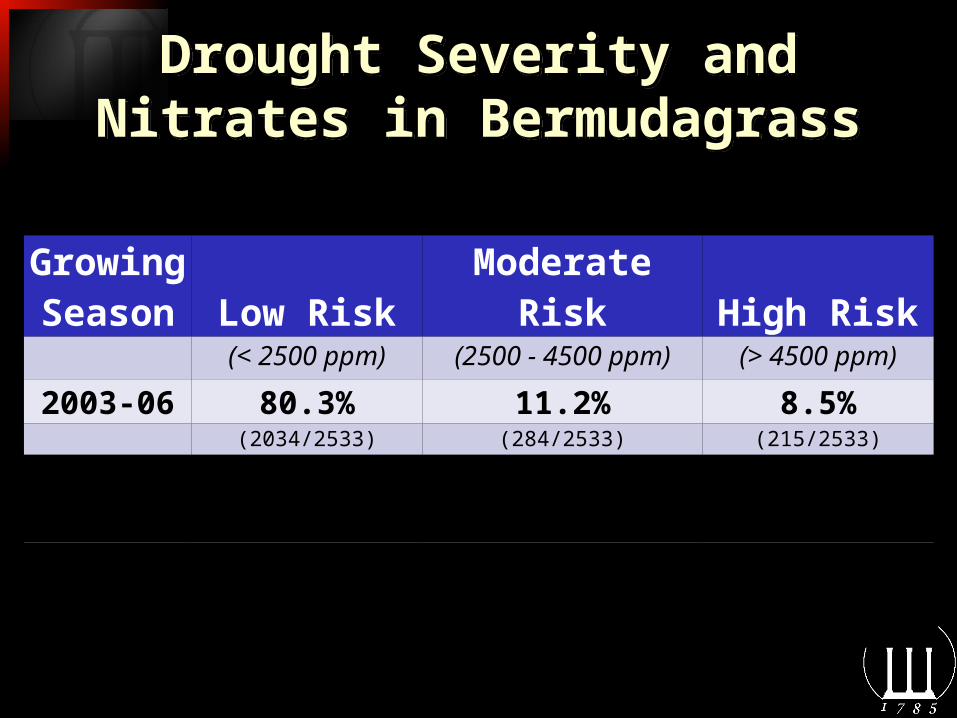
Drought Severity and Nitrates in Bermudagrass
Drought Severity and Nitrates in Bermudagrass
Growing Season Low Risk Moderate Risk High Risk
(< 2500 ppm) (2500 - 4500 ppm) (> 4500 ppm)
2003-06 80.3% 11.2% 8.5%(2034/2533) (284/2533) (215/2533)
2007 65.2% 19.6% 15.1%(659/1010) (198/1010) (153/1010)
2008 75.8% 13.3% 10.8%(659/869) (116/869) (94/869)
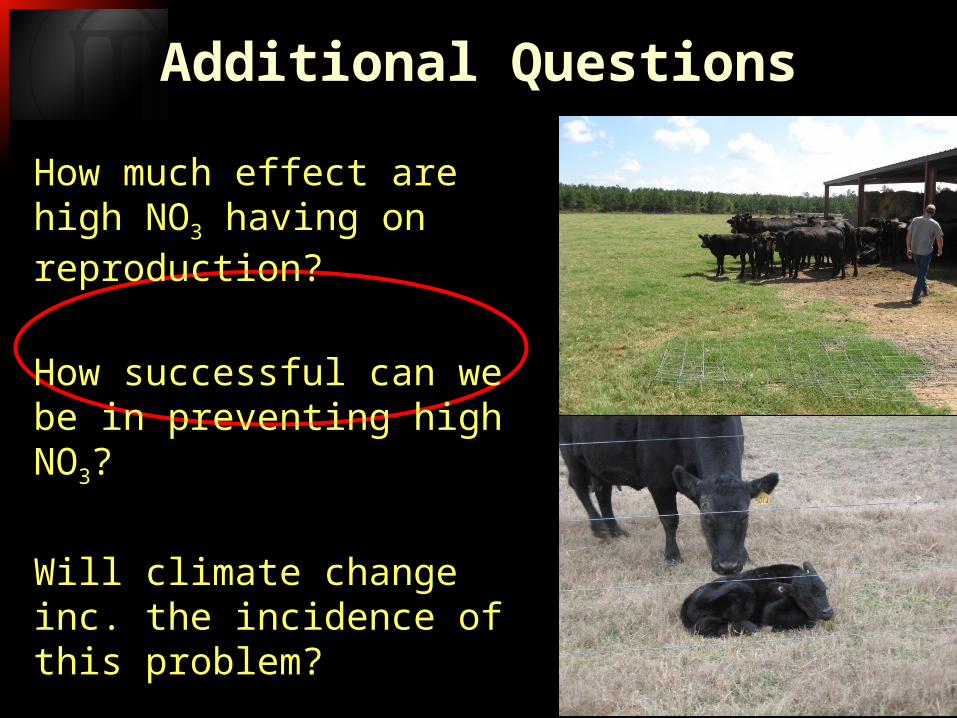
Additional Questions
How much effect are high NO3 having on reproduction?
How successful can we be in preventing high NO3?
Will climate change inc. the incidence of this problem?
Additional research is needed!
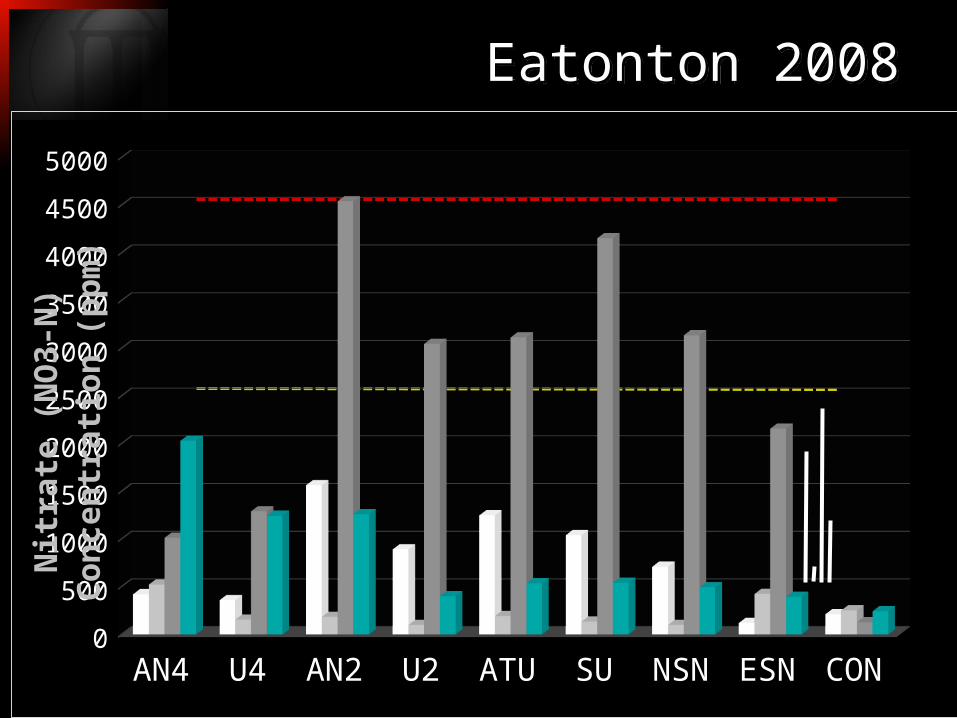
Eatonton 2008Eatonton 2008
AN4 U4 AN2 U2 ATU SU NSN ESN CON0
500
1000
1500
2000
2500
3000
3500
4000
4500
5000 H1 H2 H3 H4
Nitr
ate
(NO
3-N
) Co
ncen
trati
on (p
pm)
OutlineOutlineOverview of Bermudagrass Forage
Production
Variety Selection
Establishment and Grow-in
Fertilization Needs for productionNitrate (NO3) accumulation in
bermudagrass Use of urea-based fertilizers Needs for stand maintenance
• Harvesting methods
• Effects of Extended Grazing
• Burning

QUESTIONS?QUESTIONS?
www.georgiaforages.com1-800-ASK-UGA1
www.georgiaforages.com1-800-ASK-UGA1