Berkshire Functional Economic Market Area Study · Berkshire Functional Economic Market Area Study...
158
Berkshire Functional Economic Market Area Study Thames Valley Berkshire Local Enterprise Partnership Final Report February 2016
Transcript of Berkshire Functional Economic Market Area Study · Berkshire Functional Economic Market Area Study...
Berkshire Functional Economic Market Area Study
Thames Valley Berkshire Local Enterprise Partnership Final Report February 2016

Berkshire Functional Economic Market Area Study Final Report Thames Valley Berkshire Local Enterprise Partnership
February 2016
14793/MS/CGJ/LE
Nathaniel Lichfield & Partners 14 Regent's Wharf All Saints Street London N1 9RL nlpplanning.com

This document is formatted for double sided printing. © Nathaniel Lichfield & Partners Ltd 2016. Trading as Nathaniel Lichfield & Partners. All Rights Reserved. Registered Office: 14 Regent's Wharf All Saints Street London N1 9RL All plans within this document produced by NLP are based upon Ordnance Survey mapping with the permission of Her Majesty’s Stationery Office. © Crown Copyright reserved. Licence number AL50684A

Berkshire Functional Economic Market Area Study: Final Report
10050901v11
Executive Summary
This report has been prepared by Nathaniel Lichfield & Partners (‘NLP’) on behalf of the Thames Valley Berkshire Local Enterprise Partnership (‘TVBLEP’) and the six Berkshire authorities of Bracknell Forest, Reading, Slough, West Berkshire, Windsor and Maidenhead and Wokingham. It establishes the various functional economic market areas that operate across Berkshire and the wider sub-region, in order to provide the six authorities and the TVBLEP with an understanding of the various economic relationships, linkages and flows which characterise the sub-regional economy.
The methodological approach adopted for this study has been informed by national Planning Practice Guidance for assessing economic development needs and investigating functional economic market areas within and across local authority boundaries, and been subject to consultation with a range of adjoining authorities and other relevant stakeholders.
A range of information and data has been drawn upon across a number of themes as summarised below:
Economic and Sector Characteristics
Berkshire has recorded strong job growth in recent years, outperforming the regional and national average. Reading and West Berkshire represent the largest economies in employment terms, and Bracknell Forest the smallest. In relative terms, Berkshire’s economy supports a strong concentration of jobs in high value telecoms, IT, professional services and utilities sectors when compared with the wider regional sector mix.
Particular clusters of professional services activity are accommodated within Bracknell Forest and Reading, while West Berkshire shares similar characteristics to adjoining Basingstoke & Deane and Wiltshire with regards to a strong representation of manufacturing employment. Wholesale employment is strongly represented along the M25/M40 distribution corridor from Slough through South Bucks up to Wycombe. Slough also shares similar employment characteristics to adjoining Hillingdon in terms of transport, admin & support given its proximity to Heathrow.
The Berkshire authorities perform unevenly across a range of labour market and business demography indicators. Slough shares a number of similar labour market and business characteristics with nearby Hillingdon, Runnymede and Wycombe, while similar characteristics can also be identified between Windsor and Maidenhead and Wokingham, particularly with regards to the size profile of firms and strong enterprise performance.
Berkshire Functional Economic Market Area Study: Final Report
10050901v11
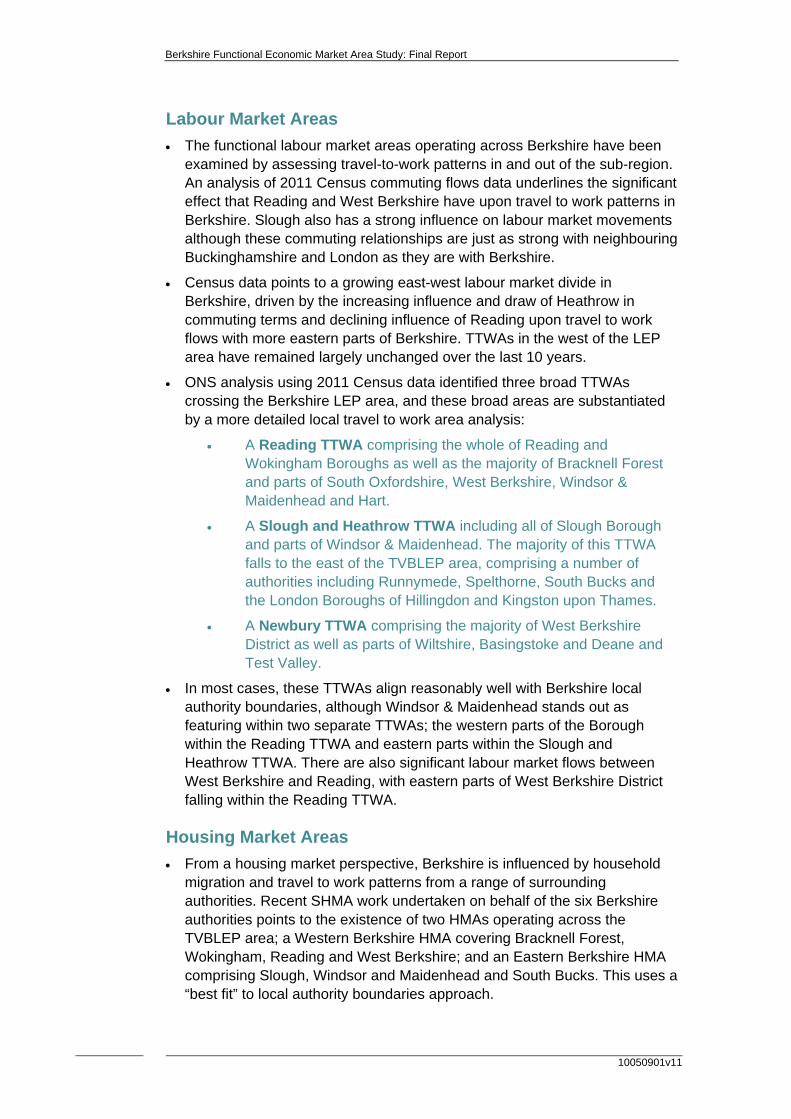
Labour Market Areas
The functional labour market areas operating across Berkshire have been examined by assessing travel-to-work patterns in and out of the sub-region. An analysis of 2011 Census commuting flows data underlines the significant effect that Reading and West Berkshire have upon travel to work patterns in Berkshire. Slough also has a strong influence on labour market movements although these commuting relationships are just as strong with neighbouring Buckinghamshire and London as they are with Berkshire.
Census data points to a growing east-west labour market divide in Berkshire, driven by the increasing influence and draw of Heathrow in commuting terms and declining influence of Reading upon travel to work flows with more eastern parts of Berkshire. TTWAs in the west of the LEP area have remained largely unchanged over the last 10 years.
ONS analysis using 2011 Census data identified three broad TTWAs crossing the Berkshire LEP area, and these broad areas are substantiated by a more detailed local travel to work area analysis:
A Reading TTWA comprising the whole of Reading and Wokingham Boroughs as well as the majority of Bracknell Forest and parts of South Oxfordshire, West Berkshire, Windsor & Maidenhead and Hart.
A Slough and Heathrow TTWA including all of Slough Borough and parts of Windsor & Maidenhead. The majority of this TTWA falls to the east of the TVBLEP area, comprising a number of authorities including Runnymede, Spelthorne, South Bucks and the London Boroughs of Hillingdon and Kingston upon Thames.
A Newbury TTWA comprising the majority of West Berkshire District as well as parts of Wiltshire, Basingstoke and Deane and Test Valley.
In most cases, these TTWAs align reasonably well with Berkshire local authority boundaries, although Windsor & Maidenhead stands out as featuring within two separate TTWAs; the western parts of the Borough within the Reading TTWA and eastern parts within the Slough and Heathrow TTWA. There are also significant labour market flows between West Berkshire and Reading, with eastern parts of West Berkshire District falling within the Reading TTWA.
Housing Market Areas
From a housing market perspective, Berkshire is influenced by household migration and travel to work patterns from a range of surrounding authorities. Recent SHMA work undertaken on behalf of the six Berkshire authorities points to the existence of two HMAs operating across the TVBLEP area; a Western Berkshire HMA covering Bracknell Forest, Wokingham, Reading and West Berkshire; and an Eastern Berkshire HMA comprising Slough, Windsor and Maidenhead and South Bucks. This uses a “best fit” to local authority boundaries approach.

Berkshire Functional Economic Market Area Study: Final Report
10050901v11
Recent HMA analysis prepared on behalf of the four Buckinghamshire authorities identified that South Bucks falls across two separate HMAs; namely a Central Buckinghamshire HMA (comprising all of Wycombe and Chiltern Districts as well as parts of Aylesbury Vale and South Bucks) and a Reading & Slough HMA (comprising the local authorities of Bracknell Forest, Reading, Slough, West Berkshire, Windsor & Maidenhead and Wokingham, as well as South Bucks).
Since that analysis was published, South Bucks have started to progress a Joint Local Plan with Chiltern District and have commissioned new evidence to determine housing and employment requirements over the period to 2033. The latest evidence emerging from this Housing and Economic Development Needs Assessment (HEDNA) study suggests that the Joint Local Plan Area for Chiltern and South Bucks would form part of a “best fit” with a Central Bucks HMA; together with the authorities of Aylesbury Vale and Wycombe. This is noted by the study as providing the most pragmatic arrangement for establishing local planning policy, although the previously defined HMA geography (which identifies strong housing market linkages between South Bucks and Berkshire) still remains valid.
Housing market studies prepared for other authorities surrounding Berkshire defines those authorities as falling within separate HMAs, with no evidence of overlapping housing market relationships extending into Berkshire. On this basis, it is possible to conclude that two HMAs operate across the LEP area; an Eastern Berkshire HMA (which also incorporates South Bucks) and a Western Berkshire HMA.
Commercial Property Market Areas
Within Berkshire, the largest concentration of employment space is found in Slough, followed by Reading and West Berkshire. These three authorities represent the largest industrial locations in floorspace terms, while Reading and Windsor & Maidenhead record the highest amount of office space.
At a sub-regional level, commercial property markets areas are centred on the M3 and M4 strategic ‘Western corridors’, driven by strong functional economic linkages to Heathrow airport and the outer west London Boroughs. Within the Western Corridor, it is possible to identify specific sub market areas, each sharing a number of similar characteristics, trends and a high degree of interaction. This includes a Core Thames Valley or ‘Upper M4’ area focused on the key M4 markets of Reading, Maidenhead, Bracknell and Wokingham, with strong economic relationships between these towns in terms of value, accessibility and labour force.
At the eastern end of the Thames Valley lies the Slough and West London sub area, reflecting the significant influence of Heathrow Airport upon property market interactions. This sub market area also takes in the South Bucks towns of Beaconsfield and Gerrards Cross.
Berkshire Functional Economic Market Area Study: Final Report
10050901v11
The western part of the sub-region accommodates the Newbury and Swindon sub-markets, which constitute the key nodes at the western end of the M4 corridor. This property market area is characterised by a lower value profile in both office and industrial terms than the M4 markets closer to London, a quasi-industrial character in regards to much of the demand, and linkages that exist with areas beyond the western boundary of Berkshire. There is some synergy in property market terms between Newbury and Reading, and Newbury and Oxfordshire, although these linkages and property market areas are not as strong.
Consumer Market Areas
Working age population growth is expected to slow down in future across the majority of Berkshire authorities, with a number of nearby authorities across the wider sub-region anticipated to outperform the LEP area in working age population growth terms. These anticipated trends are likely to have an impact on the scale and proportion of travel-to-work and migration flows that occur to, from and within Berkshire as the balance of employment and working age population changes.
Reflecting its size and position in retail ranking terms, Reading has the largest consumer market catchment in Berkshire, which extends along the M4, M3 and M40 corridors taking in all of Berkshire as well as large parts of Oxfordshire, Buckinghamshire, Surrey and Hampshire.
Other Berkshire authorities tend to have more localised retail and consumer catchment areas, reflecting their lower order retail status and critical mass of occupiers. These generally form a broad radius around the main Berkshire centres and sit within the overarching Reading consumer catchment area, and also overlap into neighbouring counties.
Due to the overlapping and complex nature of the various consumer market areas operating across Berkshire, this analysis is most helpful for defining sub-market areas rather than overarching functional economic market areas in themselves.
Transport and Connectivity
Berkshire is located between three major east-west corridors of movement (M3, M4 and M40) and in close proximity to the M25; it therefore benefits from excellent access to motorway and trunk road networks. The LEP area is also well served by rail connections although north-south road routes are comparatively poor (with the exception of the A34 to the west of Berkshire).
Transport accessibility is strongly linked with the geography of functional economic market areas, with the strategic transport network playing a key role in shaping commercial property, labour and housing market flows. Eastern Berkshire benefits from its proximity to a network of strategic routes which plays a key role in shaping the TTWA, housing market and commercial property market areas that operate across this part of Berkshire, and linking the key commercial centres of Slough, Heathrow Airport and High Wycombe.
10050
Be
901v11
S
Fig
So
erkshire Functio
Similarly, play an imBracknell pattern is services frValley clusthat commlocalised i
These dynlargest cewestern pconnectivi
ynthesis
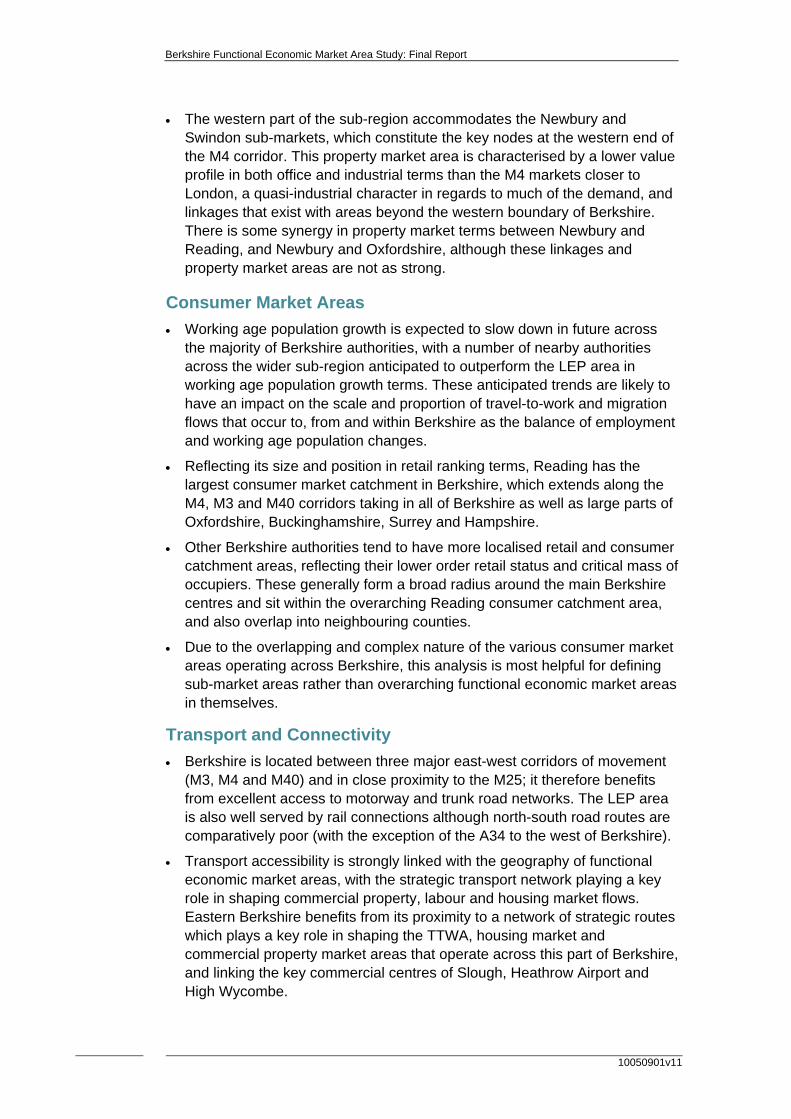
Based upooperate acmarket to representsdifferent fahousing mwithin andInvariablyinterpreted
gure ES1 Func
ource: NLP
nal Economic M
the M4 andmportant role
in travel to likely to be rom 2019. Wster of Read
muting patten character
namics are ntres, whicharts of Berkity.
on an assescross Berksidentify hows a ‘policy oactors ident
market areasd across Be, however, td as being e
ctional Economi
analysis, drawi
Market Area Stu
d A4 corridoe in linking work and creinforced
West Berksding, Wokin
erns and bur.
echoed by h identifies kshire in ter
ssment of thshire, it is pow well theseoff’ view of ttified within s and commrkshire, regthese area either defin
c Markets – Su
ng upon a rang
dy: Final Repor
ors as well aReading, M
commercial through thehire’s locatingham, Brasiness mov
peak drive clear distin
rms of drive
he various fossible to oe align acrothe geograpthe PPG in
mercial propgardless of aboundariesitive or nece
mmary Map
e of sources
rt
as the GreatMaidenhead
property mae operation ion away frocknell and M
vements ten
time distanctions betwtime acces
functional everlay eachss Berkshir
phical reachncluding labperty markeadministratis are indicatessarily fixe
t Western M, Wokinghaarket area tof new Croom the ‘coreMaidenhea
nd to be mo
ces from Beween easterssibility and
economic mh functionalre (Figure Eh associatedbour market et areas thative geograptive and shoed over time
Mainline am and terms. This ssrail e’ Thames d means re
erkshire’s n and road
markets that economic
ES1). This d with flows,
t operate phies. ould not be e.

Berkshire F
This not eSurreLondgreatBerkwhicwith prop
Defini
In lighelpf“bestof espolicEconauthoarearelati
Figure ES2
Source:
Functional Econ
shows thatextend far bey, Hampshdon feature ter or lesse
kshire whichh shares steastern parerty market
ng Core F
ght of the ineful for Localt fit” with the
stablishing Lcy. On this bnomic Markority bounds that the eionships.
2 Core Functio
NLP analysis
nomic Market A
t the spatial eyond the T
hire, Wiltshiwithin theser extent, alt
h consistentrong econorts of Berkst terms.
Functiona
evitably nebl Planning Aese variousLocal Plan ebasis, Figureet Areas (Faries. Thesvidence ind
onal Economic M
s, drawing upon
Area Study: Fina
extent of thTVBLEP adre, Oxfordse broad geothough the otly falls withomic relationshire) in trav
al Econo
bulous natuAuthorities ts functional evidence ane ES2 below
FEMAs) thatse core FEMdicates cons
Market Areas (B
n a range of sou
al Report
hese functiodministrativeshire, Buckinographical fonly local ain these bronships with vel-to-work,
mic Mark
re of functioto identify aeconomic m
nd for the pw identifies t represent
MAs encompsistently hav
Best Fit to Local
rces
onal econome boundary.nghamshirefunctional authority are
oad areas isBerkshire (housing an
ket Areas
onal econom pragmatic
markets withurposes of dthree core
a “best fit” wpass those ve strong in
Authority Boun
10050
mic markets. Parts of e and Greatareas to a ea outside os South Buc(and in partind commerc
mic marketsand logicalhin the contdeveloping Functional
with local local autho
nter-
ndaries)
0901v11
s do
ter
of cks, icular cial
s, it is text
ority
Berkshire Functional Economic Market Area Study: Final Report
10050901v11
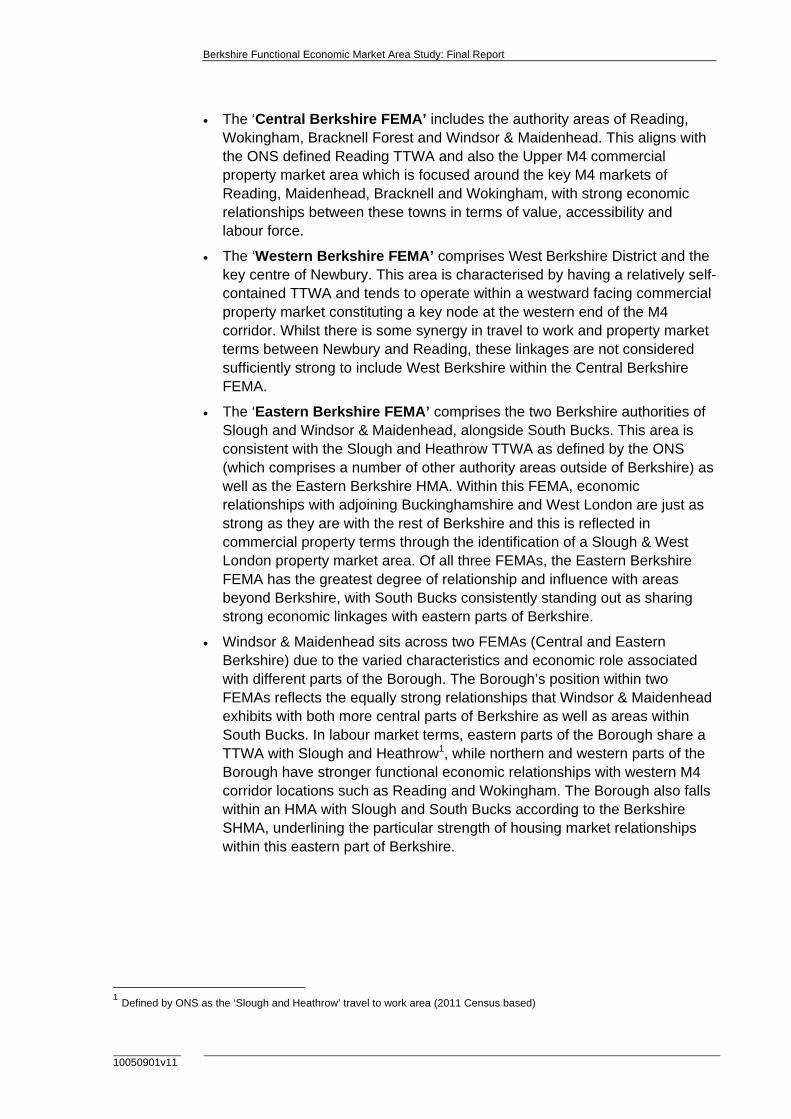
The ‘Central Berkshire FEMA’ includes the authority areas of Reading, Wokingham, Bracknell Forest and Windsor & Maidenhead. This aligns with the ONS defined Reading TTWA and also the Upper M4 commercial property market area which is focused around the key M4 markets of Reading, Maidenhead, Bracknell and Wokingham, with strong economic relationships between these towns in terms of value, accessibility and labour force.
The ‘Western Berkshire FEMA’ comprises West Berkshire District and the key centre of Newbury. This area is characterised by having a relatively self-contained TTWA and tends to operate within a westward facing commercial property market constituting a key node at the western end of the M4 corridor. Whilst there is some synergy in travel to work and property market terms between Newbury and Reading, these linkages are not considered sufficiently strong to include West Berkshire within the Central Berkshire FEMA.
The ‘Eastern Berkshire FEMA’ comprises the two Berkshire authorities of Slough and Windsor & Maidenhead, alongside South Bucks. This area is consistent with the Slough and Heathrow TTWA as defined by the ONS (which comprises a number of other authority areas outside of Berkshire) as well as the Eastern Berkshire HMA. Within this FEMA, economic relationships with adjoining Buckinghamshire and West London are just as strong as they are with the rest of Berkshire and this is reflected in commercial property terms through the identification of a Slough & West London property market area. Of all three FEMAs, the Eastern Berkshire FEMA has the greatest degree of relationship and influence with areas beyond Berkshire, with South Bucks consistently standing out as sharing strong economic linkages with eastern parts of Berkshire.
Windsor & Maidenhead sits across two FEMAs (Central and Eastern Berkshire) due to the varied characteristics and economic role associated with different parts of the Borough. The Borough’s position within two FEMAs reflects the equally strong relationships that Windsor & Maidenhead exhibits with both more central parts of Berkshire as well as areas within South Bucks. In labour market terms, eastern parts of the Borough share a TTWA with Slough and Heathrow1, while northern and western parts of the Borough have stronger functional economic relationships with western M4 corridor locations such as Reading and Wokingham. The Borough also falls within an HMA with Slough and South Bucks according to the Berkshire SHMA, underlining the particular strength of housing market relationships within this eastern part of Berkshire.
1 Defined by ONS as the ‘Slough and Heathrow’ travel to work area (2011 Census based)

Berkshire Functional Economic Market Area Study: Final Report
10050901v11
Analysis undertaken as part of this study identifies evidence of interactions between the various Core FEMAs and with adjoining authorities outside of Berkshire. Whilst “best fit” areas have been defined above for the purposes of informing future plan making, it should be recognised that the boundaries of these areas are porous given the different layers of inter-relationship that exist between each area as well as across the TVBLEP area overall. It is important to continue to recognise these relationships in Duty to Cooperate terms.
Berkshire Functional Economic Market Area Study: Final Report
10050901v11
Contents
1.0 Introduction 1 Policy and Guidance ......................................................................................... 1 Study Methodology ............................................................................................ 3 Structure of the Report ...................................................................................... 5
2.0 Economic Context and Trends 7 Spatial Overview ............................................................................................... 7 Economic Conditions and Trends ...................................................................... 7 Synthesis ......................................................................................................... 17
3.0 Functional Labour Market Areas 19 Travel to Work Areas ....................................................................................... 19 Commuting Flows ............................................................................................ 21 Defining Local Travel to Work Areas ............................................................... 24 Berkshire Wide Travel to Work Area ............................................................... 30 Synthesis ......................................................................................................... 33
4.0 Housing Market Areas 35 Berkshire ......................................................................................................... 35 Buckinghamshire ............................................................................................. 37 Oxfordshire ...................................................................................................... 39 Wiltshire ........................................................................................................... 39 Hampshire ....................................................................................................... 40 Surrey .............................................................................................................. 41 Greater London ............................................................................................... 42 Synthesis ......................................................................................................... 43
5.0 Functional Commercial Property Market Areas 45 Stock of Employment Space ........................................................................... 45 Market Geography ........................................................................................... 49 Synthesis ......................................................................................................... 61
6.0 Other Functional Economic Market Factors 65 Demographic Trends ....................................................................................... 65 Retail and Consumer Market Areas ................................................................ 66 Transport and Connectivity .............................................................................. 75 Synthesis ......................................................................................................... 82
7.0 Conclusions 85 Economic and Sector Characteristics .............................................................. 85 Labour Market Areas ....................................................................................... 85 Housing Market Areas ..................................................................................... 87

Berkshire Functional Economic Market Area Study: Final Report
10050901v11
Commercial Property Market Areas ................................................................. 88 Consumer Market Areas .................................................................................. 90 Transport and Connectivity .............................................................................. 90 Synthesis ......................................................................................................... 91 Defining Core Functional Economic Market Areas .......................................... 92
Berkshire Functional Economic Market Area Study: Final Report
10050901v11 P1
1.0 Introduction
1.1 This report has been prepared by Nathaniel Lichfield & Partners (‘NLP’) on behalf of the Thames Valley Berkshire Local Enterprise Partnership (‘TVBLEP’) and the six Berkshire authorities of Bracknell Forest, Reading, Slough, West Berkshire, Windsor and Maidenhead and Wokingham. It establishes the various Functional Economic Market Areas (FEMAs) that operate across Berkshire and the wider sub-region2, in order to provide the six authorities and the TVBLEP with an understanding of the various economic relationships, linkages and flows which characterise the sub-regional economy.
1.2 The evidence from this study will help to inform the basis for the development of economic policies through each local authority’s future Local Plan process as well as other economic development work within and between the authorities, including the work of TVBLEP.
1.3 It represents the first of a two part study. The second part of the study will comprise an Economic Development Needs Assessment (EDNA) for each of the FEMAs identified through part one. This will identify the future quantity of land or floor space that will be required for economic development uses over the period to 2036 in each local authority area and in each of the defined FEMA(s).
Policy and Guidance
1.4 The National Planning Policy Framework (NPPF) and accompanying Planning Practice Guidance (PPG) require the development needs of local authority areas to be considered in terms of FEMAs. Where these FEMAs cross administrative boundaries, the guidance indicates that they should be collectively considered by relevant local authorities under the statutory duty to cooperate.
1.5 The NPPF specifically states the following in Paragraph 160 with regards to local authorities working together to meet strategic needs in cross-cutting markets:
“Local planning authorities should have a clear understanding of business needs within the economic markets operating in and across their area. To achieve this, they should:
work together with county and neighbouring authorities and with Local Enterprise Partnerships to prepare and maintain a robust evidence base to understand both existing business needs and likely changes in the market; and
work closely with the business community to understand their changing needs and identify and address barriers to investment, including a lack of housing, infrastructure or viability.” (para 160)
2 The term ‘sub-region’ in this report refers to the TVBLEP area and surrounding (non-Berkshire) Local Authority areas
Berkshire Functional Economic Market Area Study: Final Report
P2 10050901v11
1.6 The PPG further emphasises the collaborative approach that local authorities should adopt when analysing the housing and economic development needs of their areas, stating the following in Paragraph 2a-007 in regards to working with other local authorities to determine how needs should be accommodated:
“Local planning authorities should assess their development needs working with the local authorities in the relevant housing market area or functional economic market area in line with the duty to cooperate. This is because such needs are rarely constrained precisely by local authority administrative boundaries.” (para 007 Reference ID: 2a-007-20140306)
1.7 In 2010, the Department for Communities and Local Government (DCLG) set out a guidance note examining the concept of a FEMA.3 Although this note was prepared prior to the PPG, it still represents a useful reference when considering the nature of markets within the context of preparing economic or planning policy.
1.8 The note states that FEMAs provide the spatial scale in which to address the strategic issues and relationships that generally cut across traditional local authority boundaries. Instead of FEMAs being contained in administrative boundaries, these areas often more broadly correspond to sub-regions or city regions.
1.9 It indicated that there is no standard approach to defining a FEMA, as the dynamics and patterns of economic flows tend to differ depending on the markets assessed. The note does however recommend that commuting flow data represents the best source of information when assessing FEMAs, but that this should be supplemented by data from other relevant markets (e.g. housing markets and supply chains). The note also highlights the need to have regard to administrative boundaries:
“It is within administrative boundaries that services and strategies are applied and developed, based on analyses using FEMAs. The importance of administrative boundaries therefore also needs to be recognised. This can be done through ‘best fitting’ FEMA boundaries to local authority administrative areas so that they are approximated in terms of whole local authority boundaries, upper or lower tier.”
1.10 The more recent PPG also recognises that no single source of data is comprehensive in identifying appropriate assessment areas, and highlights a number of factors to be considered when assessing and defining relevant FEMAs4, as listed below:
extent of any Local Enterprise Partnership within the sub-region;
travel to work areas;
housing market areas;
flow of goods, services and information;
3 Functional Economic Market Areas: an economic note, CLG, 2010 4 PPG Paragraph 012 Reference ID: 2a-012-20140306

Berkshire Functional Economic Market Area Study: Final Report
10050901v11 P3
service markets for consumers;
administrative areas;
catchments areas of facilities providing cultural and social wellbeing; and
transport networks.
1.11 In order to appropriately define a FEMA, a number of these key market and catchment areas need to be considered, as this will allow the key drivers and dynamics impacting on local economies to be identified and further assessed.
Study Methodology
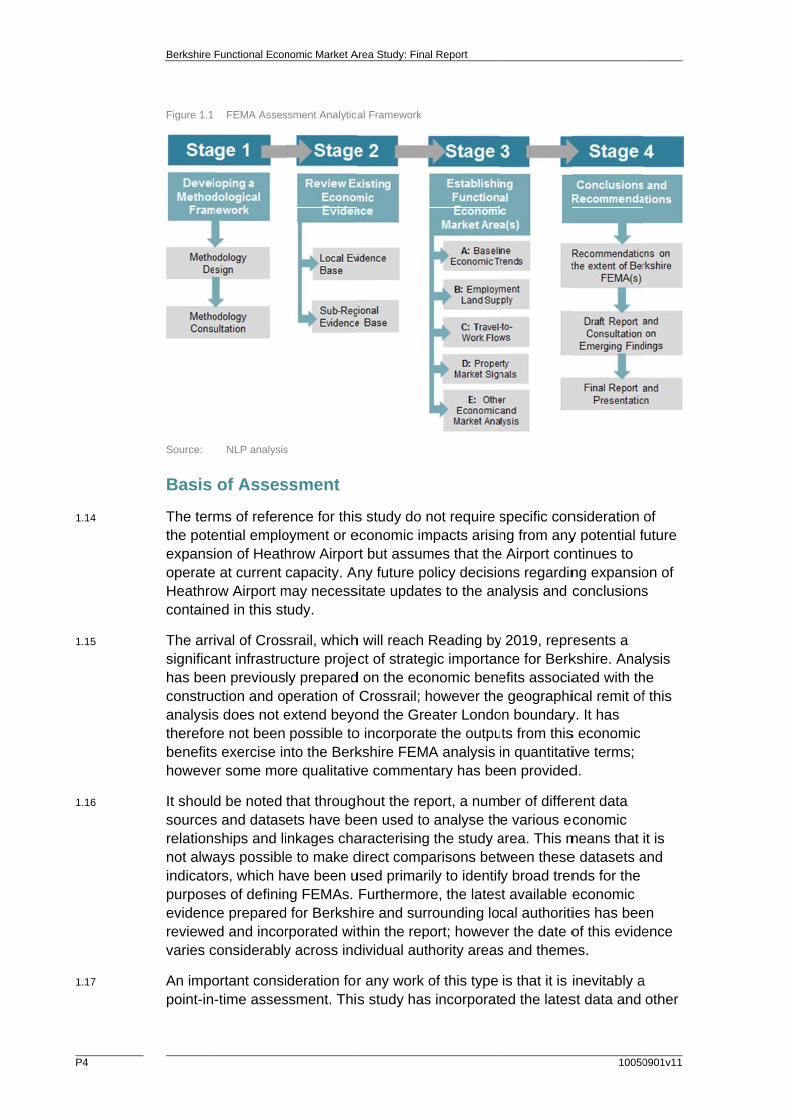
1.12 The methodology adopted for this study follows the PPG for examining economic development needs and defining FEMAs within and across local authority areas. The methodology for the assessment covers the following three main stages, with stage four comprising conclusions and recommendations:
Stage 1: Developing a Methodological Framework – designing a methodology for undertaking the study in line with national guidance such as the PPG and from experience elsewhere and consulting on this methodology with key stakeholders to ensure the robustness of the proposed analyses that will inform the FEMA assessment.
Stage 2: Review Existing Economic Evidence – identifying the context for the study by reviewing the existing evidence base for Berkshire and individual authorities that fall within it, on economic development, employment, transport, housing and retail matters. This also includes evidence and documents that consider growth at the sub regional level;
Stage 3: Establishing Functional Economic Market Area(s) – analysing a range of information and data to establish and spatially define the various Functional Economic Market Area(s) that operate across Berkshire. In line with the PPG, this analysis is considered across five key themes of baseline economic trends, employment land supply, travel-to-work flows, property market signals and other economic and market analysis.
Stage 4: Conclusions and Recommendations – drawing together the range of analysis undertaken above to spatially define the FEMA(s) that operate across Berkshire and to identify the various economic roles that each of the six Berkshire authorities performs within these.
1.13 The four-stage methodological approach for this FEMA assessment is set out in the analytical framework in Figure 1.1.
P4
1.14
1.15
1.16
1.17
Berkshire
Figure 1.1
Source:
Basis
The termthe poteexpansioperateHeathrocontaine
The arrisignificahas beeconstruanalysisthereforbenefitshoweve
It shouldsourcesrelationsnot alwaindicatopurposeevidencreviewevaries c
An impopoint-in-
Functional Econ
FEMA Asses
NLP analysis
of Asses
ms of refereential emploion of Heath
e at current ow Airport med in this st
ival of Crosant infrastruen previousction and os does not ere not been s exercise iner some mo
d be noted s and datasships and liays possibleors, which hes of definince prepareded and incorconsiderably
ortant consi-time asses
nomic Market A
ssment Analytica
s
ssment
ence for thisoyment or ehrow Airporcapacity. A
may necesstudy.
srail, whichucture projecly preparedperation of extend beyopossible to
nto the Berkre qualitativ
that throughets have benkages chae to make dave been u
ng FEMAs. for Berkshrporated wity across ind
deration forssment. This
Area Study: Fina
al Framework
s study do neconomic imrt but assumny future po
sitate update
h will reach ct of strateg
d on the ecoCrossrail; h
ond the Greo incorporatkshire FEMAve commen
hout the repeen used toaracterisingdirect compused primarFurthermorire and surrthin the repdividual aut
r any work os study has
al Report
not require smpacts arisinmes that theolicy decisioes to the an
Reading bygic importanonomic benehowever theeater Londoe the outpuA analysis itary has be
port, a numo analyse th
the study aarisons betwily to identifre, the latesrounding locort; howevehority areas
of this type s incorporat
specific conng from any
e Airport conons regardinnalysis and c
y 2019, reprnce for Berkefits associae geographion boundary
ts from thisin quantitatien provided
ber of differe various ecarea. This mween thesefy broad trenst available ecal authoritier the date os and theme
is that it is ed the lates
10050
nsideration y potential fntinues to ng expansioconclusions
resents a kshire. Analated with thical remit ofy. It has s economic ive terms; d.
rent data conomic
means that e datasets ands for the economic ies has beeof this evidees.
inevitably ast data and
0901v11
of future
on of s
lysis he f this
it is and
en ence
a other
Berkshire Functional Economic Market Area Study: Final Report
10050901v11 P5
existing evidence available at the time of preparation. It should also be noted that a number of economy and housing evidence base studies are currently being prepared and finalised by adjoining and nearby authorities, and where draft reports/findings are available these have been incorporated into the analysis. The accuracy and sources of data derived from third party sources has not been checked or verified by NLP.
Stakeholder Engagement
1.18 In order to ensure that the analysis is based on robust and credible evidence, extensive consultation has been undertaken as part of the study with key stakeholders including neighbouring local authorities and other organisations with an interest in economic development across the wider sub-region.
1.19 This includes consultation undertaken at the beginning of the study to gain feedback on the proposed methodology. A number of responses were received from key stakeholders to the methodology consultation carried out as part of Stage 1. A copy of the methodology consultation questionnaire is included at Appendix 1. A summary of responses, alongside an overview of how these responses have been incorporated into the study methodology, is provided in Appendix 2.
1.20 A further consultation exercise was undertaken with stakeholders as part of Stage 4 to share and invite feedback on the emerging findings and conclusions set out in the Draft Report. A summary of the responses to this exercise, alongside an overview of how these responses have been incorporated into the final report, is provided in Appendix 4. A copy of the emerging findings consultation questions is also included in Appendix 3.
Structure of the Report
1.21 The remainder of the report is structured around a number of key FEMA themes as follows:
Spatial and Economic Context (Section 2.0) – an overview of the strategic location, current economic conditions and recent trends within Berkshire to identify key drivers of growth.
Functional Labour Market Areas (Section 3.0) – examines the latest travel-to-work flows and patterns to, from and within Berkshire consider the relationship between where people live and where they work.
Housing Market Areas (Section 4.0) – considers the housing market areas that operate across the Thames Valley.
Functional Commercial Property Market Areas (Section 5.0) – analysis of the scale and spatial distribution of business space across the Thames Valley Berkshire LEP area and adjoining areas, and an overview of commercial property market signals and dynamics.

Berkshire Functional Economic Market Area Study: Final Report
P6 10050901v11
Other Economic and Market Factors (Section 6.0) – considers a range of other demographic, consumer market, transport and communications indicators to inform an analysis of the spatial extent of FEMA(s) operating across Berkshire.
Overall conclusions are presented in Section 7.0.

Berkshire Functional Economic Market Area Study: Final Report
10050901v11 P7
2.0 Economic Context and Trends
2.1 This section establishes the economic and labour market context for the study by summarising recent economic conditions and trends within Berkshire and surrounding authorities, relative to the wider South East region and the national economy. This is important for identifying the existing strengths and weaknesses of the economy and the factors that influence the economic flows and linkages characterising the study area. It draws upon a review of existing economic and policy evidence as well as the latest statistics and trends.
Spatial Overview
2.2 The Thames Valley Berkshire LEP area is located immediately to the west of London and comprises the former county of Berkshire, now divided into the six unitary authority areas of Bracknell Forest, Reading, Slough, West Berkshire, Windsor and Maidenhead, and Wokingham (Figure 2.1).
Figure 2.1 Spatial Context of Thames Valley Berkshire
Source: NLP analysis Note: settlements sized by population
Economic Conditions and Trends
Employment
2.3 Berkshire accommodates around 573,630 workforce jobs (as at 2015), having increased by 18.5% from its 1997 level. This scale of employment growth was

Berkshire Functional Economic Market Area Study: Final Report
P8 10050901v11
slightly higher than both the regional (18.1%) and national (18.0%) average during this period (Table 2.1).
Table 2.1 Employment by Authority
Location Total Workforce
Jobs (2015) % Workforce Job
Change 1997-2015
Bracknell Forest 71,600 8.6 Reading 115,310 10.6
Slough 95,860 12.7
West Berkshire 110,450 31.9 Windsor & Maidenhead 93,640 15.3
Wokingham 86,770 36.1
Berkshire 573,630 18.5 South Bucks 40,570 22.0 Hillingdon 243,280 50.2
Spelthorne 41,840 -27.3
Runnymede 66,770 49.2 Surrey Heath 59,980 25.8
Hart 44,910 28.2
Basingstoke and Deane 104,890 29.7 Wiltshire 235,720 18.3
Vale of White Horse 69,670 8.2
South Oxfordshire 68,410 13.1 Wycombe 93,430 -2.9
South East 4,703,310 18.1
UK 33,818,100 18.0
Source: Experian Regional Planning Service September 2015 / NLP analysis Note: Contiguous authorities have been selected due to their strong travel to work relationships with
Berkshire (see section 3.0 for further details on travel to work flows)
2.4 Within Berkshire, Reading and West Berkshire represent the largest economies in employment terms, accommodating 115,310 and 110,450 workforce jobs respectively in 2015. Bracknell Forest represents the smallest economy with 71,600 total workforce jobs.
2.5 The majority (85%) of this total employment (workforce jobs) relates to employee jobs, with the remainder (15%) relating to self-employed workers.
2.6 The scale of employment within Berkshire authorities is generally higher than many of its adjoining areas such as South Bucks, Spelthorne, Hart, South Oxfordshire and Runnymede. The only adjoining authority areas recording more workforce jobs than the two largest Berkshire authorities (of Reading and West Berkshire) are Hillingdon and Wiltshire (recording 243,280 and 235,720 workforce jobs respectively).
2.7 Over the last 18 years, workforce jobs have increased across all Berkshire authorities, with Wokingham and West Berkshire recording the highest rates of growth at 36.1% and 31.9% respectively, both outperforming the Berkshire wide average of 18.5%. In contrast, Bracknell Forest and Reading recorded the
Berkshire Functional Economic Market Area Study: Final Report
10050901v11 P9
lowest rates of employment growth (at 8.6% and 10.6%) which was lower than the majority of adjoining authorities across the wider sub-region (Table 2.1).
Sector Strengths and Clusters
2.8 In relative terms, the Berkshire economy supports a strong concentration of jobs in telecoms, IT, professional services and utilities compared with the South East as a whole (Figure 2.2). It is underrepresented in terms of employment within the air and water transport, agriculture and social care sectors when compared with the wider regional average sector mix.
2.9 Within Berkshire, these sector trends and concentrations significantly vary geographically, as shown in Figure 2.2 below. The Berkshire overrepresentation in telecoms employment is reflected most notably within the local economies of Slough, West Berkshire and Bracknell Forest, while Wokingham stands out as recording significant concentrations of jobs within the IT sector.
2.10 Professional services is well represented across the whole of Berkshire, although particular clusters are accommodated within Bracknell Forest and Reading. Financial and insurance sectors are underrepresented compared to the South East average within all Berkshire authorities apart from Reading.
2.11 Slough accommodates a relatively high proportion of jobs within land transport sectors and wholesale, with the latter also accounting for significant numbers of jobs in Bracknell Forest and West Berkshire. Slough and West Berkshire also support strong concentrations of manufacturing employment, above the South East average, in contrast to the other four Berkshire authorities.
2.12 With regards to consumer-related services, retail employment is under-represented in all but one Berkshire authority (Reading), with Windsor & Maidenhead standing out as recording significant proportions of jobs within the recreation and hospitality sectors. More generally, tourism represents an important industry across the whole of Berkshire, with key visitor attractions including Windsor Castle and race courses at Windsor, Ascot and Newbury.
2.13 It is also possible to identify a number of sector strengths and clusters overlapping the Berkshire border. For example, West Berkshire shares similar characteristics to adjoining Basingstoke & Deane and Wiltshire with regards to a strong representation of manufacturing employment while wholesale employment is strongly represented along the M25/M40 distribution corridor from Slough through South Bucks up to Wycombe (Table 2.2), with pockets of wholesale employment also concentrated within Bracknell Forest and West Berkshire.
2.14 Slough also shares similar employment characteristics to adjoining Hillingdon in terms of transport given its proximity to Heathrow, with admin & support employment also clustered around these locations, much of which related to airport operations. Strong clusters of hospitality related employment are notable within the eastern reaches of Berkshire within the authority areas of Windsor & Maidenhead, Runnymede and South Bucks.
Berkshire Functional Economic Market Area Study: Final Report
P10 10050901v11
Figure 2.2 Employment Location Quotient by Sector (2015)
Source: Experian Regional Planning Service September 2015 / NLP analysis Note: The high concentration of extraction, mining and fuel refining employment in Wokingham can be
explained by the presence of a small number of large extraction and mining companies being headquartered in the Borough
0.0 1.0 2.0 3.0 4.0 5.0
Residential Care & Social Work
Health
Education
Public Administration & Defence
Other Private Services
Administrative & Supportive Services
Professional Services
Real Estate
Finance & Insurance
Computing & Information Services
Telecoms
Media Activities
Recreation
Accommodation & Food Services
Land Transport, Storage & Post
Air & Water Transport
Retail
Wholesale
Construction
Utilities
Manufacturing
Extraction, Mining & Fuel Refining
Agriculture, Forestry & Fishing
Employment Location Quotient (2015)South East = 1
Berkshire
Wokingham
Windsor & Maidenhead
West Berkshire
Slough
Reading
Bracknell Forest
13.7
5.8

Berkshire Functional Economic Market Area Study: Final Report
10050901v11 P11
2.15 The three authorities of South Oxfordshire, Vale of White Horse and Reading all share similarly strong concentrations of professional services employment, due in part to clusters of high value activity at locations such as Milton Park and Harwell Science and Innovation Campus as well as Reading’s role as a key service centre.
Table 2.2 Key Sector Concentrations by Authority (Berkshire and Surrounding Area)
Sector Local Authorities with Strong Employment Representation
Manufacturing Slough, West Berkshire, Surrey Heath, Basingstoke & Deane, Wiltshire
Utilities Runnymede, Reading, Vale of White Horse, Slough, Wycombe
Construction Spelthorne, Wycombe, Basingstoke & Deane, West Berkshire, South Bucks, Vale of White Horse
Wholesale Bracknell Forest, Wycombe, South Bucks, Slough, West Berkshire
Retail Reading, Spelthorne, Wycombe, South Oxfordshire
Transport Hillingdon, Spelthorne, Slough
Hospitality & Recreation
Windsor & Maidenhead, South Oxfordshire, Runnymede, South Bucks
Media Activities South Bucks, Vale of White Horse, Spelthorne, Wycombe Telecoms Hart, Slough, West Berkshire, Bracknell Forest, Reading
IT Wokingham, Slough, Hart, Runnymede
Finance Reading, Basingstoke & Deane, Runnymede Real Estate South Bucks, West Berkshire, Windsor & Maidenhead
Professional ServicesSouth Oxfordshire, Bracknell Forest, Vale of White Horse, Reading
Admin & Support Surrey Heath, Hillingdon, Slough
Public Admin & Defence
Wiltshire, Reading, Spelthorne
Education Wokingham, Vale of White Horse
Health & Social Care Wiltshire, Surrey Heath, Runnymede, Reading
Source: Experian Regional Planning Service September 2015 / NLP analysis Note: ‘Strong employment representation’ refers to sectors with a Location Quotient greater than 1
(when compared with the South East average)
2.16 The TVBLEP Strategic Economic Plan (SEP) identifies the importance of technology based activity to the Thames Valley economy, which sets the economy of TVB apart in relation to future economic growth, both in absolute terms and when considered alongside the role and potential of other LEP areas.
2.17 A recent report published by KPMG mapped the incidence of tech-based employment across every local authority district in England, Scotland and Wales5. On a definition which related largely to the IT sector (hardware and software), it found that Wokingham topped the list in terms of its ‘tech location quotient’ and that each of the other five unitary authority areas within TVB featured in the top 15 nationally.
5 KPMG Tech Monitor UK, October 2013
Berkshire Functional Economic Market Area Study: Final Report
P12 10050901v11
2.18 A more recent Tech Monitor report6 identifies that Reading has the UK’s highest concentration of tech enterprises in the local business population, followed by neighbouring Wokingham and Slough. The report states that all of the top five UK local authorities with the highest concentration of tech enterprises are located in striking distance of the M4 motorway, representing a corridor of tech clusters from Reading and Wokingham in Berkshire to Hounslow in West London, with Slough and Bracknell Forrest in between. This footprint of tech businesses concentrated within the Thames Valley and beyond includes both major multinationals and a host of smaller tech companies. The top ranked local authorities all offer thriving tech ecosystems, targeted support for small tech enterprises as well as plentiful office space at purpose-built business parks for large multinational technology firms.
2.19 Berkshire is home to some very significant digital technology businesses. These range from well-established corporates (like Oracle, Cisco, Microsoft, Dell, Panasonic, Telefonica, Vodafone, Fujitsu and Hewlett Packard) through to awarding winning and high growth SMEs including Datasift, Cloud Distribution and Bullitt Group in Reading and Clearswift in West Berkshire.
Productivity
2.20 Productivity (measured by Gross Value Added [GVA] per worker) within Berkshire’s labour force currently stands at £53,820 per worker, which is higher than both the regional (£49,740) and national (£45,990) equivalent (Table 2.3). In a recent article7, the ONS identifies the TVBLEP area as recording the highest level of labour productivity (measured in terms of GVA per hour worked) of all 39 LEP areas in England. This overall trend varies slightly within the sub-region, with the workforce in Slough, Bracknell Forest and Reading generating marginally higher average levels of GVA than West Berkshire, Windsor & Maidenhead and Wokingham.
6 KPMG Tech Monitor, November 2014 7 ONS Subregional Productivity - February 2015

Berkshire Functional Economic Market Area Study: Final Report
10050901v11 P13
Table 2.3 Average GVA per Workplace Worker by Authority, 2015
GVA Per Worker (2015)
Bracknell Forest £54,955
Reading £54,940 Slough £55,460
West Berkshire £53,530
Windsor & Maidenhead £53,560 Wokingham £50,270
Berkshire £53,820 South Bucks £56,480 Hillingdon £73,350 Spelthorne £65,750
Runnymede £62,340
Surrey Heath £58,780 Hart £46,330
Basingstoke and Deane £46,590
Wiltshire £43,480 Vale of White Horse £49,590
South Oxfordshire £47,640
Wycombe £58,390 South East £49,740
UK £45,990
Source: Experian Regional Planning Service September 2015 / NLP analysis
2.21 In overall terms however, this analysis suggests that the productivity of Berkshire’s workforce is relatively consistent geographically, with no one single location standing out as generating particularly high or low average levels of economic output.
2.22 Labour productivity in Berkshire does however compare less favourably with some other neighbouring locations across the wider sub-region including Hillingdon (£73,350 GVA per worker), Spelthorne (£65,750) and Runnymede (£62,340) (Table 2.3).
2.23 The recently published Thames Valley Berkshire Skills Priority Statement8 notes that in recent years neighbouring areas have out-performed Berkshire in terms of GVA growth, and two recent research reports, (Mapping Local Comparative Advantages in Innovation, BIS 2015 and Benchmarking Local Innovation: The Innovation Geography of the UK, ERC 2015), found that innovation levels amongst Berkshire businesses are lower than might be expected.
Labour Market
2.24 The Berkshire authorities perform unevenly across a range of labour market indicators. Across Berkshire as a whole, the economic activity rate (i.e. the
8 Thames Valley Berkshire Local Enterprise Partnership, Skills Priority Statement, December 2015
Berkshire Functional Economic Market Area Study: Final Report
P14 10050901v11
proportion of working age residents either in or seeking employment) stands at 81.2%, higher than both the regional (80.1%) and national (77.5%) average.
2.25 This varies within Berkshire, with West Berkshire (86.3%) and Bracknell Forest (83.8%) recording the highest economic activity rates (Table 2.4). These proportions are similar to nearby Hart (85.2%), Basingstoke and Deane (85.3%), Surrey Heath (84.5%) and South Oxfordshire (84.4%). In contrast, Reading (76.4%) and Slough (78.7%) are both characterised by lower levels of economic activity than the Berkshire average.
Table 2.4 Labour Market Indicators by Local Authority
Economic
Activity (%) Unemployment
(%)
Resident Skills
NVQ Level 4 and above
No Qualifications
Bracknell Forest 83.8 3.6 38.1 5.2
Reading 76.4 5.1 45.7 6.0
Slough 78.7 4.9 34.0 9.9 West Berkshire 86.3 3.0 47.4 4.0
Windsor & Maidenhead
82.2 3.4 54.4 3.0
Wokingham 81.0 2.9 49.6 2.9
Berkshire 81.2 3.7 45.0 5.2 South Bucks 82.4 3.3 48.0 -
Hillingdon 79.3 6.0 39.8 9.5
Spelthorne 82.0 3.9 32.5 5.5
Runnymede 77.8 3.3 36.4 9.8 Surrey Heath 84.5 3.2 47.6 -
Hart 85.2 2.4 50.4 -
Basingstoke and Deane
85.3 3.7 39.5 3.2
Wiltshire 82.9 3.6 39.7 5.5 Vale of White Horse 79.2 3.1 43.7 6.1
South Oxfordshire 84.4 2.7 54.7 4.8
Wycombe 82.5 5.6 45.2 7.8 South East 80.1 4.4 39.1 5.6
GB 77.5 5.7 36.0 8.8
Source: ONS Annual Population Survey Jan 2014 – June 2015 / NLP analysis
2.26 On the Annual Population Survey measure of unemployment, Berkshire performs relatively well at 3.7% compared with the regional (4.4%) and national (5.7%) equivalents. Again this varies across individual authorities, with Wokingham (2.9%), West Berkshire (3.0%) and Windsor & Maidenhead (3.4%) recording the lowest levels of resident unemployment, while Reading (5.1%) and Slough (4.9%) both record higher than average levels of unemployment when compared with Berkshire and the South East as a whole. These rates are comparable with nearby Wycombe (5.6%) and Hillingdon (6.0%) which stand out within the sub-region as accommodating relatively high levels of unemployment.
Berkshire Functional Economic Market Area Study: Final Report
10050901v11 P15
2.27 As at 2014, some 45% of the resident working age population in Berkshire held an NVQ4 and above qualification, which was higher than the regional (39.1%) and national (36.0%) average. This Berkshire wide average is driven by particularly high levels of NVQ level 4 and above attainment in Windsor & Maidenhead (54.4%) and comparably low attainment within Slough at just 34.0% of the working-age resident population. Other locations across the sub-region with high levels of resident skills include South Oxfordshire (54.7%) and Hart (50.4%), with locations such as Spelthorne (32.5%) and Runnymede (36.4%) recording NVQ4 and above qualification attainment that is more akin to Slough.
2.28 These trends are broadly echoed with regards to the proportion of residents with no formal qualifications, equivalent to 5.2% across Berkshire as a whole. This proportion is nearly doubled in Slough at 9.9% and this is similar to nearby Hillingdon (9.5%) and Runnymede (9.8%).
2.29 The recently published Thames Valley Berkshire Skills Priority Statement identifies six priority sectors for the long term sustainable economic growth of Berkshire. Most of these sectors (and therefore skills issues) are common across the whole of Berkshire. For example, the digital technologies, professional and business services, life science and healthcare, education and care sectors are relatively evenly distributed across the sub-region. There are also some local clusters of economic activity which are likely to create higher demand for certain skills in some areas. For example, the logistics sector is particularly prevalent in the Slough and Thatcham areas, the sub-region’s finance and insurance sector is concentrated in Reading and the hospitality sector is most prevalent in and around Windsor, and, to a lesser extent, in Reading.
Business Demography and Enterprise
2.30 Across Berkshire as a whole, the stock of enterprises amounts to just under 43,000, with Windsor & Maidenhead accommodating the largest number of firms at 9,285 or 22% of the Berkshire total (Table 2.5). West Berkshire and Wokingham also accommodate a sizeable stock of businesses, with Bracknell Forest recording the lowest number of businesses in Berkshire (at 4,670).
2.31 Slough accommodates the highest proportion of larger firms (in employment terms, 250+ employees) in Berkshire, making its business base similar to that of nearby Runnymede and Hillingdon. The TVBLEP Strategic Economic Plan notes that there are well over 200 European or global HQ operations in the LEP area, many of which are long-established and operating in strategically important sectors like pharmaceuticals, petrochemicals, energy, food and IT. The SEP Evidence Base9 states that as of 2011, these foreign owned businesses were responsible for 26% of employment in the LEP area, the second highest percentage behind only the Coventry and Warwickshire LEP area. In location terms, they have tended to gravitate towards the areas’ major
9 Thames Valley Berkshire: Delivering national growth, locally, Strategic Economic Plan, 2015/16 – 2020/21, Evidence Base
Berkshire Functional Economic Market Area Study: Final Report
P16 10050901v11
employment sites such as Slough Trading Estate, Green Park, Thames Valley Park, and Winnersh Triangle.
2.32 Intelligence from the Thames Valley Chamber of Commerce10 identifies that 13 of the World’s Top 15 Software companies (by 2011 revenue) are located in or within 10 miles of the Thames Valley and that the area is a magnet for new investment from software businesses with 80% of foreign owned start-ups operating in this sector.
2.33 According to 2015 ONS Inter Departmental Business Register data, Wokingham, Windsor & Maidenhead and Bracknell Forest accommodate the greatest proportion of smaller firms employing under 10 people, with similar proportions to South Oxfordshire, Basingstoke and Deane and Hart.
2.34 Berkshire is characterised by relatively high levels of business start-ups, with 107.8 business starts per 10,000 working-age population in 2013, significantly higher than the regional (92.3) and national (86.0) average. This high start-up rate is driven in particular by Windsor & Maidenhead (133.9), West Berkshire (115.1) and Wokingham (110.6). Similarly high levels of business start-up are recorded elsewhere across the sub-region in Spelthorne (133.5), South Bucks (147.9) and Surrey Heath (112.3).
2.35 The proportion of the working age population that are self-employed in Berkshire is the same as the national average (10.1%) and the majority of Berkshire authorities fall behind the regional average (11.7%) on this measure of enterprise (Table 2.5). Surrey Heath (14%), Hart (13.5%) and South Oxfordshire (12.4%) all exceed the Berkshire, South East and national average while Wokingham (12.9%) is the only Berkshire authority to record higher levels of self-employment than the regional average (Table 2.5).
10 Thames Valley Chamber of Commerce Group, June 2012 Datasheet
Berkshire Functional Economic Market Area Study: Final Report
10050901v11 P17
Table 2.5 Business Demography Indicators by Local Authority
Self-Employment
(%)
Stock of Enterprises
Business Births per 10,000 Working Age
Population
Bracknell Forest 10.1 4,670 78.9 Reading 8.0 6,705 98.5
Slough 10.1 5,245 106.0
West Berkshire 9.8 8,840 115.1 Windsor & Maidenhead 10.2 9,285 133.9
Wokingham 12.9 8,230 110.6
Berkshire 10.1 42,975 107.8 South Bucks 8.5 5,265 147.9 Hillingdon 9.0 11,630 101.8
Spelthorne 6.9 4,870 133.5
Runnymede 8.4 4,345 96.7 Surrey Heath 14.0 4,880 112.3
Hart 13.5 4,970 105.6
Basingstoke and Deane
8.4 7,395 92.6
Wiltshire 11.4 20,610 83.4 Vale of White Horse 10.7 5,520 81.7
South Oxfordshire 12.4 7,935 110.3
Wycombe 11.1 9,385 104.5 South East 11.7 389,710 92.3
GB 10.1 2,392,965 86.0
Source: ONS Inter-Departmental Business Register 2015, Annual Population Survey Jul 2014 – Jun 2015, ONS Business Demography 2013, ONS Mid-year population estimates
Synthesis
2.36 Within Berkshire, Reading and West Berkshire represent the largest economies in employment terms, with Bracknell Forest the smallest. Berkshire has recorded strong job growth in recent years that has outperformed the regional and national average. The scale of employment within Berkshire authorities is generally higher than many of its adjoining areas, with the exception of Hillingdon and Wiltshire to the east and west of the TVBLEP area respectively.
2.37 In relative terms, the Berkshire economy supports a strong concentration of jobs in high value telecoms, IT, professional services and utilities industries. Recent research identifies the M4 corridor as accommodating the deepest concentration of tech companies in the UK. Berkshire is underrepresented in terms of air and water transport (except in Slough), agriculture and social care sectors when compared with the wider regional average sector mix.
2.38 Within Berkshire, these sector trends and concentrations vary geographically, and it is possible to identify a number of sector strengths and clusters. For example, although professional services is well represented across the whole of Berkshire, particular clusters are accommodated within Bracknell Forest and
Berkshire Functional Economic Market Area Study: Final Report
P18 10050901v11
Reading. West Berkshire shares similar characteristics to adjoining Basingstoke & Deane and Wiltshire with regards to a strong representation of manufacturing employment while wholesale employment is strongly represented along the M25/M40 distribution corridor from Slough through South Bucks up to Wycombe (with pockets of wholesale employment also found in Bracknell Forest and West Berkshire).
2.39 Slough shares similar employment characteristics to adjoining Hillingdon in terms of transport given its proximity to Heathrow, with admin & support employment also clustered around these locations, much of which is related to airport operations. Strong clusters of hospitality related employment are notable within the eastern reaches of Berkshire within the authority areas of Windsor & Maidenhead, Runnymede and South Bucks.
2.40 The Berkshire authorities perform unevenly across a range of labour market and business demography indicators. Slough shares a number of similar labour market and business characteristics (such as economic activity, resident skills and business start-up) with nearby Hillingdon, Runnymede and Wycombe, while similar characteristics can also be identified between Windsor and Maidenhead and Wokingham, particularly with regards to the size profile of firms and strong enterprise performance.
10050
3.0
3.1
3.2
3.3
3.4
3.5
Be
901v11
F
Thtoth
T
Tharartodelepepo
TTreth
IndethH
Fig
So
Thas
erkshire Functio
Functio
his section o define Trahe relationsh
Travel to
he Office foreas where rea. Definin
o identify theefinition of T
east 75% of eople who wopulation of
TWAs repreecruit their ehese TTWAs
n 2015, the Oefine 228 TT
hree broad Teathrow an
gure 3.1 TVBL
ource: ONS
he Readings well as the
nal Economic M
onal La
examines thvel to Workhip between
o Work A
or National Sthe majorityg labour mae Travel to WTTWAs offean area’s r
work in the f at least 3,5
esent the aremployees, s well beyo
ONS used 2TWAs that TTWAs thatd Newbury
LEP Travel to W
S - Based on 201
g TTWA incle majority o
Market Area Stu
abour M
he latest cok Areas (TTWn where peo
Areas
Statistics (Oy of the resarket areasWork Areas
ered by the resident worarea also re500.
rea from whwhile key snd the imm
2011 Censucover the wt cover the T(Figure 3.1
Work Areas, 201
11 Census com
ludes the wof Bracknell
dy: Final Repor
Market
ommuting floWA) acrossople live an
ONS) defineident popul requires an
s (TTWAs) oONS is thatrkforce is emeside. The a
hich local bustrategic rouediate sub-
us data on whole of theTVBLEP ar).
11
mmuting data
whole of ReaForest and
rt
Areas
ows data fros Berkshire,d where the
es labour maation also wnalysis of coof a local ect they are thmployed, anarea must a
usinesses autes have th-region.
home and wUK. This a
rea, namely
ading and Wd parts of So
om the 201, in order toey work.
arket areasworks in theommuting fconomy. Thhe area fromnd at least 7also have a
are most likehe ability to
work addresanalysis ideny Reading, S
Wokingham outh Oxford
P19
1 Census consider
as those e same lows data
he standardm which at 75% of the working
ely to extend
sses to ntifies Slough and
Boroughs dshire,
9

P20
3.6
3.7
3.8
3.9
11 Good Grow
Berkshire
West Besubstanmeasurseries othe purppopulat
Parts ofincludinthe majonumberLondon
MeanwhDistrict
A compprepareidentifiework flobe seenmost noupon tra
By contbroadly althougexample
Figure 3.2
Source:
wth for Cities 201
Functional Econ
erkshire, Wntiated by rered the curreof socio-ecoposes of theion of 250,0
f Eastern Beng all of Slouority of this r of authoriti Boroughs
hile, the Neas well as p
parison of thed using 200es a markedows in and an within Easotably Heathavel to work
trast, TTWAsimilar oveh the Basine by taking
TVBLEP Tra
ONS - Based
15, PwC and De
nomic Market A
Windsor & Maecent reseaent perform
onomic factoe research; 000 or more
erkshire fallugh BorougTTWA falls
ies includingof Hillingdo
ewbury TTWparts of Wilt
he 2011 bas01 Census d change in around the Tstern parts ohrow Airpork flows.
As in the moer the last tegstoke TTWin the area
vel to Work Are
d on 2001 Cens
emos
Area Study: Fina
aidenheadarch undertamance of a rors. This dethis was de
e and accor
l within the gh and partss to the easg Runnyme
on and Kings
WA comprisetshire, Basi
sed ONS TTcommutingthe spatial
TVBLEP arof Berkshirert) appear to
ore western en years, doWA has exte
around Ald
eas, 2001
sus commuting d
al Report
and Hart. Taken by PwCange of the
efines Readefined on thrding to TTW
Slough ands of Windsot of the TVB
ede, Spelthoston upon T
es the majongstoke an
TWAs with t data (as sudistribution
rea. The moe, where weo have had
parts of theominated byended furthdermaston.
data
This geograpC and Dem
e largest UKing & Bracke basis tha
WAs.
d Heathrow or & MaidenBLEP area, orne, SouthThames.
ority of Westd Deane an
the equivaleummarised and patter
ost significaestern parts an increasi
e LEP area y a single Ner into Wes
10050
phy is broadmos11 which K cities agaiknell as a ciat it has a
TTWA, nhead, altho
comprisingh Bucks and
t Berkshire nd Test Vall
ent analysisin Figure 3
rn of travel tnt changes
s of London ing influenc
have remaNewbury TTWst Berkshire
0901v11
dly
nst a ity for
ough g a d the
ley.
s .2) to can (and e
ined WA,
e, for
Berkshire Functional Economic Market Area Study: Final Report
10050901v11 P21
3.10 The 2011 Census data shows that the key commercial centres of Maidenhead and Slough now sit within the Slough and Heathrow TTWA, having previously featured as part of the Wycombe & Slough TTWA in 2001. This suggests that these centres have developed stronger ties with Eastern Berkshire and West London in labour market terms, and conversely become less connected to Buckinghamshire than they have been in the past. This trend would also appear to reflect Heathrow’s increasing draw in labour market terms, particularly from eastern parts of Berkshire.
3.11 Another interesting trend is the declining influence of Reading upon more eastern parts of Berkshire over the last 10 years in travel to work terms, to the extent that Windsor, which previously fell within the Reading & Bracknell TTWA, now sits within a Slough and Heathrow TTWA.
Commuting Flows
3.12 Whilst this ONS analysis provides a useful starting point to think about the spatial geography of labour market areas across the sub-region, it is also useful to examine local level commuting flows in more detail to understand the relative contribution that each of the TVBLEP authorities play in supplying labour across the sub-region.
3.13 Table 3.1 summarises a number of key commuting indicators for the six Berkshire authorities, drawing on the latest 2011 Census travel to work data. This shows that West Berkshire, Wokingham and Reading accommodate the largest resident workforce in Berkshire, home to 82,150, 81,790 and 80,200 working residents respectively, each of which is equivalent to 18% of the total Berkshire resident workforce. At 62,180, Bracknell Forest accommodates the smallest resident workforce in Berkshire (Table 3.1).
3.14 Reading and West Berkshire also accommodate the highest number of workplace workers (or workforce jobs), with Bracknell Forest again recording the lowest number of workplace workers (at 54,490).
3.15 A significant proportion of resident workers in both Reading and West Berkshire also work within the same authority area, giving these two authorities the highest labour self-containment rates in Berkshire, at 51.2% and 57.5% respectively. These rates both fall above the Berkshire wide average self-containment rate of 46.9%. In contrast, labour self-containment is much lower in the smaller economies of Bracknell Forest (41.7%), Slough (43.0%), Windsor & Maidenhead (45.8%) and Wokingham (39.9%), all of which fall below the Berkshire wide average.
3.16 The rate of labour self-containment has reduced across all Berkshire authorities over the 10 years between the 2001 and 2011 Census, indicating that a lower proportion of Berkshire residents also worked within the LEP area in 2011 compared with the position in 2001. The most significant reduction in self-containment was recorded in Slough (having reduced from 55.6% in 2001 to 43.0% in 2011), followed closely by Reading (reducing from 63.0% in 2001 to 51.2% in 2011).
Berkshire Functional Economic Market Area Study: Final Report
P22 10050901v11
Table 3.1 2011 Commuting Data by Local Authority
Bracknell Forest
Reading Slough West
Berkshire Windsor &
Maidenhead Wokingham Berkshire
Total working residents† 62,180 80,200 67,560 82,150 74,500 81,790 448,380
Total workplace workers* 54,490 83,350 68,400 80,840 71,190 63,530 421,800
Live and work in Local Authority*
25,930 41,040 29,080 47,230 34,140 32,670 210,090
Resident self-containment rate*
41.7% 51.2% 43.0% 57.5% 45.8% 39.9% 46.9%
Alternative resident self-containment rate¥ 42% 51% 43% 56% 40% 33% n/a
Out-commuting workers 36,250 39,160 38,480 34,920 40,350 49,110 238,270
Top out commuting destinations
Windsor and Maidenhead
Wokingham
Surrey Heath
Wokingham
West Berkshire
South Oxfordshire
Windsor and Maidenhead
Hillingdon
South Bucks
Reading
Basingstoke and Deane
Wokingham
Slough
Hillingdon
Westminster
Reading
Bracknell Forest
Windsor and Maidenhead
Surrey Heath
South Oxfordshire
Hillingdon
South Bucks
Basingstoke and Deane
Westminster
In-commuting workers 28,560 42,310 39,330 33,610 37,050 30,850 211,710
Top in-commuting destinations
Wokingham
Reading
Windsor and Maidenhead
Wokingham
West Berkshire
South Oxfordshire
Windsor and Maidenhead
South Bucks
Hillingdon
Basingstoke and Deane
Reading
Wokingham
Slough
Bracknell Forest
Wokingham
Reading
Bracknell Forest
West Berkshire
South Oxfordshire
South Bucks
Hillingdon
Basingstoke and Deane
Net flow of workers 7,690 outflow 3,150 inflow 850 inflow 1,310 outflow 3,300 outflow 18,260 outflow 26,560 outflow
Source: ONS Census 2011 / NLP analysis / Berkshire (including South Bucks) Strategic Housing Market Assessment (Final Report, February 2016) † The total number of working residents includes those that work mainly at or from home, at an offshore installation, outside the UK, and with no fixed employment location * includes local residents mainly working at or from home ¥ These alternative figures for resident self-containment are presented in the Berkshire (including South Bucks) Strategic Housing Market Assessment (Final Report, February 2016) and do
not include the ONS ‘other’ categories of commuters (i.e. those that work mainly at or from home, at an offshore installation, outside the UK, or with no fixed employment location). They have been included here for reference only
Note: Employment (workplace workers) figures above differ from those presented in Table 2.1 due to the different sources and dates associated with this data

Berkshire Functional Economic Market Area Study: Final Report
10050901v11 P23
3.17 Table 3.2 uses 2011 Census travel-to-work statistics to compare the proportion of working-age population categorised as ‘working mainly or at home’ across Berkshire. This shows that the prevalence of home-working varies across the LEP area and is highest in Windsor & Maidenhead (14.9%), Wokingham (13.4%) and West Berkshire (13.2%), all of which fall above the Berkshire wide average of 11.6%. This reflects that, typically, rural areas have more remote workers and home-based businesses than urban centres.
Table 3.2 Proportion of Working-age Population working mainly at or from home
2011 Bracknell Forest 11.1%
Reading 8.8%
Slough 7.4%
West Berkshire 13.2%
Windsor & Maidenhead 14.9%
Wokingham 13.4%
Berkshire 11.6%
Source: 2011 Census travel-to-work statistics
3.18 In absolute terms, Wokingham records the largest flow of out-commuters in Berkshire, followed by Windsor & Maidenhead, Reading and Slough.
3.19 Reading and Slough accommodate the largest flows of in-commuters, reflecting the size and influence of their commercial centres. These represent the only two Berkshire authorities that are net importers of labour in overall terms (Table 3.1), with the other four Berkshire authorities characterised as net exporters of labour. Wokingham stands out as recording the largest net outflow of workers in absolute terms at 18,260.
3.20 Given Berkshire’s proximity to London, the Capital has a significant influence upon commuting flows to and from the sub-region. Of the 238,270 out-commuters from Berkshire, just over 42,800 or 18% travel to work in London Boroughs. These flows vary significantly by Berkshire authority, with Slough and Windsor & Maidenhead accounting for the largest London out-commuting flows in both absolute and proportionate terms. In contrast, out-commuting flows to London are much lower from Reading and West Berkshire, which is likely to reflect their relative distance from the Capital.
3.21 London also has an influence upon in-commuting labour flows to Berkshire, although in absolute terms these flows are less significant. Of the 211,710 in-commuting workers to Berkshire, 24,290 or 12% travel from London Boroughs. Again this trend varies by Berkshire authority, with Slough accommodating the vast majority of these in-commuting flows.
3.22 The geography of in and out commuting flows is complex and varies by Berkshire authority. For example, Slough and Windsor & Maidenhead both have strong labour market relationships with South Bucks to the north and Hillingdon to the east, with Heathrow in particular representing a key driver
Berkshire Functional Economic Market Area Study: Final Report
P24 10050901v11
behind these flows. Labour flows with Buckinghamshire authorities such as Wycombe and Chiltern are also strongest within this eastern part of Berkshire.
3.23 Meanwhile, West Berkshire and Reading have strong labour market relationships with adjoining Oxfordshire, Hampshire and Wiltshire, while Bracknell Forest and Wokingham’s relative proximity to Surrey mean that in and out commuting flows to authorities such as Surrey Heath, Hart and Rushmoor are strongest here.
Defining Local Travel to Work Areas
3.24 Drawing upon the Census 2011 commuting flows data for the six Berkshire authorities, it is possible to define local travel to work areas for each authority. This uses the ONS definition of a travel to work area being the area from which at least 75% of the authority’s resident workforce is employed, and at least 75% of the people who work in the authority also reside. The local travel to work area for each authority is presented in turn below, with the Middle level Super Output Areas (MSOAs) that fall within the authority’s local travel to work area shaded in green.
Bracknell Forest
3.25 The local travel to work area for Bracknell Forest principally extends east to west along the M4 corridor from Windsor and the western part of Slough in the east to Newbury in the west (Figure 3.3). The M4 corridor also connects Bracknell Forest with the key economic centres of Maidenhead in the north and Reading in the west. In addition, the local travel to work area for Bracknell Forest encompasses areas to the south of the authority, reaching as far as Aldershot in the south and parts of eastern Basingstoke & Deane in the south-west. As well as the M4, the M3 to the south of Bracknell Forest represents a key strategic route connecting the authority to other economic centres in the wider sub-region.
Berkshire Functional Economic Market Area Study: Final Report
10050901v11 P25
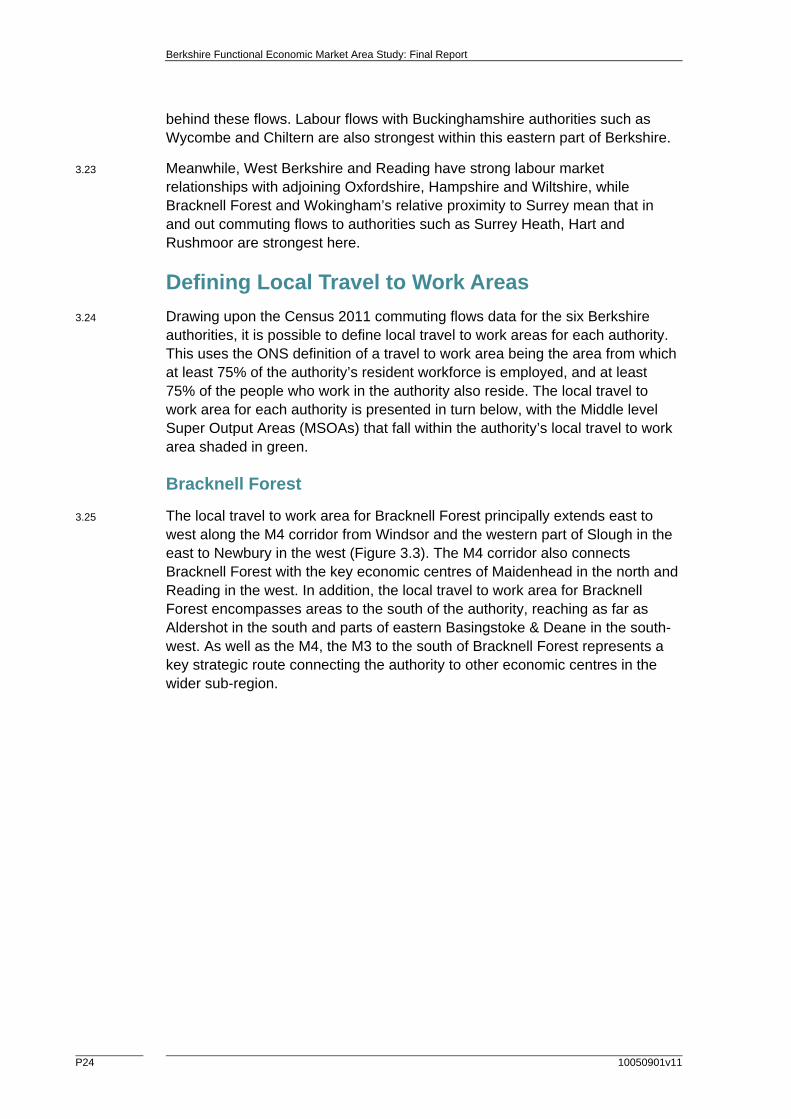
Figure 3.3 Local Travel to Work Area for Bracknell Forest, 2011
Source: Census 2011 / NLP analysis
3.26 It is clear from this analysis at the MSOA level that the most significant concentration of travel-to-work flows to and from Bracknell Forest operate between the adjoining authorities of Hart, Wokingham, Surrey Heath and Windsor & Maidenhead, while Reading also provides a relatively high concentration of travel-to-work flows.
Reading
3.27 Reading’s local travel to work area extends in a broad radius around the Borough, generally focused east to west along the M4 corridor taking in the key centres of Wokingham to the south east and Newbury to the west. Aside from a small number of MSOAs at the western edge of Bracknell Forest, Wokingham Borough represents the eastern boundary of Reading’s local travel to work area. Southern parts of South Oxfordshire District fall within its local travel to work area, although in general terms the local travel to work area does not extend far beyond Berkshire (Figure 3.4).
Note: Figures do not include working residents that work mainly at or from home, at an offshore installation, outside the UK, or with no fixed workplace due to ONS data limitations
Travel to work total commuting flow, 2011 by MSOA:
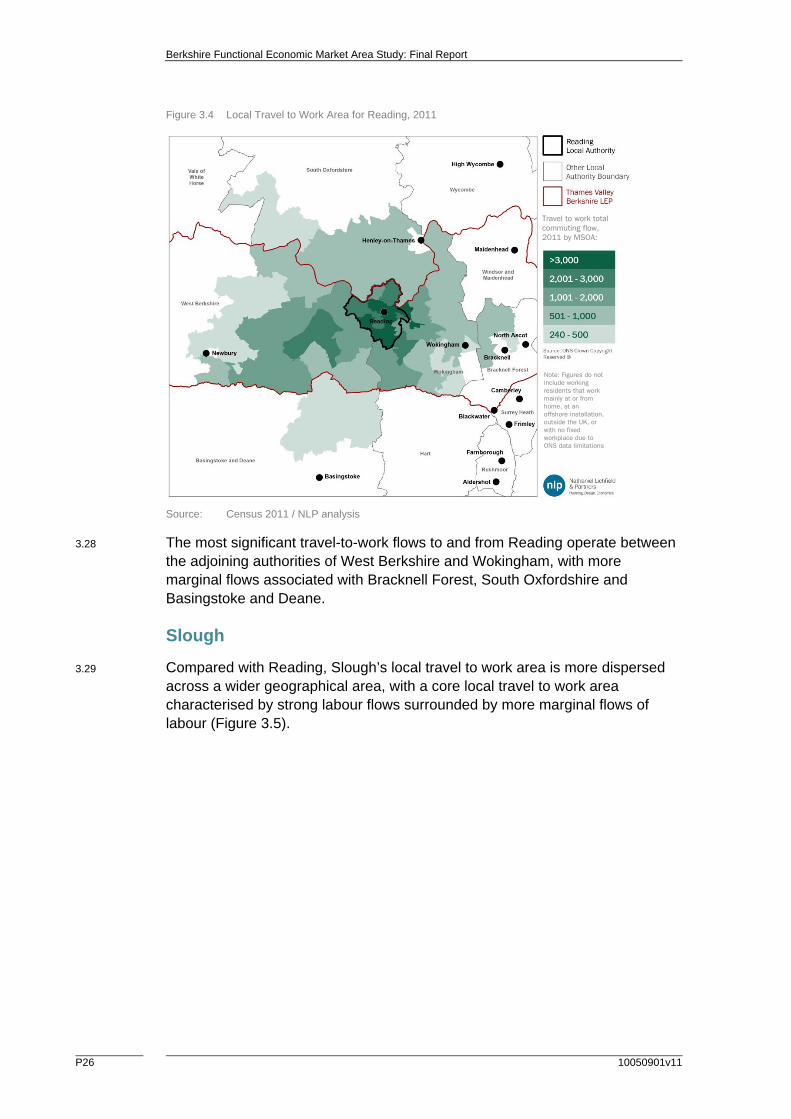
Berkshire Functional Economic Market Area Study: Final Report
P26 10050901v11
Figure 3.4 Local Travel to Work Area for Reading, 2011
Source: Census 2011 / NLP analysis
3.28 The most significant travel-to-work flows to and from Reading operate between the adjoining authorities of West Berkshire and Wokingham, with more marginal flows associated with Bracknell Forest, South Oxfordshire and Basingstoke and Deane.
Slough
3.29 Compared with Reading, Slough’s local travel to work area is more dispersed across a wider geographical area, with a core local travel to work area characterised by strong labour flows surrounded by more marginal flows of labour (Figure 3.5).
Travel to work total commuting flow, 2011 by MSOA:
Note: Figures do not include working residents that work mainly at or from home, at an offshore installation, outside the UK, or with no fixed workplace due to ONS data limitations
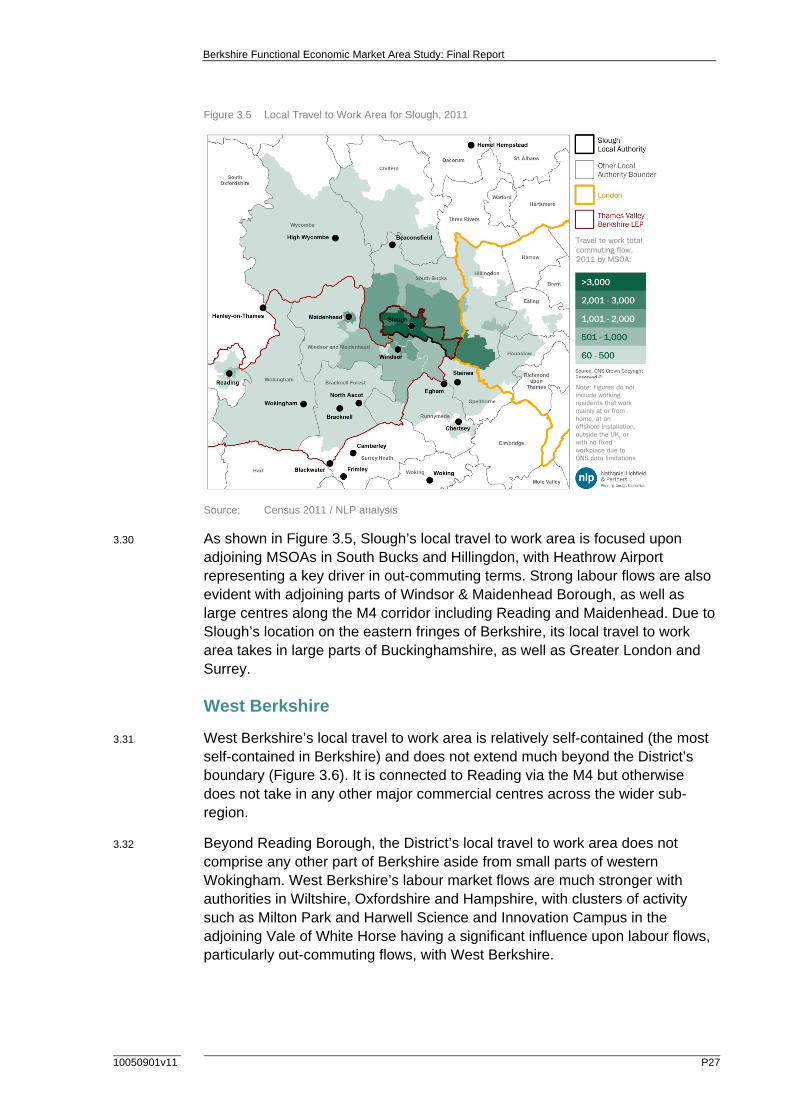
Berkshire Functional Economic Market Area Study: Final Report
10050901v11 P27
Figure 3.5 Local Travel to Work Area for Slough, 2011
Source: Census 2011 / NLP analysis
3.30 As shown in Figure 3.5, Slough’s local travel to work area is focused upon adjoining MSOAs in South Bucks and Hillingdon, with Heathrow Airport representing a key driver in out-commuting terms. Strong labour flows are also evident with adjoining parts of Windsor & Maidenhead Borough, as well as large centres along the M4 corridor including Reading and Maidenhead. Due to Slough’s location on the eastern fringes of Berkshire, its local travel to work area takes in large parts of Buckinghamshire, as well as Greater London and Surrey.
West Berkshire
3.31 West Berkshire’s local travel to work area is relatively self-contained (the most self-contained in Berkshire) and does not extend much beyond the District’s boundary (Figure 3.6). It is connected to Reading via the M4 but otherwise does not take in any other major commercial centres across the wider sub-region.
3.32 Beyond Reading Borough, the District’s local travel to work area does not comprise any other part of Berkshire aside from small parts of western Wokingham. West Berkshire’s labour market flows are much stronger with authorities in Wiltshire, Oxfordshire and Hampshire, with clusters of activity such as Milton Park and Harwell Science and Innovation Campus in the adjoining Vale of White Horse having a significant influence upon labour flows, particularly out-commuting flows, with West Berkshire.
Travel to work total commuting flow, 2011 by MSOA:
Note: Figures do not include working residents that work mainly at or from home, at an offshore installation, outside the UK, or with no fixed workplace due to ONS data limitations
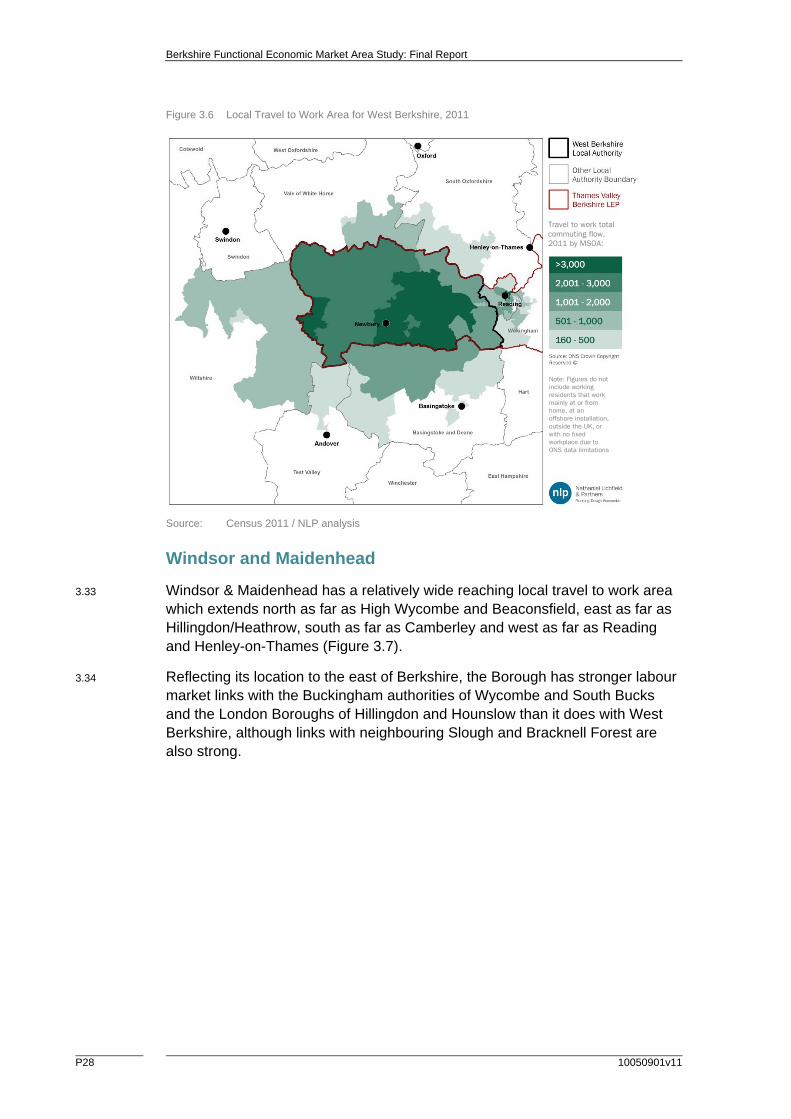
Berkshire Functional Economic Market Area Study: Final Report
P28 10050901v11
Figure 3.6 Local Travel to Work Area for West Berkshire, 2011
Source: Census 2011 / NLP analysis
Windsor and Maidenhead
3.33 Windsor & Maidenhead has a relatively wide reaching local travel to work area which extends north as far as High Wycombe and Beaconsfield, east as far as Hillingdon/Heathrow, south as far as Camberley and west as far as Reading and Henley-on-Thames (Figure 3.7).
3.34 Reflecting its location to the east of Berkshire, the Borough has stronger labour market links with the Buckingham authorities of Wycombe and South Bucks and the London Boroughs of Hillingdon and Hounslow than it does with West Berkshire, although links with neighbouring Slough and Bracknell Forest are also strong.
Travel to work total commuting flow, 2011 by MSOA:
Note: Figures do not include working residents that work mainly at or from home, at an offshore installation, outside the UK, or with no fixed workplace due to ONS data limitations
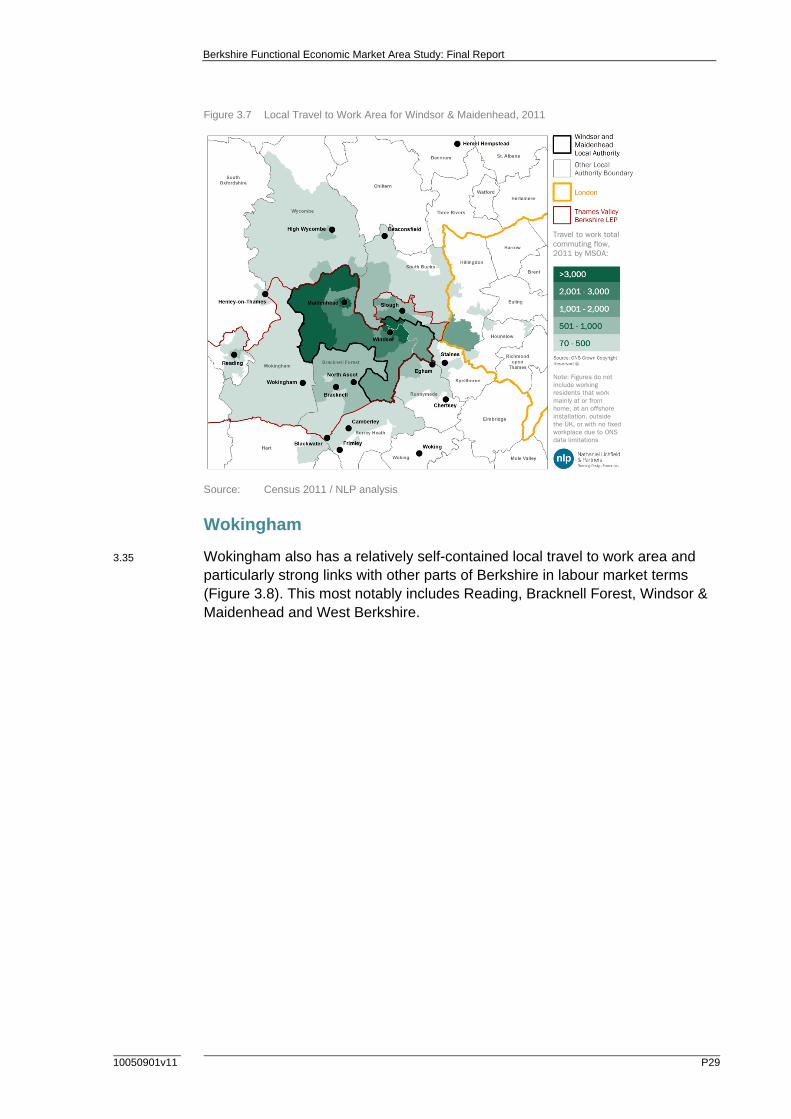
Berkshire Functional Economic Market Area Study: Final Report
10050901v11 P29
Figure 3.7 Local Travel to Work Area for Windsor & Maidenhead, 2011
Source: Census 2011 / NLP analysis
Wokingham
3.35 Wokingham also has a relatively self-contained local travel to work area and particularly strong links with other parts of Berkshire in labour market terms (Figure 3.8). This most notably includes Reading, Bracknell Forest, Windsor & Maidenhead and West Berkshire.
Travel to work total commuting flow, 2011 by MSOA:
Note: Figures do not include working residents that work mainly at or from home, at an offshore installation, outside the UK, or with no fixed workplace due to ONS data limitations
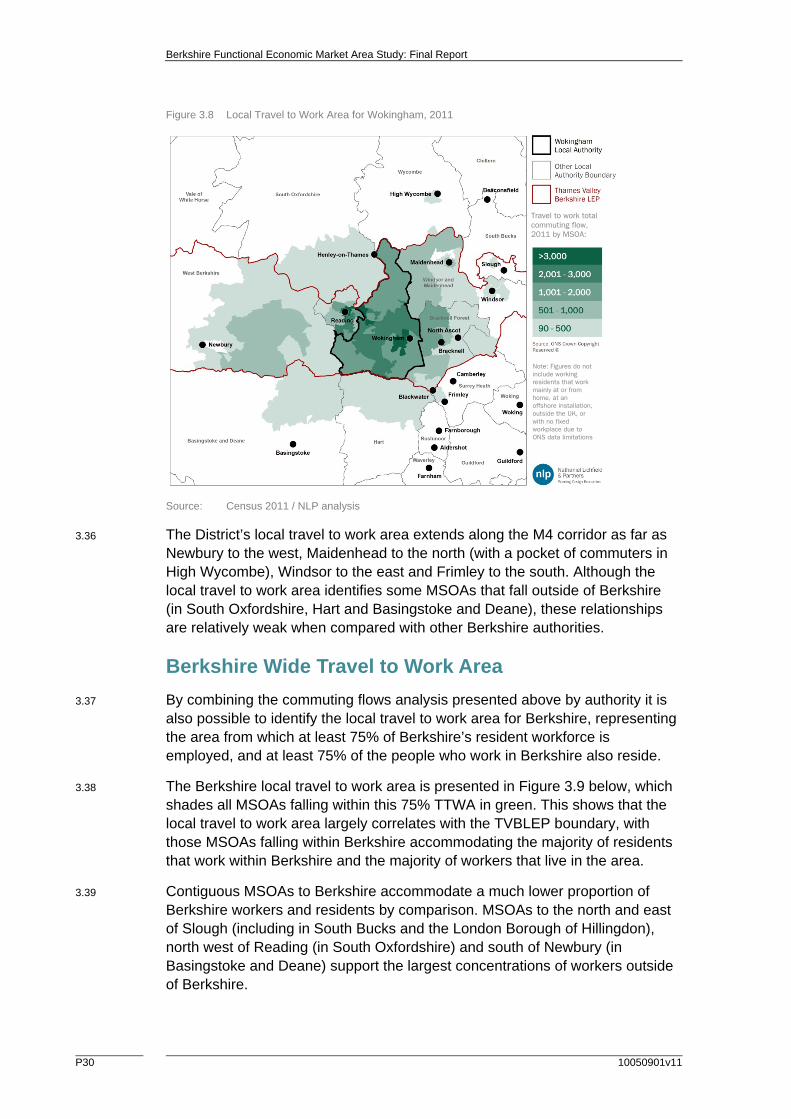
Berkshire Functional Economic Market Area Study: Final Report
P30 10050901v11
Figure 3.8 Local Travel to Work Area for Wokingham, 2011
Source: Census 2011 / NLP analysis
3.36 The District’s local travel to work area extends along the M4 corridor as far as Newbury to the west, Maidenhead to the north (with a pocket of commuters in High Wycombe), Windsor to the east and Frimley to the south. Although the local travel to work area identifies some MSOAs that fall outside of Berkshire (in South Oxfordshire, Hart and Basingstoke and Deane), these relationships are relatively weak when compared with other Berkshire authorities.
Berkshire Wide Travel to Work Area
3.37 By combining the commuting flows analysis presented above by authority it is also possible to identify the local travel to work area for Berkshire, representing the area from which at least 75% of Berkshire’s resident workforce is employed, and at least 75% of the people who work in Berkshire also reside.
3.38 The Berkshire local travel to work area is presented in Figure 3.9 below, which shades all MSOAs falling within this 75% TTWA in green. This shows that the local travel to work area largely correlates with the TVBLEP boundary, with those MSOAs falling within Berkshire accommodating the majority of residents that work within Berkshire and the majority of workers that live in the area.
3.39 Contiguous MSOAs to Berkshire accommodate a much lower proportion of Berkshire workers and residents by comparison. MSOAs to the north and east of Slough (including in South Bucks and the London Borough of Hillingdon), north west of Reading (in South Oxfordshire) and south of Newbury (in Basingstoke and Deane) support the largest concentrations of workers outside of Berkshire.
Travel to work total commuting flow, 2011 by MSOA:
Note: Figures do not include working residents that work mainly at or from home, at an offshore installation, outside the UK, or with no fixed workplace due to ONS data limitations
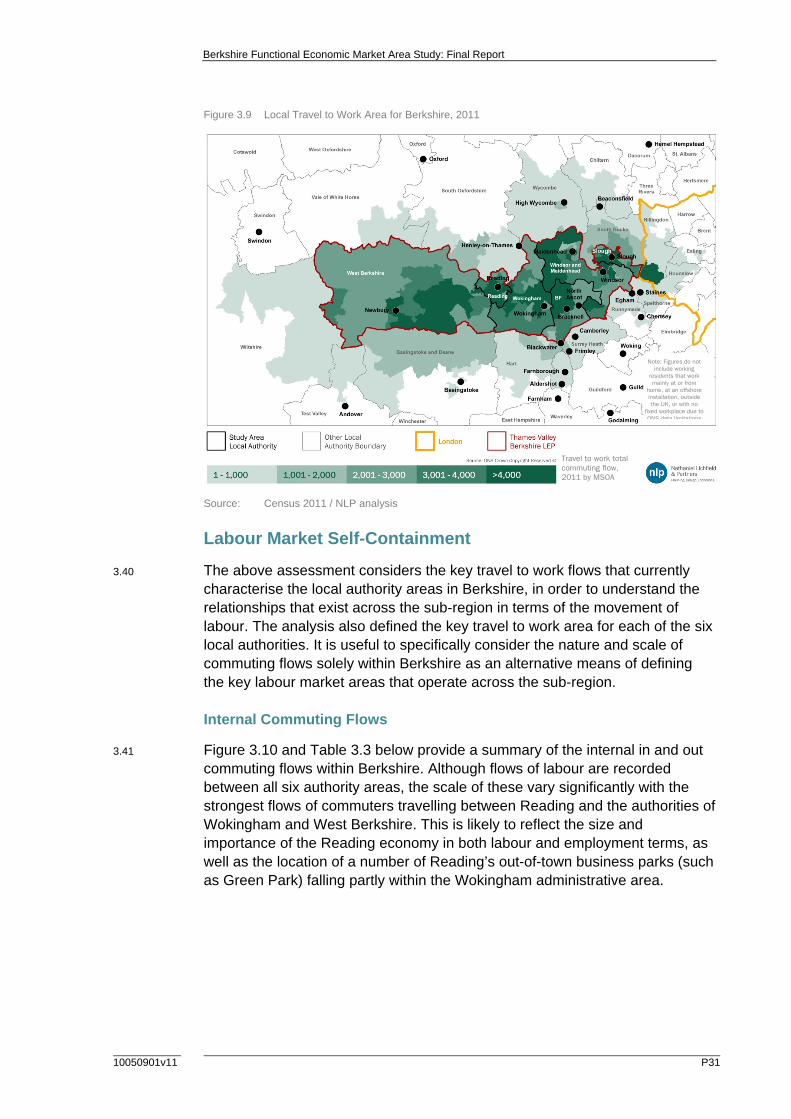
Berkshire Functional Economic Market Area Study: Final Report
10050901v11 P31
Figure 3.9 Local Travel to Work Area for Berkshire, 2011
Source: Census 2011 / NLP analysis
Labour Market Self-Containment
3.40 The above assessment considers the key travel to work flows that currently characterise the local authority areas in Berkshire, in order to understand the relationships that exist across the sub-region in terms of the movement of labour. The analysis also defined the key travel to work area for each of the six local authorities. It is useful to specifically consider the nature and scale of commuting flows solely within Berkshire as an alternative means of defining the key labour market areas that operate across the sub-region.
Internal Commuting Flows
3.41 Figure 3.10 and Table 3.3 below provide a summary of the internal in and out commuting flows within Berkshire. Although flows of labour are recorded between all six authority areas, the scale of these vary significantly with the strongest flows of commuters travelling between Reading and the authorities of Wokingham and West Berkshire. This is likely to reflect the size and importance of the Reading economy in both labour and employment terms, as well as the location of a number of Reading’s out-of-town business parks (such as Green Park) falling partly within the Wokingham administrative area.
Travel to work total commuting flow, 2011 by MSOA
Note: Figures do not include working
residents that work mainly at or from
home, at an offshore installation, outside the UK, or with no
fixed workplace due to ONS data limitations
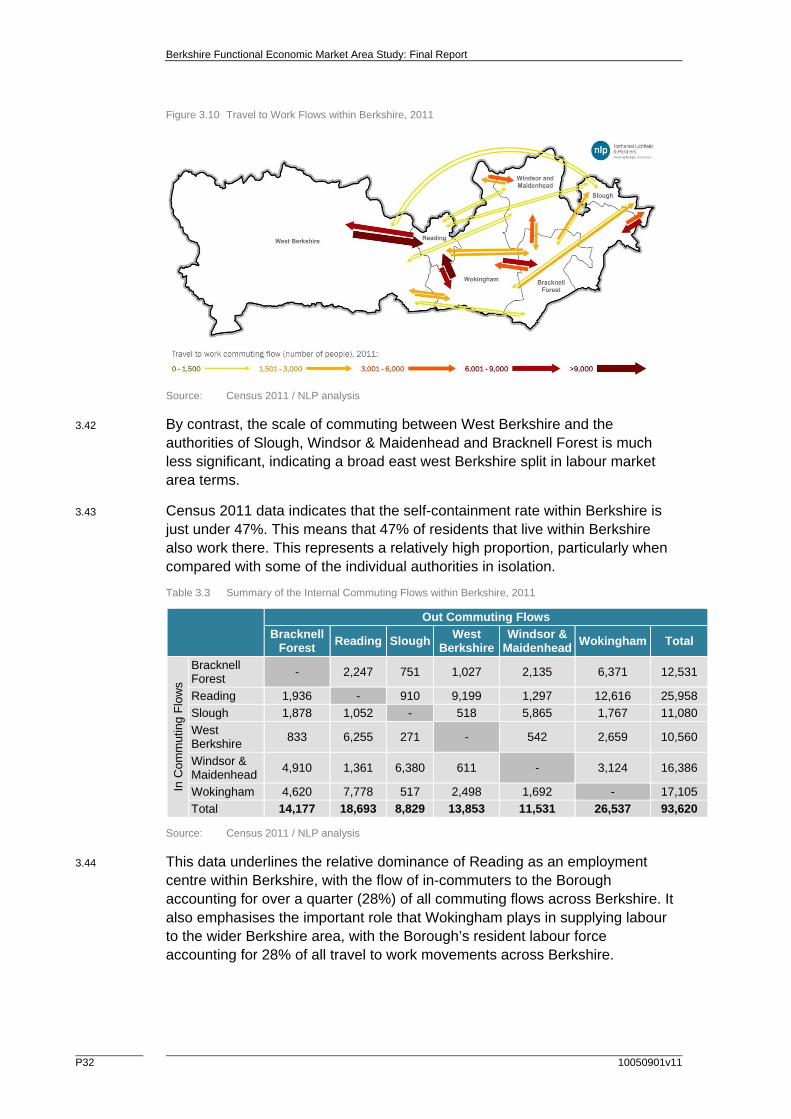
Berkshire Functional Economic Market Area Study: Final Report
P32 10050901v11
Figure 3.10 Travel to Work Flows within Berkshire, 2011
Source: Census 2011 / NLP analysis
3.42 By contrast, the scale of commuting between West Berkshire and the authorities of Slough, Windsor & Maidenhead and Bracknell Forest is much less significant, indicating a broad east west Berkshire split in labour market area terms.
3.43 Census 2011 data indicates that the self-containment rate within Berkshire is just under 47%. This means that 47% of residents that live within Berkshire also work there. This represents a relatively high proportion, particularly when compared with some of the individual authorities in isolation.
Table 3.3 Summary of the Internal Commuting Flows within Berkshire, 2011
Out Commuting Flows
Bracknell Forest
Reading SloughWest
BerkshireWindsor &
Maidenhead Wokingham Total
In C
omm
utin
g F
low
s
Bracknell Forest
- 2,247 751 1,027 2,135 6,371 12,531
Reading 1,936 - 910 9,199 1,297 12,616 25,958
Slough 1,878 1,052 - 518 5,865 1,767 11,080
West Berkshire
833 6,255 271 - 542 2,659 10,560
Windsor & Maidenhead
4,910 1,361 6,380 611 - 3,124 16,386
Wokingham 4,620 7,778 517 2,498 1,692 - 17,105
Total 14,177 18,693 8,829 13,853 11,531 26,537 93,620
Source: Census 2011 / NLP analysis
3.44 This data underlines the relative dominance of Reading as an employment centre within Berkshire, with the flow of in-commuters to the Borough accounting for over a quarter (28%) of all commuting flows across Berkshire. It also emphasises the important role that Wokingham plays in supplying labour to the wider Berkshire area, with the Borough’s resident labour force accounting for 28% of all travel to work movements across Berkshire.
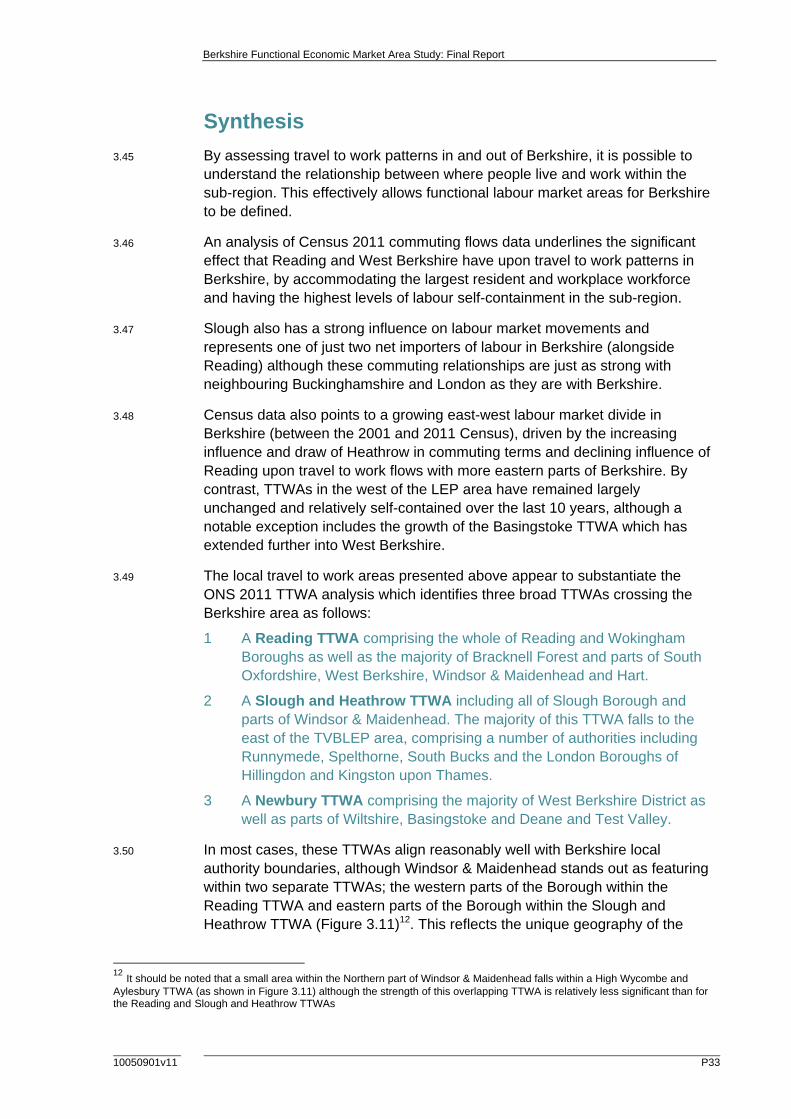
Berkshire Functional Economic Market Area Study: Final Report
10050901v11 P33
Synthesis
3.45 By assessing travel to work patterns in and out of Berkshire, it is possible to understand the relationship between where people live and work within the sub-region. This effectively allows functional labour market areas for Berkshire to be defined.
3.46 An analysis of Census 2011 commuting flows data underlines the significant effect that Reading and West Berkshire have upon travel to work patterns in Berkshire, by accommodating the largest resident and workplace workforce and having the highest levels of labour self-containment in the sub-region.
3.47 Slough also has a strong influence on labour market movements and represents one of just two net importers of labour in Berkshire (alongside Reading) although these commuting relationships are just as strong with neighbouring Buckinghamshire and London as they are with Berkshire.
3.48 Census data also points to a growing east-west labour market divide in Berkshire (between the 2001 and 2011 Census), driven by the increasing influence and draw of Heathrow in commuting terms and declining influence of Reading upon travel to work flows with more eastern parts of Berkshire. By contrast, TTWAs in the west of the LEP area have remained largely unchanged and relatively self-contained over the last 10 years, although a notable exception includes the growth of the Basingstoke TTWA which has extended further into West Berkshire.
3.49 The local travel to work areas presented above appear to substantiate the ONS 2011 TTWA analysis which identifies three broad TTWAs crossing the Berkshire area as follows:
1 A Reading TTWA comprising the whole of Reading and Wokingham Boroughs as well as the majority of Bracknell Forest and parts of South Oxfordshire, West Berkshire, Windsor & Maidenhead and Hart.
2 A Slough and Heathrow TTWA including all of Slough Borough and parts of Windsor & Maidenhead. The majority of this TTWA falls to the east of the TVBLEP area, comprising a number of authorities including Runnymede, Spelthorne, South Bucks and the London Boroughs of Hillingdon and Kingston upon Thames.
3 A Newbury TTWA comprising the majority of West Berkshire District as well as parts of Wiltshire, Basingstoke and Deane and Test Valley.
3.50 In most cases, these TTWAs align reasonably well with Berkshire local authority boundaries, although Windsor & Maidenhead stands out as featuring within two separate TTWAs; the western parts of the Borough within the Reading TTWA and eastern parts of the Borough within the Slough and Heathrow TTWA (Figure 3.11)12. This reflects the unique geography of the
12 It should be noted that a small area within the Northern part of Windsor & Maidenhead falls within a High Wycombe and Aylesbury TTWA (as shown in Figure 3.11) although the strength of this overlapping TTWA is relatively less significant than for the Reading and Slough and Heathrow TTWAs
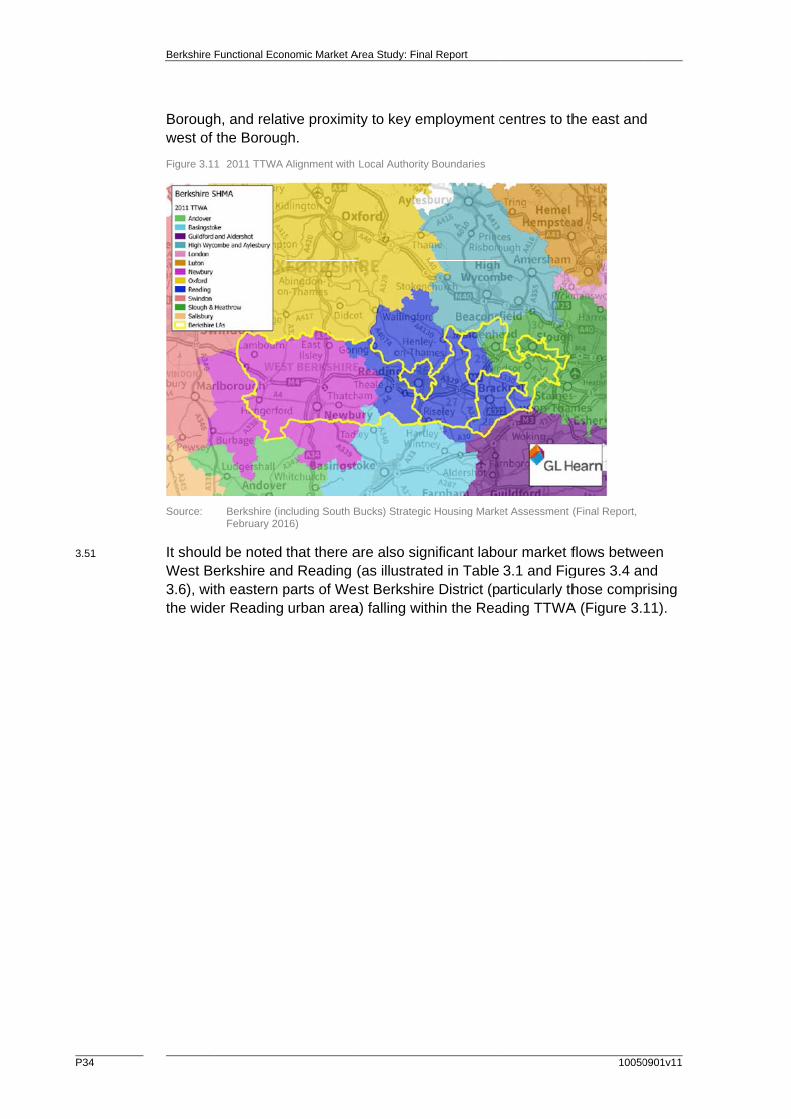
P34
3.51
Berkshire
Boroughwest of
Figure 3.1
Source:
It shouldWest Be3.6), witthe wide
Functional Econ
h, and relatthe Boroug
1 2011 TTWA A
Berkshire (inFebruary 201
d be noted erkshire anth eastern per Reading
nomic Market A
ive proximitgh.
Alignment with
cluding South B16)
that there ad Reading (parts of Wesurban area
Area Study: Fina
ty to key em
Local Authority
Bucks) Strategic
are also sign(as illustratest Berkshire
a) falling wit
al Report
mployment c
Boundaries
c Housing Marke
nificant laboed in Table e District (phin the Rea
centres to th
et Assessment
our market f3.1 and Figarticularly th
ading TTWA
10050
he east and
(Final Report,
flows betwegures 3.4 anhose comp
A (Figure 3.
0901v11
d
een nd rising 11).
Berkshire Functional Economic Market Area Study: Final Report
10050901v11 P35
4.0 Housing Market Areas
4.1 Housing market areas are a useful input to the process of considering the spatial extent of Functional Economic Market Areas due to the influence they have upon travel-to-work and labour market flows. Close relationships typically occur between the boundaries of sub-regional housing markets and sub-regional labour markets (generally referred to as Travel to Work Areas as explored in the previous section). Across the South East around 65% of all households contain people who are in work, and unless these people are taking up a job in another location outside an acceptable journey time, they are likely to look for somewhere to live within the same travel to work area if they move house13.
4.2 This section considers the housing market areas that operate across the Thames Valley. A number of housing market studies are currently being prepared to take account of the latest data and demographic projections. The emerging findings from these studies are summarised below, focusing upon the key conclusions from a housing market perspective.
Berkshire
4.3 A Strategic Housing Market Assessment14 (SHMA) has recently been prepared on behalf of the six Berkshire authorities and the TVBLEP by GL Hearn, Justin Gardner Consulting and Wessex Economics. The study involves two stages; the identification of housing market area(s) currently operating across the sub-region and the identification of the objectively assessed housing needs across the housing market area(s).
4.4 Using a best fit to local authority boundaries approach, this study identified two separate HMAs operating across Berkshire; a Western Berkshire HMA covering Bracknell Forest, Wokingham, Reading and West Berkshire; and an Eastern Berkshire and South Bucks HMA comprising Slough, Windsor and Maidenhead and South Bucks. These are shown in in Figure 4.1 below. The key differences between these areas relate to the strength of migration and commuting flows with Greater London, and in respect of house prices – with notably higher house prices in the Eastern Berks and South Bucks HMA.
13 Berkshire Housing Market Assessment, Final Report February 2007, DTZ Consulting & Research 14 Berkshire (including South Bucks) Strategic Housing Market Assessment, Final Report, February 2016
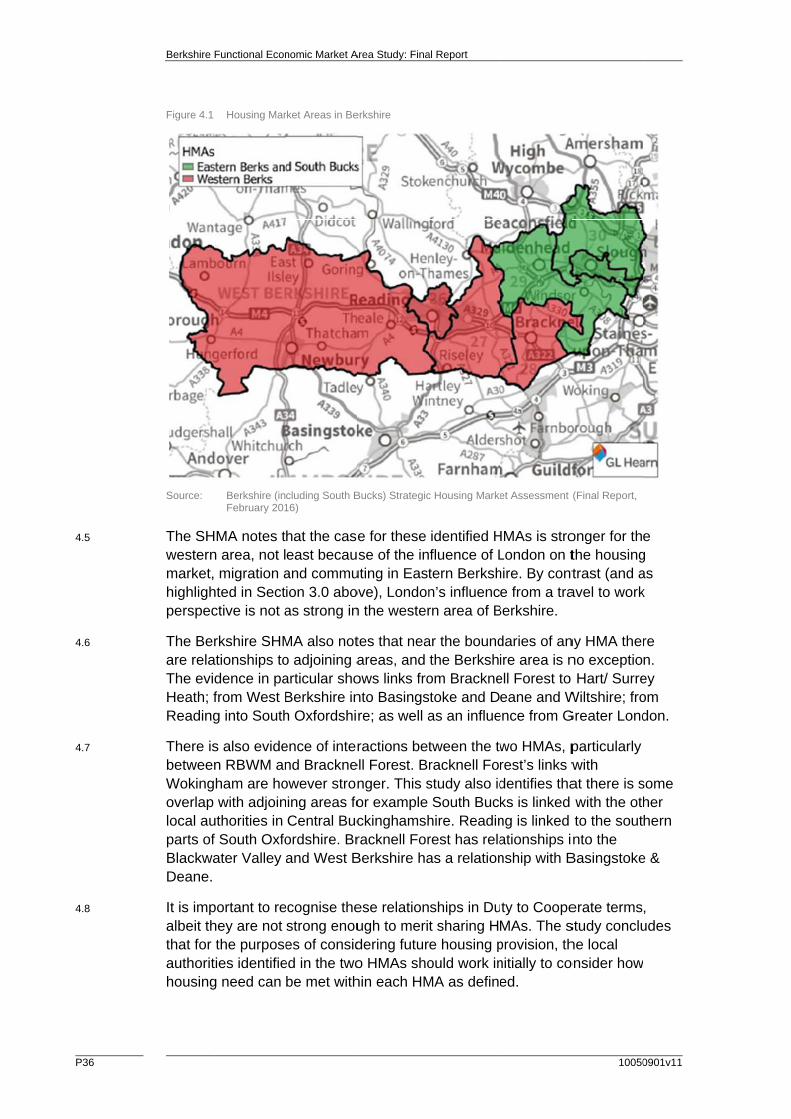
P36
4.5
4.6
4.7
4.8
Berkshire
Figure 4.1
Source:
The SHwesternmarket,highlighperspec
The Berare relaThe evidHeath; fReading
There isbetweenWokingoverlap local auparts ofBlackwaDeane.
It is impalbeit ththat for authorithousing
Functional Econ
Housing Mar
Berkshire (inFebruary 201
MA notes tn area, not l migration a
hted in Sectctive is not a
rkshire SHMationships todence in pafrom West Bg into South
s also eviden RBWM anham are howith adjoin
uthorities in f South Oxfoater Valley
portant to rehey are not the purpose
ties identifieg need can
nomic Market A
rket Areas in Be
cluding South B16)
hat the caseeast becauand commuion 3.0 aboas strong in
MA also noto adjoining aarticular shoBerkshire inh Oxfordshi
ence of internd Brackneowever stroning areas foCentral Bucordshire. Brand West B
ecognise thestrong enoues of consid
ed in the twobe met with
Area Study: Fina
erkshire
Bucks) Strategic
e for these se of the in
uting in Eastove), Londonn the wester
tes that neaareas, and ows links fronto Basingsre; as well a
ractions betell Forest. Brnger. This sor example ckinghamshracknell ForBerkshire ha
ese relationugh to meridering futuro HMAs shohin each HM
al Report
c Housing Marke
identified Hfluence of Ltern Berkshn’s influencrn area of B
ar the boundthe Berksh
om Bracknetoke and Das an influe
tween the twracknell Forstudy also idSouth Buck
hire. Readinrest has relaas a relation
ships in Dut sharing He housing pould work in
MA as define
et Assessment
HMAs is stroLondon on thire. By conte from a tra
Berkshire.
daries of anire area is n
ell Forest to eane and W
ence from G
wo HMAs, prest’s links wdentifies thaks is linked ng is linked ationships inship with B
ty to CoopeMAs. The sprovision, thnitially to coed.
10050
(Final Report,
onger for thethe housingtrast (and a
avel to work
ny HMA therno exceptio Hart/ Surre
Wiltshire; froGreater Lond
particularly with at there is swith the othto the soutnto the
Basingstoke
erate termsstudy concluhe local onsider how
0901v11
e g as k
re n. ey om don.
some her hern
e &
, udes

10050
4.9
4.10
4.11
15 HouFinding
Be
901v11
B
OthBuEcfinmHwRca
ThO
Fig
So
ThFipathClivst
using Market Args, March 2015
erkshire Functio
Buckingh
pinion Resehe four Distrucks and Wconomic Manal report w
majority of Buousing Marell as the smisborough. an also be c
he proposeutput Area
gure 4.2 Func
ource: ORS
he study ideigure 4.2, aarts of Ayles
hat the Soutentral Buckving in a Retrongly to Lo
reas and Functio5, Opinion Rese
nal Economic M
hamshir
earch Servirict Councils
Wycombe) toarket Areas
was publisheuckinghamsrket Area, wmaller settleMilton Keyn
considered
d HMAs ac(MSOA) bo
ctional Housing
S and Atkins, Ma
entified a Cnd this comsbury Vale th Bucks pokinghamshireading & Sloondon and S
onal Economic arch Services a
Market Area Stu
re
ces (ORS) s in Buckingo identify Hos (FEMAs) fed in Marchshire (80%
which includements of Anes (to the to be strate
ross the suoundaries is
Market Areas b
arch 2015
entral Buckmprises all o
and South opulation is re functionaough functioSlough/Win
Market Areas inand Atkins
dy: Final Repor
and Atkins ghamshire (ousing Marfor the coun 2015. Thisof the popues Aylesbu
Amersham, north) and R
egic housing
b-region bas shown in F
based on MSOA
kinghamshirof WycombeBucks. Mordivided, wit
al housing monal area. Itndsor than o
n Buckinghamsh
rt
were jointly(Aylesbury Vket Areas (H
nty and surros concludedulation) fallsry town andBeaconsfieReading & Sg market are
ased on MidFigure 4.2 b
A boundaries, wi
re HMA whie and Chiltere specificalth approachmarket area t is identifieother parts o
hire and the sur
y commissioVale, ChilteHMAs) andounding are
d that a subss within a sind High Wyceld and PrinSlough (to teas.
ddle-level Sbelow.
ith Local Author
ich is shownern Districts lly, the stud
hing half liviand the rem
ed as relatinof Bucks.
rrounding areas
P37
oned by ern, South Functionaleas15. A stantial ngle ombe, as ces the south)
uper
rity Boundaries
n in pink in as well as
dy notes ng in the mainder g more
: Report of
7
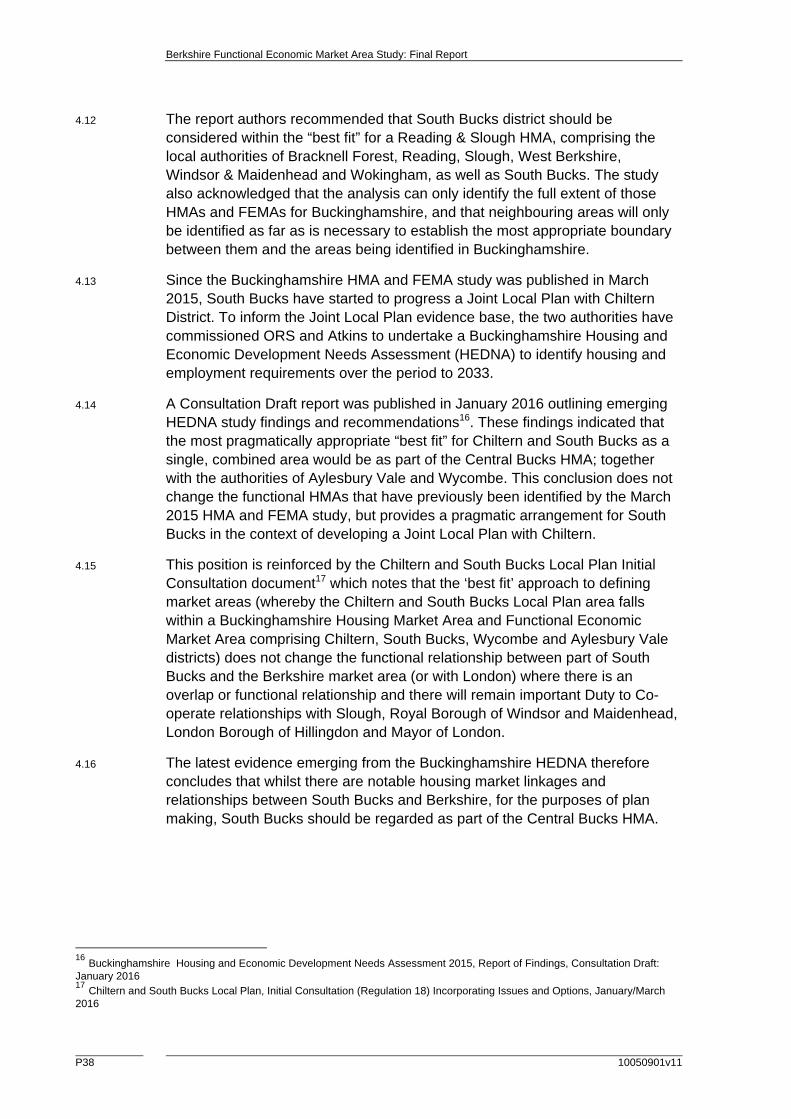
Berkshire Functional Economic Market Area Study: Final Report
P38 10050901v11
4.12 The report authors recommended that South Bucks district should be considered within the “best fit” for a Reading & Slough HMA, comprising the local authorities of Bracknell Forest, Reading, Slough, West Berkshire, Windsor & Maidenhead and Wokingham, as well as South Bucks. The study also acknowledged that the analysis can only identify the full extent of those HMAs and FEMAs for Buckinghamshire, and that neighbouring areas will only be identified as far as is necessary to establish the most appropriate boundary between them and the areas being identified in Buckinghamshire.
4.13 Since the Buckinghamshire HMA and FEMA study was published in March 2015, South Bucks have started to progress a Joint Local Plan with Chiltern District. To inform the Joint Local Plan evidence base, the two authorities have commissioned ORS and Atkins to undertake a Buckinghamshire Housing and Economic Development Needs Assessment (HEDNA) to identify housing and employment requirements over the period to 2033.
4.14 A Consultation Draft report was published in January 2016 outlining emerging HEDNA study findings and recommendations16. These findings indicated that the most pragmatically appropriate “best fit” for Chiltern and South Bucks as a single, combined area would be as part of the Central Bucks HMA; together with the authorities of Aylesbury Vale and Wycombe. This conclusion does not change the functional HMAs that have previously been identified by the March 2015 HMA and FEMA study, but provides a pragmatic arrangement for South Bucks in the context of developing a Joint Local Plan with Chiltern.
4.15 This position is reinforced by the Chiltern and South Bucks Local Plan Initial Consultation document17 which notes that the ‘best fit’ approach to defining market areas (whereby the Chiltern and South Bucks Local Plan area falls within a Buckinghamshire Housing Market Area and Functional Economic Market Area comprising Chiltern, South Bucks, Wycombe and Aylesbury Vale districts) does not change the functional relationship between part of South Bucks and the Berkshire market area (or with London) where there is an overlap or functional relationship and there will remain important Duty to Co-operate relationships with Slough, Royal Borough of Windsor and Maidenhead, London Borough of Hillingdon and Mayor of London.
4.16 The latest evidence emerging from the Buckinghamshire HEDNA therefore concludes that whilst there are notable housing market linkages and relationships between South Bucks and Berkshire, for the purposes of plan making, South Bucks should be regarded as part of the Central Bucks HMA.
16 Buckinghamshire Housing and Economic Development Needs Assessment 2015, Report of Findings, Consultation Draft: January 2016 17 Chiltern and South Bucks Local Plan, Initial Consultation (Regulation 18) Incorporating Issues and Options, January/March 2016
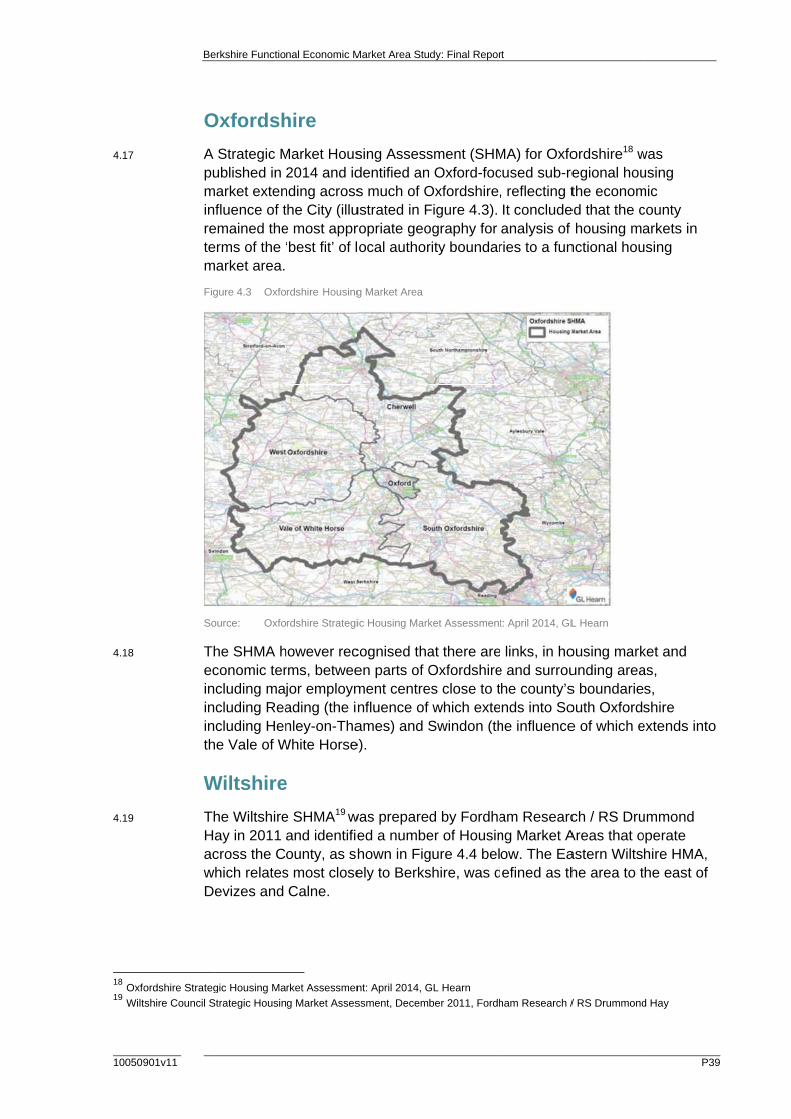
10050
4.17
4.18
4.19
18 Oxf19 Wilt
Be
901v11
O
A puminretem
Fig
So
Thecinininth
W
ThHacwD
fordshire Strateg
tshire Council S
erkshire Functio
Oxfordsh
Strategic Mublished in
market extenfluence of t
emained theerms of the ‘
market area.
gure 4.3 Oxfo
ource: Oxfo
he SHMA hconomic tercluding majcluding Reacluding Hen
he Vale of W
Wiltshire
he Wiltshireay in 2011 cross the Chich relatesevizes and
gic Housing Ma
Strategic Housin
nal Economic M
hire
Market Hous2014 and id
nding acrossthe City (illue most appr‘best fit’ of l
rdshire Housing
rdshire Strategi
however recrms, betweejor employmading (the innley-on-Tha
White Horse
e
e SHMA19 w
and identifieounty, as sh
s most closeCalne.
rket Assessmen
g Market Asses
Market Area Stu
sing Assessdentified ans much of O
ustrated in Fropriate geoocal author
g Market Area
ic Housing Mark
cognised thaen parts of Oment centrenfluence of ames) and S
e).
was prepareed a numbehown in Figely to Berks
nt: April 2014, G
ssment, Decem
dy: Final Repor
sment (SHM Oxford-foc
Oxfordshire,Figure 4.3). ography for rity boundar
ket Assessment
at there areOxfordshire
es close to twhich exte
Swindon (th
d by Fordhaer of Housingure 4.4 belshire, was d
GL Hearn ber 2011, Fordh
rt
MA) for Oxfocused sub-re, reflecting tIt concludeanalysis of ries to a fun
t: April 2014, GL
links, in hoe and surrouhe county’snds into So
he influence
am Researcng Market Aow. The Eaefined as th
ham Research /
ordshire18 wegional houthe econom
ed that the chousing ma
nctional hou
L Hearn
ousing markunding areas boundarieouth Oxforde of which e
ch / RS DruAreas that oastern Wiltshe area to t
/ RS Drummond
P39
was using
mic county arkets in
using
ket and as, s, shire
extends into
ummond operate hire HMA, the east of
d Hay
9
o
P40
4.20
4.21
4.22
4.23
20 Test Valley
Berkshire
Figure 4.4
Source:
The stutowns oand wasbetweenHMAs d
The Swcommisareas a
Hamp
Test Va
A Strate2013 (pValley cwhich cNew Fo
A lowerlocal HM
Strategic Hous
Functional Econ
Wiltshire Hou
Wiltshire Stra
dy identifiedof Reading as strongly inn the Wiltshdid not exte
windon and Wssioned a Snd growth r
pshire
alley
egic Housinpublished Jacan be conscovers the Borest.
r level analyMAs (Winch
ing Market Asse
nomic Market A
using Market Ar
ategic Housing M
d that this pand Newbunfluenced bhire HMAs and beyond
Wiltshire LoHMA and Frequirement
g Market Aanuary 2014sidered as pBorough alo
ysis based ohester/Eastl
essment, Janua
Area Study: Fina
reas
Market Assessm
part of the Cry and even
by Swindon.and the Berthe County
ocal EnterprFEMA studyts.
Assessment 420) and notpart of a Soong with Win
on ward datleigh and S
ary 2014, Justin
al Report
ment 2011
County ‘lookn further aw It does not
rkshire Authboundaries
rise Partnery to identify
for Test Vated that at authampton nchester, So
ta splits the alisbury) wi
Gardner Consu
ks’ towards way to Oxfort identify an
horities and s.
rship (LEP) up to date h
alley was una ‘strategic’ Housing Maouthampton
Borough bth the Bour
ulting
10050
the prosperrd and Lond
ny overlap the defined
have recenhousing ma
ndertaken inlevel, Test arket area n, Eastleigh
roadly into rne Valley w
0901v11
rous don;
d
ntly arket
n
h and
two ward
Berkshire Functional Economic Market Area Study: Final Report
10050901v11 P41
(to the north of the District) being placed in the Newbury HMA. The Winchester/Eastleigh HMA includes 13 wards to the south of the Borough along with most wards in Eastleigh and Winchester (and a small number in East Hampshire). The Salisbury HMA contains 10 wards in the Borough and extends to cover virtually all of the former local authority of Salisbury along with parts of East Dorset, New Forest and the former local authority area of Kennet.
4.24 This suggests there is very limited overlap in housing market area terms with Berkshire.
Basingstoke and Deane
4.25 The Basingstoke and Deane SHMA 2015 Update21reviewed the evidence base for the Housing Market Area provided in the March 2014 SHMA, including analysis of 2011 Census data for migration, travel to work statistics, and property price data as well as considering the SHMAs produced by neighbouring authorities since the publication of the 2014 SHMA.
4.26 It concludes that Basingstoke and Deane can be considered as a self-contained housing market area. Although there are relationships with neighbouring areas, particularly in relation to migration and travel to work patterns, with West Berkshire, Hart and Test Valley, taken with other contextual information and based on neighbouring authorities SHMAs, there is no new evidence to suggest that the Housing Market Area extends beyond the borough boundary.
Surrey
Blackwater Valley
4.27 A Strategic Housing Market Assessment22 was published in 2014 by Wessex Economics on behalf of the three authorities of Hart, Rushmoor and Surrey Heath to develop an up to date evidence base that will underpin the core strategies and development plan documents being developed by the three authorities.
4.28 The analysis provided strong justification for the three authorities to work together, and identified that the three authorities form a single Housing Market Area. It also highlights the continued need to work with other neighbouring authorities in adjacent strategic housing market areas given the close links and complexity across the wider sub-region.
4.29 In terms of migration, Rushmoor, Hart and Surrey Heath are closely linked to one another. Rushmoor’s most significant relationship is with Hart. Hart and Surrey Heath’s most significant relationships are with Rushmoor. Hart and Surrey Heath are also connected to one another through migration flows but
21 Basingstoke and Deane Strategic Housing Market Assessment, Basingstoke and Deane Borough Council, Updated May 2015 22 Hart, Rushmoor and Surrey Heath Strategic Housing Market Assessment, Wessex Economics Ltd, December 2014
Berkshire Functional Economic Market Area Study: Final Report
P42 10050901v11
these are less significant than those with Rushmoor, Basingstoke (for Hart) and Woking (for Surrey Heath).
4.30 The study also noted that household movements between the three authorities and nearby Bracknell Forest are also relatively significant, particularly with regards to Hart and Surrey Heath. This suggests that Bracknell Forest can be viewed as having some links with the Blackwater Valley sub-regional housing market, although these linkages are much less significant with other parts of Berkshire.
Runnymede and Spelthorne
4.31 Spelthorne and Runnymede Borough Councils have been working together to prepare a SHMA which sets out the extent of the housing market area in Spelthorne and Runnymede and the number and type of homes needed to meet housing demand in that combined area over the period 2013 to 2033.
4.32 The final SHMA report23 was published in November 2015 which identifies a strong relationship between these two authority areas and London, which is borne out in house prices, migration and commuting analysis. Looking more specifically at Surrey, the study identified a number of HMA groupings, including a North West Surrey HMA which comprises the local authority areas of Spelthorne and Runnymede.
West Surrey
4.33 It should be noted that a West Surrey SHMA is currently being undertaken on behalf of Guildford, Waverley and Woking Borough Councils. Although this study has yet to be finalised, emerging findings set out in the Draft Report24 define a core West Surrey HMA as comprising the local authorities of Guildford, Waverley and Woking. This reflects the strong migration and commuting links between the three authorities and similar housing market characteristics.
4.34 It also identifies a complex set of interactions between areas across Surrey and North Hampshire, including a particular set of links between the core HMA and Rushmoor, East Hampshire and Runnymede. On this basis, there is no strong evidence of any overlap or relationship between the West Surrey housing market area and Berkshire.
Greater London
4.35 The 2013 GLA SHMA25 focuses on the Greater London area, but recognises that ‘its urban area extends beyond this boundary and encompasses a substantial hinterland’ although there is no universally accepted way of measuring these cross boundary relationships.
23 Runnymede and Spelthorne Strategic Housing Market Assessment, Final Report November 2015, GL Hearn 24 Strategic Housing Market Assessment, Runnymede BC & Spelthorne BC, Final Report November 2015, GL Hearn 25 Mayor of London, The 2013 London Strategic Housing Market Assessment, January 2014
Berkshire Functional Economic Market Area Study: Final Report
10050901v11 P43
4.36 The examination of Further Alternations to the London Plan took place in September 2014. This included consideration of whether London can be described as a single Housing Market Area. The report from the Planning Inspector, Anthony Thickett, following the Examination in Public was published in December 2014. In Paragraph 22 the Inspector did not challenge the GLA’s contention that London represents a single Housing Market area, commenting that:
“The Mayor points to the acceptance by previous EiP Panels that London constitutes a single housing market area with sub markets which span Borough boundaries. The Mayor also points to the findings of the High Court, following a challenge to the Revised Early Minor Alterations to the London Plan, within which in his (undisputed) opinion, the Court accepted that although local variations exist, this did not compromise the view that London constitutes a single housing market area.”
4.37 On this basis the London SHMA evidence does not point to any significant overlapping housing market relationships extending into Berkshire.
Synthesis
4.38 Recent SHMA work undertaken on behalf of the six Berkshire authorities points to the existence of two HMAs operating across the LEP area; a Western Berkshire HMA covering Bracknell Forest, Wokingham, Reading and West Berkshire; and an Eastern Berkshire HMA comprising Slough, Windsor and Maidenhead and South Bucks. This uses a best fit to local authority boundaries approach.
4.39 The case for these identified HMAs is stronger for the western area, not least because of the influence of London on the housing market, migration and commuting in Eastern Berkshire. By contrast, London’s influence from a travel to work perspective is not as strong in the western area of Berkshire.
4.40 The Berkshire SHMA also notes that near the boundaries of these HMAs there are relationships to adjoining areas, and also some evidence of interactions between the two HMAs, particularly with regards to Bracknell Forest’s links with Windsor & Maidenhead and Wokingham (although these relationships are not strong enough to merit sharing HMAs).
4.41 Recent HMA analysis prepared on behalf of the four Buckinghamshire authorities identified that South Bucks falls across two separate HMAs; namely a Central Buckinghamshire HMA (comprising all of Wycombe and Chiltern Districts as well as parts of Aylesbury Vale and South Bucks) and a Reading & Slough HMA (comprising the local authorities of Bracknell Forest, Reading, Slough, West Berkshire, Windsor & Maidenhead and Wokingham, as well as South Bucks).
4.42 Since this analysis was published, South Bucks have started to progress a Joint Local Plan with Chiltern District and have commissioned new evidence to determine housing and employment requirements over the period to 2033. The
Berkshire Functional Economic Market Area Study: Final Report
P44 10050901v11
latest evidence emerging from this HEDNA study suggests that the Joint Local Plan Area for Chiltern and South Bucks would form part of a “best fit” with a Central Bucks HMA; together with the authorities of Aylesbury Vale and Wycombe.
4.43 Housing market studies prepared for other authorities surrounding Berkshire defines those authorities as falling within separate HMAs, with no evidence of overlapping housing market relationships extending into Berkshire. On this basis, it is possible to identify two HMAs operating across the LEP area; an Eastern Berkshire HMA and a Western Berkshire HMA.
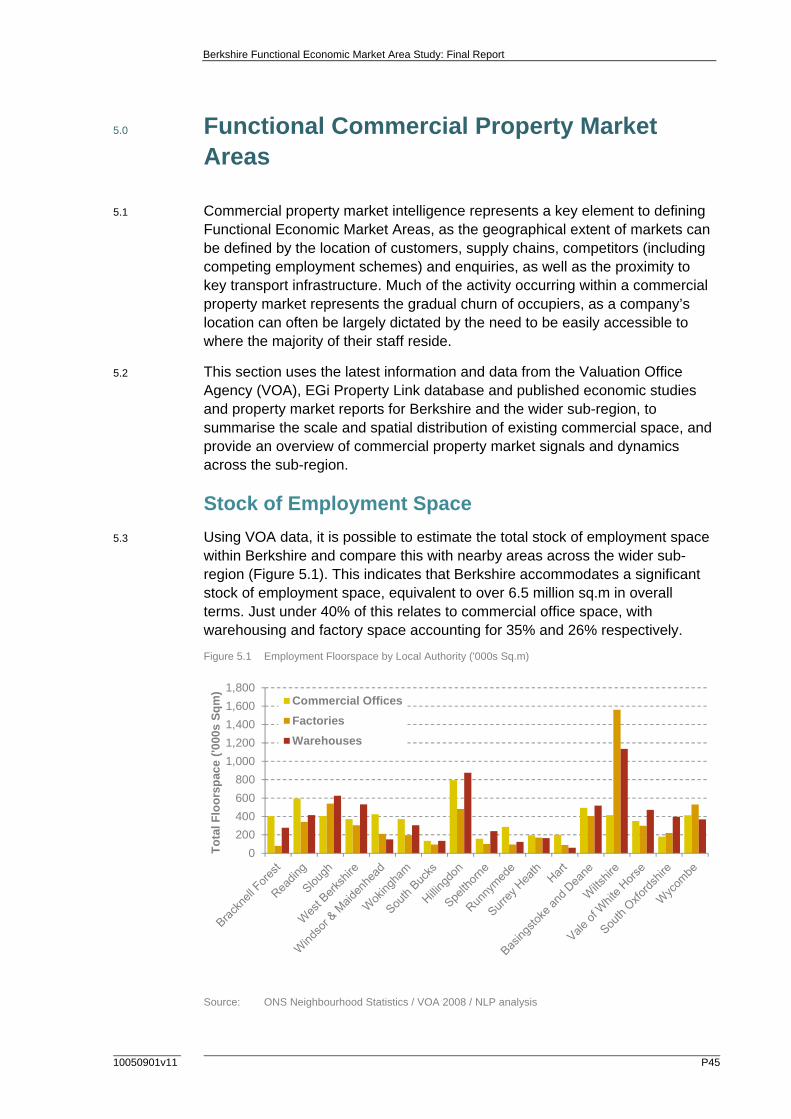
Berkshire Functional Economic Market Area Study: Final Report
10050901v11 P45
5.0 Functional Commercial Property Market Areas
5.1 Commercial property market intelligence represents a key element to defining Functional Economic Market Areas, as the geographical extent of markets can be defined by the location of customers, supply chains, competitors (including competing employment schemes) and enquiries, as well as the proximity to key transport infrastructure. Much of the activity occurring within a commercial property market represents the gradual churn of occupiers, as a company’s location can often be largely dictated by the need to be easily accessible to where the majority of their staff reside.
5.2 This section uses the latest information and data from the Valuation Office Agency (VOA), EGi Property Link database and published economic studies and property market reports for Berkshire and the wider sub-region, to summarise the scale and spatial distribution of existing commercial space, and provide an overview of commercial property market signals and dynamics across the sub-region.
Stock of Employment Space
5.3 Using VOA data, it is possible to estimate the total stock of employment space within Berkshire and compare this with nearby areas across the wider sub-region (Figure 5.1). This indicates that Berkshire accommodates a significant stock of employment space, equivalent to over 6.5 million sq.m in overall terms. Just under 40% of this relates to commercial office space, with warehousing and factory space accounting for 35% and 26% respectively.
Figure 5.1 Employment Floorspace by Local Authority ('000s Sq.m)
Source: ONS Neighbourhood Statistics / VOA 2008 / NLP analysis
0
200
400
600
800
1,000
1,200
1,400
1,600
1,800
To
tal F
loo
rsp
ace
('00
0s S
qm
)
Commercial Offices
Factories
Warehouses
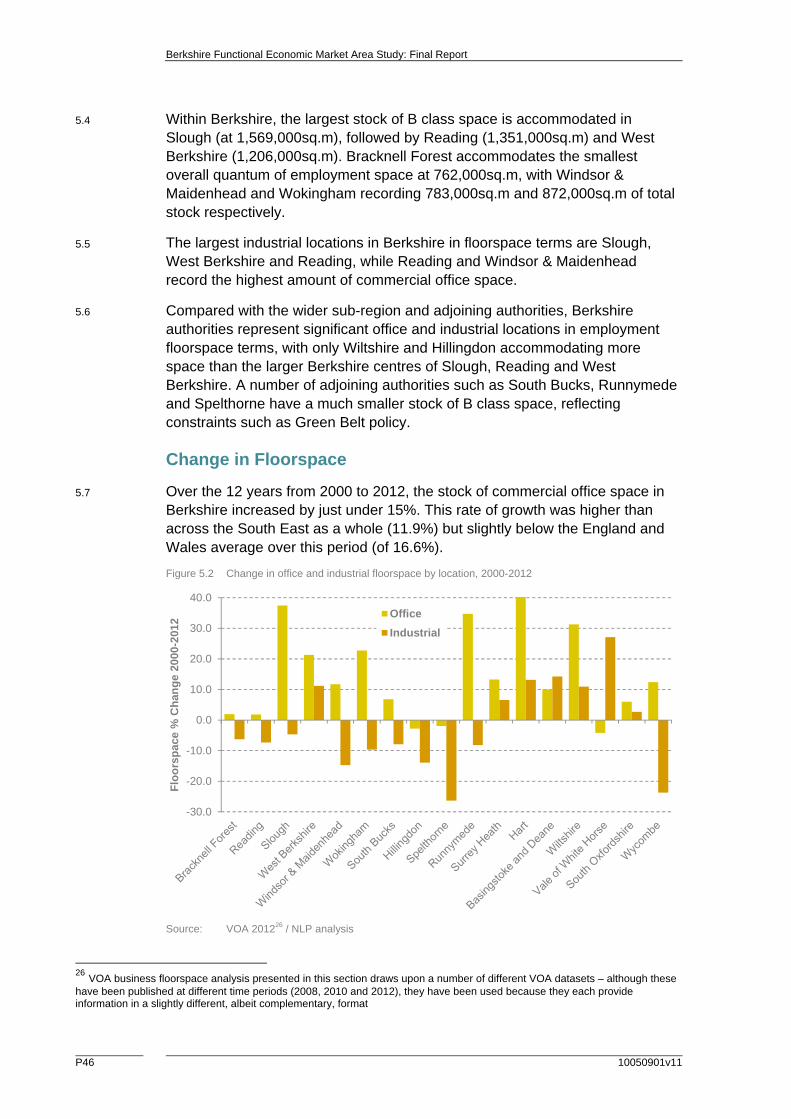
Berkshire Functional Economic Market Area Study: Final Report
P46 10050901v11
5.4 Within Berkshire, the largest stock of B class space is accommodated in Slough (at 1,569,000sq.m), followed by Reading (1,351,000sq.m) and West Berkshire (1,206,000sq.m). Bracknell Forest accommodates the smallest overall quantum of employment space at 762,000sq.m, with Windsor & Maidenhead and Wokingham recording 783,000sq.m and 872,000sq.m of total stock respectively.
5.5 The largest industrial locations in Berkshire in floorspace terms are Slough, West Berkshire and Reading, while Reading and Windsor & Maidenhead record the highest amount of commercial office space.
5.6 Compared with the wider sub-region and adjoining authorities, Berkshire authorities represent significant office and industrial locations in employment floorspace terms, with only Wiltshire and Hillingdon accommodating more space than the larger Berkshire centres of Slough, Reading and West Berkshire. A number of adjoining authorities such as South Bucks, Runnymede and Spelthorne have a much smaller stock of B class space, reflecting constraints such as Green Belt policy.
Change in Floorspace
5.7 Over the 12 years from 2000 to 2012, the stock of commercial office space in Berkshire increased by just under 15%. This rate of growth was higher than across the South East as a whole (11.9%) but slightly below the England and Wales average over this period (of 16.6%).
Figure 5.2 Change in office and industrial floorspace by location, 2000-2012
Source: VOA 201226 / NLP analysis
26 VOA business floorspace analysis presented in this section draws upon a number of different VOA datasets – although these have been published at different time periods (2008, 2010 and 2012), they have been used because they each provide information in a slightly different, albeit complementary, format
-30.0
-20.0
-10.0
0.0
10.0
20.0
30.0
40.0
Flo
ors
pac
e %
Ch
ang
e 20
00-2
012
Office
Industrial
Berkshire Functional Economic Market Area Study: Final Report
10050901v11 P47
5.8 This trend varies considerably within Berkshire however, with the majority of office space growth driven by Slough, Wokingham and West Berkshire (Figure 5.2). This pace of growth was comparable to other locations within the wider sub-region such as Runnymede, Hart and Wiltshire (albeit from a lower base point). Minimal levels of office space growth were recorded in Bracknell Forest and Reading over the 12 years to 2012.
5.9 By contrast, industrial space in Berkshire as a whole declined by nearly 4% between 2000 and 2012. This compares with an increase in industrial floorspace equivalent to 1.8% across the South East, and a small decline across England and Wales of 2.8%.
5.10 This Berkshire trend was mirrored across all authorities apart from West Berkshire, which recorded an increase in industrial floorspace of 11.2%. The most significant proportionate decline in industrial space was seen in Windsor & Maidenhead (Figure 5.2).
Spatial Distribution
5.11 Figure 5.3 shows the spatial distribution of B class employment space across Berkshire using latest available VOA data. A larger copy of the map is included at Appendix 5. This indicates that the majority of employment space tends to be concentrated in the key commercial centres of Reading, Slough, Bracknell, Maidenhead and Newbury. It also underlines the significant role that the M4 plays in driving Berkshire’s commercial property market, with the majority of employment space clustered along this strategic corridor or located close by.
5.12 Each of the main commercial centres accommodate a critical mass of office space, with smaller locations such as Wokingham and Windsor playing a much less significant role in office market terms. Across Berkshire, business units tend to comprise smaller suites of generally office space, and these are scattered across both urban and rural areas.
5.13 Slough, Reading (including parts of Wokingham which lie close to Reading’s urban fringe) and Thatcham stand out as accommodating a significant proportion of Berkshire’s warehousing space, with the A4 playing a key role in supporting West Berkshire’s distribution market.
5.14 Factory and workshop space (which includes R&D and laboratory space) tends to be distributed more evenly across the sub-region, with large clusters found in the key centres of Slough, Reading, Maidenhead and Newbury as well as smaller premises scattered across smaller settlements and more rural parts of Berkshire.
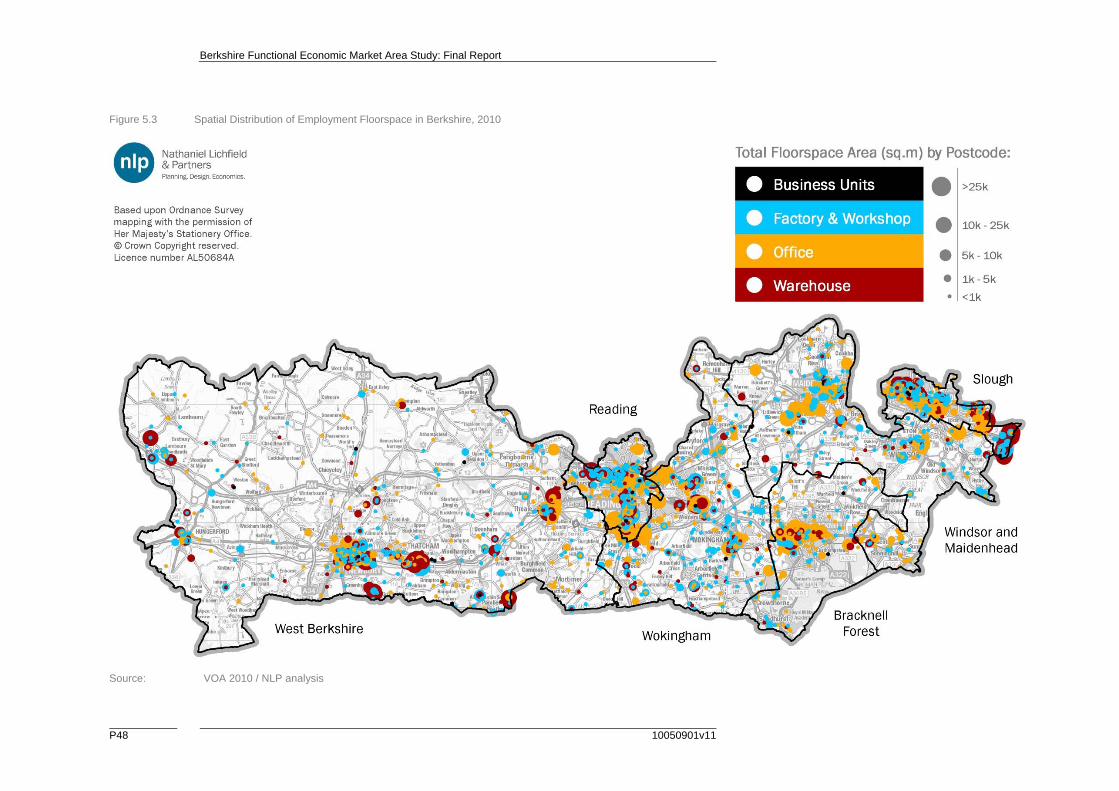
Berkshire Functional Economic Market Area Study: Final Report
P48 10050901v11
Figure 5.3 Spatial Distribution of Employment Floorspace in Berkshire, 2010
Source: VOA 2010 / NLP analysis

Berkshire Functional Economic Market Area Study: Final Report
10050901v11 P49
Market Geography
Sub-regional Markets
5.15 At a sub-regional level, the major commercial property markets are spread geographically along the M3 and M4 corridors with strong functional linkages to Heathrow airport and the outer west London boroughs. These market corridors are sometimes collectively referred to as the Western Corridor and comprise a number of significant commercial centres including Reading, Slough and Basingstoke.
5.16 Given that the majority of potential occupiers or investors search for property by radial routes out of London, there tends to be limited competition between the M3 and M4 corridors. Recent research27 noted that whilst the M4 market continues to lead the way in terms of occupier activity, rental growth and spec development, the M3 is starting to see the same trends of tightening supply, improving take-up and growing rents. Within the M3 market, the technology sector is reported to have become the dominant business sector for take-up in 2015, followed closely by manufacturing and engineering occupiers. In particular, the town of Bracknell is reported to benefit most from the strength of the M3 and M4 markets, being equally located between the two property corridors.
5.17 The Western corridor is a high value area for offices, attracting some of the highest rents within the South East. Research undertaken by CBRE28 notes that the rental values seen in the dominant centres of the Western Corridor (such as Maidenhead, Reading, Slough and Bracknell) suggest that these locations are equally attractive to occupiers and have no need to operate at a discount, unlike the smaller markets of Camberley, Farnborough, High Wycombe and Basingstoke. This reflects the general trend of M4 corridor towns commanding higher office rental values than the towns along the M3, mirroring the greater attractiveness of this section of the market to a wider range of occupiers.
5.18 The area also contains a significant concentration of industrial centres and markets, predominantly influenced by the good transport links offered by the M3/M4 and proximity to Central London. Key Western Corridor industrial locations include Reading, Basingstoke, Slough, High Wycombe and Newbury.
5.19 The CBRE research identifies a number of sub market areas operating within the wider Western Corridor, as summarised below.
i Core Thames Valley: The Core Thames Valley area focuses on the key M4 markets of Reading, Maidenhead, Bracknell and Wokingham, and reflects the close correspondence between these towns in terms of value, accessibility and labour force, and the area’s status as the centre of the technology-driven business park market west of London. Over the coming
27 Reported in Property Week, 6th November 2015 28 CBRE, South East Regional Property Market Study, March 2007
Berkshire Functional Economic Market Area Study: Final Report
P50 10050901v11
years, Reading and Maidenhead are expected to remain the main foci for office demand, with Reading the main industrial centre.
ii Thames Valley West: The Thames Valley West area combines the Newbury and Swindon markets, which constitute the key nodes at the western end of the M4 corridor. The distinction of this area from the western corridor sub-region reflects the lower value profile in both office and industrial markets than the M4 markets closer to London, the quasi-industrial character of much of demand, and the linkages that exist with areas beyond the western boundary of the South East region towards the Bristol area.
iii Heathrow-Slough-High Wycombe: this sub area effectively represents the eastern end of the Thames Valley market and, in overlapping significantly with the London area, acknowledges the pervasive influence of Heathrow Airport. While there are clear linkages with the Core Thames Valley and little difference in terms of typical values, the industrial and quasi-industrial character of demand in the two main markets of Slough and High Wycombe provides a measure of differentiation. The inclusion of Staines (part of the London Fringe in the original sub-region designation) also reflects the influence of the airport on this market and the commonality in value terms with the other markets in the area.
Berkshire
Bracknell Forest
5.20 The town of Bracknell represents the Borough’s main employment centre and is situated between the M4 and M3 motorways via a strategic transport corridor along the A322/A329(M) which has seen significant and emerging transport junctions improvements. In commercial property market terms, it is commonly considered a Thames Valley location due to its excellent access to the M4 and the regional hub at Reading via the A329(M). The majority of Bracknell Forest’s major employment areas have been built with almost direct access to this strategic transport corridor.
5.21 The Borough’s 2009 Employment Land Review29 noted that a key impact of the Borough’s geography, in property market terms, was that it closely interrelated with neighbouring districts. Ease of access to the M4, M3 and M25 all contribute to the Borough’s interaction with the surrounding sub-region. Other significant centres nearby included Maidenhead, a strong office market, and Slough, with a substantial stock of industrial property. Woking and Guildford also represented significant centres in the same sub-region while Farnborough and the Blackwater Valley settlements were also nearby.
5.22 The Borough’s (and Bracknell Town in particular) strong strategic road connectivity and close access to the motorway network has provided a key factor in attracting major employers over recent decades, as well as the
29 This evidence base document is now relatively out-of-date but remains the most recent assessment of employment land requirements in the Borough

Berkshire Functional Economic Market Area Study: Final Report
10050901v11 P51
availability of land for development. Bracknell however was not regarded as a particularly competitive distribution centre; the M4 corridor provides cheaper locations for distribution activity such as Swindon.
5.23 The Borough’s ELR identified that in office market terms, Bracknell Forest was in close competition with other centres in the Thames Valley –most notably Reading - which shared or exceeded many of its advantages. In particular, Reading was deemed to offer large office sites in high-quality business parks such as Green Park (straddling the Wokingham Borough boundary) and Winnersh Triangle (Wokingham Borough).
5.24 Analysis of office transactions undertaken in 201130 showed that the business services sector (which included information, communications and technology) represented the most dominant occupier in the Borough. However, the sector has recently undergone a period of consolidation and is particularly sensitive to changing working practices such as a drive to reduce floorspace requirements.
Reading
5.25 The Reading market area is the main office location in Berkshire. The nature of the stock on offer in Reading is also different given that it is predominantly head quarter style accommodation. The town’s business parks notably Thames Valley Park (which is located within Wokingham Borough) and Green Park (which straddles the Reading/Wokingham Borough boundary) effectively operate within the larger regional Thames Valley / M4 markets, and have historically captured the larger requirements31. They provide modern high specification office buildings catering for larger occupier needs. The town centre stock provides more choice in terms of size, accommodation style and specification and has catered for a more diverse occupier base.
5.26 Demand for offices in Reading and the Thames Valley has historically been driven by the telecommunications, media and technology (TMT) business sector, including from businesses with parent companies based in the USA. Notwithstanding the challenges from other regions, countries and continents, businesses are still attracted to this location due to the skilled labour force, proximity to Heathrow and London plus the living and working environment.
5.27 The Reading industrial market can be defined as including the main Reading area and also extending to Winnersh Triangle J10 of M4 (within Wokingham Borough), and Theale J12 of M4 (within West Berkshire District). Reading’s neighbouring authorities of West Berkshire and Wokingham accommodate large parts of what is generally considered to be the Reading office market; for example Arlington Business Park at Theale (West Berkshire District) and Green Park, Thames Valley Office Park and Winnersh Triangle (Wokingham Borough). The arrival of Crossrail to Reading is anticipated to extend Reading’s competitive rail advantage over nearby locations such as Bracknell.
30 Hicks Baker, Market Perspective of Bracknell Forest Borough Office Floorspace 2011 31 Reading Employment Land Review, October 2006, Roger Tym & Partners
Berkshire Functional Economic Market Area Study: Final Report
P52 10050901v11
Slough
5.28 Slough represents a significant commercial centre within the Western Corridor, and accommodates the largest stock of industrial space in the Thames Valley. A recent study undertaken on behalf of Slough Borough Council32 identifies the Slough Trading Estate in particular as being a key asset for the Thames Valley Berkshire as a whole, as well as Slough. The Borough has a significant strength in the logistics sector, in part due to its strategic location between the M4, M25 and Heathrow Airport. It is home to the headquarters of a number of large, multinational companies across a broad array of sectors.
5.29 Market feedback points to a shortage of Grade A office space in Slough, and it is anticipated that demand for this type of space will increase with new transport improvements such as Crossrail. The current supply of office space in Slough is noted by the 2015 Business Focus Study as consisting of a relatively high amount of Grade B and C stock; by comparison, Reading has a large amount of prime, Grade A stock.
5.30 The amount of office stock in Slough may be affected as a result of the recent changes in Permitted Development (PD) that allow conversion of office space to residential uses without the need for planning permission. Council monitoring data shows that this PD activity to date has been focused upon Slough Town Centre, and specifically older office stock. As at November 2015, Slough Borough Council estimates that 54,000sq.m of office space (equivalent to just over 10% of the Borough’s total office stock) has the potential to be lost to residential use in the next few years under this national policy.
5.31 Construction of new A grade office space in the Town Centre is expected to start in the next 12 months. The loss of small/low grade/ town centre units may however have implications for the Borough’s start-ups and small businesses that require more affordable provision.
West Berkshire
5.32 West Berkshire has a variety of employment sites ranging from large business parks and industrial estates to small rural sites converted from agricultural uses. There are particularly high concentrations of office floorspace in Newbury and Theale, and to a lesser extent Hungerford, Thatcham and New Greenham Park. Light industrial activity (B1c) is slightly more dispersed with lower concentrations in town centres and greater concentrations south of the A4, at Theale and west of Hungerford and Lambourn. The dispersal of B8 warehousing and B2 industrial space is also concentrated along the A4, at Theale and west of Lambourn and Hungerford, in proximity to Junction 14 of the M4.
5.33 The District accommodates a number of strategically important employment sites and occupiers including at New Greenham Park, Vodafone HQ, and the
32 Slough Business Focus Study & Strategic Response, Regeneris, May 2015
Berkshire Functional Economic Market Area Study: Final Report
10050901v11 P53
Atomic Weapons Establishment (AWE) which has two bases in the area at Aldermaston and Burghfield.
5.34 The District’s 2007 Employment Land Assessment notes that Reading is a particularly significant location in the context of West Berkshire given the transport links between the two areas and the fact that Reading is a major business location. West Berkshire is well connected in transport terms and the District’s Core Strategy (Adopted July 2012) notes that the east-west M4 motorway intersection at Chieveley with the north-south A34 at the centre of the District is an important road interchange. The District benefits from good strategic road connections to larger centres such as Reading, Oxford, Swindon, Basingstoke and London, while mainline railway services to London and the south west of England run through the south of the District.
5.35 The Core Strategy also identifies the important role that traditional industries such as agriculture and the racehorse industry will have to play in driving the economy in future, and that the majority of the District (particularly away from the Reading urban area) is characterised by a mixed economy that is far more rural in nature than the rest of Berkshire. This rural characteristic also presents a number of challenges including transport accessibility issues in more rural parts of the District.
Windsor & Maidenhead
5.36 The Borough’s main attractions for businesses are its generally pleasant towns and quality of life factors, its good transport accessibility, both to the M4 and rail links to London, reasonable proximity to Heathrow Airport and a pool of highly skilled workers. Existing concentrations of firms in the IT, telecommunications and pharmaceutical sectors attract other companies in those sectors whilst reasonable access to the universities at Oxford and Reading is also seen as an important factor.
5.37 The Borough’s two main towns comprise distinct areas for the commercial property market. Windsor is a niche location, attractive to certain higher value firms seeking a prestige, heritage location and does not compete with other nearby areas. In contrast, Maidenhead is part of the wider M4 / Thames Valley property market to a greater extent, with a degree of competition with Bracknell, Slough and Reading, but with most demand coming from a more local area within 5-10 miles. In general, both towns are perceived to be office locations with the industrial market being much smaller.
5.38 In general, the Borough is not perceived as an industrial location due to its lack of supply, development constraints, nearby competitors such as Slough Trading Estate and high labour costs. Accordingly, the market is localised with demand mainly for smaller industrial units.
5.39 The Borough’s 2009 Employment Land Review Update noted that there were a number of major developments planned or underway in surrounding districts, some of which may represent competition to RBWM’s economic growth prospects. These included the Heart of Slough office scheme, Amen Corner in
Berkshire Functional Economic Market Area Study: Final Report
P54 10050901v11
Bracknell and Green Park in Reading/Wokingham; local agents at the time believed that Windsor does not compete with these centres because most potential occupiers specifically want to locate in the town due to its cachet as a business and residential location.
5.40 Maidenhead competes to a greater extent in terms of office firms, although the town’s well-established IT, telecommunication and pharmaceutical clusters mean that many potential occupiers specifically want to locate in the town. In addition, the Borough has other advantages over these competing locations such as Reading’s greater distance from Heathrow and the perception of Slough as an unattractive centre.
Wokingham
5.41 Wokingham represents a smaller office location than either Reading or Bracknell and the nature of the Borough’s stock differs somewhat from the predominantly Head Quarter style accommodation offered in these two locations. The Borough’s business parks notably Thames Valley Park, Green Park and Winnersh Triangle effectively operate within the larger regional (and specifically Reading) Thames Valley / M4 markets, and capture the larger requirements and command higher rents33. The older and smaller stock offered by Wokingham Town Centre, the more secondary Mulberry Business Park and outlying parishes have been able to offer occupiers more choice in terms of smaller sized accommodation at a more competitive rental level.
5.42 The industrial market in Wokingham is relatively dispersed across the Borough except for the main locations being Suttons Business Park, Winnersh Triangle, Mulberry Business Park, Headley Road East and Toutley Industrial Estate. Compared with neighbouring districts, particularly Bracknell, Wokingham has a larger industrial stock due to it being a marginally less favoured office location.
5.43 A recent report by KPMG34 identifies Wokingham as the number one tech employment cluster in Great Britain, where the proportion of tech jobs is more than five times the UK average. The report notes that major multinational tech companies, as well as smaller ‘high tech’ firms, are based throughout the purpose-built business parks located within Wokingham including Thames Valley Business Park and Suttons Business Park.
Relationship with other Property Market Areas
5.44 Given their relative proximity to the TVBLEP area, specific consideration has been given to the commercial property market areas associated with parts of Oxfordshire, Buckinghamshire, Surrey, Hampshire and Wiltshire that border Berkshire, drawing on recent evidence and intelligence presented in each respective authorities’ employment land review and economic studies.
33 Wokingham Employment Land Study, October 2005, Roger Tym & Partners and Lambert Smith Hampton 34 KPMG Tech Monitor UK, October 2013
Berkshire Functional Economic Market Area Study: Final Report
10050901v11 P55
Surrey Heath, Hart and Rushmoor
5.45 A Joint Employment Land Review has recently been undertaken between the Districts of Hart, Surrey Heath and Rushmoor35. This identifies that the commercial property market is centred around the five main settlements of Aldershot, Camberley, Farnborough, Fleet and Frimley, a significant part of an area collectively known as the Blackwater Valley. This is generally perceived to be a relatively self-contained commercial property market due to the close proximity of these centres and good accessibility between them by road.
5.46 There are however, significant variations between the settlements as a result of differences in image, accessibility and relative levels and types of supply of commercial property. There is competition between the Blackwater Valley and other economic centres such as Basingstoke (M3 corridor), Bracknell, Newbury and Reading (M4 corridor) and Guildford and Woking (A3 corridor).
5.47 A significant quantity of large footprint office space has been developed across the Blackwater Valley over the past two decades, although it is widely acknowledged that occupier demand has never kept pace with this supply and the post 2007 economic downturn exacerbated this. This in part reflects that the M3 corridor has generally proved less successful in attracting a consistent level of major corporate relocations than the M4 corridor or the Thames Valley west of London.
5.48 The three authorities have each recently completed separate studies to explore the functional economic areas that each authority forms part of. The studies identify clear evidence that there is a sub-regional market for employment floorspace in the Blackwater Valley, distinct from the markets in Basingstoke, in Guildford-Woking, and in the M25 West Surrey quadrant.
Basingstoke and Deane
5.49 The Basingstoke and Deane Employment Land Review Update (May 2015) notes that various commercial market areas operate across the Enterprise M3 LEP area and Basingstoke is grouped with Andover to form one of the market areas, with the Blackwater Valley market area to the east, which includes Hart and Rushmoor, and the Central Hampshire market area to the south.
5.50 Market intelligence and market signals at the local/regional level show that generally office rent levels in Basingstoke remain low in relation to a number of more buoyant locations, with the office market in Reading stronger, and likely to see further increases in rental levels in the coming years. The lack of grade A space in Basingstoke is particularly pertinent, as this forms the main focus for market demand, with Reading having considerable amounts available, and additional space now coming on stream in the Blackwater Valley (in Farnborough).
35 Hart, Rushmoor and Surrey Heath Joint Employment Land Review, Final Report, June 2015

Berkshire Functional Economic Market Area Study: Final Report
P56 10050901v11
Test Valley
5.51 Test Valley is a location that is seeing demand grow for its office and warehousing locations, primarily due to the ease of access and developed transport network including proximity to the M3 and M27, as well as the modern and high quality buildings which are in high demand across the sub-region.
5.52 The Test Valley Employment Land Review Update (October 2012) notes that the appeal of sites in the M27 corridor is attributed to the enhanced accessibility of a location on the M27 compared to a location in the centre of Southampton; and the availability of more modern open plan accommodation with higher parking ratios, both of which are difficult to deliver in the City Centre. Thus, agents have remarked that the M27 area is more characteristic of the overspill Southampton market than of the rest of the Test Valley market.
5.53 As with the office market, there are marked differences between different parts of the Borough in terms of the market for industrial property and warehouses. Andover has a substantial stock of industrial properties, much of it now quite dated, and a reasonable supply of warehouse space, in part linked to its location on the A303.
5.54 Large format warehousing in the Borough has historically been located largely in the southern end of the Borough, to the south of the M27. This area of warehousing is functionally part of the Southampton market and indeed the estates effectively adjoin the City boundary.
Wiltshire
5.55 The Wiltshire Workspace and Employment Land Review (December 2011) notes that like other areas of the UK, the commercial property market in Wiltshire has suffered considerably during the economic downturn. Whilst the economy has returned to economic growth, the recovery is likely to be slow and gradual.
5.56 Industrial and warehouse demand is relatively low, with rental prices falling continually over the past three years. Vacancy rates are continuing to rise and this is primarily due to the lack of prime floorspace that is available. Much of the floorspace that does become available is not fit for purpose and modern business. The north and west Wiltshire are the main concentrations of industrial and warehousing floorspace, whilst the former Salisbury local authority area is a key office location.
5.57 There has historically been very little speculative office development in Wiltshire, reflecting the low levels of demand for such space. More recently there has been significant office development in and around towns located closest to the M4, including Chippenham and Wootton Bassett. A notable exception to this trend has been the development of White Horse Business Park on the edge of Trowbridge, a town with a strong reliance on manufacturing. However, two of the larger occupiers on this park, Vodafone

Berkshire Functional Economic Market Area Study: Final Report
10050901v11 P57
and Virgin, have recently announced their plans to close their operations in Wiltshire as part of their nationwide cost cutting measures.
Swindon
5.58 Swindon benefits from excellent transport access at the western end of the Thames Valley and has attracted significant inward investment because of this and available land. As noted in the Swindon Employment Land Review (2007), the Borough’s property market is characterised by relatively strong demand for industrial space and much weaker, but improving, office space demand.
5.59 The Borough is seen as having strong locational advantages to accommodate new investment and relocating firms from the South East region due to its lower costs, excellent transport accessibility and reasonable proximity to London and Heathrow Airport. Its diverse economy is a key strength to be maintained in future.
5.60 The Swindon ELR notes that the Borough’s main competitors for future investment will be centres such as Milton Keynes, Reading, Bristol, and Oxford to some extent, rather than adjoining districts. These areas will compete with the Borough in their own areas of strength, but aside from Oxford, primarily for footloose firms seeking premises in the south of England. In the more specialist science-based and medical related sectors, the Borough is competing with towns with more and/or longer established universities while Reading and Bristol are both seeking to grow in this field.
5.61 The Borough’s Employment Land Review is currently being updated, alongside a SHMA and FEMA study which will provide up-to-date evidence on Swindon’s role within the wider sub-regional commercial property market area.
Vale of White Horse
5.62 The Vale of White Horse has significant strengths in light industrial sectors and is home to Science Vale UK which straddles the border between the Vale of White Horse and South Oxfordshire. Whilst it accommodates a diverse range of services, these tend to be driven by B1, B2 and B8 land uses.
5.63 Beyond Science Vale UK, there is also an established market area that is defined in the Vale of White Horse Employment land Review (2013) as the ’A34 corridor’ which has proved to be an attractive location for high value sector businesses in technology. This has led to the East of the Vale being considered a key area within the sub regional market. Occupier demand has traditionally been focused upon office and light industrial premises, with two specific sites, Milton Park and Harwell, accommodating much of this supply.
5.64 The 2013 ELR noted that Oxford, South Oxfordshire and West Berkshire form part of the same Property Market Area, and businesses will generally consider all four of these areas when looking for a site or premises, each sharing similar market characteristics such as rental values, size and grade of office floorspace.
Berkshire Functional Economic Market Area Study: Final Report
P58 10050901v11
South Oxfordshire
5.65 The South Oxfordshire Employment Land Review (2007) notes the District’s prime office location is Henley, with smaller sites in Wallingford, Thame and Didcot. However, it is noted that due to the close proximity of the sites to Reading, these centres are unlikely to attract high profile occupiers. Demand for office space is generally localised, with businesses looking to expand rather than new business relocating to the area.
5.66 The District competes with Milton Park in the Vale of White Horse for science and research occupiers but does have a competitive advantage with regards to B8 warehousing space with Didcot being located along the M40 corridor. Sites have been identified in these locations which are expected to provide sufficient land to meet future demand. The ELR also identifies that neighbouring districts have a greater provision of larger employment sites than South Oxfordshire.
Wycombe
5.67 Wycombe lies on the margin of the Thames Valley, which for many years has been the leading office market in the South East, featuring an established high-technology cluster in a wide corridor along the M4, from Hammersmith to Newbury36.
5.68 In recent years, the District’s office market has struggled, with a number of office occupiers consolidating to more central locations in both London and the Thames Valley. The District is generally unable to compete with larger, more established office centres nearby such as Reading and Maidenhead which tend to offer high quality stock and excellent accessibility. Over the longer term however, demand may spill over from the core of the Thames Valley into more peripheral locations such as Wycombe.
5.69 Intelligence from the recent Central Buckinghamshire Housing and Economic Development Needs Assessment (October 2015) suggests that High Wycombe town centre is considered to be an undesirable location for office businesses due to the poor quality of the environment for business purposes.
5.70 Historically Wycombe’s economy was based on furniture making, and accordingly industrial space formed much of the employment stock. This stock was spread across the district, much of it on scattered sites rather than purpose-built industrial estates. In recent years, the wider region’s industrial development has focused on strategic distribution warehousing, yet Wycombe has not been part of this trend. This could place it at a disadvantage compared to Reading, Slough or Maidenhead when competing for occupiers in future. Wycombe is reported to have very little land available for B8 use class growth and is generally more constrained than Aylesbury Vale in accommodating new development.
5.71 Marlow sits on the fringes of the Thames Valley and has some town centre office accommodation and edge-of-town business parks. Globe Park is
36 Wycombe District Council, Economy Study & Employment Land Review, Draft Report January 2014
Berkshire Functional Economic Market Area Study: Final Report
10050901v11 P59
possibly the best strategic office location in Wycombe district, closest to the core of the Thames Valley, although at present is reported to be failing to fulfil its full potential.
South Bucks
5.72 The South Bucks property market is relatively small, with take-up of office space falling in recent years. The office market is focused towards demand from local, Small and Medium-sized Enterprises (SMEs) requiring small office units, as noted by the recent HMA and FEMA study (2015).
5.73 Take-up of industrial floorspace in the District is also relatively low and strongly biased towards medium-sized industrial properties, although there have been a small number of large deals, particularly in Iver.
5.74 Whilst the South Bucks market is relatively self-contained, providing space for small, local businesses, it does also form part of the wider M25 market area for office and industrial floorspace, including sites at Iver for larger industrial and distribution units. In some respects, the District’s sites also form part of the wider Thames Valley market area, which runs along the M4 corridor, although it does not have the critical mass to attract the type and scale of occupiers that other parts of the Thames Valley does, despite being very well located.
5.75 The 2015 FEMA study notes that South Bucks (as well as nearby Chiltern) has a very localised property market and is not significant enough to represent its own FEMA. At a strategic level, the northern part of South Bucks, including Beaconsfield and Gerrards Cross, form part of a wider M40 property market which includes High Wycombe, whilst southern and eastern parts of South Bucks are part of an M4/M25 property market area.
Spelthorne
5.76 The Spelthorne Economy and Employment Land Study (2006) indicates that Spelthorne’s location on the west side of London, close to Heathrow Airport and the M25 and M4 corridors, makes it an attractive location for business. Historically the area had a significant manufacturing base, which is still reflected in the presence of industrial estates and premises of various sizes throughout the Borough. Good communications, especially the proximity of Heathrow, has attracted warehousing, particularly to the Stanwell area adjacent to Heathrow, which forms part of the specialist market of airport related warehousing accommodating companies with close functional links to the airport.
5.77 Staines town centre is the main office hub in the area, and has by far the largest commercial area. The town benefits from excellent access to the road network with the M3, M25, A308 and A30 all within close proximity.
5.78 In common with other parts of the country the property market operates in an environment constrained by planning control and Green Belt designation,
Berkshire Functional Economic Market Area Study: Final Report
P60 10050901v11
which significantly reduces the supply of land available for employment development.
5.79 The more recent Spelthorne Local Economic Assessment 201337 notes that in the areas immediately adjoining the Borough there are significant amounts of business floorspace. This includes Heathrow Airport, Poyle Trading Estate and the Causeway, Staines which is on the south side of the River Thames in the Borough of Runnymede. Heathrow in particular makes a significant and positive economic impact on the wider area. It also underlines that generally Spelthorne and this wider area has historically been the focus of considerable growth pressures.
Runnymede
5.80 Runnymede forms part of the commercial property market focused on the M25 motorway and areas benefiting from the proximity of Heathrow Airport. However, several other nearby centres offer broadly similar characteristics and also have better rail links and more attractive town centre environments. In particular, Runnymede would tend to compete most with Staines, Woking, Maidenhead and Camberley/Farnborough38.
5.81 Runnymede’s main attractions for businesses are its generally attractive residential areas and quality of life factors, its accessibility to the M25, proximity to Heathrow and a pool of highly skilled workers. This has given it a relatively large office market which has seen significant growth in recent years.
5.82 The Borough has been successful in attracting a wide range of international, national and regional firms who often choose to locate their headquarter functions within Runnymede. Particular sectors have included IT and technology firms, although in the past few years pharmaceutical firms have come to the fore. The main drawbacks for the Borough relative to its competitors are its poor rail connections with London and town centres which are perceived as relatively unattractive.
5.83 Recent Functional Economic Area analysis undertaken by Runnymede Borough Council39 notes that recent research has identified different geographical boundaries for the property market areas operating across Runnymede. This includes two sub-regional commercial property market areas which split the Borough into two zones - a northern zone encompassing Egham and Thorpe (heavily influenced by Heathrow airport) and a southern zone encompassing Chertsey and Addlestone. An alternative definition identifies one commercial property market which encompasses the Boroughs of Elmbridge, Runnymede and Spelthorne.
37 Spelthorne Borough Council, Local Economic Assessment, September 2013 38 Runnymede Employment Land Review, NLP, February 2010 39 Runnymede Borough Council, Functional Economic Area Analysis, Final Report, June 2015

Berkshire Functional Economic Market Area Study: Final Report
10050901v11 P61
Synthesis
5.84 Within Berkshire, the largest concentration of B class space is accommodated in Slough, followed by Reading and West Berkshire. These three authorities also represent the largest industrial locations in floorspace terms, while Reading and Windsor & Maidenhead record the highest amount of commercial office space.
5.85 At a sub-regional level, commercial property markets areas are centred on the M3 and M4 strategic corridors, driven by strong functional economic linkages to Heathrow airport and the outer west London Boroughs. These market areas are collectively referred to as the Western Corridor and comprise a number of significant commercial centres including Reading, Slough and Basingstoke.
5.86 Within the Western Corridor, it is possible to identify specific sub market areas, each sharing a number of similar characteristics and trends and with a high degree of interaction occurring within these component submarkets. This includes a Core Thames Valley or ‘Upper M4’ area focused on the key M4 markets of Reading, Maidenhead, Bracknell and Wokingham, with strong economic relationships between these towns in terms of value, accessibility and labour force. This property market area also accommodates some of the largest and most significant employment sites in the sub-region including Green Park, Arlington Business Park, Winnersh Triangle and Bracknell’s Western and Southern employment areas.
5.87 At the eastern end of the Thames Valley lies the Slough and West London sub area, reflecting the significant influence of Heathrow Airport upon property market interactions. The quasi-industrial nature of demand distinguishes this sub market area from the Upper M4 area, with the commercial centres of Slough and High Wycombe key in this respect. This sub market area also takes in the South Bucks towns of Beaconsfield and Gerrards Cross.
5.88 The western part of the sub-region accommodates the Newbury and Swindon sub-markets, which constitute the key nodes at the western end of the M4 corridor. This property market area is characterised by a lower value profile in both office and industrial terms than the M4 markets closer to London, a quasi-industrial character in regards to much of the demand, and linkages that exist with areas beyond the western boundary of Berkshire. There is however some synergy in property market terms between Newbury and Reading, and Newbury and Oxfordshire, although these linkages are not as strong as those characterising the Upper M4 area which has a greater critical mass of firms and commercial property market activity.
5.89 Other localised property market areas operating across the Thames Valley area are shown in Figure 5.4 below, including the Blackwater Valley, Upper M3 and Basingstoke & Andover property market areas which together comprise the Surrey centres of Guildford, Woking, Farnborough and Staines-upon-Thames and the Hampshire centres of Basingstoke and Andover. As noted above, commercial property market linkages between these centres and
Berkshire Functional Economic Market Area Study: Final Report
P62 10050901v11
Berkshire are relatively weak with limited competition between the M3 and M4 corridors in overall market terms.
5.90 It should be noted that the broad property market areas illustrated in Figure 5.4 are intended to be indicative rather than definitive, and have been identified from a review of data, published studies and property market reports for Berkshire and the wider sub-region. There will inevitably be other property market areas operating on the fringes of, and beyond, the sub-region although these are not shown below.
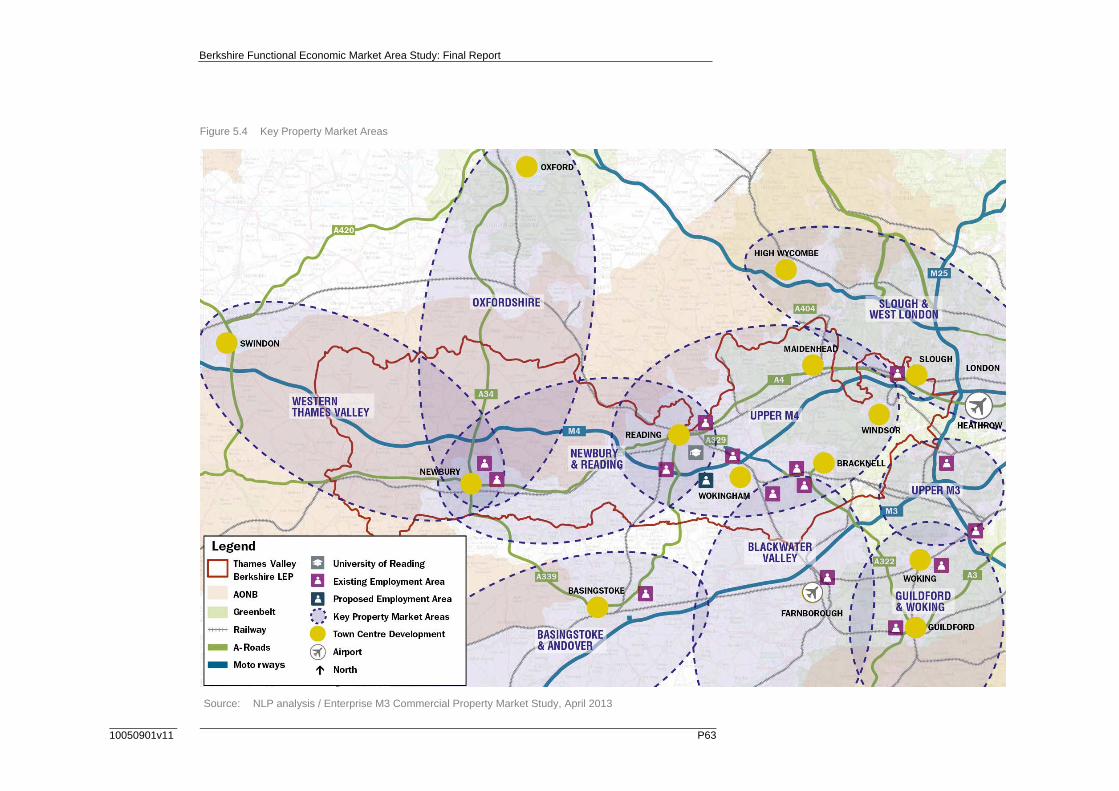
Berkshire Functional Economic Market Area Study: Final Report
10050901v11 P63
Figure 5.4 Key Property Market Areas
Source: NLP analysis / Enterprise M3 Commercial Property Market Study, April 2013

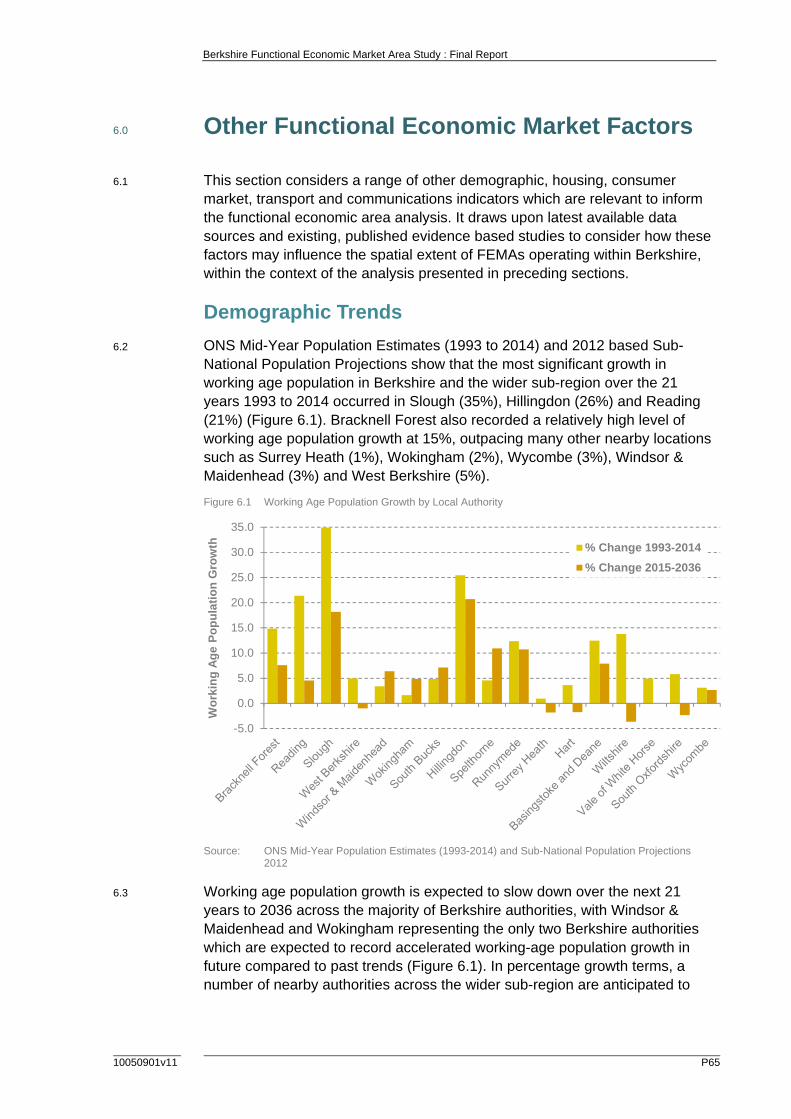
Berkshire Functional Economic Market Area Study : Final Report
10050901v11 P65
6.0 Other Functional Economic Market Factors
6.1 This section considers a range of other demographic, housing, consumer market, transport and communications indicators which are relevant to inform the functional economic area analysis. It draws upon latest available data sources and existing, published evidence based studies to consider how these factors may influence the spatial extent of FEMAs operating within Berkshire, within the context of the analysis presented in preceding sections.
Demographic Trends
6.2 ONS Mid-Year Population Estimates (1993 to 2014) and 2012 based Sub-National Population Projections show that the most significant growth in working age population in Berkshire and the wider sub-region over the 21 years 1993 to 2014 occurred in Slough (35%), Hillingdon (26%) and Reading (21%) (Figure 6.1). Bracknell Forest also recorded a relatively high level of working age population growth at 15%, outpacing many other nearby locations such as Surrey Heath (1%), Wokingham (2%), Wycombe (3%), Windsor & Maidenhead (3%) and West Berkshire (5%).
Figure 6.1 Working Age Population Growth by Local Authority
Source: ONS Mid-Year Population Estimates (1993-2014) and Sub-National Population Projections 2012
6.3 Working age population growth is expected to slow down over the next 21 years to 2036 across the majority of Berkshire authorities, with Windsor & Maidenhead and Wokingham representing the only two Berkshire authorities which are expected to record accelerated working-age population growth in future compared to past trends (Figure 6.1). In percentage growth terms, a number of nearby authorities across the wider sub-region are anticipated to
-5.0
0.0
5.0
10.0
15.0
20.0
25.0
30.0
35.0
Wo
rkin
g A
ge
Po
pu
lati
on
Gro
wth % Change 1993-2014
% Change 2015-2036

Berkshire Functional Economic Market Area Study : Final Report
P66 10050901v11
exceed the majority of Berkshire, including Hillingdon (21%), Spelthorne (11%), Runnymede (11%) and Basingstoke and Deane (8%). Figure 6.1 also shows that working-age population growth is expected to be negative in West Berkshire, inferring that the District’s working-age population is set to decline in overall terms between 2015 and 2036.
6.4 These anticipated trends are likely to have an impact on the scale and proportion of travel-to-work and migration flows that occur to, from and within Berkshire as the balance of employment and working age population changes. Berkshire may be less able to draw in-commuters from locations such as Hart, Surrey Heath and South Oxfordshire in the future as their resident labour force reduces in size. West Berkshire’s declining working-age population may also mean that the District must increasingly rely upon in-commuters to fill future employment opportunities generated by its business base.
6.5 At the same time, locations such as South Bucks and Spelthorne are expected to see a reasonably sizeable increase in its working age population over the next 21 years, representing a reverse trend from historic population growth patterns. If these residents are unable to find suitable employment opportunities within their own authority area, they may look to other commercial centres across the wider sub-region to provide these opportunities.
Retail and Consumer Market Areas
6.6 Within the context of identifying Functional Economic Market Areas, it is relevant to review existing retail and consumer market areas across the sub-region in order to consider the spatial area from which users of goods and services are drawn. Recent evidence prepared by the six Berkshire local authorities has been reviewed to gain an understanding of the location of the main retail and leisure centres and their respective catchment areas. This section also summarises the main centres which compete with Berkshire in retail and consumer market terms. This information may be subject to change as further analysis and updated retail studies are undertaken by the Berkshire authorities.
6.7 It should be noted that retail study areas/survey zones have been used as a proxy for retail catchment areas for the main Berkshire centres, in absence of a consistent approach having been adopted by the various retail studies in terms of defining the spatial extent of these catchment areas.
Sub-Regional Retail Hierarchy
6.8 Using VENUESCORE 2013-14 retail ranking data, it is possible to identify a hierarchy of retail venues across Berkshire and the surrounding area in order to understand how different centres compete for spend and investment. VENUESCORE 2013-14 evaluates each venue in terms of their provision of multiple retailers, and the score attached to each operator is weighted to reflect their overall impact on shopping patterns.
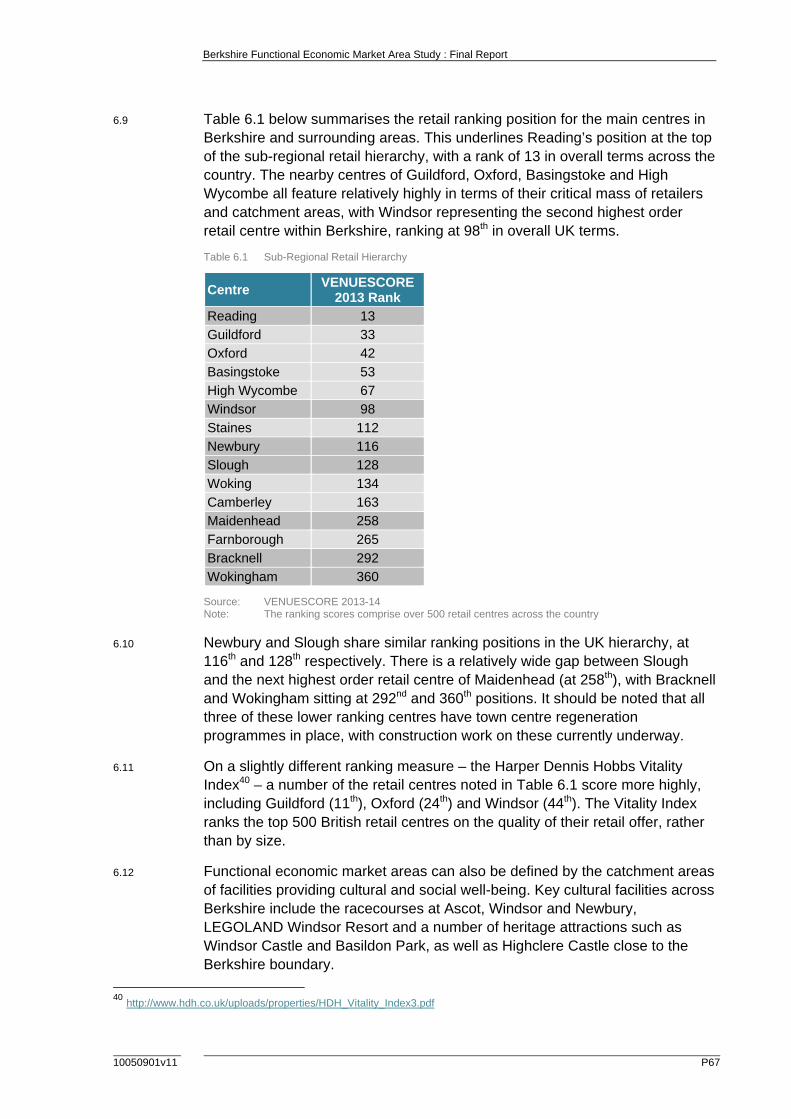
Berkshire Functional Economic Market Area Study : Final Report
10050901v11 P67
6.9 Table 6.1 below summarises the retail ranking position for the main centres in Berkshire and surrounding areas. This underlines Reading’s position at the top of the sub-regional retail hierarchy, with a rank of 13 in overall terms across the country. The nearby centres of Guildford, Oxford, Basingstoke and High Wycombe all feature relatively highly in terms of their critical mass of retailers and catchment areas, with Windsor representing the second highest order retail centre within Berkshire, ranking at 98th in overall UK terms.
Table 6.1 Sub-Regional Retail Hierarchy
Centre VENUESCORE
2013 Rank Reading 13
Guildford 33
Oxford 42
Basingstoke 53
High Wycombe 67
Windsor 98
Staines 112
Newbury 116
Slough 128
Woking 134
Camberley 163
Maidenhead 258
Farnborough 265
Bracknell 292
Wokingham 360
Source: VENUESCORE 2013-14 Note: The ranking scores comprise over 500 retail centres across the country
6.10 Newbury and Slough share similar ranking positions in the UK hierarchy, at 116th and 128th respectively. There is a relatively wide gap between Slough and the next highest order retail centre of Maidenhead (at 258th), with Bracknell and Wokingham sitting at 292nd and 360th positions. It should be noted that all three of these lower ranking centres have town centre regeneration programmes in place, with construction work on these currently underway.
6.11 On a slightly different ranking measure – the Harper Dennis Hobbs Vitality Index40 – a number of the retail centres noted in Table 6.1 score more highly, including Guildford (11th), Oxford (24th) and Windsor (44th). The Vitality Index ranks the top 500 British retail centres on the quality of their retail offer, rather than by size.
6.12 Functional economic market areas can also be defined by the catchment areas of facilities providing cultural and social well-being. Key cultural facilities across Berkshire include the racecourses at Ascot, Windsor and Newbury, LEGOLAND Windsor Resort and a number of heritage attractions such as Windsor Castle and Basildon Park, as well as Highclere Castle close to the Berkshire boundary.
40 http://www.hdh.co.uk/uploads/properties/HDH_Vitality_Index3.pdf
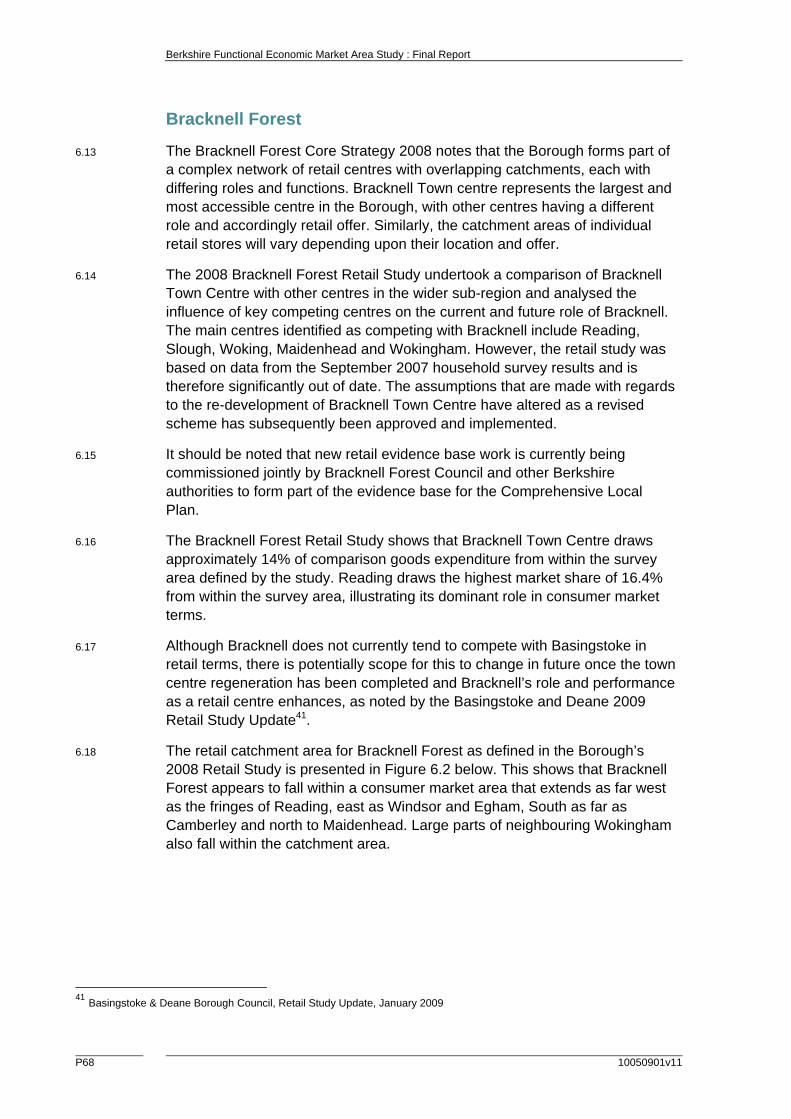
Berkshire Functional Economic Market Area Study : Final Report
P68 10050901v11
Bracknell Forest
6.13 The Bracknell Forest Core Strategy 2008 notes that the Borough forms part of a complex network of retail centres with overlapping catchments, each with differing roles and functions. Bracknell Town centre represents the largest and most accessible centre in the Borough, with other centres having a different role and accordingly retail offer. Similarly, the catchment areas of individual retail stores will vary depending upon their location and offer.
6.14 The 2008 Bracknell Forest Retail Study undertook a comparison of Bracknell Town Centre with other centres in the wider sub-region and analysed the influence of key competing centres on the current and future role of Bracknell. The main centres identified as competing with Bracknell include Reading, Slough, Woking, Maidenhead and Wokingham. However, the retail study was based on data from the September 2007 household survey results and is therefore significantly out of date. The assumptions that are made with regards to the re-development of Bracknell Town Centre have altered as a revised scheme has subsequently been approved and implemented.
6.15 It should be noted that new retail evidence base work is currently being commissioned jointly by Bracknell Forest Council and other Berkshire authorities to form part of the evidence base for the Comprehensive Local Plan.
6.16 The Bracknell Forest Retail Study shows that Bracknell Town Centre draws approximately 14% of comparison goods expenditure from within the survey area defined by the study. Reading draws the highest market share of 16.4% from within the survey area, illustrating its dominant role in consumer market terms.
6.17 Although Bracknell does not currently tend to compete with Basingstoke in retail terms, there is potentially scope for this to change in future once the town centre regeneration has been completed and Bracknell’s role and performance as a retail centre enhances, as noted by the Basingstoke and Deane 2009 Retail Study Update41.
6.18 The retail catchment area for Bracknell Forest as defined in the Borough’s 2008 Retail Study is presented in Figure 6.2 below. This shows that Bracknell Forest appears to fall within a consumer market area that extends as far west as the fringes of Reading, east as Windsor and Egham, South as far as Camberley and north to Maidenhead. Large parts of neighbouring Wokingham also fall within the catchment area.
41 Basingstoke & Deane Borough Council, Retail Study Update, January 2009
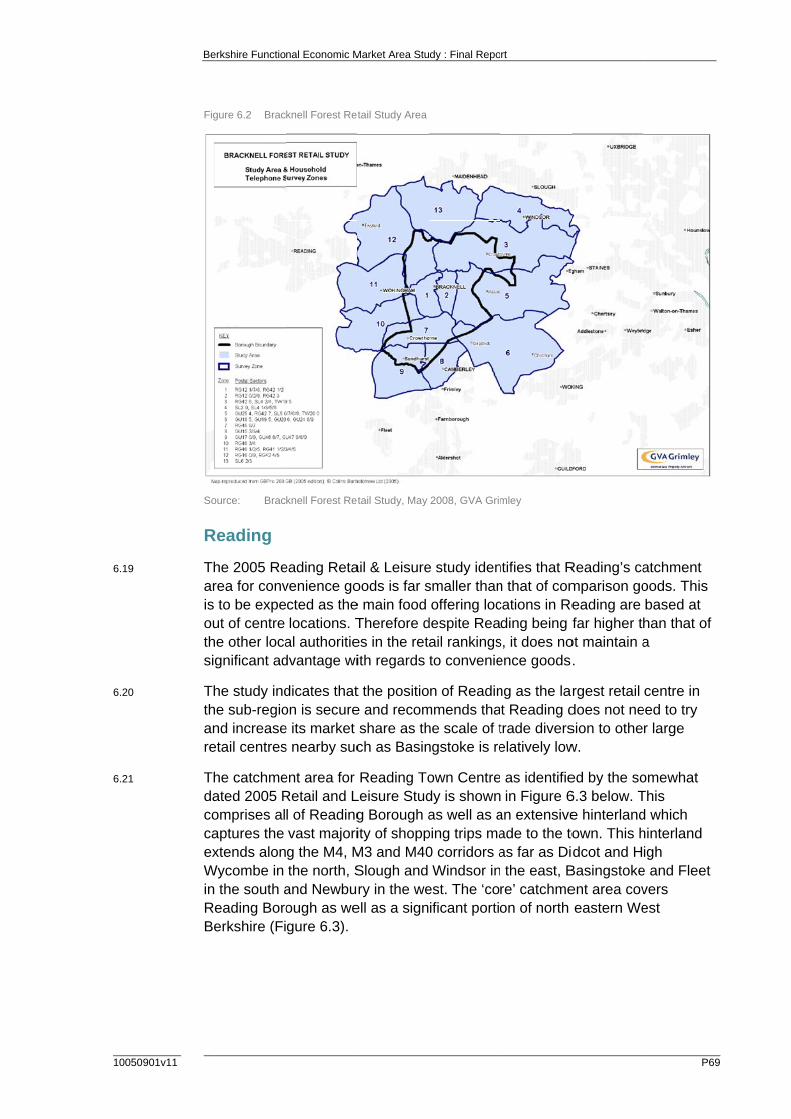
10050
6.19
6.20
6.21
Be
901v11
Fig
So
R
Tharis outhsi
Ththanre
ThdacocaexWinRBe
erkshire Functio
gure 6.2 Brac
ource: Brac
Reading
he 2005 Rerea for convto be expe
ut of centre he other locagnificant ad
he study indhe sub-regiond increaseetail centres
he catchmeated 2005 Romprises alaptures the xtends alon
Wycombe in the south aeading Boroerkshire (Fi
nal Economic M
knell Forest Ret
knell Forest Ret
eading Retavenience gocted as thelocations. T
al authoritiedvantage wi
dicates thaton is securee its market s nearby suc
ent area for Retail and Ll of Readingvast majorig the M4, Mthe north, S
and Newbuough as wegure 6.3).
Market Area Stu
tail Study Area
tail Study, May
ail & Leisureoods is far se main food Therefore des in the retith regards
t the positioe and recomshare as thch as Basin
Reading ToLeisure Studg Borough aity of shoppM3 and M40Slough and ry in the we
ell as a sign
dy : Final Repo
2008, GVA Grim
e study idensmaller thanoffering loc
despite Reaail rankingsto convenie
n of Readinmmends thahe scale of tngstoke is re
own Centredy is shownas well as a
ping trips ma0 corridors aWindsor in
est. The ‘coificant portio
rt
mley
ntifies that Rn that of comcations in Reding being f
s, it does noence goods
ng as the lart Reading dtrade diverselatively low
as identifie in Figure 6
an extensiveade to the toas far as Di the east, Bre’ catchmeon of north
Reading’s camparison goeading are far higher th
ot maintain a.
rgest retail does not nesion to othew.
ed by the so6.3 below. Te hinterlandown. This hdcot and H
Basingstokeent area coveastern We
P69
atchment oods. This based at han that of a
centre in eed to try r large
omewhat This d which hinterland igh
e and Fleet vers est
9
P70
6.22
6.23
42 Slough Loca43 http://www.s
Berkshire
Figure 6.3
Source:
Sloug
Slough Boroughstrong lparadesthe Coreundertacommuunderpeto be ducentres
In respoout in thprovidinthe percthe centCentre’ designahigh quaddresscentre.
al Development
slough.gov.uk/m
Functional Econ
Reading Reta
Retail and Le
h
Town Centh which alsocal identitis. The Boroe Strategy (
aken in 2015nity well. Brerforming asue to compein recent y
onse, in Sephe Corporatng businessception of thtre building regeneratio
ation in the Sality housins recognise
t Framework Co
moderngov/mgA
nomic Market A
ail Study Area
eisure Study of
re sits at tho includes Les and a se
ough’s retail(2008)42 rei5 shows Sloroader econs a retail anetition from ears.
ptember 20te Five years, living and he town andon the succ
on schemesSouth East g-led regend challenge
ore Strategy 200
Ai.aspx?ID=2905
Area Study : Fina
Reading, 2005,
e top of theLangley anderies of sma study is conforces thisough’s Townomic evidend commercits neighbo
15, the Cour Plan43: ‘Thcultural op
d attract peocess of the s. The VisioPlan as a p
neration as es and explo
06-2026 DPD 58
al Report
Colliers CRE
e network ofd Farnham all neighbouonsidered tos hierarchy n Centre m
ence howevcial centre i
ours and cha
uncil’s Cabihe Centre ofportunities’ople to visit‘Heart of S
on also movprimary retapart of a muoit the pote
f shopping fRoad distric
urhood cento be out of dand a Houseets the ne
ver shows thn the regionanges in the
net adoptedf Slough wil. The intent, invest, livelough’ and
ves beyond ail destinatioulti-disciplinntial strengt
10050
facilities in tct centres wtres and locdate, howevsehold Surveeds of its lohat it is n. This is like role of tow
d the visionll be vibranttion is to chae and work ‘Art at the the centre’s
on promotinnary approaths of the to
0901v11
the with cal ver vey ocal
kely wn
set t, ange in
s ng ach to own
Berkshire Functional Economic Market Area Study : Final Report
10050901v11 P71
6.24 Twelve key themes of the Vision include reshaping the shopping centre, building on Slough’s distinctive identity and excellent transport connections, and implementing ‘Digital High Street’ initiatives to make the High Street more convenient, accessible and vibrant for all shoppers and better inform retailers about their customer’s needs and requirements. The new Local Plan will, based on evidence to understand the current and future needs and expectations of the High Street, translate these initiatives into Planning Policy and Site Allocations and suitable improvements to the scale and range of retail facilities.
West Berkshire
6.25 The primary retail centre in West Berkshire is Newbury which serves the District and the wider catchment area, although it is recognised that some of the smaller district centres play an important role in providing for local needs. The West Berkshire Retail Update 201044 shows that Newbury accommodates a lower than average percentage of convenience shopping than the national average (3.7%) and lacks a large foodstore anchor in the primary shopping area.
6.26 Despite relatively poor levels of convenience shopping in Newbury town centre, West Berkshire manages to retain 80.4% of convenience spending within the authority, with 70% of comparison shopping retained within the core catchment area. Newbury town centre draws 35.8% of comparison goods spend, with a further 13.2% at Newbury Retail Park, highlighting the important role of Newbury as a retail location. Comparison goods spending outside of the District tends to be drawn to Reading town centre (14%), with just 2.5% to Basingstoke.
6.27 With regards to the regional catchment area or ‘outer’ catchment area, West Berkshire attracts a very low amount of both comparison and convenience goods shopping. Newbury town centre attracts just 5.4% of comparison goods from the outer catchment area compared to 21.9% in Reading and 16% in Basingstoke which is illustrative of Newbury’s status in the town centre hierarchy.
6.28 The District’s catchment area is shown in Figure 6.4 below, as set out in the 2010 Retail Study Update. This extends beyond the District so as to take account of the fact that shoppers do not observe administrative boundaries when they shop.
44 West Berkshire Retail Study Update, Final report: February 2010, Strategic Perspectives
P72
6.29
6.30
6.31
Berkshire
Figure 6.4
Source:
Zones 1Area whAlthougDistrict zones, tCatchmshoppin
It shouldplace in2010, inNewburcurrentlhave anand pot
Winds
The retaand Mabeen onwith Wingrowth. that perno avail
Functional Econ
West Berksh
West Berksh
1, 2 and 4 bhile the ‘Outgh Newbury will draw a the Retail S
ment Area wng locations
d be noted n the Districtncluding Pary Town Cey in the ear
n impact on tentially furt
sor and M
ail policies fidenhead Tne of the fasndsor and MSaved Loc
rmission willable sites i
nomic Market A
ire Retail Study
ire Retail Study
broadly reprter’ Catchmtown centreproportion o
Study Updatill also have
s, including
that a numbt since the Crkway Newntre, while arly stages ofthe retail se
her afield a
Maidenhea
for the BoroTown Centrestest growinMaidenheadcal Plan Poll only be grn the centre
Area Study : Fina
y Area
y, 2010 Update,
resent Newbment Area core and the oof their shote notes thae easy acceReading, B
ber of retail Council’s R
wbury, a retaa new Ikea f constructioector and ccross the w
ad
ough are coe Area Actiong sectors od town centicy S5 direc
ranted for ede.
al Report
Strategic Persp
bury town comprises Zo
other centreppers and e
at resident pess to a numasingstoke
developmeRetail Study ail and residstore at junon. These d
catchment awider sub-re
ntained withon Plan. Thof the local tres attractincts retail intodge of town
pectives
centre’s ‘Coone 3 and Zs/stores in Wexpenditurepopulation inmber of maj, Oxford and
ents have taUpdate wa
dential devenction 12 of developmenareas within egion.
hin the adoese note theconomy inng the majoo these cen
n developme
10050
re’ CatchmeZones 5 – 8West Berks
e from thesen the Outerjor competind Swindon.
aken/are takas undertakeelopment in f the M4 is nts are likely West Berk
pted Local hat retail hasn the Borougority of this ntres and stents if there
0901v11
ent 8. shire e r ng
king en in
y to shire
Plan s gh,
ates e are
Berkshire Functional Economic Market Area Study : Final Report
10050901v11 P73
6.32 A Retail and Town Centre Study45 for the Royal Borough has recently been published (in final draft format) and this identifies the particular strengths of Windsor and Maidenhead town centres, whilst the smaller centres of Sunningdale and Ascot, whilst performing their role as a small district centre, are not expected to experience growth levels that would see them compete on a sub-regional basis. Windsor is the most attractive retail location in the Borough, but both Windsor and Maidenhead experience comparative advantages in certain areas. For example, Windsor has a higher fashion, clothing retail focused shopping experience, whilst Maidenhead specialises in medical and chemist related goods and beauty products.
6.33 It is recognised that the retail offering is mainly localised and convenience-based and is not likely to operate significantly on a sub-regional basis. Maidenhead has seen a decline in its retail ranking and now sits at 258th in the VENUESCORE 2013/14 rankings. Windsor has a higher ranking at 98th but this is not likely to see it compete with other sub regional centres such as Reading and Basingstoke.
6.34 The retail study identifies that becoming a top 100 centre in the UK is important for the area to ensure that it remains a location for major retailers; however this is offset by the increasing threats of regional neighbours, particularly Reading and Bracknell. Another threat identified by the retail study is that the introduction of Crossrail in 2019, whilst providing opportunities with regards to investment potential and better public transport, ensures that shopping in Central London will become more accessible and therefore the percentage of comparison shopping that remains in the Borough is likely to decrease.
6.35 The retail catchment area for Windsor and Maidenhead as defined in the Borough’s 2015 Retail and Town Centre Study is presented in Figure 6.5 below. The study notes that the catchment area is wide enough to cover the area from which the Borough’s shopping destinations capture significant market shares of available expenditure. It also covers Slough Town Centre’s catchment area, to enable the household survey to establish shopping patterns for and shoppers’ views on Slough Town Centre.
6.36 As well as taking in the whole of the Royal Borough itself, the catchment area also comprises large parts of Bracknell Forest, Slough, South Bucks (Beaconsfield), Wycombe (Marlow) and Hillingdon.
45 The Royal Borough of Windsor and Maidenhead, Retail and Town Centre Study 2015, Final Draft September 2015, DTZ
P74
6.37
6.38
6.39
6.40
46 Wokingham47 Wokingham
Berkshire
Figure 6.5
Source:
Wokin
The Wothe Borowith sev
The WoWokingBoroughcentre ocompar
FiguresWoking£67.5 mconveniTwyford
Wokingcentres compardestinat
m Borough Core
m Retail Study 2
Functional Econ
Windsor and
Windsor and
ngham
okingham Cough, with Wveral district
okingham Rham, comph with 35% of the Borourison goods
for convenham accou
million. Wokience goodsd centre and
ham attractperform a m
rison goods tions just ou Strategy Devel
014 Update, NL
nomic Market A
Maidenhead R
Maidenhead R
Core StrategWokinghamt centres su
Retail Studyparison good
of this retaugh, in Zoneof spending
ience goodnting for apingham reps across thed Lower Ea
ts shoppersmore local sretailers. T
utside the B
opment Plan, 2
LP
Area Study : Fina
Retail Study Area
Retail and Town
gy (2010)46 im town centuch as Winn
2014 Updad retention ined within es 3/4 thereg retained w
ds shoppingpproximatelypresents thee Borough arley/Woodle
s from acrosshopping fu
The centres Borough, inc
2010
al Report
a
Centre Study, S
identifies are designatnersh below
ate47 shows rate is just 3Wokingham
e are just 2%within Woki
have strony £60 millio
e highest peapart from Zey.
ss the Borouunction, withcompete w
cluding Rea
September 2015
hierarchy oed as a maj
w it.
that even w36% across
m/Winnersh% and 1% rngham Boro
ger retention in Zone 1
ercentage shZone 5 and
ugh, while th a limited r
with major shading, Camb
10050
5, DTZ
of centres wajor town ce
within centras Wokinghah. Outside threspectivelyrough.
on rates, wit out of a tothare of Zone 6 wh
the other range of hopping berley, Brac
0901v11
within ntre
al am he y of
th tal of
ere
cknell

10050
6.41
6.42
6.43
Be
901v11
anno
ThStWWan
Fig
So
T
S
BeManlinlinLosi
InofRin
erkshire Functio
nd Maidenhorthern and
he catchmetudy Update
Wokingham Windsor & M
nd West Be
gure 6.6 Wok
ource: Wok
Transpor
trategic T
erkshire is lM3, M4 and
nd trunk roanking Londonking Londoondon to Oxgnificant am
n addition tof rail links paeading to Pto Central L
nal Economic M
head. Most n western pa
ent area for e is shown Borough anaidenhead
erkshire.
ingham Retail S
ingham Retail S
rt and Co
Transport
located betwM40) and thad networkson with the won with the sxford. The Mmount of no
o these stratassing throu
Paddington lLondon. The
Market Area Stu
notably, Reart of the Bo
Wokinghamin Figure 6.
nd extends and Hart, a
Study Area
Study, 2014 Upd
onnectiv
rt Network
ween threeherefore bes. The M4 ruwest. The ssouth west,M25 skirts t
orth/south tra
tegically imugh the areline which pere is also a
dy : Final Repo
eading has aorough.
m Borough a.6 below. Thinto adjoinin
and to a less
date, NLP
vity
k
major eastenefits from uns directlysouthern co, while to thhe eastern affic as part
portant roadea (as showprovides a 3a rail conne
rt
a strong infl
as identifiedhis covers tng Brackneser extent,
-west corridexcellent a
y through therridor consie north the border of Bt of the Lon
d links, therwn in Figure 30 minute nection betwe
luence over
d by the 20the majorityell Forest, RSouth Oxfo
dors of movccess to moe Thames Vists of the MM40 motor
Berkshire anndon Orbital
re are also a5.2), most
non-stop joueen Readin
P75
r the
14 Retail y of eading,
ordshire
vement (the otorway Valley, M3 and A30rway links nd carries a.
a number notably the
urney time g and
5
Berkshire Functional Economic Market Area Study : Final Report
P76 10050901v11
Waterloo via Wokingham, Bracknell, Ascot, Staines, Twickenham and Clapham Junction, although as a stopping service this route is relatively slow.
6.44 Other primary rail stations in the area include Slough and Maidenhead, which both lie on the Great Western Mainline. Both of these stations will provide direct services to Heathrow Airport once the Western Rail Access improvements are completed. Newbury and Hungerford lie on the Reading to Taunton line, a major branch of the Great Western Mainline. Both of these locations benefit from direct train services to London Paddington.
6.45 The M25 provides an important strategic route connecting Berkshire with Greater London, although the most significant benefits in terms of connectivity are felt within eastern parts of the LEP area. Aside from this, north-south road connections across Berkshire are more limited with the A322, A33, A339 and A34 representing the main north-south connections across the study area.
6.46 With the exception of the A34 in the west of Berkshire, from a strategic road network perspective north-south routes in Berkshire are relatively poor. This issue was identified by the Reading Diamond Local Economic Assessment48 which noted that firms newly locating in the Diamond regularly mentioned concerns relating to congestion levels and access difficulties (including car parking) for fringe and out-of-town locations, and what is seen as inadequate provision of public transport services in these areas.
6.47 Berkshire benefits from close proximity to London Heathrow via the M4, M3 and M25 motorways, while Gatwick is also accessible by train direct from Reading via Wokingham and Guildford. Direct train services run between Reading and Southampton Airport. Farnborough business airport is located just south of the Berkshire border and is estimated to support over 4,000 jobs as part of the airport’s wider supply chain49.
6.48 From a wider Thames Valley Berkshire perspective, the LEP’s Strategic Economic Plan50 acknowledges that the growth of the area’s economy has been – and continues to be – fundamentally shaped by its connectivity. For example, the area’s international links via Heathrow Airport are noted as a key reason why inward investors choose to locate in TVB and are therefore a crucial underpinning of ongoing re-investment. It was found in 2013 that Heathrow Airport represented around 5% of all employment within the ‘Western Wedge’ (i.e. the West London and Thames Valley area)51. Meanwhile, the importance of the sub-regions links with London cannot be overstated with the presence of the M4, the Great Western Mainline and the Reading to Waterloo Mainline.
6.49 Transport accessibility is strongly linked with the geography of functional economic market areas, with the strategic transport network playing a key role in shaping commercial property, labour and housing market flows. Eastern
48 University of Reading, The Reading Diamond: Local Economic Assessment, 2010 49 Oxford Economics: The Role of Business Aviation in the European Economy. October 2012 50 Thames Valley Berkshire Strategic Economic Plan 2015/16 -2020/21 51 Regeneris, September 2013. London Heathrow Economic Impact Study
Berkshire Functional Economic Market Area Study : Final Report
10050901v11 P77
Berkshire benefits from its proximity to a network of strategic routes including the M25, M4 and M40 each of which play a key role in shaping the TTWA, housing market and commercial property market areas that operate across this part of Berkshire, and linking the key commercial centres of Slough, Heathrow Airport and High Wycombe.
6.50 Similarly, the M4 and A4 corridors as well as the Great Western Mainline play an important role in linking Reading, Maidenhead, Wokingham and Bracknell in travel to work and commercial property market area terms. West Berkshire is also connected to more eastern Berkshire settlements via the M4 and A4 corridors as well as the Great Western Railway Mainline and benefits from good north south linkages via the A34. Its relative proximity away from the ‘core’ Thames Valley cluster of Reading, Wokingham, Bracknell and Maidenhead does however mean that commuting patterns and business movements tend to be more localised in character.
6.51 A recent KPMG Tech Monitor report52 identifies that the M4 corridor retains its place as the geographical area with the deepest concentration of tech companies in the UK. Other notable infrastructure advantages for top ranking tech clusters include the close distance of Heathrow Airport, as well as reasonably quick railway links into central London.
Road Connectivity
6.52 Transport networks support the productivity and success of urban areas and their catchments, by getting people to work, supporting deep and productive labour markets and allowing businesses within the area to reap the benefits of agglomeration. When considering access to labour catchment areas it is helpful to use isochrones as an indicator. These reflect the distance one can travel to/from a specific node in peak and off peak conditions. The figures below show how road accessibility varies across the LEP area, using peak drive time distances from Berkshire’s largest settlements. Larger versions of drive time maps for the largest settlements in Berkshire are included at Appendix 6.
6.53 The isochrones map for peak travel originating in Reading shows high levels of 30 minute drivetime accessibility across the TVBLEP area, with Bracknell, Wokingham and Maidenhead all within 30 minutes’ drive time. Other parts of Berkshire generally fall within a one hour boundary which also extends into West London along the M4 corridor (Figure 6.7).
52 KPMG Tech Monitor, November 2014
Berkshire Functional Economic Market Area Study : Final Report
P78 10050901v11
Figure 6.7 Reading Peak Drivetime Distance
Source: Experian 2015 / NLP analysis
6.54 For Newbury, Figure 6.8 shows that north-south transport corridors support a greater drive time distance than east-west corridors, with the Hampshire City of Winchester within easier reach of the town than the Berkshire centres of Bracknell, Maidenhead and Windsor. The 30 minute peak drive time also extends as far as Oxford along the A34 corridor.
Figure 6.8 Newbury Peak Drivetime Distance
Source: Experian 2015 / NLP analysis
6.55 The isochrones map for peak travel originating in Maidenhead shows high levels of 30 minute drivetime accessibility along the M4 and M40 strategic

Berkshire Functional Economic Market Area Study : Final Report
10050901v11 P79
corridors (Figure 6.9). This means that locations such as High Wycombe, Beaconsfield and Amersham are just as accessible by car at peak times than the Berkshire centres of Reading and Bracknell. Large parts of West Berkshire fall outside of this 30 minute drive time, meaning that the town of Newbury is a similar drive time away from Maidenhead as M25 and M1 locations such as Watford and Hemel Hempstead.
Figure 6.9 Maidenhead Peak Drivetime Distance
Source: Experian 2015 / NLP analysis
6.56 Slough’s location at the eastern end of Berkshire means that peak drive time accessibility from the town is driven by the combination of M4, M25 and M40 corridors. Much of Slough’s 30 minute drive time catchment falls to the east of the LEP area, covering large parts of Buckinghamshire, Surrey and West London (Figure 6.10). In contrast, the Berkshire towns of Reading and Newbury are much less accessible by road.
Berkshire Functional Economic Market Area Study : Final Report
P80 10050901v11
Figure 6.10 Slough Peak Drivetime Distance
Source: Experian 2015 / NLP analysis
Future Growth and Investment
6.57 The LEP’s SEP identifies two major rail routes that affect the sub-region, with the first one being the Great Western mainline from London Paddington. A number of significant infrastructure upgrades are due to take place over the next few years, including improvements at Reading station which are part of an £850m project to overhaul the platforms and concourses. The improvements will allow more crossing movements per hour with extra connections to nearby lines such as the Berks and Hants line which acts as the main north-south freight route.
6.58 Electrification of the Great Western Mainline railway to Newbury will also provide a significant boost to the West Berkshire local economy by reducing travel times to London Paddington.
6.59 The second large infrastructure project will be the introduction of Crossrail which will reach Reading by December 2019. In addition, there will be a spur to Heathrow and further stations to the employment centres of Southall and Hayes and Harlington. Journey times between Reading and London Paddington will be longer via Crossrail than existing rail services, although for some commuters this is anticipated to be offset by the lack of changes required to get into Central London and other locations such as Canary Wharf (where Crossrail journey times will converge with existing service times). A significant increase in capacity associated with the new 450 seat Crossrail trains could encourage commuters to switch from existing mainline services.
6.60 The combination of new direct journeys, increased capacity and existing fast direct services has the potential to increase pressure for development right along the Crossrail route into Berkshire.
Berkshire Functional Economic Market Area Study : Final Report
10050901v11 P81
6.61 It is recognised that the introduction of Crossrail to Berkshire will create some economic threats as well as opportunities, with enhanced capacity to London meaning that there will be increased competition for consumer spending as shopping centres in central London will be more easily accessible to the Thames Valley area53.
6.62 A further rail improvement that is ongoing is the Western Rail access to Heathrow. This is further behind in the development stage than Crossrail, although it has succeeded in securing a £500m commitment from the Government. Alongside the arrival of Crossrail, the Western Rail Access improvements may encourage greater travel to work flows to West London centres, most notably Heathrow Airport.
6.63 Pinch Point funding is being used to upgrade Junction 10 of the M4 which should ensure capacity enhancement. Outside of this project there are no further developments coming forward until the Managed Motorway Scheme is scheduled to improve Junction 12 after 2015.
6.64 Furthermore, Highways England proposes to improve the M4 by making it a ‘smart motorway’ between junctions 3 and 12. Smart motorways help relieve congestion by converting the hard shoulder to a running lane and using technology to monitor traffic flow and vary the mandatory speed limits to keep traffic moving smoothly.
Broadband Connectivity
6.65 Availability of broadband has significant positive economic, environmental and social impacts. Recent research54 emphasises that at the local level economic impacts arise from construction effects, productivity growth, enterprise creation, job creation and increased labour force participation. Broadband is also an enabler for international trade and innovation. BT estimate that for a typical rural area in the South East superfast broadband could lead to an annual increase in GVA of 0.3% per annum over 15 years55. The availability and quality of broadband coverage are increasingly essential to the relative attractiveness of an area to do business.
6.66 The Government’s Universal Service Commitment aims to ensure that everyone will have access to at least basic broadband (with a download speed of 2 Mbs). However, as bandwidths available in urban areas improve it is possible that a ‘digital-divide’56 is emerging. The ‘Superfast Berkshire’ project started in 2011, as part of a Government subsidised national programme, to improve broadband coverage in areas deemed not commercially viable for the private sector. The project aims to ensure all Berkshire premises could access basic broadband, at speeds of 2Mbps or faster, and that at least 90% of Berkshire premises could access superfast broadband, at speeds of 24Mbps
53 The Royal Borough of Windsor and Maidenhead, Retail and Town Centre Study 2015, Final Draft September 2015, DTZ 54 UK Broadband Economic Impact, Literature Review, SQW, February 2013 55 Social Study 2012 The Economic Impact of BT in the United Kingdom and the South-East, Regeneris 56 UK Broadband Economic Impact Study, Impact Report, SQW, November 2013

P82
6.67
6.68
6.69
6.70
Berkshire
or fasteTVBLEP
Figure 6(Next Gacross tto the wSuperfasubject shows tregion aprogramcoverag
Figure 6.1
Source:
Synth
From a to slow numberoutperfo
These aproportiBerkshiFor exasuch asresident
Reflecticonsum
Functional Econ
r. The projeP.
6.11 below Generation A
the Berkshiwest of the Rast Berkshirto live or pl
that large (pare currentlymme, while ge (Figure 6
1 Superfast Bro
Superfastber
hesis
demographdown in fut
r of nearby aorm the LEP
anticipated tion of travelre as the ba
ample, Berkss Hart, Surret labour forc
ng its size amer market c
nomic Market A
ect is backe
illustrates thAccess) to sre area. Th
Reading urbre programmanned com
predominatey under invesome areas
6.11).
oadband Deplo
rkshire.org.uk
hic perspecture across authorities aP area in wo
trends are ll-to-work analance of emshire may bey Heath ance reduces
and positioncatchment i
Area Study : Fina
ed by all six
he anticipatsupport supis shows th
ban area) ame, with larg
mmercial broely rural) arestigation us around th
yment Plans in
tive, workinthe majorityacross the working age
likely to havnd migrationmployment be less ablend Basingstin size.
n in retail ran Berkshire
al Report
Berkshire u
ted roll out operfast broahat western re set to bege parts of
oadband proeas toward
under the Sue edge of B
Berkshire to 20
ng age popuy of Berkshwider sub-rpopulation
ve an impacn flows that and workin
e to draw in-toke and De
anking termse, which ext
unitary coun
of fibre-basdband by thparts of thenefit most feastern Beogrammes. s the west ouperfast Be
Berkshire ha
017
ulation growire authoritiegion anticigrowth term
ct on the scaoccur to, frg age popu-commuterseane in the
s, Reading ends along
10050
ncils and the
sed infrastruhe end of 20e sub-regionfrom the rkshire alreThe map a
of the sub-erkshire ave no plan
wth is expeces, with a ipated to
ms.
ale and rom and witulation chans from locatfuture as th
has the largg the M4, M3
0901v11
e
ucture 017 n (i.e.
eady also
ned
cted
hin nges. tions heir
gest 3 and
Berkshire Functional Economic Market Area Study : Final Report
10050901v11 P83
M40 corridors taking in all of Berkshire as well as large parts of Oxfordshire, Buckinghamshire, Surrey and Hampshire.
6.71 Other Berkshire authorities tend to have more localised retail and consumer catchment areas, reflecting their lower order retail status and critical mass of occupiers. These generally form a broad radius around the main Berkshire centres, and also overlap into neighbouring counties. For example, Bracknell Forest’s retail catchment area extends into adjoining Surrey Districts, West Berkshire’s catchment overlaps with parts of Wiltshire, Hampshire and Oxfordshire, while Windsor & Maidenhead’s retail catchment extends to Buckinghamshire, West London and Surrey.
6.72 Due to the overlapping and complex nature of the various consumer market areas operating across Berkshire, this analysis is most helpful for defining sub-market areas rather than overarching functional economic market areas in themselves.
6.73 Berkshire is located between three major east-west corridors of movement (the M3, M4 and M40) as well as the M25 and therefore benefits from excellent access to motorway and trunk road networks. The LEP area is also well served by rail connections although north-south road routes are comparatively poor (with the exception of the A34 to the west of Berkshire).
6.74 Transport accessibility is strongly linked with the geography of functional economic market areas, with the strategic transport network playing a key role in shaping commercial property, labour and housing market flows. Eastern Berkshire benefits from its proximity to a network of strategic routes which plays a key role in shaping the TTWA, housing market and commercial property market areas that operate across this part of Berkshire, and linking the key commercial centres of Slough, Heathrow Airport and High Wycombe.
6.75 Similarly, the M4 and A4 corridors as well as the Great Western Mainline play an important role in linking Reading, Maidenhead, Wokingham and Bracknell in travel to work and commercial property market area terms. This pattern is likely to be reinforced through the operation of new Crossrail services from 2019. West Berkshire’s relative proximity away from the ‘core’ Thames Valley cluster of Reading, Wokingham, Bracknell and Maidenhead means that commuting patterns and business movements tend to be more localised in nature.
6.76 These dynamics are echoed by peak drive time distances from Berkshire’s largest centres, which identifies clear distinctions between eastern and western parts of Berkshire in terms of drivetime accessibility and road connectivity. Locations such as Slough and Maidenhead appear to have stronger economic relationships in labour accessibility terms with parts of adjoining Buckinghamshire, Surrey and West London than with more western parts of Berkshire. A similar distinction is evident in West Berkshire, with north south corridors supporting greater levels of drive time accessibility than east west corridors.

Berkshire Functional Economic Market Area Study : Final Report
P84 10050901v11
6.77 Although a significant programme of investment is underway to enhance broadband connectivity across Berkshire, there are still some (predominately rural) areas around the edge of Berkshire that are not anticipated to have any broadband coverage at all. This leaves certain parts of the TVBLEP area perhaps less well placed than other M4 corridor locations to compete for investment and firms.
Berkshire Functional Economic Market Area Study : Final Report
10050901v11 P85
7.0 Conclusions
7.1 This section draws together the range of quantitative and qualitative analysis presented in the previous chapters to consider the spatial remit associated with the various functional economic market areas operating across Berkshire. In line with PPG, the study has considered and reviewed a number of existing evidence documents and information sources to inform this assessment. It should be noted that some new or updated evidence studies are in the process of being prepared and therefore the conclusions outlined below may be subject to future change as new analysis is published.
Economic and Sector Characteristics
7.2 Berkshire has recorded strong job growth in recent years, outperforming the regional and national average. The scale of employment in Berkshire authorities is generally higher than many adjoining areas, with Reading and West Berkshire representing the largest economies in employment terms, and Bracknell Forest the smallest. In relative terms, Berkshire’s economy supports a strong concentration of jobs in high value telecoms, IT, professional services and utilities sectors when compared with the wider regional sector mix.
7.3 Particular clusters of professional services activity are accommodated within Bracknell Forest and Reading, while West Berkshire shares similar characteristics to adjoining Basingstoke & Deane and Wiltshire with regards to a strong representation of manufacturing employment. Wholesale employment is strongly represented along the M25/M40 distribution corridor from Slough through South Bucks up to Wycombe (with pockets of wholesale employment also found in Bracknell Forest and West Berkshire). Slough also shares similar employment characteristics to adjoining Hillingdon in terms of transport, admin & support given its proximity to Heathrow and the airport’s related operations.
7.4 The Berkshire authorities perform unevenly across a range of labour market and business demography indicators. Slough shares a number of similar labour market and business characteristics (such as economic activity, resident skills and business start-up) with nearby Hillingdon, Runnymede and Wycombe, while similar characteristics can also be identified between Windsor and Maidenhead and Wokingham, particularly with regards to the size profile of firms and strong enterprise performance.
Labour Market Areas
7.5 The functional labour market areas operating across Berkshire have been examined by assessing travel-to-work patterns in and out of the sub-region. An analysis of 2011 Census commuting flows data underlines the significant effect that Reading and West Berkshire have upon travel to work patterns in Berkshire, by accommodating the largest resident and workplace workforce and having the highest levels of labour self-containment in the sub-region. Slough also has a strong influence on labour market movements although
Berkshire Functional Economic Market Area Study : Final Report
P86 10050901v11
these commuting relationships are just as strong with neighbouring Buckinghamshire and London as they are with Berkshire.
7.6 Census data points to a growing east-west labour market divide in Berkshire, driven by the increasing influence and draw of Heathrow in commuting terms and declining influence of Reading upon travel to work flows with more eastern parts of Berkshire. TTWAs in the west of the TVBLEP area have remained largely unchanged over the last 10 years and relatively self-contained.
7.7 ONS analysis using 2011 Census data identified three broad TTWAs crossing the TVBLEP area, and these broad areas are substantiated by a more detailed local travel to work area analysis:
1 A Reading TTWA comprising the whole of Reading and Wokingham Boroughs as well as the majority of Bracknell Forest and parts of South Oxfordshire, West Berkshire, Windsor & Maidenhead and Hart.
2 A Slough and Heathrow TTWA including all of Slough Borough and parts of Windsor & Maidenhead. The majority of this TTWA falls to the east of the TVBLEP area, comprising a number of authorities including Runnymede, Spelthorne, South Bucks and the London Boroughs of Hillingdon and Kingston upon Thames.
3 A Newbury TTWA comprising the majority of West Berkshire District as well as parts of Wiltshire, Basingstoke and Deane and Test Valley.
7.8 In most cases, these TTWAs align reasonably well with Berkshire local authority boundaries, although Windsor & Maidenhead stands out as featuring within two separate TTWAs; the western parts of the Borough within the Reading TTWA and eastern parts within the Slough and Heathrow TTWA57.
57 It should be noted that a small area within the Northern part of Windsor & Maidenhead falls within a High Wycombe and Aylesbury TTWA (as shown in Figure 3.11) although the strength of this overlapping TTWA is relatively less significant than for the Reading and Slough and Heathrow TTWAs
10050
7.9
7.10
7.11
7.12
Be
901v11
Fig
So
ThRco
H
FrmRtoBeBeMbo
Thbecorebew
Raua DSl
erkshire Functio
gure 7.1 Func
ource: NLP
here are alseading, withomprising th
Housing
rom a housmigration and
ecent SHMo the existenerkshire HMerkshire; an
Maidenhead oundaries a
he case for ecause of thommuting inelationships etween the ith Windsor
ecent HMAuthorities idCentral Bucistricts as wlough HMA
nal Economic M
ctional Labour M
analysis, drawi
so significanh eastern phe wider Re
Market
ing market d travel to wA work undnce of two HMA coveringnd an Easteand South
approach.
these identhe influencen Eastern Bto adjoiningtwo HMAs,
r & Maidenh
A analysis prentified thackinghamsh
well as parts(comprisin
Market Area Stu
Market Areas – S
ng upon a rang
nt labour maarts of Wes
eading urba
Areas
perspectivework patterndertaken onHMAs operag Bracknell ern BerkshirBucks. This
tified HMAse of London
Berkshire. Ng areas, an particularly
head.
repared on at South Buchire HMA (cs of Aylesbug the local
dy : Final Repo
Summary Map
e of sources
arket flows st Berkshirean area) falli
e, Berkshirens from a ra behalf of thating acrossForest, Wo
re HMA coms uses a “be
s is strongern on the houear the boud also som
y with regar
behalf of thcks falls acrcomprising aury Vale andauthorities o
rt
between W District (paing within th
e is influencange of surrhe six Berkss the TVBLEkingham, R
mprising Sloest fit” to loc
r for the wesusing markeundaries of te evidence
rds to Brack
he four Buckross two seall of Wycomd South Bucof Bracknel
West Berksharticularly thhe Reading
ced by housrounding aushire authorEP area; a
Reading andough, Windscal authority
stern area, et, migrationthese HMAof interacti
knell Forest
kinghamshiparate HMAmbe and Ccks) and a ll, Reading,
P87
hire and hose
TTWA.
ehold uthorities. rities pointsWestern
d West sor and y
not least n and
As there are ons ’s links
re As; namely hiltern Reading &Slough,
7
s
P88
7.13
7.14
7.15
Berkshire
West BeBucks, w
Since thJoint Lodetermilatest evPlan AreCentral Wycomarrangedefined between
Housingdefines overlapbasis, itarea; ana Weste
Figure 7.2
Source:
Comm
Within BSlough,represeand Win
Functional Econ
erkshire, Wwhich was
hat analysisocal Plan wine housingvidence emea for ChilteBucks HMAbe. This is
ement for esHMA geog
n South Bu
g market stuthose authping housint is possiblen Eastern Bern Berksh
Housing Mar
NLP analysis
mercial
Berkshire, th followed by
ent the largendsor & Ma
nomic Market A
Windsor & Maconsidered
s was publisth Chiltern and emplo
merging fromern and SouA; together noted by thstablishing lraphy (whiccks and Be
udies prepaorities as fa
ng market ree to concludBerkshire Hhire HMA (F
rket Areas – Sum
s, drawing upon
Property
he largest cy Reading a
est industriaidenhead re
Area Study : Fina
aidenhead to be a ‘be
shed, SouthDistrict and
oyment requm this HEDNuth Bucks wwith the aue study as local plannich identifies
erkshire) stil
ared for othealling within elationships
de that two HHMA (whichFigure 7.2).
mmary Map
n a range of sou
y Marke
concentratioand West B
al locations ecord the h
al Report
and Wokingst fit’ with B
h Bucks havd have commuirements oNA study suwould form uthorities of providing thng policy, a
s strong houl remains va
er authoritieseparate H
s extending HMAs operah also incor
rces
et Areas
on of emploBerkshire. Tin floorspacighest amo
gham, as wBerkshire).
ve started tomissioned nver the peri
uggests thatpart of a “beAylesbury V
he most praalthough theusing markealid.
es surroundHMAs, with n
into Berkshate across tporates Sou
yment spachese three
ce terms, whunt of office
10050
well as South
o progress anew evidenciod to 2033t the Joint Lest fit” with Vale and
agmatic e previouslyet linkages
ding Berkshno evidencehire. On thisthe TVBLEPuth Bucks)
ce is found authorities hile Readine space.
0901v11
h
a ce to . The
Local a
y
ire e of s P and
in also g
10050
7.16
7.17
7.18
Be
901v11
AtMlinWshinonwac
AtsumsuSlta
Thsucomwwteth5.Fi
Fig
So
erkshire Functio
t a sub-regiM3 and M4 snkages to H
Western Corharing a numteraction. Tn the key Mith strong eccessibility
t the easterub area, ref
market interaub market alough and H
akes in the S
he western ub-marketsorridor. This
markets thanith regards estern boun
erms betweehese linkage.4) are not aigure 7.3 be
gure 7.3 Func
ource: NLP
nal Economic M
onal level, cstrategic ‘WHeathrow air
ridor, it is pmber of sim
This includeM4 markets o
conomic reand labour
rn end of theflecting the
actions. Thearea from thHigh WycomSouth Buck
part of the s, which cons area has an the M4 mato much of
ndary of Been Newburyes and propas strong aselow.
ctional Commerc
analysis, drawi
Market Area Stu
commerciaWestern corri
rport and thossible to id
milar characts a Core Thof Reading,
elationships force.
e Thames Vsignificant
e quasi-induhe Upper M4mbe key in tks towns of B
sub-region nstitute the a lower valuarkets closethe deman
erkshire. They and Readperty markets links to th
cial Property Ma
ng upon a rang
dy : Final Repo
l property midors’, drive
he outer wesdentify specteristics, trehames Val, Maidenheabetween th
Valley lies thinfluence of
ustrial natur4 area, withthis respectBeaconsfie
accommodkey nodes
ue profile in er to Londond, and linkaere is someing, and Net areas (ase west and
arket Areas – S
e of sources
rt
market areasen by strongst London Bcific sub maends and a hley or ‘Uppad, Brackne
hese towns
he Slough f Heathrow e of deman
h the commet. This sub mld and Gerr
dates the Neat the westboth office
n, a quasi-inages with are synergy inewbury and previously iare therefo
ummary Map
s are centreg functional Boroughs. Warket areas,high degree
per M4’ areell and Wokin terms of
and West LAirport upo
nd distinguisercial centrmarket arearards Cross
ewbury andtern end of and indust
ndustrial chreas beyond
n property mOxfordshir
identified inore not show
P89
ed on the economic
Within the each e of a focused
kingham, value,
London on property shes this es of a also .
d Swindonthe M4 rial aracter d the
market e, although
n Figure wn in
9
n
Berkshire Functional Economic Market Area Study : Final Report
P90 10050901v11
Consumer Market Areas
7.19 From a demographic perspective, working age population growth is expected to slow down in future across the majority of Berkshire authorities, with a number of nearby authorities across the wider sub-region anticipated to outperform the TVBLEP area in working age population growth terms. These anticipated trends are likely to have an impact on the scale and proportion of travel-to-work and migration flows that occur to, from and within Berkshire as the balance of employment and working age population changes.
7.20 Reflecting its size and position in retail ranking terms, Reading has the largest consumer market catchment in Berkshire, which extends along the M4, M3 and M40 corridors taking in all of Berkshire as well as large parts of Oxfordshire, Buckinghamshire, Surrey and Hampshire.
7.21 Other Berkshire authorities tend to have more localised retail and consumer catchment areas, reflecting their lower order retail status and critical mass of occupiers. These generally form a broad radius around the main Berkshire centres and sit within the overarching Reading consumer catchment area, and also overlap into neighbouring counties. For example, Bracknell Forest’s retail catchment area extends into adjoining Surrey Districts, West Berkshire’s catchment overlaps with parts of Wiltshire, Hampshire and Oxfordshire, while Windsor & Maidenhead’s retail catchment extends to Buckinghamshire, West London and Surrey.
7.22 Due to the overlapping and complex nature of the various consumer market areas operating across Berkshire, this analysis is most helpful for defining sub-market areas rather than overarching functional economic market areas in themselves.
Transport and Connectivity
7.23 Berkshire is located between three major east-west corridors of movement (the M3, M4 and M40) as well as the M25 and therefore benefits from excellent access to motorway and trunk road networks. The TVBLEP area is also well served by rail connections although north-south road routes are comparatively poor (with the exception of the A34 to the west of Berkshire).
7.24 Transport accessibility is strongly linked with the geography of functional economic market areas, with the strategic transport network playing a key role in shaping commercial property, labour and housing market flows. Eastern Berkshire benefits from its proximity to a network of strategic routes which plays a key role in shaping the TTWA, housing market and commercial property market areas that operate across this part of Berkshire, and linking the key commercial centres of Slough, Heathrow Airport and High Wycombe.
7.25 Similarly, the M4 and A4 corridors as well as the Great Western Mainline and Reading to London Waterloo line play an important role in linking Reading, Maidenhead, Wokingham and Bracknell in travel to work and commercial property market area terms. This pattern is likely to be reinforced through the

10050
7.26
7.27
Be
901v11
opdrdiloBrm
ThlapaLoreBuBecoac
S
BathecThdihowInin
Fig
So
erkshire Functio
peration of rive the strorect access
ocation awayracknell and
movements t
hese dynamrgest centrearts of Berkocations suelationships uckinghamserkshire. A orridors (incccessibility
Synthesi
ased upon hat operate conomic mahis represefferent factoousing markithin and ac
nvariably, hoterpreted a
gure 7.4 Func
ource: NLP
nal Economic M
new Crossrong links bes to Slough,y from the ‘d Maidenhetend to be m
mics are eches, which id
kshire in termch as Slougin labour a
shire, Surresimilar disti
cluding the Athan east w
s
the above aacross Berkarket to idennts a ‘policyors identifieket areas ancross Berksowever, thes being eith
ctional Economi
analysis, drawi
Market Area Stu
rail servicesetween Slou, Burnham acore’ Tham
ead means more localis
hoed by peadentifies clems of drivetgh and Maidaccessibility ey and Wesinction is evA34) suppo
west corrido
assessmentkshire, it is ntify how wey off’ view oed within thend commer
shire, regardese area bouher definitive
c Markets – Su
ng upon a rang
dy : Final Repo
s from 2019ugh and Lonand Langley
mes Valley cthat commu
sed in chara
ak drive timear distinctiotime accessdenhead apterms with t London thvident in Weorting greaters.
t of the varipossible to ell these ali
of the geogre PPG inclurcial propertdless of admundaries are or necess
mmary Map
e of sources
rt
. These samndon, and Cy Stations. W
cluster of Reuting patternacter.
me distancesons betweensibility and rppear to havparts of adj
han with moest Berkshirer levels of d
ous functionoverlay eacgn across Baphical reading labourty market arministrative e indicative
sarily fixed o
me connectCrossrail wilWest Berkseading, Wokns and busi
s from Berkn eastern aroad connecve stronger joining
ore western re, with nortdrive time
nal economch functionaBerkshire (Fch associatr market flowreas that opgeographie
e and shouldover time.
P9
tions also l improve
shire’s kingham, iness
shire’s nd westernctivity. economic
parts of th south
mic marketsal Figure 7.4).ted with ws, perate es. d not be
1
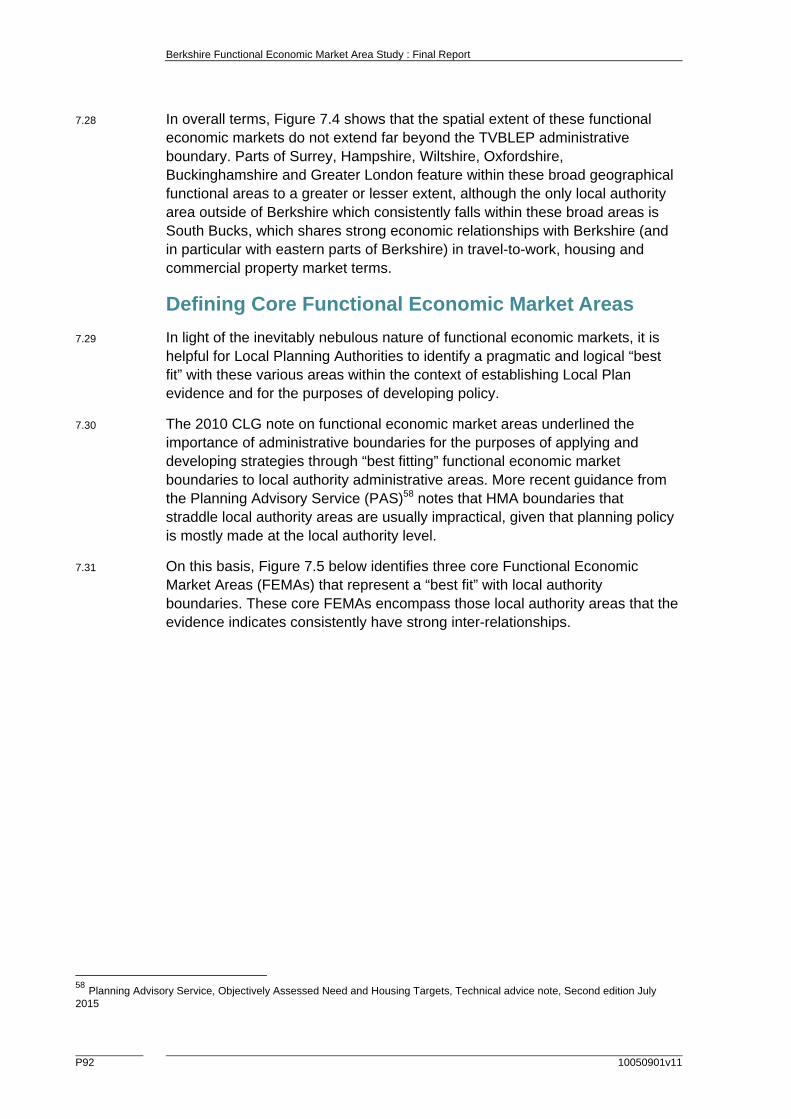
Berkshire Functional Economic Market Area Study : Final Report
P92 10050901v11
7.28 In overall terms, Figure 7.4 shows that the spatial extent of these functional economic markets do not extend far beyond the TVBLEP administrative boundary. Parts of Surrey, Hampshire, Wiltshire, Oxfordshire, Buckinghamshire and Greater London feature within these broad geographical functional areas to a greater or lesser extent, although the only local authority area outside of Berkshire which consistently falls within these broad areas is South Bucks, which shares strong economic relationships with Berkshire (and in particular with eastern parts of Berkshire) in travel-to-work, housing and commercial property market terms.
Defining Core Functional Economic Market Areas
7.29 In light of the inevitably nebulous nature of functional economic markets, it is helpful for Local Planning Authorities to identify a pragmatic and logical “best fit” with these various areas within the context of establishing Local Plan evidence and for the purposes of developing policy.
7.30 The 2010 CLG note on functional economic market areas underlined the importance of administrative boundaries for the purposes of applying and developing strategies through “best fitting” functional economic market boundaries to local authority administrative areas. More recent guidance from the Planning Advisory Service (PAS)58 notes that HMA boundaries that straddle local authority areas are usually impractical, given that planning policy is mostly made at the local authority level.
7.31 On this basis, Figure 7.5 below identifies three core Functional Economic Market Areas (FEMAs) that represent a “best fit” with local authority boundaries. These core FEMAs encompass those local authority areas that the evidence indicates consistently have strong inter-relationships.
58 Planning Advisory Service, Objectively Assessed Need and Housing Targets, Technical advice note, Second edition July 2015
10050
7.32
7.33
7.34
Be
901v11
Fig
So
ThWOmMbe
ThcecoprWNin
ThSlcocothadwthalrecopa
erkshire Functio
gure 7.5 Core
ource: NLP
he ‘Central Wokingham,
NS definedmarket area wMaidenhead,
etween thes
he ‘Westernentre of Newontained TTroperty mar
Whilst there ewbury andclude West
he ‘Easternlough and Wonsistent wiomprises a he Eastern Bdjoining Bucith the rest
hrough the idl three FEM
elationship aonsistently sarts of Berk
nal Economic M
e Functional Eco
analysis, drawi
Berkshire FBracknell F
d Reading Twhich is foc, Bracknell ase towns in
n Berkshire wbury. ThisTWA and terket constituis synergy id Reading, tt Berkshire w
Berkshire FWindsor & Mith the Slounumber of oBerkshire Hckinghamshof Berkshiredentification
MAs, the Eaand influencstanding ou
kshire.
Market Area Stu
onomic Market A
ng upon a rang
FEMA’ incluForest and WTTWA and acused arounand Wokingterms of va
FEMA’ coms area is chands to oper
uting a key nn travel to wthese linkagwithin the C
FEMA’ comMaidenheadgh and Heaother autho
HMA. Withinhire and Wee and this isn of a Sloug
astern Berksce with areaut as sharing
dy : Final Repo
Areas (Best Fit
e of sources
udes the autWindsor & Malso the Uppnd the key Mgham, with alue, access
mprises Wearacterised rate within anode at thework and prges are not Central Berk
mprises the td, alongsideathrow TTWority areas o this FEMA
est London s reflected igh & West Lshire FEMAas beyond Bg strong eco
rt
to Local Author
thority areaMaidenheadper M4 comM4 marketsstrong econsibility and l
st Berkshireby having a
a westward western en
roperty marconsidered
kshire FEMA
two Berkshe South Buc
WA as defineoutside of BA, economic
are just as in commercLondon prop
A has the greBerkshire, wonomic link
rity Boundaries)
as of Readind. This alig
mmercial pros of Readingnomic relatilabour force
e District ana relatively facing com
nd of the M4rket terms bd sufficientlyA.
ire authoriticks. This ared by the Oerkshire) as
c relationshistrong as th
cial propertyperty markeeatest degrwith South Bkages with e
P93
ng, ns with the operty g, onships e.
nd the key self-
mmercial 4 corridor.
between y strong to
ies of rea is
ONS (which s well as ps with hey are y terms et area. Of ree of Bucks eastern
3
Berkshire Functional Economic Market Area Study : Final Report
P94 10050901v11
7.35 The identification of three core FEMAs is consistent with previous economic analysis undertaken on behalf of the TVBLEP, including most recently for the SEP59, which recognised the presence of three distinctive functional economic areas in Thames Valley Berkshire as follows:
To the west: the predominantly rural area around Newbury; a diverse economy with a mix of small and international businesses;
In the centre: the highly interconnected urban areas of Reading, Wokingham and Bracknell; a major centre of economic activity with significant potential for future growth;
In the east: Slough, Windsor and Maidenhead; another centre of economic activity with close links to adjacent areas in west London (including Heathrow Airport).
7.36 The TVBLEP also acknowledges that in practice, these functional economic areas are very difficult to define precisely and there is a great deal of porosity in terms of their boundaries. It is also important to recognise the continuously changing geography of the Thames Valley Berkshire economy; for example Centre for Cities have recently made some changes to the way in which the UK’s largest cities or ‘Primary Urban Areas’ (the physical footprint of a city) are identified and defined60. This includes the addition of Slough to the list of cities/Primary Urban Areas that are now monitored through their regular Cities Outlook reports, and the loss of one local authority from the spatial extent of the Reading Primary Urban Area.
7.37 It should be noted that the Borough of Hillingdon and Heathrow Airport in particular, also share strong economic relationships with Berkshire, most notably in commercial property and labour market terms. The Borough of Hillingdon has not however been included within the Eastern Berkshire FEMA in best fit local authority boundary terms, due to the dominant effect that one single site/employment location (i.e. Heathrow) has in maintaining these relationships. Outside of Heathrow, economic linkages between Berkshire and the rest of Hillingdon Borough are much less significant. By comparison, the functional relationship between Berkshire and South Bucks (which is included within the Eastern Berkshire FEMA) is characterised by a more even distribution geographically across the District.
7.38 As shown in Figure 7.5 and Table 7.1, Windsor & Maidenhead sits across two FEMAs (Central and Eastern Berkshire) due to the varied characteristics and economic role associated with different parts of the Borough. The Borough’s position within two FEMAs reflects the equally strong relationships that Windsor & Maidenhead exhibits both with more central parts of Berkshire as well as areas within South Bucks. In labour market terms, eastern parts of the Borough share a TTWA with Slough and Heathrow61, while northern and
59 Thames Valley Berkshire Strategic Economic Plan 2015/16 -2020/21; and Thames Valley Berkshire: Delivering national growth, locally, Strategic Economic Plan, 2015/16 – 2020/21, Evidence Base 60 Centre for Cities, The changing geography of the UK economy: A review of the Primary Urban Area definition, December 2015 61 Defined by ONS as the ‘Slough and Heathrow’ travel to work area (2011 Census based)

Berkshire Functional Economic Market Area Study : Final Report
10050901v11 P95
western parts of the Borough have stronger functional economic relationships with western M4 corridor locations such as Reading and Wokingham. The Borough also falls within an HMA with Slough and South Bucks according to the Berkshire SHMA, underlining the particular strength of housing market relationships within this eastern part of Berkshire.
7.39 Tables included in Appendix 7 summarise the degree of relationship between Berkshire and adjoining authorities by each of the key themes that have been assessed for the purposes of defining functional economic market areas, and for those themes where available information is sufficiently detailed to be able to differentiate the degree of relationship. It should be noted that this synopsis is indicative and is largely based upon existing, published evidence which is subject to change as and when new analysis is undertaken.
Table 7.1 Core Functional Economic Market Areas
Local Authority Area Central
Berkshire FEMAEastern
Berkshire FEMA Western
Berkshire FEMABracknell Forest
Reading
Slough
West Berkshire
Windsor & Maidenhead
Wokingham
South Bucks
Source: NLP analysis, drawing upon a range of sources
7.40 Analysis undertaken as part of this study identifies evidence of interactions between the various Core FEMAs and with adjoining authorities outside of Berkshire. Whilst “best fit” areas have been defined above for the purposes of informing future plan making, it should be recognised that the boundaries of these areas are porous given the different layers of inter-relationship that exist between each area as well as across the TVBLEP area overall. It is important to continue to recognise these relationships in Duty to Cooperate terms.
7.41 This is particularly relevant with regards to clusters of economic activity that sit close to the border between two different FEMAs. A good example of this is the Arlington Business Park at Theale which functionally operates within the same commercial property market as adjoining Reading (i.e. the ‘Upper M4’ property market area) but which in best fit to local authority boundary terms, falls within a Western Berkshire FEMA.
7.42 The conclusions that have been drawn as part of this study are based on what existing data and evidence shows about the economic geographies and flows of labour, residents and businesses across the wider sub-region. They do not take account of policy positions or approaches that may or may not be adopted by local planning authorities across Berkshire and neighbouring areas. Through the Duty to Cooperate process, local planning authorities will need to determine how the study conclusions and FEMA boundaries are taken forward in practical planning policy terms.


Berkshire Functional Economic Market Area Study : Final Report
P96 10050901v11
Appendix 1 Methodology Consultation Questions
The Thames Valley Berkshire Local Enterprise Partnership (TVBLEP), in conjunction with the sixBerkshire local authorities of Bracknell Forest, Reading, Slough, West Berkshire, the Royal Borough ofWindsor and Maidenhead and Wokingham, have recently commissioned independent planning andeconomic consultants Nathaniel Lichfield & Partners (NLP) to undertake a study to establish the variousFunctional Economic Market Areas (FEMAs) that operate across the Berkshire sub-region and theeconomic development needs that local authorities should be planning for within these FEMAs. Thework will begin by developing appropriate methodologies for undertaking the study, and then use thesemethodologies to identify the relevant FEMAs and economic development needs to 2036.
This piece of work reflects the recognition that the geographical extent of local economies do notnecessarily adhere to administrative boundaries, alongside the requirement set out in the PlanningPractice Guidance (PPG) for local authorities to consider their economic needs in relation to FunctionalEconomic Market Areas.
Evidence from this study will form the basis for the development of economic policies through each localauthority’s future local plan process(s) as well as other economic development work within and betweenthe local authorities, and the work of the LEP.
The study will be undertaken in two parts; the first will establish the FEMA(s) that each of the sixBerkshire local authorities sit within. The second part of the study will comprise an EconomicDevelopment Needs Assessment (EDNA) for each of the FEMAs identified through part one. It will usethe methodology being developed as part of this work to identify the future quantity of land or floorspace that will be required for economic development uses over the period to 2036 in each localauthority area and in each of the defined FEMA(s). This will include both a quantitative and qualitativeassessment of the need for new development.
The study represents early stage technical analysis and there will be further work to do on specific tasksand topics in due course. It should be noted that a Strategic Housing Market Assessment (SHMA) isbeing concluded on behalf of the six local authorities in Berkshire and the TVBLEP. Whilst the emergingfindings from the SHMA will feed into this work, it does not form part of this FEMA study.
NLP have prepared an outline methodology for parts one and two of the study based upon guidancefrom the PPG and from experience elsewhere. It is important that the analysis is based on robust andcredible evidence and is informed through consultation with key stakeholders including neighbouring
1. Introduction
Berkshire Functional Economic Market Area Study and Economic Development NeedsAssessment – Method Consultation

local authorities and other organisations with an interest in economic development across the wider sub-region.
We are therefore inviting your feedback and comments on the proposed methodology and would begrateful if you could spend a few minutes to complete this short survey by Wednesday 28 October. Ifyou have any queries about this survey, or would like more information about the FEMA study, pleasecontact Caroline Perkins at TVBLEP on 0118 945 0201 or [email protected].

2. Survey Participants
Berkshire Functional Economic Market Area Study and Economic Development NeedsAssessment – Method Consultation
Name
Organisation
Email Address
Phone Number
Please provide your details below so that we can better understand the context of your feedbackand comments.
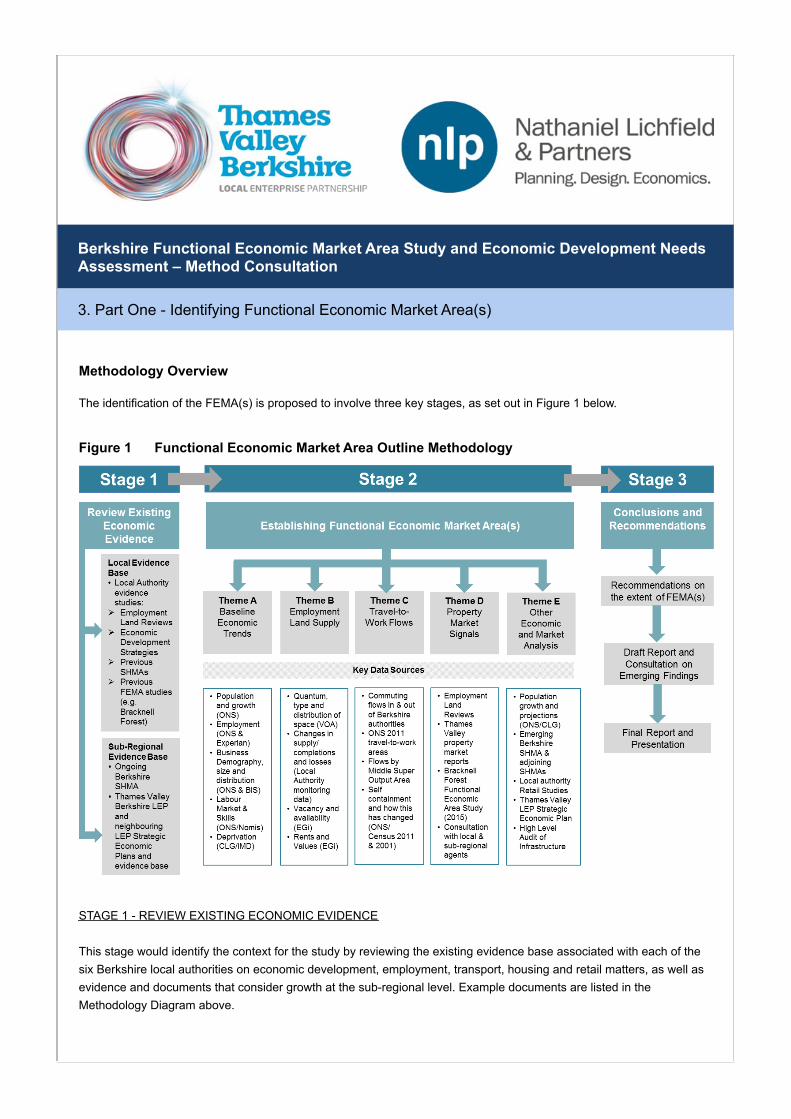
Methodology Overview
3. Part One - Identifying Functional Economic Market Area(s)
Berkshire Functional Economic Market Area Study and Economic Development NeedsAssessment – Method Consultation
The identification of the FEMA(s) is proposed to involve three key stages, as set out in Figure 1 below.
Figure 1 Functional Economic Market Area Outline Methodology
STAGE 1 - REVIEW EXISTING ECONOMIC EVIDENCE
This stage would identify the context for the study by reviewing the existing evidence base associated with each of thesix Berkshire local authorities on economic development, employment, transport, housing and retail matters, as well asevidence and documents that consider growth at the sub-regional level. Example documents are listed in theMethodology Diagram above.
Any comments?
Does this represent a comprehensive suite of existing economic evidence to review?
Yes
No
Are there any other sources that could be considered?
STAGE 2 - ESTABLISHING FUNCTIONAL ECONOMIC MARKET AREA(S)
This stage would involve analysing a range of information and data to establish and spatially define the variousFunctional Economic Market Areas that operate across the Berkshire sub-region. We propose to structure this analysisacross five key themes, as shown in the Methodology Diagram above.
Yes No
A: Baseline EconomicTrends
B: Employment LandSupply
C: Travel-to-WorkFlows
D: Property MarketSignals
E: Other Economicand Market Analysis
Any comments?
Do each of the proposed themes (A to E) represent a logical and robust input to defining theFunctional Economic Market Area(s) operating across the Berkshire sub-region?

A: Baseline EconomicTrends
B: Employment LandSupply
C: Travel-to-WorkFlows
D: Property MarketSignals
E: Other Economic andMarket Analysis
Are there any other sources of data or information that could be considered?
Do you have any other comments on the proposed methodology, data sources or themes thatare proposed as part of the Berkshire Functional Economic Market Area Study?
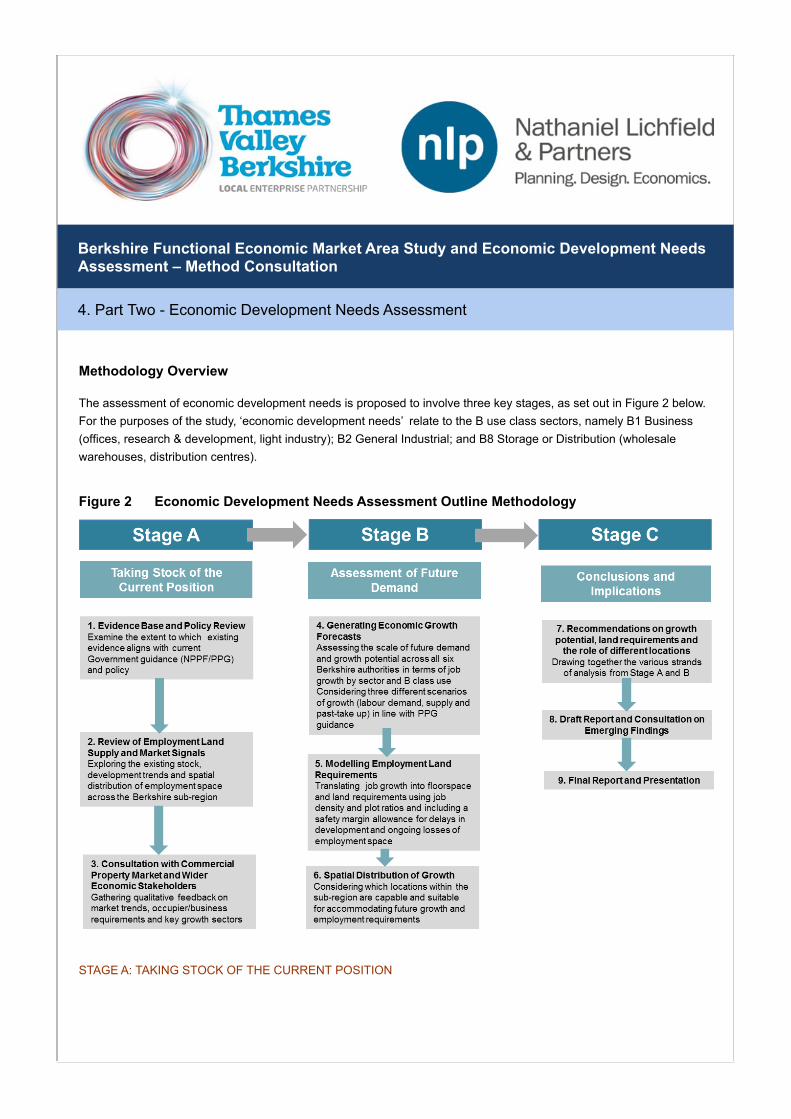
Methodology Overview
4. Part Two - Economic Development Needs Assessment
Berkshire Functional Economic Market Area Study and Economic Development NeedsAssessment – Method Consultation
The assessment of economic development needs is proposed to involve three key stages, as set out in Figure 2 below.For the purposes of the study, ‘economic development needs’ relate to the B use class sectors, namely B1 Business(offices, research & development, light industry); B2 General Industrial; and B8 Storage or Distribution (wholesalewarehouses, distribution centres).
Figure 2 Economic Development Needs Assessment Outline Methodology
STAGE A: TAKING STOCK OF THE CURRENT POSITION

1. Evidence Base and Policy Review
This task would identify the baseline position and previous economic evidence prepared by each of the six Berkshirelocal authorities (where not already reviewed as part of Part 1). We would examine the extent to which this existingevidence aligns with current Government guidance (NPPF/PPG) and policy.
Do you have any comments on the proposed approach for this task?
2. Review of Employment Land Supply and Market Signals
This task would explore the existing stock, development trends and spatial distribution of employment space across theBerkshire sub-region and each individual local authority area within it. This will provide a detailed understanding ofrecent patterns and change within the sub-regional commercial property market, drawing on data from the ValuationOffice Agency (VOA), Council monitoring data and web-based property availability registers.
Do you have any comments on the proposed approach for this task?
3. Consultation with Commercial Property Market and Wider Economic Stakeholders
We would gather qualitative feedback on market trends, occupier/business requirements and key growth sectors from arange of stakeholders including commercial property market agents, local economic and business organisations.
Do you have any comments on the proposed approach for this task?
STAGE B: ASSESSMENT OF FUTURE DEMAND
4. Generating Economic Growth Forecasts
This task would assess the scale of future demand and growth potential of the six Berkshire local authorities andidentified FEMAs in order to quantify the amount and type of employment land needed across the main employment useclasses up to 2036, in both quantitative and qualitative terms. We propose to consider three different scenarios ofgrowth, based on labour demand, labour supply and past take-up in line with PPG guidance.
Do you have any comments on the proposed approach for this task?

5. Modelling Employment Land Requirements
For all scenarios, job growth projections would be translated into floorspace requirements using industry standard jobdensity ratios. Floorspace estimates would be converted into employment land needs using appropriate assumptions onplot ratios for different locations/types of development, based on Government guidance or any local informationavailable. A safety margin allowance will be incorporated to account for delays in development and ongoing losses ofemployment space.
Do you have any comments on the proposed approach for this task?
6. Spatial Distribution of Growth
Within the context of identified future requirements, this task would consider which locations and key sites within thesub-region are capable and suitable for accommodating this growth based upon a high level SWOT analysis of the sub-region’s commercial property market and FEMA(s).
Do you have any comments on the proposed approach for this task?
Thank you for taking the time to complete the survey.
Berkshire Functional Economic Market Area Study : Final Report
10050901v11 P97
Appendix 2 Methodology Consultation Responses Summary
Consultation was undertaken at the beginning of the study to gain feedback on the proposed methodology for both Part One (FEMA analysis) and Part Two (Economic Development Needs Assessment) of the study. The summary below incorporates responses received with regards to the Part One FEMA analysis only.
Responses to the methodology consultation were received from the following consultees. Not all respondents provided written responses or comments on the study methodology; ID reference numbers are provided below to illustrate where comments were received.
University of Reading (ID: M1)
TFB Cinnamon Café (ID: M2)
Peasemore Parish Council (ID: M3)
Federation of Small Businesses (ID: M4)
Wraysbury parish Council (ID: M5)
Newbury Town Council (ID: M6)
Bracknell Forest Council (Business Team) (ID: M7)
Telefonica UK (ID: M8)
Rushmoor Borough Council (ID: M9)
Enborne Parish Council (ID: M10)
Hungerford Town Council (ID: M11)
Guildford Borough Council (ID: M12)
Runnymede Borough Council (ID: M13)
Windsor and Eton town Partnership (ID: M14)

Berkshire Functional Economic Market Area Study : Final Report
P98 10050901v11
Consultation Response ID Ref NLP Comments/Response
Part One: Identifying Functional Economic Market Area(s)
STAGE 1 - REVIEW EXISTING ECONOMIC EVIDENCE
1. Does this represent a comprehensive suite of existing economic evidence to review?
Yes: 50%, No: 36%, No Response: 14% n/a
Should show or evidence more on service industry. Windsor has two of the most popular visitor attractions generating significant transport cross over and visitors across the whole region. Equally we have a large commuter base who travel into and out of the borough as well as through it in order to get to Key areas in the regions such as London , Slough Trading Estate
M14
Individual sector analysis (including the service industry) is presented in Section 2.0.
Commuting and travel to work analysis is presented in Section 3.0.
Requires examination of impact of infrastructure developments e.g. Electrification of rail & connectivity to Heathrow
M11 Infrastructure and connectivity is considered in Section 6.0.
No mention of Tourism, leisure, health or education M6 Individual sector analysis is presented in Section 2.0.
Understand the impact of tourism, that as a whole may not represent a substantial amount in the overall scheme, within certain geographic locations (Windsor) poss Ascot, the volume of business represents more than 50% of the local economy.
M2 Individual sector analysis is presented in Section 2.0.
2. Are there any other sources that could be considered?
RBWM is in the middle of developing it Borough Local Plan so some recent publications could support this. In addition visitor management team just published economic impact study and visitor surveys. Tourism England may also be able to provide some recent research and study information in this area.
M14
Recent evidence has been reviewed and incorporated into the study analysis were relevant.
KPMG tech monitor reports have been reviewed in Section 2.0.
Home working trends are considered in Section 3.0.
The latest local authority retail studies have been reviewed in Section 6.0.
KPMG tech monitor reports M13
Thames Valley Chamber of Commerce Inward Investment Unit
M11
Not sure if local evidence base will include local surveys that have been done and could inform (e.g. BF infrastructure and skills surveys)
M7
Tourism, health and education M6
In writing our Neighbourhood Plan we have been struck how much business is now conducted from home or from home/business (at least 17% here and we think this is an underestimate)
M5
The latest local retail survey, who-fully underestimated the above to represent about 2%, our estimation is closer to 50%.
M2
STAGE 2 - ESTABLISHING FUNCTIONAL ECONOMIC MARKET AREA(S)
3. Do each of the proposed themes (A to E) represent a logical and robust input to defining the Functional Economic Market Area(s) operating across the Berkshire sub-region?
A: Baseline Economic Trends (Yes 79%, No 7%, No n/a
Berkshire Functional Economic Market Area Study : Final Report
10050901v11 P99
Consultation Response ID Ref NLP Comments/Response
Response 14%)
B: Employment Land Supply (Yes 79%, No 7%, No Response 14%)
C: Travel-to-Work Flows (Yes 79%, No 7%, No Response 14%)
D: Property Market Signals (Yes 79%, No 7%, No Response 14%)
E: Other Economic and Market Analysis (Yes 79%, No 7%, No Response 14%)
While unemployment rates are useful, they can disguise relative poverty
M6
Unemployment is one of a number of labour market indicators which have been reviewed in Section 2.0.
Land is in short supply here and brownfield sites need to be better identified. Travel to work is very much governed by transport availability. See to the answer above about home working
M5 Travel to work and transport are considered in turn in Sections 3.0 and 6.0
Inaccurate data at the offset does nothing to reach a robust conclusion
M2 Data is as accurate, up-to-date and robust as possible
4. Are there any other sources of data or information that could be considered?
A: Baseline Economic Trends
Thames Valley Chamber of Commerce
They tend to measure current trends and a major issue is what may happen over airport expansion
Visitor, tourism numbers (change)
M11
M5
M2
Recent evidence has been reviewed and incorporated into the study analysis were relevant
Expansion of Heathrow Airport has not been specifically considered as part of this study
The tourism sector (in employment terms) is considered in Section 2.0
B: Employment Land Supply
Local Authorities Strategic plans
Always in short supply
M11
M5
Strategic Plans has been reviewed and incorporated into the study analysis were relevant
C: Travel-to-Work Flows
Network Rail
Bracknell Forest infrastructure survey perhaps
So influenced by the availability of public transport.
M11
M7
M5
Significant Network Rail projects have been referred to in Section 6.0
D: Property Market Signals
see suggestion about KPMG reports above
Impact of Crossrail
There is a shortage of affordable housing for young people
M13
M11
M5
KPMG tech monitor reports have been reviewed in Section 2.0.
Crossrail is referred to as part of Section 6.0
E: Other Economic and Market Analysis
see suggestion about KPMG reports above
Looking at trends in Europe
Visitor Tourist, both local and international expenditure.
M13
M5
M2
KPMG tech monitor reports have been reviewed in Section 2.0.
European trends fall beyond the scope of this high level analysis
The tourism sector (in employment terms) is considered in Section 2.0
Berkshire Functional Economic Market Area Study : Final Report
P100 10050901v11
Consultation Response ID Ref NLP Comments/Response
5. Do you have any other comments on the proposed methodology, data sources or themes that are proposed as part of the Berkshire Functional Economic Market Area Study?
Please do not ignore the far west of county i.e. Hungerford
M11 Each Berkshire local authority area has been included within the analysis in its entirety
What is written down is fine but I do not consider it comprehensive enough
M5
The range of themes that have been considered are consistent with the latest Government guidance (as contained in the PPG)
Berkshire Functional Economic Market Area Study : Final Report
10050901v11 P101
Appendix 3 Emerging Findings Consultation Questions
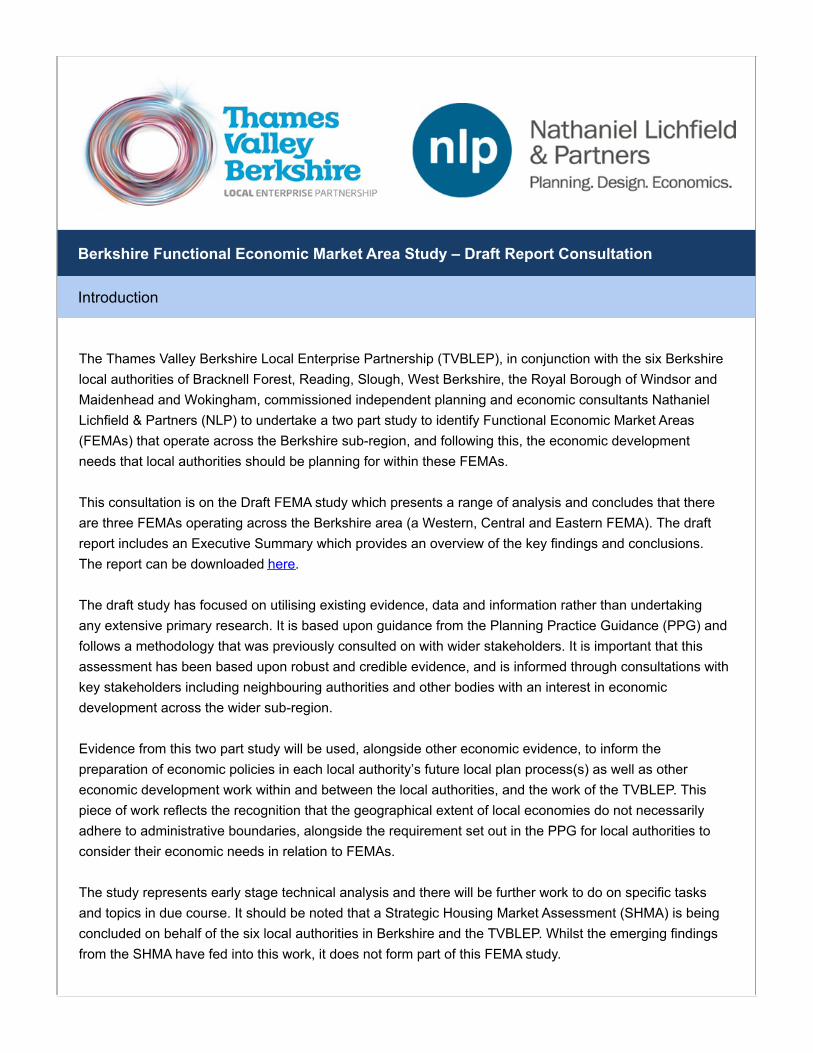
The Thames Valley Berkshire Local Enterprise Partnership (TVBLEP), in conjunction with the six Berkshirelocal authorities of Bracknell Forest, Reading, Slough, West Berkshire, the Royal Borough of Windsor andMaidenhead and Wokingham, commissioned independent planning and economic consultants NathanielLichfield & Partners (NLP) to undertake a two part study to identify Functional Economic Market Areas(FEMAs) that operate across the Berkshire sub-region, and following this, the economic developmentneeds that local authorities should be planning for within these FEMAs.
This consultation is on the Draft FEMA study which presents a range of analysis and concludes that thereare three FEMAs operating across the Berkshire area (a Western, Central and Eastern FEMA). The draftreport includes an Executive Summary which provides an overview of the key findings and conclusions.The report can be downloaded here.
The draft study has focused on utilising existing evidence, data and information rather than undertakingany extensive primary research. It is based upon guidance from the Planning Practice Guidance (PPG) andfollows a methodology that was previously consulted on with wider stakeholders. It is important that thisassessment has been based upon robust and credible evidence, and is informed through consultations withkey stakeholders including neighbouring authorities and other bodies with an interest in economicdevelopment across the wider sub-region.
Evidence from this two part study will be used, alongside other economic evidence, to inform thepreparation of economic policies in each local authority’s future local plan process(s) as well as othereconomic development work within and between the local authorities, and the work of the TVBLEP. Thispiece of work reflects the recognition that the geographical extent of local economies do not necessarilyadhere to administrative boundaries, alongside the requirement set out in the PPG for local authorities toconsider their economic needs in relation to FEMAs.
The study represents early stage technical analysis and there will be further work to do on specific tasksand topics in due course. It should be noted that a Strategic Housing Market Assessment (SHMA) is beingconcluded on behalf of the six local authorities in Berkshire and the TVBLEP. Whilst the emerging findingsfrom the SHMA have fed into this work, it does not form part of this FEMA study.
Introduction
Berkshire Functional Economic Market Area Study – Draft Report Consultation

We are inviting your feedback and comments on the draft Functional Economic Market Areas study andwould be grateful if you could complete this short survey by Friday 11th December 2015.
If you have any queries about this survey, or would like more information about the study, please contactCaroline Perkins at TVBLEP on 0118 945 0201 or [email protected]. The second partof the study will comprise an Economic Development Needs Assessment (EDNA) for each of the FEMAsidentified through part one, and will commence in the New Year.

Survey Participants
Berkshire Functional Economic Market Area Study – Draft Report Consultation
Name
Organisation
Email Address
Phone Number
1. Please provide your details below so that we can better understand the context of your feedbackand comments.
This page provides an opportunity to comment on the analysis undertaken in Section 2.0 of the draft study.Please refer to specific paragraph numbers where relevant.
Section 2.0: Economic Context and Trends
Berkshire Functional Economic Market Area Study – Draft Report Consultation
2. Do you have any comments regarding the analysis of economic conditions and trends inBerkshire and the surrounding area as set out in Section 2.0?
3. Do you have any comments regarding the analysis of the labour market context for Berkshireand the surrounding area as set out in Section 2.0?
4. Do you have any comments regarding the analysis of business demography and enterprise inBerkshire and the surrounding area as set out in Section 2.0?
This page provides an opportunity to comment on the analysis undertaken in Section 3.0 of the draft study.Please refer to specific paragraph numbers where relevant.
Section 3.0: Functional Labour Market Areas
Berkshire Functional Economic Market Area Study – Draft Report Consultation
5. Do you have any comments regarding the analysis of functional labour market areas forBerkshire and the surrounding area as set out in Section 3.0?
This page provides an opportunity to comment on the analysis undertaken in Section 4.0 of the draft study.Please refer to specific paragraph numbers where relevant.
Section 4.0: Housing Market Areas
Berkshire Functional Economic Market Area Study – Draft Report Consultation
6. Do you have any comments regarding the analysis of housing market areas for Berkshire and thesurrounding area as set out in Section 4.0?

This page provides an opportunity to comment on the analysis undertaken in Section 5.0 of the draft study.Please refer to specific paragraph numbers where relevant.
Section 5.0: Functional Commercial Property Market Areas
Berkshire Functional Economic Market Area Study – Draft Report Consultation
7. Do you have any comments regarding the analysis of commercial property market areas forBerkshire and the surrounding area as set out in Section 5.0?
This page provides an opportunity to comment on the analysis undertaken in Section 6.0 of the draft study.Please refer to specific paragraph numbers where relevant.
Section 6.0: Other Functional Economic Market Factors
Berkshire Functional Economic Market Area Study – Draft Report Consultation
8. Do you have any comments regarding the analysis of demographic trends for Berkshire and thesurrounding area as set out in Section 6.0?
9. Do you have any comments regarding the analysis of retail and consumer market areas forBerkshire and the surrounding area as set out in Section 6.0?
10. Do you have any comments regarding the analysis of transport and connectivity for Berkshireand the surrounding area as set out in Section 6.0?
This page provides an opportunity to comment on the overall conclusions set out in Section 7.0, as well asto provide any other comments regarding the draft study. Please refer to specific paragraph numbers whererelevant.
Section 7.0: Overall Conclusions
Berkshire Functional Economic Market Area Study – Draft Report Consultation
11. Do you have any comments about the overall conclusions and recommendations regarding theFunctional Economic Market Areas that operate across the Berkshire sub-region as set out inSection 7.0?
12. Do you have any other comments regarding the analysis undertaken for the draft BerkshireFunctional Economic Market Area Study?
Thank you for taking the time to provide your feedback and comments.
Thank You
Berkshire Functional Economic Market Area Study – Draft Report Consultation
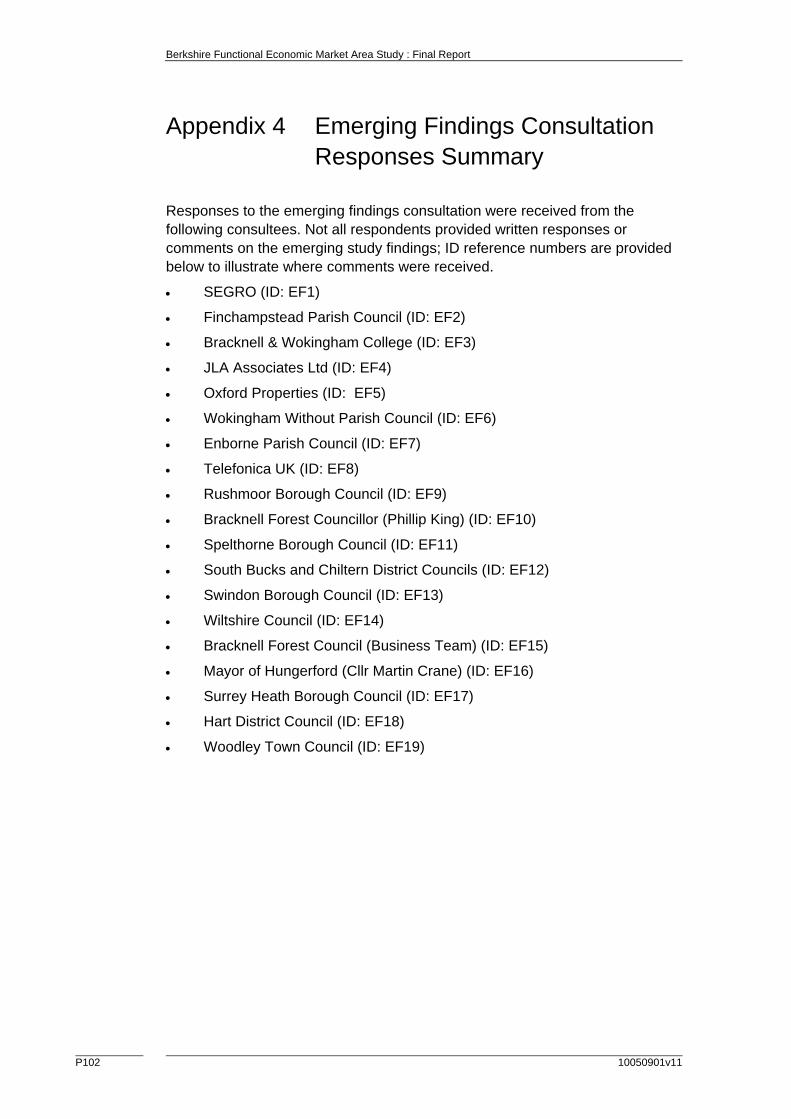
Berkshire Functional Economic Market Area Study : Final Report
P102 10050901v11
Appendix 4 Emerging Findings Consultation Responses Summary
Responses to the emerging findings consultation were received from the following consultees. Not all respondents provided written responses or comments on the emerging study findings; ID reference numbers are provided below to illustrate where comments were received.
SEGRO (ID: EF1)
Finchampstead Parish Council (ID: EF2)
Bracknell & Wokingham College (ID: EF3)
JLA Associates Ltd (ID: EF4)
Oxford Properties (ID: EF5)
Wokingham Without Parish Council (ID: EF6)
Enborne Parish Council (ID: EF7)
Telefonica UK (ID: EF8)
Rushmoor Borough Council (ID: EF9)
Bracknell Forest Councillor (Phillip King) (ID: EF10)
Spelthorne Borough Council (ID: EF11)
South Bucks and Chiltern District Councils (ID: EF12)
Swindon Borough Council (ID: EF13)
Wiltshire Council (ID: EF14)
Bracknell Forest Council (Business Team) (ID: EF15)
Mayor of Hungerford (Cllr Martin Crane) (ID: EF16)
Surrey Heath Borough Council (ID: EF17)
Hart District Council (ID: EF18)
Woodley Town Council (ID: EF19)

Berkshire Functional Economic Market Area Study : Final Report
10050901v11 P103
Consultation Response ID Ref NLP Comments/Response
Section 2.0: Economic Context and Trends
2. Do you have any comments regarding the analysis of economic conditions and trends in Berkshire and the surrounding area as set out in Section 2.0?
Page 11, point 2.19. This statement lists some well-established corporate digital technology companies. Firstly, I suggest adding key organisations such as Dell, Panasonic or Micron. Secondly, this element should illustrate where the companies originate as it will help the reader gain context.
EF15 References added
3. Do you have any comments regarding the analysis of the labour market context for Berkshire and the surrounding area as set out in Section 2.0?
Further analysis would be of benefit. For instance, birth rates, death rates and general growth figures.
EF15 These indicators are less relevant in labour market terms
4. Do you have any comments regarding the analysis of business demography and enterprise in Berkshire and the surrounding area as set out in Section 2.0?
I see that the fact that Tourism has already been mentioned as an 'industry ' that has been singularly omitted though I suspect that some of the Accommodation and food services line has a bearing on this sector. However the geographical area of North Wessex Downs [AONB} of which Hungerford is marketed as The Heart of the NWD has some spectacular sites that attract a large number of visitors viz Avebury. Plus the Kennet and Avon Canal running through. It is Hungerford's intention to convert many of the current visitors to our town into Tourists spending more time exploring the region. A recent plan to develop the A4 as a Tourist Route from Hungerford to Bath has the support of those towns on the route and is currently being developed with the help of Visit Wiltshire. At the Eastern end of Berkshire, the RBWM has an even greater claim to the huge input to their economy by Tourism and thus surely there should a greater element of this sector in the Report.
EF16
The ‘accommodation and food services’ and ‘recreation’ sectors both comprise tourism related activity, and have been analysed as part of the study
Section 3.0: Functional Labour Market Areas
5. Do you have any comments regarding the analysis of functional labour market areas for Berkshire and the surrounding area as set out in Section 3.0?
The assessment of TTWA data in this report supports the findings of the Spelthorne FEMA, which is currently being produced, in that Spelthorne and Berkshire do have some low-level linkages however the links are not strong enough to warrant being in the same FEMA.
EF11 n/a
Section 4.0: Housing Market Areas
6. Do you have any comments regarding the analysis of housing market areas for Berkshire and the surrounding area as set out in Section 4.0?
Paragraph 4.1 states that 65% of all households contain people who work- a reference to where this figure was obtained may be helpful.
There appear to be insignificant links between Berkshire and Spelthorne in terms of housing markets. This is consistent with the findings from the Spelthorne/ Runnymede SHMA, which shows greater links with areas such as Hounslow, Elmbridge and Woking. Further links are likely to exist with authorities in
EF11
Reference/source added to clarify
n/a

Berkshire Functional Economic Market Area Study : Final Report
P104 10050901v11
Consultation Response ID Ref NLP Comments/Response
neighbouring HMAs, although these are likely to be less of an influence on the Spelthorne/ Runnymede HMA.
Paragraph 4.31 refers to the final Spelthorne/ Runnymede SHMA report; however reference 23 makes reference to the final 'draft' report.
Reference amended
Yes. This housing market area appears to be inflated due to the attractiveness of Berkshire. Maybe to take the heat out of our local economy we need to downgrade this attractiveness.
EF4
Information on housing market areas presented in the report simply summarises existing SHMA evidence
Section 5.0: Functional Commercial Property Market Areas
7. Do you have any comments regarding the analysis of commercial property market areas for Berkshire and the surrounding area as set out in Section 5.0?
Paragraph 5.76- refers to Spelthorne Economy and Employment Land Study 2006- could refer to the more recent Local Economic Assessment September 2013.
The Spelthorne FEMA, which is currently being produced, concurs with the findings of the Berkshire FEMA in that this report has also concluded that Berkshire and Spelthorne do not sit within the same commercial property area.
EF11 Reference to the 2013 Local Economic Assessment has been added
Page 46, the title needs changing as it reads “floorspace in Bracknell Forest”, where it is actually Berkshire. Also on the figure, clarification needs to be given around what a business unit is, compared to office.
EF15 Title changed, and reference to business units added
Figure 5.2 on page 60 identifies the key (commercial) property markets; with the identification of a Western Thames Property Market stretching from Newbury to (and Including) Swindon. Clearly this in the context of Berkshire and does not recognise the wider Property Market Area centred on Swindon, which of course will come out of our FEMA work. If the explanatory text could be amended to avoid any misunderstanding we would be most grateful.
EF13/ EF14
Additional text has been added to clarify
Section 6.0: Other Functional Economic Market Factors
8. Do you have any comments regarding the analysis of demographic trends for Berkshire and the surrounding area as set out in Section 6.0?
No comments received
9. Do you have any comments regarding the analysis of retail and consumer market areas for Berkshire and the surrounding area as set out in Section 6.0?
The emerging Spelthorne FEMA notes that Spelthorne's retail catchment stretches to a number of local authorities, including Windsor & Maidenhead, however links to all but Runnymede were found to be relatively weak.
It may be helpful to provide reference to the main cultural facilities in Berkshire.
EF11
References to some of Berkshire’s main cultural facilities have been added
Page 63, table 6.1 shows the town centre’s retail score based on investment and spend; this table should note how many town centres are being scored for comparative purposes.
Page 63, point 6.11, the section refers to another retail scoring model “Vitality Index” regarding retail. It would
EF15
Reference added
Unfortunately data is not available in a consistent format to enable this
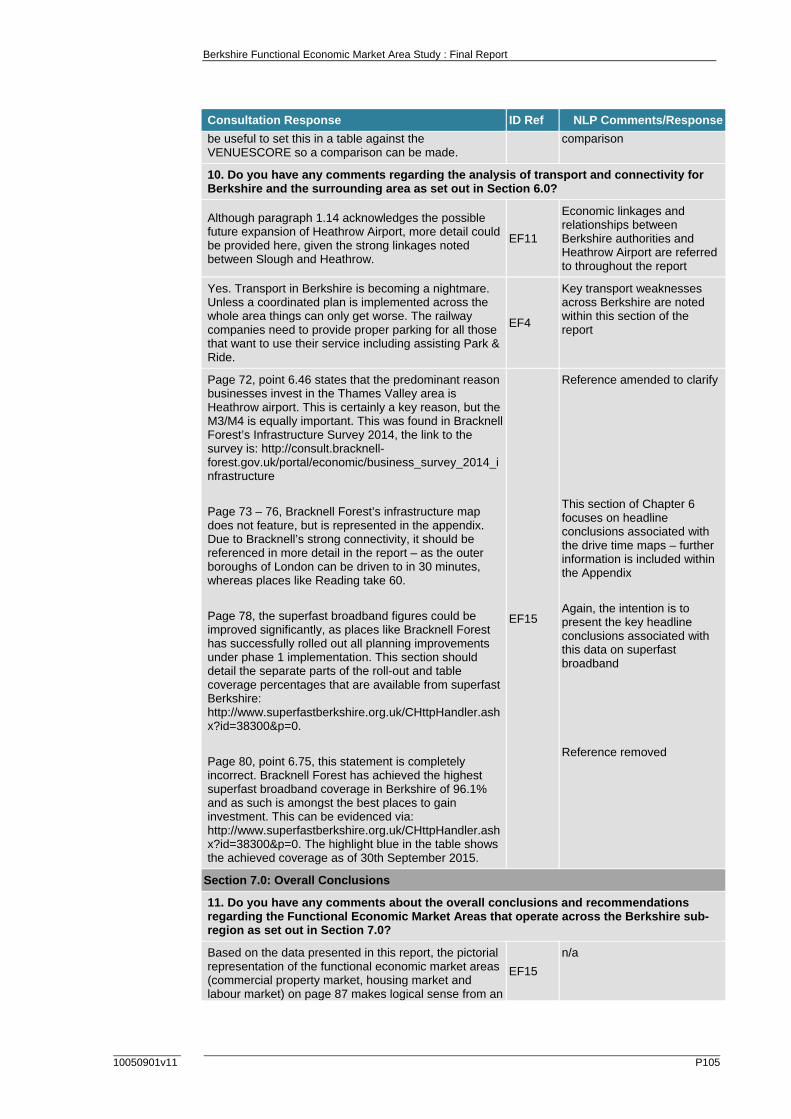
Berkshire Functional Economic Market Area Study : Final Report
10050901v11 P105
Consultation Response ID Ref NLP Comments/Response
be useful to set this in a table against the VENUESCORE so a comparison can be made.
comparison
10. Do you have any comments regarding the analysis of transport and connectivity for Berkshire and the surrounding area as set out in Section 6.0?
Although paragraph 1.14 acknowledges the possible future expansion of Heathrow Airport, more detail could be provided here, given the strong linkages noted between Slough and Heathrow.
EF11
Economic linkages and relationships between Berkshire authorities and Heathrow Airport are referred to throughout the report
Yes. Transport in Berkshire is becoming a nightmare. Unless a coordinated plan is implemented across the whole area things can only get worse. The railway companies need to provide proper parking for all those that want to use their service including assisting Park & Ride.
EF4
Key transport weaknesses across Berkshire are noted within this section of the report
Page 72, point 6.46 states that the predominant reason businesses invest in the Thames Valley area is Heathrow airport. This is certainly a key reason, but the M3/M4 is equally important. This was found in Bracknell Forest’s Infrastructure Survey 2014, the link to the survey is: http://consult.bracknell-forest.gov.uk/portal/economic/business_survey_2014_infrastructure
Page 73 – 76, Bracknell Forest’s infrastructure map does not feature, but is represented in the appendix. Due to Bracknell’s strong connectivity, it should be referenced in more detail in the report – as the outer boroughs of London can be driven to in 30 minutes, whereas places like Reading take 60.
Page 78, the superfast broadband figures could be improved significantly, as places like Bracknell Forest has successfully rolled out all planning improvements under phase 1 implementation. This section should detail the separate parts of the roll-out and table coverage percentages that are available from superfast Berkshire: http://www.superfastberkshire.org.uk/CHttpHandler.ashx?id=38300&p=0.
Page 80, point 6.75, this statement is completely incorrect. Bracknell Forest has achieved the highest superfast broadband coverage in Berkshire of 96.1% and as such is amongst the best places to gain investment. This can be evidenced via: http://www.superfastberkshire.org.uk/CHttpHandler.ashx?id=38300&p=0. The highlight blue in the table shows the achieved coverage as of 30th September 2015.
EF15
Reference amended to clarify
This section of Chapter 6 focuses on headline conclusions associated with the drive time maps – further information is included within the Appendix
Again, the intention is to present the key headline conclusions associated with this data on superfast broadband
Reference removed
Section 7.0: Overall Conclusions
11. Do you have any comments about the overall conclusions and recommendations regarding the Functional Economic Market Areas that operate across the Berkshire sub-region as set out in Section 7.0?
Based on the data presented in this report, the pictorial representation of the functional economic market areas (commercial property market, housing market and labour market) on page 87 makes logical sense from an
EF15
n/a
Berkshire Functional Economic Market Area Study : Final Report
P106 10050901v11
Consultation Response ID Ref NLP Comments/Response
economic development perspective.
Page 88 needs a greater emphasis and greater recognition that “best fit” FEMAs are not ideal. As shown on Page 89, Bracknell Forest’s connection with West Berkshire is not shown, even though the connections are high on the previous page. It would be useful to explain that even though “best fit” FEMAs support planning policy, they should not neglect areas with high connections outside of them.
Page 89 shows the “best fit” functional economic market areas, one of which is the Central Berkshire FEMA, which includes Bracknell Forest, Reading, Wokingham, and Windsor and Maidenhead. However, the Eastern Berkshire FEMA also includes Windsor and Maidenhead. Based on the data, there are clear connections to both, though by employing common sense with the intention of simplifying future planning policies, the conclusion should be that Windsor and Maidenhead is placed within one “best fit” FEMA
This point is already noted at the end of Chapter 7.0.
Windsor and Maidenhead has been included within two FEMAs (Central and Eastern Berkshire) due to the varied characteristics and economic role associated with different parts of the Borough. The Borough’s position within two FEMAs reflects the equally strong relationships that Windsor & Maidenhead exhibits with both more central parts of Berkshire as well as areas within South Bucks – it is therefore not possible in evidence base terms to place it in one FEMA only
12. Do you have any other comments regarding the analysis undertaken for the draft Berkshire Functional Economic Market Area Study?
Appendix 5 provides a table noting the degree of relationships between various authorities. It would be useful to provide similar tables for Industrial Clusters and the Consumer/ Retail Market.
EF11
With regards to Industrial Clusters, these are included within the ‘commercial property markets’ degree of relationship table
Due to the overlapping and complex nature of the various consumer market areas operating across Berkshire, this analysis is most helpful for defining sub-market areas rather than overarching functional economic market areas in themselves. Based on the level of information available, it therefore not possible to provide a degree of relationship table for Consumer/ Retail Markets
The report is flawed in that its analysis should reflect better the reality of the functional market areas across Berkshire, not least by the work done by PWC in its Good Growth for Cities reports which consistently focus on the dynamic “Reading Bracknell urban/economic system. The FEMA is weakened by not addressing this evidence. Given the reality of this functional economic system, the report needs to lay the ground for more sophisticated policy-making, very likely to be more collaborative. Certainly, businesses do not recognise local authority boundaries for practical purposes and
EF15
Reference has been added to the PWC Good Growth for Cities report in Chapter 3 (Functional Labour Market Areas), although because the report does not present information and data consistently across the whole of Berkshire, it has not been referred to elsewhere within
Berkshire Functional Economic Market Area Study : Final Report
10050901v11 P107
Consultation Response ID Ref NLP Comments/Response
the FEMA report needs to acknowledge this ; the current draft has the potential to apply a crude geography to real conditions across Berkshire (and beyond).
the analysis
A number of images in the report are poor quality and are very hard to read; particularly images in section 6 are pixelated. If possible better copies of the images should be obtained to ensure the information can be demonstrated properly.
In relation to the FEMA maps, a reference should be added to the recent PWC Good growth for cities 2015 report http://www.pwc.co.uk/industries/government-public-sector/good-growth/good-growth-for-cities-our-report-on-economic-wellbeing-in-uk-urban-areas.html. This report states that Reading and Bracknell together are amongst the best performing cities in the UK in terms of income levels, affordable housing, people's work - life balance and the quality of transport. Furthermore, this report should be referenced in many other areas in the study as a good source of evidence.
EF15
These images have been taken from a variety of existing, published studies, and it is not always possible to obtain a high resolution version of these
Reference has been added to the PWC Good Growth for Cities report in Chapter 3 (Functional Labour Market Areas
An area that seems to have been overlooked in this study is the Equine Industry. This stretches from The valley of the Race Horse in Lambourn and across the County with major race courses in Windsor, Ascot and Newbury
EF16 References added to Section 2.0.

Berkshire Functional Economic Market Area Study : Final Report
P108 10050901v11
Appendix 5 VOA Floorspace Mapping
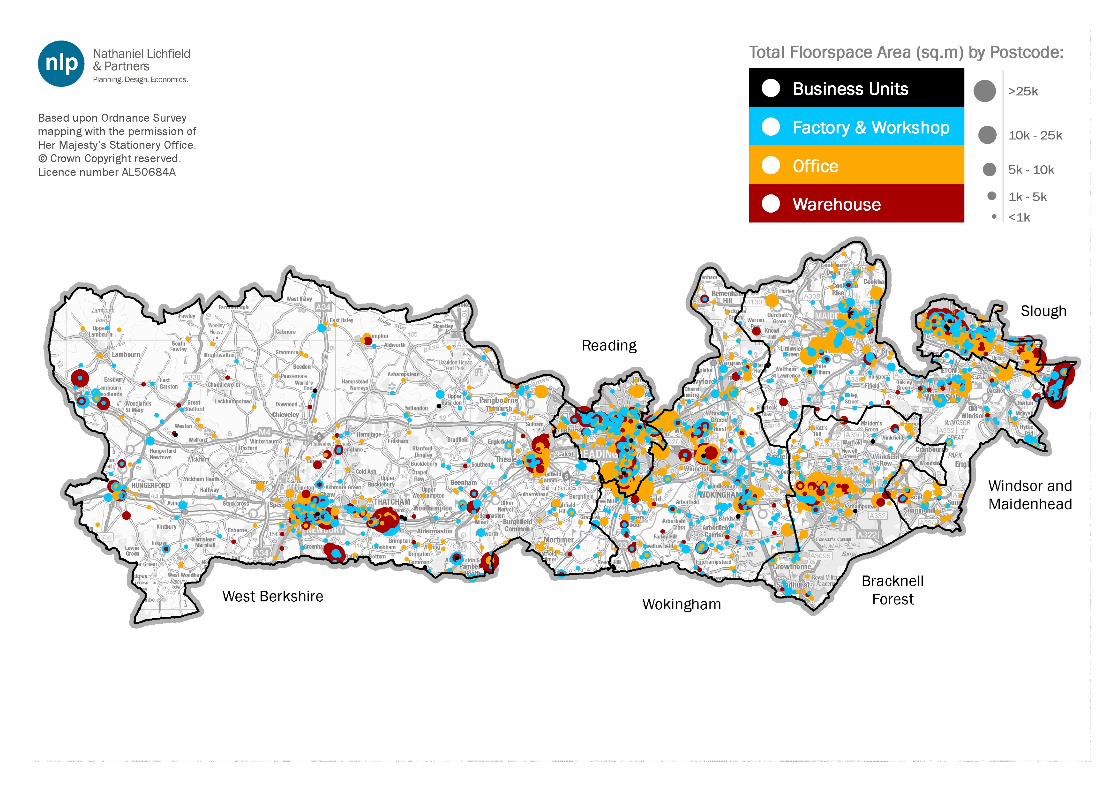

Berkshire Functional Economic Market Area Study : Final Report
10050901v11 P109
Appendix 6 Drive Time Maps
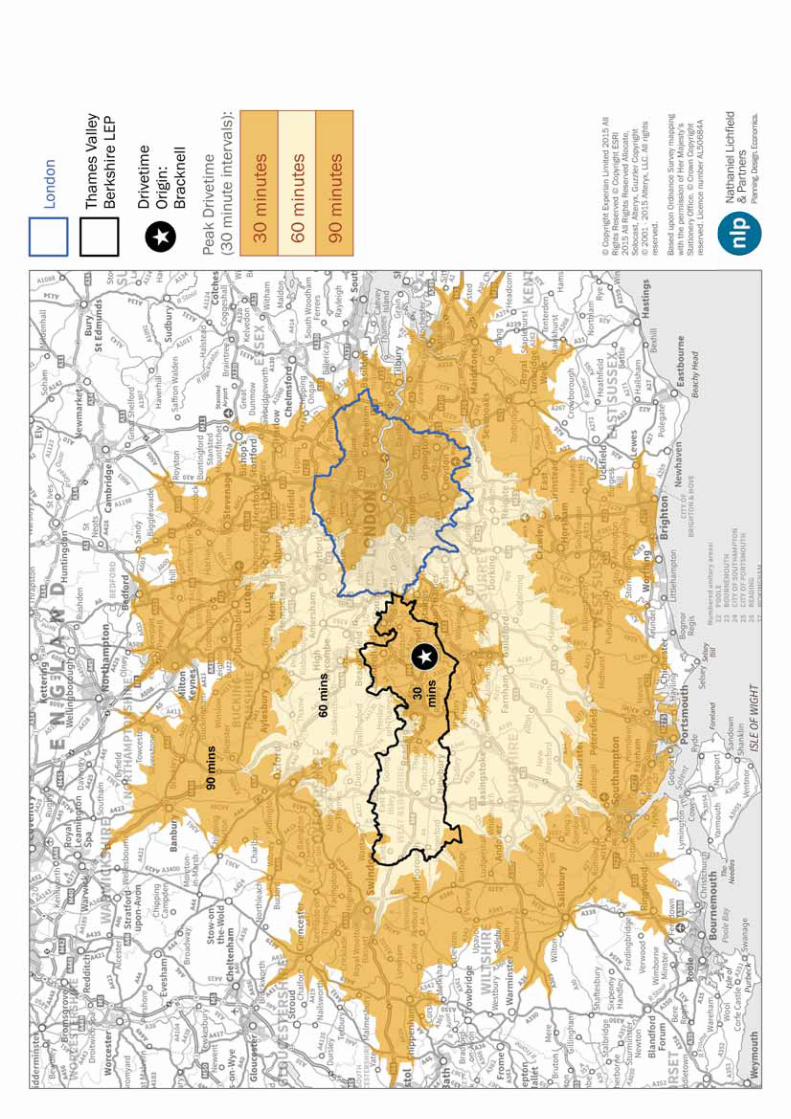
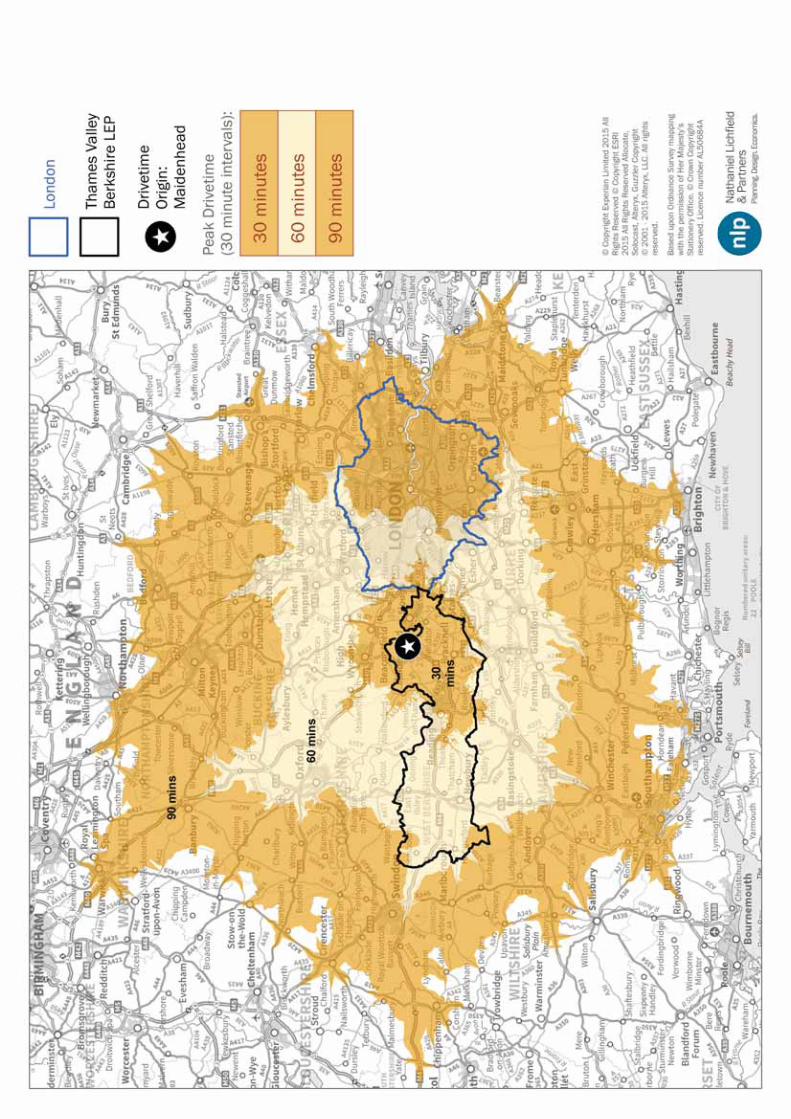
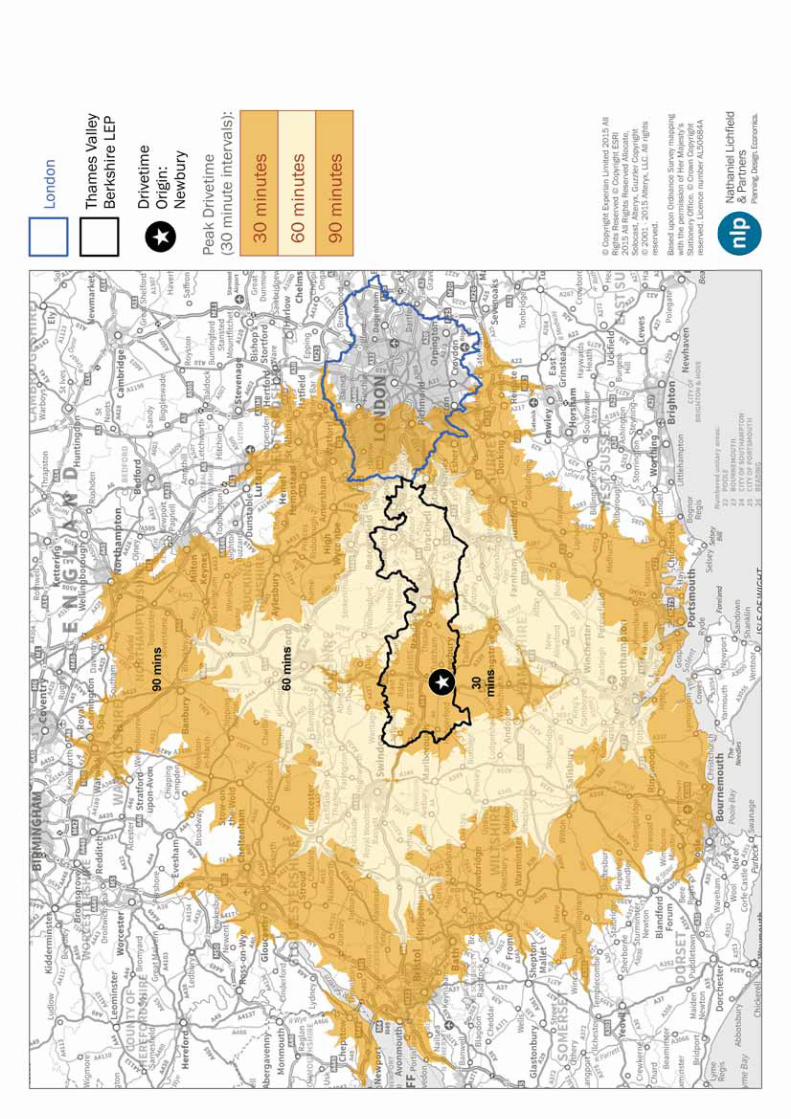
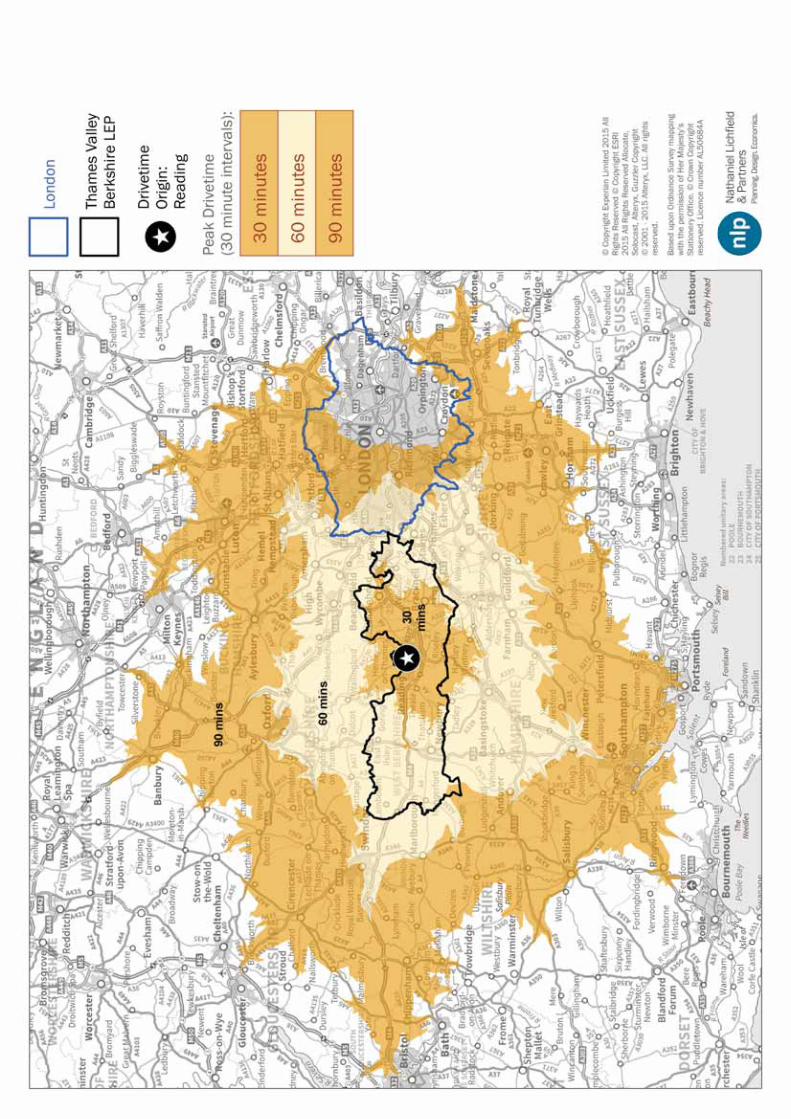
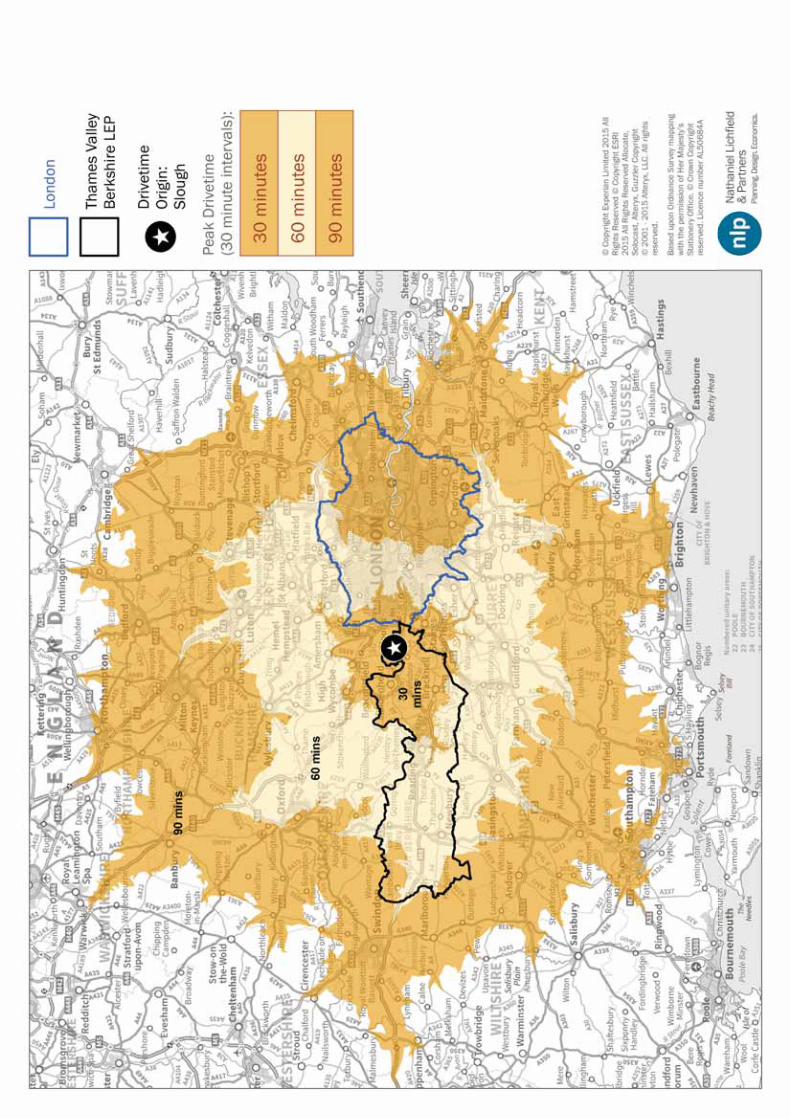
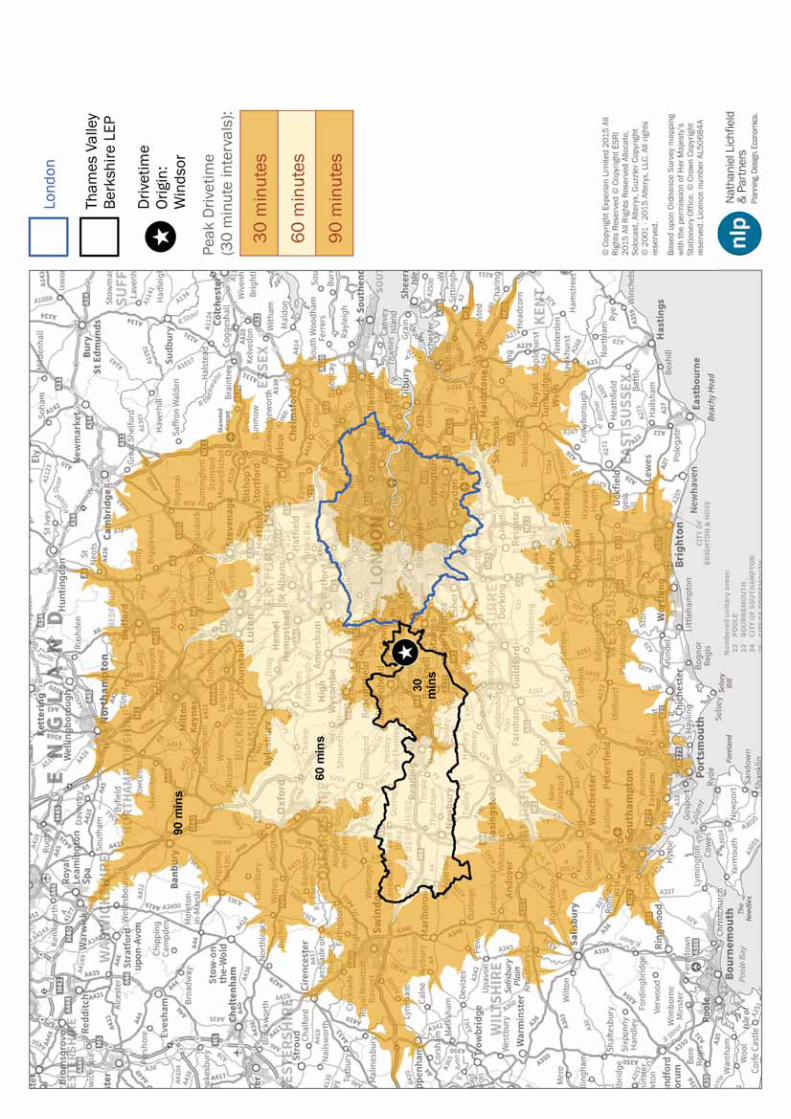

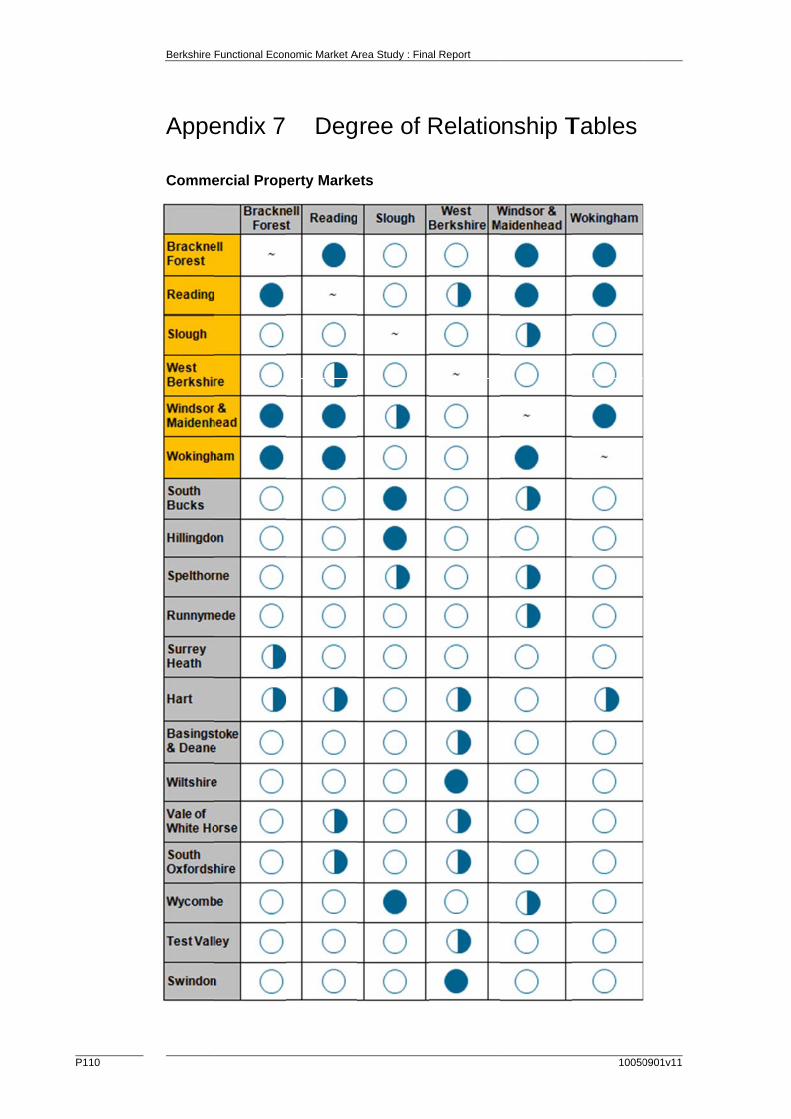
P110
Berkshire
Appe
Comme
Functional Econ
endix 7
ercial Prop
nomic Market A
Deg
perty Marke
Area Study : Fina
ree of R
ets
al Report
Relationship T
10050
Tables
0901v11
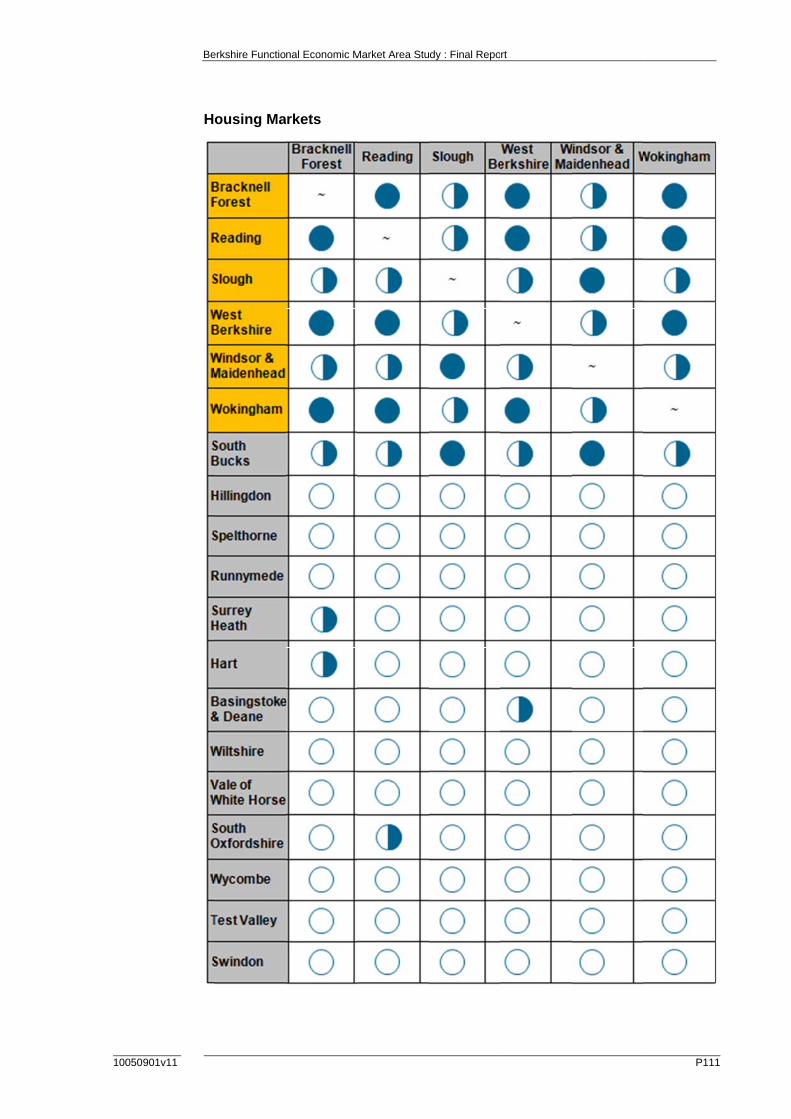
10050
Be
901v11
H
erkshire Functio
ousing Ma
nal Economic M
rkets
Market Area Study : Final Report
P111
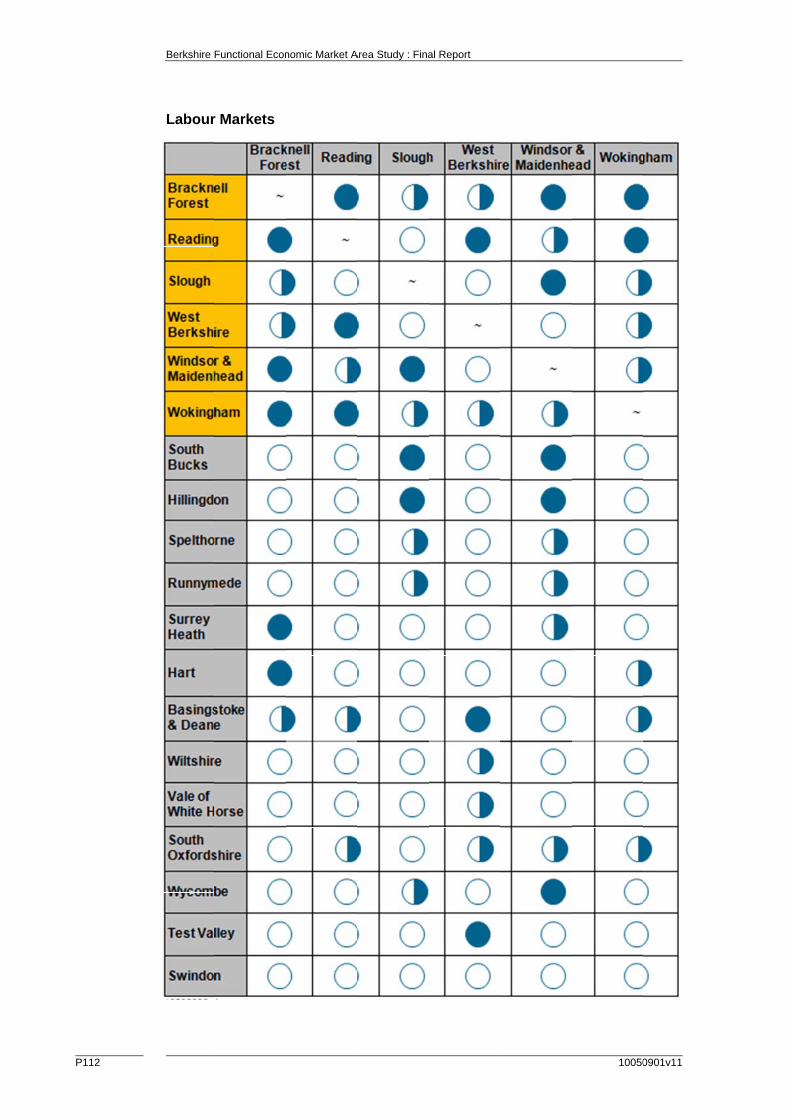
P112
Berkshire
Labour
Functional Econ
r Markets
nomic Market AArea Study : Finaal Report
100500901v11