Berkeley Soft Story Report Now Available! - Earthquake Engineering
92
oft Story Risk Reduction: Lessons from the Berkeley Data David Bonowitz, S.E. • Sharyl Rabinovici, Ph.D. January 2013 A Special Projects and Iniaves report to Earthquake Engineering Research Instute S
Transcript of Berkeley Soft Story Report Now Available! - Earthquake Engineering

oft Story Risk Reduction:Lessons from the
Berkeley Data
David Bonowitz, S.E. • Sharyl Rabinovici, Ph.D.
January 2013
A Special Projects and Initiatives report toEarthquake Engineering Research Institute
S

Soft Story Risk Reduction:Lessons from the
Berkeley Data
A Special Projects and Initiatives report to Earthquake Engineering Research Institute
January 2013
David Bonowitz, S.E.605A Baker Street
San Francisco, CA [email protected]
Sharyl Rabinovici, Ph.D.

2012 Earthquake Engineering Research Institute, Oakland, California 94612-1934. All rights reserved. No part of this publication may be reproduced in any form or by any means without the prior written permission of the publisher.
All opinions, findings, conclusions, or recommendations expressed in this report are the authors’ and do not necessarily reflect the views of EERI, the City of Berkeley, or other named organizations. While the information presented in this document is believed to be correct, neither the authors, nor EERI, nor any organization named or acknowledged, nor any of their officers, staff, or consultants make any warranty, expressed or implied, or assume any liability or responsibility for any use of this report’s opinions, findings, conclusions, or recommendations. The material presented in this report should not be relied upon for any specific application without competent review by qualified professionals. Users of this document assume all liability arising from their use.
ISBN: 978-1-932884-58-6
Earthquake Engineering Research Institute499 14th St., Suite 220Oakland, CA 94612-1934Tel (510) 451-0905Fax (510) 451-5411
Layout and Design: Rachel Beebe, Parse Editorial, parseeditorial.com

i
The authors gratefully acknowledge support from the EERI Endowment Fund and the Spe-cial Projects & Initiatives Committee. We also thank Joan MacQuarrie, former Building Of-ficial of the City of Berkeley, for making the evaluation reports available for our review. The Applied Technology Council made available a draft version of the FEMA P-807 technical criteria applied in Section 5, and Mike Korolyk of Tipping Mar Associates, Berkeley, helpfully reviewed some initial calculations. The Structural Engineers Association of Northern Cali-fornia’s Existing Buildings Committee, Marko Schotanus, Chair, provided valuable feedback on preliminary findings.
Acknowledgements

ii
Contents
Terminology 1
Executive Summary 4
1. Background 8
2. The Study 12
3. The Berkeley Buildings 16
4. Technical Aspects of the Berkeley Program 22
5. Building Evaluation 43
6. Lessons 67
References 73
Appendix A: Database of Approved Report Data 75

1
The Applied Technology Council project that produced FEMA P-807.
Demand capacity ratio. A measure of structural acceptability. A DCR greater than 1.0 usually indicates an unacceptable condi-tion.
The document produced by the ATC 71-1 project (FEMA, 2012). FEMA P-807 presents a new evaluation methodology that dif-fers from IEBC A4.
A document prepared by consultants to the city, titled “City of Berkeley Soft Story Seismic Engineering Evaluation report Framework” (Berkeley B&S, 2006). The Framework contained instructions and procedures for complying with the program, as well as code interpretations on technical issues.
Appendix Chapter A4 of the International Existing Building Code (ICC, 2003; 2012). The Berkeley ordinance cited the 2003 edition as the basis of its technical provisions (Berkeley, 2005). More recent programs cite either the 2012 edition or the ap-proved changes proposed by SEAOC and NCSEA in 2010 that would become the 2012 edition (Oakland, 2009; San Francisco DBI, 2010).
A calculable structural condition, one of three indicating a SWOF building. IEBC A4 defines an open front wall line as an “exterior wall line, without vertical elements of the lateral-force-resisting system, that requires tributary seismic forces to be resisted by diaphragm rotation or excessive cantilever ….” As written, the definition suggests that both conditions – “with-out [LFRS] elements” and “requir[ing] diaphragm rotation” – are necessary. The definition is problematic because of vary-ing ways of determining what counts as an LFRS element and because it appears to apply even if the necessary diaphragm rotation is minimal.
Probability of exceedance. In the FEMA P-807 context, POE means the “drift limit probability of exceedance” and refers to
Terminology
ATC 71-1
DCR
FEMA P-807
The Framework
IEBC A4
Open front
POE
This report assumes the following meanings for certain engineering and vernacular terms:

2
Soft Story Risk Reduction: Lessons from the Berkeley data
2
POE (cont.)
Soft story
Spectral acceleration capacity
SSR
SWOF
UBC
the probability of exceeding certain specified drift limits. See Section 5.2.
A calculable structural condition, one of three indicating a SWOF building. In a technical context, a soft story arises when the stiff-ness of one story is significantly less than the stiffness of the sto-ry above it; see SSR for the technical definition. In the building code for new construction, a soft story is an irregularity, allowed in some cases, and not necessarily a deficiency. In the ASCE 31 standard for seismic evaluation (ASCE, 2003), a soft story is a potential Life Safety deficiency. IEBC A4 defines the term “soft wall line” as any wall line that fails the chapter’s drift criteria or is in a soft story as defined by the building code.
Outside a technical context, “soft story” is also commonly used as a shorthand term for SWOF conditions generally, or for a class of buildings defined for purposes of a specific ordinance. For ex-ample, both the Berkeley and Oakland ordinances define or des-ignate certain buildings as “soft story buildings” based on their size, age, and occupancy (Berkeley, 2005, Section 19.39.040; Oakland, 2009). Berkeley’s designation relies also on technical judgments from a 1996 sidewalk survey. Oakland’s designation does not.
A term from FEMA P-807 referring to the generalized level of earthquake acceleration that a building can resist without hav-ing a certain probability of exceeding its drift limits. See Section 5.2.
Soft story ratio, used to determine the existence of a soft story. In the present context, SSR is the ratio of the first story stiffness to the second story stiffness, in a given direction of loading. In the building code, in ASCE 31 (ASCE, 2003), and in IEBC A4, a soft story exits where the SSR is less than 0.7, or 70%.
An acronym describing a building with a soft, weak, or open front condition. This is the more complete technical term used by both IEBC A4 and by the Berkeley ordinance (Berkeley, 2005), but frequently replaced by the vernacular term “soft story.”
Uniform Building Code (ICBO, 1997). The Berkeley ordinance cited the 2003 edition of IEBC A4, which (in Section A403.3) cites the UBC for purposes of setting seismic demands for retro-fit design or for calculation of DCR. The last edition of the UBC was 1997. In 2000, the UBC was replaced by the International Building Code (IBC), but California did not adopt that new model

3
Soft Story Risk Reduction: Lessons from the Berkeley data
3
Weak story
WSP
WSR
code until 2007, when the statewide building code referenced the 2006 IBC.
A calculable structural condition, one of three indicating a SWOF building. In a technical context, a weak story arises when the strength of one story is significantly less than the strength of the story above it; see WSR for the technical definition. FEMA P-807 uses the term more generally to indicate likely deficient performance related to but not necessarily caused by a weak story condition. In the building code for new construction, a weak story is an irregularity, allowed in some cases, and not necessarily a deficiency. In the ASCE 31 standard for seismic evaluation (ASCE, 2003), a weak story is a potential Life Safety deficiency. IEBC A4 defines the term “weak wall line” as any wall line in a weak story as defined by the building code.
Wood structural panel. This is the generic term for a plywood shear wall, made necessary by the fact that not all WSP walls are made from plywood.
Weak story ratio, used to determine the existence of a weak story. In the present context, WSR is the ratio of the first story strength to the second story strength, in a given direction of loading. In the building code, in ASCE 31 (ASCE, 2003), and in IEBC A4, a weak story exists where the WSR is less than 0.8, or 80%.

4
Soft Story Risk Reduction: Lessons from the Berkeley data
In 2005, the city of Berkeley, California began a mitigation program to address earthquake risks posed by certain residential buildings. The program required seismic evaluations of several hundred multi-unit woodframe buildings using specific engineering crite-ria. The targeted buildings had been pre-se-lected as “soft story” buildings based largely on their appearance. This report describes a study of the program’s technical findings, asking this question: How well do visible in-dicators of soft story deficiencies predict the results of detailed evaluations of those same suspect buildings?
In particular, the study hoped to derive a screening tool based on readily observable conditions. Such a tool would facilitate mitiga-tion programs for so-called SWOF (soft, weak, or open front) buildings in other jurisdictions. But we found that no such tool exists, in part because the reported Berkeley data was too inconsistent to support statistical correlations, and in part because the traditional engineering metric, the weak story ratio (WSR), is inherently flawed as a performance predictor. So while the initial goal could not be achieved, the study did make a number of useful findings that offer lessons to engineers and mitigation plan-ners.
Section 1 describes the Berkeley program and the engineering criteria specified for the mandated evaluations. Two points not-
Executive Summary
•
•
The buildings subject to the pro-gram were identified as potentially deficient through a series of visual exterior surveys focused on the pres-ence or absence of an “open front,” typically characterized by extensive first story windows, garage doors, or open-air spaces with little or no en-closing solid wall.
Appendix A4 of the 2003 Internation-al Existing Building Code (IEBC A4) was selected as evaluation criteria. IEBC A4 identifies deficient or risky conditions, in part using the ratio of
first-story-strength to second-story-strength, called the weak story ratio.
Ultimately, our study would show that both of these metrics are unreli-able, and possibly mis-leading, for purposes of vetting the subject buildings.
Section 2 describes the development and implementation of this study, and how its focus changed as we came to understand the reported data.
Section 3 describes the buildings in the Berkeley inventory and the robustness of the data they offer. (Appendix A shows a portion of the building database in tabular form.)
How well do visible in-dicators of soft story deficiencies predict the results of detailed evalu-ations of those same sus-pect buildings?
ed in Section 1 became significant as the analysis proceeded:

5
Soft Story Risk Reduction: Lessons from the Berkeley data
While 90 approved evaluation re-ports were reviewed, only 52 of the subject buildings were judged usable for an assessment of the IEBC A4 cri-teria.
Those 52 included a range of ages and a corresponding variety of struc-tural details. 39 of the buildings dated from the 1950s and 1960s and were judged comparable to each other for statistical purposes. The other 13 were older and structurally different. Most of this report deals with the 39 more recent buildings.
Even the 1950s-’60s buildings include significantly distinct subgroups. The main difference is in the structural material used to provide lateral resis-tance as shear wall sheathing. The 39 buildings comprise:
Twenty two-story buildings, almost all of which have stucco perimeter shear walls and no wood structural panel shear walls.
Nineteen three-story build-ings, almost all of which have wood structural panel shear walls.
o
o
Section 4 reviews how the individual Berke-ley engineers and the city’s consultants implemented the technical requirements of the program. Most of this section is dedi-cated to a detailed breakdown of the 39 reports on 1950s-’60s buildings, prompt-ed by observations made during data en-try. We found several inconsistencies (and some errors) in the way the reports ap-plied the IEBC A4 criteria, and we recog-nized that these would affect any statistical analysis. The evaluating engineers made a variety of simplifications and assumptions.
Many were reasonable, even necessary, but the variation between reports reduced the comparability of the data. The reports calculated seismic demand inconsistently, affecting the reported demand capacity ratios (DCRs), one of the key metrics for each evaluation. The reports were even less consistent in how they calculated the struc-tural capacity of existing materials and wall lines; this affected both the DCR calcula-tions and the WSR calculations. Section 4.1 breaks down the report data to study these effects. Section 4.1.3 shows that different assumptions by different engineers, all of which were approved by a plan checker, led to opposite conclusions for essentially identical buildings.
Section 5 presents our analysis of the re-ported data and what it indicates about the expected performance of Berkeley’s 1950s-’60s buildings. Section 5.1 briefly reports the correlations envisioned by the study’s initial objective and concludes, for reasons discussed in Section 4, that no pre-dictive relationship exists between pre-sumed SWOF indicators and IEBC A4 evalu-
ation results. Section 5.2 then presents the findings of an alternative analysis. Since the approved reports could not provide consistent, robust data, we generated new data for a series of case study buildings us-ing a new engineering tool known as FEMA P-807. FEMA P-807 was developed specifi-
•
•
•
Different assumptions by dif-ferent engineers, all of which were approved by a plan checker, led to opposite con-clusions for essentially identi-cal buildings.

6
Soft Story Risk Reduction: Lessons from the Berkeley data
•
cally to guide the evaluation and retrofit of woodframe residential buildings. It avoids many of the problems the Berkeley engi-neers encountered doing evaluations with IEBC A4 (which, after all, is primarily a ret-rofit code, not an evaluation tool).
Section 5.2 includes case studies of five typical buildings from the Berkeley inventory, as well as hypothetical variations designed to study the significance of traditional assump-tions and IEBC A4 cri-teria. The case studies illustrate two main points that explain why no simple screen-ing tool can be derived from the reported data:
• A visible open front is not always a deficiency. Screening that relies too heavily on the look of an open front can therefore lead to both false posi-tives and false negatives. A false posi-tive is likely when the open front is along the short side at one end of a building. If the back wall of the open area is adequate, then the open front is not an issue, and the building might have acceptable soft and weak story ratios. If the critical wall is not ade-quate, however, the building will still be deficient, but the deficiency will be due to a simple lack of strength unrelated to SWOF conditions. A similar building without a visibly ob-vious open front might be just as vul-nerable, but it would be missed by a screening that looks for open fronts; hence, a false negative.
A low weak story ratio indicates a traditional irregularity, but it is not a
useful predictor of real deficiencies. Since the WSR merely compares the first story strength to the second sto-ry strength, it is little affected by the absolute strength or ductility of the materials, and therefore cannot dis-
tinguish a strong build-ing with wood shear walls from a weak one with only stucco sheathing.
Taken together, the les-son of these two points is that the strength of the first story walls, which is largely a func-tion of whether they include wood sheath-ing, is far more signifi-
cant to a building’s performance than ei-ther its observable openness or the relative strength of its first and second stories.
Finally, Section 6 reviews the main find-ings of Sections 4 and 5 and derives lessons for mitigation programs. The three main points, in brief:
First, conventional engineering practice, even if guided by a common code document, can lead to significantly different conclu-sions for nearly identical buildings. The vari-ability of engineering practice was not an intended topic of this study. Indeed, the ob-served variations made statistical analysis and comparison of the Berkeley data more difficult and limited its utility. Still, the fact that (often reasonable) variations in practice can lead to essentially opposite conclusions is compelling. This finding points to the need for mitigation programs to select appropri-ate technical criteria and to provide thor-ough quality assurance. In particular, codes or standards intended to guide retrofit de-sign often fail to address some issues that affect evaluation. A pilot program within a
The strength of the first story walls is far more sig-nificant to a building’s per-formance than either its observable openness or the relative strength of its first and second stories.

7
Soft Story Risk Reduction: Lessons from the Berkeley data
larger mitigation program might help reveal flaws before they might otherwise skew hun-dreds of evaluations. Review for consistency, as opposed to just review of the reasonable-ness of an individual engineers’ judgment, is especially important where the jurisdiction intends to use the findings of an evaluation program to guide policy decisions about mit-igation or emergency response.
Second, an open front condition, especially along the short side of an elongated plan, does not meaningfully predict a critical weak story irregularity or deficiency. Engineers should therefore be careful about reaching conclusions based on the look or layout of a building and should put more emphasis on investigation to confirm the materials and quality of construction, especially at criti-cal non-open wall lines. In addition, mitiga-tion programs should not screen, target, or exempt buildings based primarily on the presence of an open parking area or exten-sive openings in first story walls. Those in-dicators are perhaps still useful for making broad estimates on a citywide level, but they say little about the likelihood of unaccept-able performance in a specific building. In-stead, mitigation programs should cast wide nets based on occupancy or other non-engi-neering factors and require at least a confir-mation of construction type before granting exemptions.
Third, the weak story ratio, a traditional measure of irregularity, does not meaning-fully distinguish acceptable buildings from more likely collapse risks. While it will prob-ably remain in the code for new construction as a trigger for more careful analysis, engi-neers doing evaluations should not neces-sarily treat low WSR values as concerning and certainly should not regard high WSR values as reassuring. For mitigation plan-ners, this means, again, that criteria and quality assurance appropriate to the evalu-
ation task, as opposed to rules of thumb for new construction, should be applied.
This study of Berkeley’s mitigation program for woodframe residential buildings began with the goal of deriving a screening tool based on readily observable conditions. It concludes that no such tool yet exists, though not for the reasons one might ex-pect. The problem is not that the buildings have no characteristic features or measur-able deficiencies. Rather, our conventional tools and tactics appear to be focusing on the wrong ones. Neither the observable conditions Berkeley used to create its in-ventory, nor the engineering metrics the building code uses to gauge deficiencies are meaningful in a consistent and useful way. Therefore, if a screening tool is to be de-veloped, it will have to link different attri-butes to different metrics – attributes such as sheathing type, as opposed to visible open fronts, and metrics such as absolute strength, as opposed to relative strength or stiffness.
Meanwhile, mitigation programs can pro-ceed with a clearer understanding of what actually makes a building vulnerable or de-ficient, using that understanding to develop appropriate program scopes, engineering criteria, and quality assurance procedures.

8
1. Background1.1 The soft story problemSoft story buildings comprise one of Cali-fornia’s most serious earthquake risks. De-signed before recent building codes quan-tified certain structural deficiencies, these woodframe buildings with relatively open first stories have been performing poorly since at least the 1971 San Fernando earth-quake, as shown in Figure 1-1.
Figure 1-1 Earthquake damage to 1950s-’60s era soft story buildings. Top: Near-collapse, 1971 San Fernando earthquake. Bottom: Collapse, 1994 Northridge earthquake. (National Information Ser-vice for Earthquake Engineering, EERC, University of California, Berkeley).
The term “soft story” refers to the effect, in a multi-story building, of having a ground floor use, such as parking or retail, that leads to a
relatively soft or weak structural system in the first story. Garage doors or storefront windows replace perimeter walls; open parking stalls or shopping areas replace the dense grid of in-terior partitions typical of residential units. But “soft story” is just a term of convenience. The actual structural deficiencies that lead to earthquake damage, and sometimes collapse, involve a combination of inadequately stiff walls, weak walls, open wall lines, and unbal-anced wall layouts. These are known collec-tively as SWOF conditions, for “soft, weak, or open front.” (See the Terminology section for additional discussion.)
Any structure type can have a SWOF defi-ciency. Commonly, however, the soft story or SWOF designation refers to multi-story, woodframe, multi-unit residential build-ings. The California Emergency Management Agency estimates that about 46,000 buildings of this type remain in the state’s high seismicity regions (CalEMA, 2010, Chapter 5), and state law recognizes them as deserving of special at-tention in local hazard mitigation plans (Cali-fornia Government Code, Section 65302.6).
In addition to posing an obvious safety risk, these buildings can have disproportionate im-pacts on a city’s housing stock. SWOF buildings accounted for about 7,700 of the 16,000 hous-ing units made uninhabitable by the Loma Prie-ta earthquake and over 34,000 of those vacated after the Northridge earthquake (ABAG, 2003). The Association of Bay Area Governments esti-mates that SWOF buildings will account for two thirds of all the units expected to be uninhabit-able after a major Hayward fault event (ABAG, 2003). Indeed, concerns about potential hous-ing loss and community recovery are driving current programs and proposals to evaluate or retrofit SWOF buildings in San Francisco, Oak-

9
Soft Story Risk Reduction: Lessons from the Berkeley data
land, and other California jurisdictions (ABAG, 2009; CalEMA, 2010; SPUR, 2012). But in the Bay Area, the city of Berkeley took the lead in 2005. This study reviews the data amassed by the Berkeley program.
1.2 The Berkeley programIn 2005, the Berkeley City Council amend-ed its Municipal Code to establish an “in-ventory of potentially hazardous buildings containing soft, weak, or open front sto-ries” and to require the owners of those buildings to submit seismic evaluation re-ports (Berkeley, 2005). Table 1-1 (right)lists some milestones in the development of the ordinance and implementation of the resulting evaluation program. Techni-cal aspects of the program relevant to this study are discussed in detail in Section 3. Rabinovici (2012) gives a full history and policy analysis of the Berkeley ordinance and program.
1.3 Building codes and standardsUsing the authorization afforded by As-sembly Bill 304 (see Table 1-1), Berkeley adopted Appendix A4 of the 2003 Interna-tional Existing Building Code (IEBC A4) as the technical basis for the mandatory evalu-ations. Features of IEBC A4 and its imple-mentation through the program are dis-cussed in detail in Sections 3 and 4 of this report. As background, however, it may be useful to note how seismic evaluation and retrofit criteria fit within the broader con-text of local and statewide building codes.
Every local jurisdiction in California en-forces the California Building Code (CBC). A jurisdiction has the option to modify the code to suit local conditions, but the process can be onerous, and only the largest juris-dictions have the resources to develop and
maintain customized provisions. Since 2007, the CBC has been based on a national model code called the International Building Code (IBC). The IEBC is part of the same family of model codes as the IBC, but California does not adopt the IEBC for general use.
The CBC, like the IBC it is based on, is almost entirely devoted to the design and con-struction of new buildings. Since California does not adopt the IEBC, the CBC’s rather basic regulations for existing buildings un-dergoing alterations, repairs, changes in use, etc. are given in a single chapter (CBSC, 2010, Chapter 34). Even there, seismic improvements to privately owned build-ings such as apartment houses are trig-gered only in rare cases. As a result, once a building is designed and constructed, it is permitted for its original use indefinitely. As the code’s seismic provisions change, often in response to earthquakes around the world, existing buildings are not re-quired to change with them. The exceptions to this rule are typically implemented not through the building code but through leg-islation that targets specific risks. Examples in California include local retrofit mandates for unreinforced masonry buildings, which have a long history of killing people as they shake apart, and a statewide retrofit man-date for hospitals, which are expected to be operational as soon as the shaking stops.
Meanwhile, building owners who are not mandated to make seismic improvements have sometimes done so voluntarily, either through self-interest or in response to de-mands (or incentives) from tenants, lenders, or insurers. Seismic evaluation and retrofit tools have developed to serve this market, ranging from comprehensive national stan-dards to do-it-yourself plan sets. Upgrade triggers in the building code, legislative man-dates, and local incentive programs now ref-erence these tools as well, though most were

10
Soft Story Risk Reduction: Lessons from the Berkeley data
Table 1-1 Milestones in the development of the Berkeley Soft Story Program
1996 Berkeley Building Official Reggie Meigs hires Jim Russell to create a list of poten-tial SWOF buildings using city data and visual survey. Approximately 400 build-ings are listed.
2000 - 2001 Student interns correct and update the list. Professional and student volunteers conduct visual assessment of 150 listed properties in a “walkabout” exercise.
2001 - 2004 City staff (Building Official Joan MacQuarrie, Dan Lambert, and Arrietta Chakos) work with the city’s planning department, rent board, commissions, and external stakeholders to develop a policy around the 1996 list. The policy evolves from mandatory retrofit to a two-phase approach: evaluation, then retrofit.
Feb 2005 Mayor Tom Bates hosts a community forum to present and discuss the issues and the proposed evaluation program.
Oct 2005 Berkeley City Council passes the soft story ordinance, requiring the Building Of-ficial to maintain an inventory and owners to submit evaluation reports.
Nov 2005 The California legislature passes Assembly Bill 304, sponsored by Berkeley’s As-semblymember and former mayor, Loni Hancock, authorizing local jurisdictions to adopt consensus national codes, such as International Existing Building Code Appendix Chapter A4, for use in mitigation programs, even if those codes are not part of the state building code.
Dec 2005 The city engages Ficcadenti Waggoner & Castle to develop the “Framework” docu-ment to provide procedural instructions and engineering guidance to program participants. The city hires Bureau Veritas to review submitted reports.
2006 The building department notifies owners of 321 listed properties. The city holds two training sessions for engineers. Berkeley Property Owner’s Association hosts evening workshops for owners.
2007 Bureau Veritas is bought, causing disruption in the review process.Oct 2008 The initial compliance period ends.Apr 2009 The city sends the first wave of non-compliance letters.
originally developed for voluntary use.
IEBC A4 is one of five IEBC appendix chap-ters dedicated to seismic retrofit of specific building types. The point of these chapters is to provide (relatively) simple, effective, and prescriptive methods to address com-mon seismic deficiencies. By covering a single building type with a single dominant deficiency, each IEBC chapter can address issues that are important when working with existing buildings but are not covered in the code for new construction, while at the same time avoiding the complexity of a comprehensive national standard. Re-
sponding to Northridge earthquake dam-age, engineers in Southern California devel-oped the first versions of prescriptive code provisions for retrofit of SWOF buildings. These were published, with four other chap-ters, in a standalone document in 2001; the five chapters were then incorporated into the 2003 IEBC as Appendix Chapter A.
IEBC A4, like other retrofit codes and stan-dards, can be used voluntarily. As part of a model code, IEBC A4 is also allowed as an option when the code triggers an upgrade as a result of an alteration or repair. Be-cause California jurisdictions are required

11
Soft Story Risk Reduction: Lessons from the Berkeley data
IEBC A4 is primarily a guide for ret-rofit of known SWOF buildings. Its provisions for evaluating existing conditions are relatively spare. IEBC A4 is meant to address only certain building types and only three poten-tial deficiencies: soft wall lines, weak wall lines, and open fronts. (See the Terminology section of this report.) It defines these conditions broadly, even vaguely, with the presump-tion that a decision has already been made to go forward with retrofit.
The main feature of IEBC A4, com-pared with a more comprehensive evaluation or retrofit standard, is that it requires retrofit only within the first story of the SWOF building. The three targeted deficiencies, if they exist, are presumed to be dominant, so a first story retrofit that mitigates them will greatly improve the build-ing even if lesser deficiencies remain.
For simplicity, IEBC A4 refers to cer-tain provisions from the code for new construction. This is reasonable for a retrofitted building whose perfor-mance will be controlled by new ret-rofit elements; it might be question-able if the assumptions made for new elements are applied to obsolete or unknown conditions. This also means
•
•
•
that when the code for new buildings changes (with respect to earthquake demands or structural system charac-terization, for example), the IEBC pro-visions change as well.
The Berkeley program adopted the 2003 IEBC A4, the latest edition avail-able at the time. The IEBC is revised on a three-year cycle, however. The 2006 edition removed certain evalu-ation requirements. The 2012 edi-tion has made a number of additional changes. This means that evaluations or retrofits using IEBC A4 today will differ in significant ways from those done in the Berkeley program, and could reach different conclusions.
•
to follow the CBC, however, and because the CBC in 2005 did not reference the IEBC, AB 304 was thought necessary to allow the use of IEBC A4 by a jurisdiction like Berke-ley (see Table 1-1).
Details of IEBC A4 that shaped the Berke-ley program are discussed in Sections 3 and 4, below. Some important general points about its scope and purpose, however, in-clude:

12
2. The Study2.1 ObjectivesThis study compiled and analyzed informa-tion from 90 engineering reports produced and approved for compliance with Berke-ley’s program. The reports, on ostensibly similar buildings, offer real data with which to study a range of issues: The makeup of the building stock, the construction styles of various eras, the practice of earthquake engineering and regulation in response to a mandatory evaluation program, and the predic-tive quality of the criteria used for that evaluation.
This study looked at each of those topics, but it began with a simple objective: To determine whether easily observed building charac-teristics can reliably predict structural performance as measured by a detailed engineering evalu-ation. If a strong predictive relationship ex-ists, a much-needed screening tool can be derived from it.
This initial objective arises from the typical process of mandatory earthquake mitiga-tion programs. A viable program must be able to reach its targets without casting too wide a net. Having too many false positives in the inventory unfairly burdens owners who should have been exempt, increases program costs and duration, reduces the public’s good will, and lessens the political acceptability of the program. Ideally, own-ers whose buildings clearly do not present the targeted deficiency should be able to petition for exemption in a quick and inex-
pensive way without the need for a costly engineering evaluation.
Take woodframe multi-unit residential buildings as an example. A mitigation program would want to find those build-ings with SWOF conditions known to have caused collapse in past earthquakes. The problem is that the jurisdiction implement-
ing the program generally does not know which ad-dresses have SWOF condi-tions and cannot, as a mat-ter of fairness, presume to know that from a sidewalk or windshield survey. (In-terestingly, however, this is just what Berkeley’s pro-gram did; see Section 4.2 of this report.) Therefore, ini-tial eligibility is generally based on attributes known to the building department, housing department, or
county assessor, such as the number of sto-ries, number of units, age, occupancy, etc. Oakland’s program, for example, targeted all buildings with at least two stories and five units, built before 1991, with certain first story uses (Oakland, 2009). Of all the buildings that meet these criteria, some will have SWOF conditions, and the rest will not. Both the owners and the jurisdic-tion would benefit from a screening tool that could identify the obvious non-SWOF buildings with a minimal effort, preferably without the need for an engineer.
To date, no such screening tool exists. Me-dia reports, awareness campaigns, and, indeed, most surveys used by jurisdictions to estimate their risk, have called atten-
Both the owners and the jurisdiction would benefit from a screening tool that could identify the obvious non-SWOF buildings with a min-imal effort.

13
Soft Story Risk Reduction: Lessons from the Berkeley data
tion to the presence of parking stalls, ga-rage doors, or large storefront windows as characteristic of SWOF buildings, but these are merely indicators. Actual de-termination of SWOF conditions requires engineering calculations that consider the strengths, stiffnesses, and configura-tions of walls of different types in both the first story and upper stories. No doubt some buildings without ground floor park-ing or open space will calculate as SWOF, and no doubt some with these indicators will calculate as non-SWOF. The question is whether some set of indicators can predict a SWOF or non-SWOF condition without sub-stantial investigation and analysis.
Several screening ideas have been proposed, most of them based on a building’s dimensions and on the proportions of openings, either in the first story walls or of the first floor area. As its first objective, this study uses the compiled Berkeley data to test several such proposals.
The value of an efficient screening tool based on easily measured indicators is premised on two assumptions: First, that engineers would produce consistent evalu-ations from the same set of observable con-ditions, and second, that the metrics of an engineering evaluation, such as weak story ratio, actually predict likely performance in real terms of damage or collapse.
It turns out, as this report demonstrates, that both assumptions are false, so the ob-jectives of the study shifted to the question of why. What are the sources of inconsistent engineering evaluations? Why do standard
engineering metrics miss the big picture of collapse-prone building performance? If we know how the two assumptions fail, can we work around them to seek a reliable screening tool based on assumptions that are true? Finally, how might engineers and jurisdictions apply lessons from the Berke-ley data to make future evaluation and miti-gation programs more effective?
Meanwhile, as the study was progressing, the ATC 71-1 project (in which the lead
author was a partici-pant) developed a new probabilistic meth-odology for evaluat-ing woodframe build-ings with and without SWOF conditions (FEMA, 2012). The ATC product, numbered FEMA P-807, could thus be used to gauge traditional engineering findings about typical
Berkeley buildings.
The final objectives of the study thus reflect a broader, more academic view than the initial motivation to formulate a screening tool. The objectives may be summarized as follows:
•
•
•
To characterize the population of buildings covered by the Berkeley program.
To characterize the relationship be-tween readily observable building conditions and traditional engineer-ing metrics of SWOF performance.
To identify shortcomings in conven-tional engineering practice and in current codes that limit their ability to inform loss estimates and mitiga-tion planning.
What are the sources of inconsistent engineering evaluations? Why do stan-dard engineering metrics miss the big picture of col-lapse-prone building per-formance?

14
Soft Story Risk Reduction: Lessons from the Berkeley data
2.2 Methodology
The study’s principal tasks were:
Literature review. Reviewed documents helped form the basis for the database design. Documents related directly to the Berkeley program included the ordinance (with amendments) as reflected in the Berkeley Municipal Code (Berkeley, 2005), the Framework document developed as guidelines for owners and engineers (Berkeley B&S, 2006), and various editions of IEBC A4, including the commentary writ-ten by the SEAOC Existing Buildings Com-mittee (ICC, 2003; 2006; 2012). These refer-ences were supplemented by unpublished notes and correspondence with engineers active in the development of IEBC A4 and its predecessors and by informal presen-tations to and discussions with members of the SEAONC and SEAOC Existing Build-ings Committees and the ATC 71-1 project team. Preliminary work by Rabinovici (now documented in Rabinovici, 2012) provided background about the program’s inception and implementation.
Database development. In April 2010, Berkeley’s Building and Safety Division pro-vided us with a copy of the spreadsheet it had been using to track the program. With one record per address, it included both building and administrative information. Most of this information was irrelevant to our study, but a unique case number for
each building allowed us to provide ano-nymity for building-specific data while re-taining a link to the full data set. Ultimately, all of the relevant building data would be confirmed or corrected through review of building-specific engineering reports. We maintained the database as a flat file in Microsoft Excel. We added fields to the spreadsheet as needed to record relevant building attributes, structural properties, and results of the approved evaluations. The fields were based in part on a review of an initial group of about a dozen approved reports received from Berkeley in July 2010. Appendix A describes a selection of the database fields.
Report review and data entry. In Novem-ber 2010, the Building and Safety Division provided us with the available approved reports, 90 total, for our temporary use, and the data entry began. Only reports ap-proved through the program’s quality as-surance process were used. As data entry proceeded, the database itself was adjust-ed. Some fields were eliminated as unnec-essary: For example, it turned out that none of the engineers reported on the adequacy of existing rim joist details, and none actu-ally calculated a structural period; instead they used default code formulas to estimate period or base shear. Other fields were simplified to suit the data: We originally intended to track the multiple wall types cited by each report, but soon recognized that strength values assumed for those walls made the wall type moot – but made the variation in assumed strength more in-teresting. Fields were added as well, mostly to account for errors, omissions, and in-consistencies in the reports; to ensure that the statistical analysis would be based on comparable data, we added fields to hold recalculated values of DCR, SSR, WSR, and other parameters. The relative positioning of wall lines proved too detailed and com-
To supplement the catalogued find-ings of the approved Berkeley re-ports with observations based on the application of FEMA P-807.
To derive usable lessons for other ju-risdictions contemplating mitigation approaches for SWOF buildings.
•
•

15
Soft Story Risk Reduction: Lessons from the Berkeley data
plex to database in our flat file. Since IEBC A4 does not explicitly require consideration of torsion or wall interaction, this informa-tion did not affect our study of the Berkeley process and findings. However, recognizing that other evaluation methods (including FEMA P-807) do account for configuration, we catalogued hard copies of the first and upper story floor plans for each building.
Preliminary issue identification and statisti-cal analysis. The 90 reports were expected to provide a robust data set. Even so, sta-tistical analysis is only meaningful when it describes comparable data. Preliminary analysis looked for groups of buildings that could reasonably be contrasted group-to-group or studied further as a subset. Que-ries involving age, size, structural system, and eligibility for various IEBC A4 provi-sions identified some useful correlations, described below. As discussed above, how-ever, our objectives expanded from a vet-ting of potential screening tools to a study of engineering and regulatory practices. In large measure this was a response to issues that arose during data entry as certain con-ditions and judgments, some rational and some dubious, appeared over and over. An essential question such as “Is there a rela-tionship between the total length of wall openings and the calculated DCR?” had to be broken down into more basic ques-tions: Does it matter that some engineers counted the interior partitions and some did not? How are the findings affected by different assumptions about existing mate-rial weights and strengths? Why do some reports recommend strengthening even where no SWOF condition is apparent? Some of these are questions about the im-plementation of the Berkeley program. Oth-ers go right to the fundamentals of current engineering practice. Later sections of this report address these questions.
FEMA P-807 analysis. To help resolve certain discrepancies and vagueness in the data, we extended the study duration to allow for experimental use of the near-final draft of FEMA P-807 (FEMA, 2012). Because FEMA P-807 accounts for conditions that IEBC A4 does not (like wall orientation, non-linear behavior of various wall types, and the characteristic response of vertically irregular structures), it offers an alterna-tive gauge of predicted performance and a way of parsing the Berkeley data. In addi-tion, our use of FEMA P-807 suggests how it might be used to guide mitigation programs and priorities in other cities. We created a spreadsheet tool to do the FEMA P-807 cal-culations, then analyzed several prototype buildings from the Berkeley data set. The results are presented and discussed in Sec-tion 5.2 of this report.

16
3. The Berkeley Buildings
The 90 buildings considered in this study are all woodframe multi-unit residential structures built in a single city with non-current codes, and all were presumed to have similar seismic deficiencies. Yet they are structurally diverse, many with com-plexities that inhibit the use of prescriptive evaluation procedures. Within the 52 build-ings that comprise our data set are dis-tinct subgroups related to age and height. Also, the ground floor occupancies of these buildings, while largely unrelated to their structural adequacy, appear to be markedly
3.1 Scope of the Berkeley programThe Berkeley program, per Section 19.39.020 of the Municipal Code, applies to buildings of a certain age, occupancy, size, and construction: “all existing wood frame multi-unit residential buildings or portions thereof that contain five or more dwelling units, as defined in the City of Berkeley zoning ordinance, and that were designed
Figure 3-1 Map of Berkeley’s initial inventory of soft story buildings (MacQuarrie, 2005).
different from buildings of similar age, size, and occupancy in San Francisco.

17
Soft Story Risk Reduction: Lessons from the Berkeley data
under a building permit applied for before the adoption of the 1997 Uniform Building Code.” If those criteria are met, the building must be checked for certain deficiencies us-ing IEBC A4, as modified by the Framework document. Initially, the city estimated that “nearly 400” buildings would fall under the ordinance (Berkeley, 2005). Figure 3-1 shows the approximate locations of build-ings expected to fall under the ordinance as of early 2005.
Table 3-1 describes the status of the Berke-ley program in early 2010. In March 2011, the city was tracking 320 addresses (Berke-ley B&S, 2011). The final inventory covers about 3,500 residential units – about ten
Table 3-1 Disposition of buildings subject to Berkeley’s soft story program as of April 2010
percent of Berkeley’s total multi-unit hous-ing stock (Rabinovici, 2012).
As shown, we received and reviewed 90 reports. While these were all the reports available at the time, they represent slight-ly less than thirty percent of the buildings the city had been tracking. Discounting the false positives – 48 buildings listed by the city but eventually found to be exempt – the 90 reports represent a third of the suspect building stock.
It’s important to note that the 269 build-ings properly targeted by the ordinance are not necessarily representative of Berkeley’s multi-unit housing stock. Berkeley started
Category No. of Buildings
Buildings considered in this study 90In database 52Not in database; building is non-comparable 38
Buildings not considered in this study but subject to the Berkeley ordinance 179Buildings out of compliance with ordinance (report not yet submitted) 50Approved reports not made available 13
Reports in review, not yet approved 41Permits granted for retrofit; evaluation moot 34Buildings retrofitted pursuant to the ordinance; evaluation moot 40Removed from list, demolition permit issued 1
Buildings not considered in this study and found exempt from the ordinance 48Request for removal from list under review 4Removed from list, fewer than 5 units 31Removed from list, not woodframe construction 2Removed from list, judged “not soft story” 11
Total 317

18
Soft Story Risk Reduction: Lessons from the Berkeley data
with a list of “nearly 400” buildings already suspected of having vulnerable SWOF con-ditions based on the 1996 sidewalk sur-vey by city staff and consulting engineers (MacQuarrie, 2005; Kamlarz, 2005). So we are not looking at all multi-unit wood-frame buildings of a certain age in order to understand what portion of the housing stock might have SWOF conditions; we are looking at a group already selected based on an expectation that each of its members is seismically deficient. By the same token, this pre-selection means there might be other equally vulnerable (and equally eligi-ble) buildings that escaped notice when the original list was developed. Looking at on-line street views of buildings with approved reports, we found several where nearly identical buildings next door or nearby were not on the city’s list of addresses. (See ection 4.2 of this report for further discus-sion of the inventory process.)
Are the 90 reviewed reports representa-tive of all the SWOF buildings subject to the Berkeley program? We expect so, based on a random sample of street views, and because the distribution of the 50 “out of compliance” buildings by age and stories closely resembles that of the 52 database buildings. However, it is possible that the buildings not studied, as a group, are some-how more complex or have other attributes that caused their reports to be submitted late in the program.
Additional observations from Table 3-1:
• For 74 buildings, retrofits were per-formed or at least permitted in the course of the program. For these buildings, the owners avoided the evaluation of what probably seemed like obvious SWOF conditions and in-stead jumped voluntarily to the next step in the mitigation process, even though the Berkeley ordinance did
not require it. The thinking behind these decisions, and their policy im-plications, has been studied by Rabi-novici (2012).
Eleven buildings were exempted from the program as “not soft story.” We looked at these eleven buildings using online street views. Several appear to have concrete block first story walls due to partially below-grade parking, and this might have been the basis for the exemption. However, several of the reports ap-proved by the city and among the 90 we reviewed also had this condi-tion. Four of the 11 “not soft story” buildings actually appear very simi-lar to woodframe buildings with ap-proved reports. While these observa-tions raise some questions about the varied strategies taken by owners – some went ahead with the evalua-tion while others requested exemp-tion – it is not expected to affect our technical findings.
•
3.2 The database buildingsOf the 90 reports reviewed, only 52 were used to develop the database. Because the technical aspects of the study were based on the application of IEBC A4 (and later, FEMA P-807), it was important to screen out any buildings not well-suited to these methods. Each of the 38 buildings not da-tabased included one or more complexities or irregularities that inhibit a straightfor-ward evaluation, such as:
•
•
Concrete first story walls, generally as retaining walls or partial base-ment walls
Concrete masonry unit (CMU) first story walls or piers

19
Soft Story Risk Reduction: Lessons from the Berkeley data
Woodframe cripple walls and a crawl space under first floor residential units
Split-level floor diaphragms
Significant hillside or partial base-ment conditions.
•
•
•
Of the 52 database buildings (see Appendix A for details), 12 might be considered mar-ginally suited to IEBC A4 (and FEMA P-807) due to:
•
•
•
•
•
Concrete stemwalls and a crawl space under first floor residential units
Nominal lengths of concrete or CMU piers, or steel diagonal braces, in the first story
Partial mezzanines within the first story
L- or U-shaped floor plans
Vertical complexity, i.e. non-uniform floor plates over the building height.
These 12 were included based on the judg-ment that typical engineering practice would probably accommodate them by adjusting or supplementing, but not aban-doning, the standard criteria in IEBC A4 or FEMA P-807. Nevertheless, the variety of non-uniform conditions suggests a lesson for developers and users of procedures for “typical” buildings: Even a narrowly de-fined subset of buildings can include sig-nificant diversity, and a highly specialized or restricted methodology will not service it completely.
Are the 52 database buildings comparable to each other in structural terms? Do they break into distinct subgroups? Figure 3-2 shows the distribution of the 52 buildings by number of stories and decade of construc-tion (see also Appendix A). Era of construc-tion is a useful surrogate for architectural style and structural details. Building height is related to building mass and therefore to the seismic demands the building will need to resist. Figure 3-2 presents a clear pat-tern not unlike that seen in San Francisco and Oakland: Residential building booms in the 1920s and in the 1950s and ’60s. (Two buildings for which no date was reported were assumed to have been built in the
1960s based on archi-tectural style.) There is also a clear relation-ship between age and height. The six 1920s buildings include no two-story buildings and all but one of the four-story buildings in the data set. By con-trast, the 39 buildings from the 1950s and ’60s include nearly all the two-story build-ings and no four-story buildings at all.
0
5
10
15
20
25
30
00s 10s 20s 30s 40s 50s 60s
Num
ber o
f buildings
Decade of construction, 1900s to 1960s
4 story
3 story
2 story
Figure 3-2 52 database buildings by height and decade of construction.

20
Soft Story Risk Reduction: Lessons from the Berkeley data
Figure 3-2 suggests that the data set in-cludes two largely distinct building tech-nologies, as opposed to a full spectrum of materials, systems, and details slowly evolving through the years. The 1920s buildings, if they are like buildings from the same era in San Francisco, are more likely to have plaster walls and ceilings, and per-haps board sheathing, but not wood structural panels (WSP). The 1950s and ’60s buildings are more likely to have gypsum board walls and ceilings and per-haps WSP shear walls. Giv-en their structural distinc-tion, the two subsets might reasonably be assumed to have different perfor-mance characteristics and therefore should not be studied as a single group. The six 1920s buildings, however, are too few to provide robust data. Therefore, the later sections of this report consider only the 39 build-ings from the 1950s and ’60s.
Looking at just the 39 buildings from the ’50s and ’60s, the data showed another significant correlation as well. Table 3-2 shows the wall sheathing material re-ported for each group. Of the 39 buildings, about half (19) have WSP-sheathed walls. Only two of those, however, are two-story buildings, and none of the two-story build-ings have WSP on their interior partitions. Thus, the two-story and three-story build-ings are different not only in height but in
structural system and should be analyzed separately.
First story parking or retail uses are often associated with SWOF buildings, both in media reports and in ordinances and regu-lations (Oakland, 2009; San Francisco DBI, 2010). The occupancy has no direct influ-
ence on earthquake per-formance. Rather, parking areas or storefront win-dows are sometimes used as indicators of large open areas and insubstantial walls, both of which are as-sociated with SWOF condi-tions. While the actual oc-cupancy has no technical significance, it can play an important role in mitiga-tion policy. Because the
failure mode of a SWOF building generally involves a first story collapse, loss of life is much more likely in buildings that have residential or commercial space on the ground floor. Also, retrofit work is likely to be more disruptive and expensive when it affects an occupied space.
Table 3-3 (next page) shows the first floor occupancies of the 52 database buildings. (All of the database buildings had only residential units at upper floors. Sections 4 and 5 of this report include several fig-ures illustrating typical buildings and floor plans from the 1950s-’60s subset.)
Observations from Table 3-3:
Number of Buildings Number of Buildings with WSP SheathingPerimeter walls Interior partitions
Two-story buildings 20 2 0Three-story buildings 19 17 6
Table 3-2 1950s-’60s buildings with wood structural panel sheathing
While the actual oc-cupancy has no tech-nical significance, it can play an impor-tant role in mitiga-tion policy.

21
Soft Story Risk Reduction: Lessons from the Berkeley data
All buildings Commercial uses a
One or more resi-dential units
No commercial or residential uses b
Pre-1950 buildings c
13 6 5 3
1950s-’60s buildings d
39 2 35 3
Table 3-3 Ground floor uses in 52 database buildings
a. For purposes of this table, commercial uses may include business, mercantile, or assembly occupancy.b. Uses include only nominally occupied spaces, such as parking, storage, utility rooms, laundry rooms, or small lobby areas.c. One building has both residential and commercial space on the ground floor.d. One building has both residential and commercial space on the ground floor.
About three quarters (40/52) of the database buildings have ground floor residential units. About 90 percent (35/39) of the ’50s-’60s buildings have ground floor units.
Nearly 90 percent (46/52) of the da-tabase buildings have some occupied space on the ground floor.
Commercial use is far more common in the older buildings. Though not shown in the table, all three of the pre-1920s buildings have predomi-nantly commercial occupancy at the first floor.
•
•
•
These patterns probably do not apply to Oakland or San Francisco. A 2007 sidewalk survey of woodframe residential buildings in San Francisco (with no pre-selection as to SWOF conditions) found that only about 30 percent had first floor residential units, and only about 40 percent had any sort of oc-cupied first floor space (San Francisco DBI, 2007) – less than half of the corresponding rates for Berkeley. Jurisdictions interested in SWOF mitigation need to understand their own inventories and should extrapolate find-ings from other jurisdictions with caution.

22
4. Technical Aspects of the Berkeley Program
Any methodology for seismic analysis re-quires the engineer to make certain mea-surements or assumptions about the build-ing – its weight, its stiffness and strength, the local seismicity, etc. Some of these val-ues are prescribed by the governing build-ing code; others are estimated, often using conventional rules of thumb. Almost always there is room for judgment and for “sharp-ening one’s pencil” as part of a tradeoff be-tween precision and effort (or fee).
The question here is whether engineers working on the Berkeley program made assumptions and simplifications that, while perhaps ra-tional for individual cases, led to signifi-cant inconsistencies between buildings and for the program overall. We conclude that they did. In ad-dition, we found many cases in which the building had no calculable defi-ciency using IEBC A4, but the engineer (perhaps prompted by the city’s reviewer) nevertheless recommended retrofit.
From one perspective, it might be argued that this systemic conservatism corrected for shortcomings in the IEBC A4 methodol-ogy (a notion borne out by the FEMA P-807 analyses described in Section 5). From an-other perspective, it merely exacerbated the owners’ and the city’s issues by obscur-ing the problem. In other words, if the goal
was to find weak, damage-prone buildings, the engineers certainly found them. But if the goal was to find collapse risks caused by SWOF conditions, and to distinguish them from the risks posed by non-SWOF build-ings, the program did not succeed as well as it might have.
The balance of this section discusses the set of 39 buildings constructed in the 1950s and 1960s. Even though all 39 reports were guid-ed by the same instructions (Berkeley B&S, 2006) and were reviewed and approved by a single consulting firm working for the city,
they reflect a vari-ety of assumptions and simplifications, some of which intro-duced bias into the reported findings. This does not mean the data is neces-sarily incorrect or meaningless. Rather, it means that the re-ports are products of people making deci-sions, not indepen-dent data found in nature. In particular,
since just a few engineering firms produced the bulk of the reports, any biases, rational or otherwise, within those firms’ practices will have affected the overall findings. Table 4-1 shows the number of the 39 reports pro-duced by each of 15 firms, here designated A through O.
Firm Number of reportsA 9B 10C 6D 2E 2
F – O 1 eachAll 39
Table 4-1. Distribution of engineering reports by firm, 39 1950s-’60s buildings
4.1 Variable engineering practiceIEBC A4 considers three deficient condi-

23
Soft Story Risk Reduction: Lessons from the Berkeley data
tions: soft story, weak story, and open front. The first two can be quantified with a soft story ratio (SSR) or weak story ratio (WSR) and compared with default minimum ac-ceptable values. Open front conditions are less well quantified and are therefore subject to judgment. (See the Terminology section of this report for additional discus-sion.) In addition, code-based procedures like IEBC A4 quantify the expected perfor-mance with a demand capacity ratio (DCR). The Berkeley Framework document re-quired calculation of DCRs for the first story as part of the evaluation process (Berkeley B&S, 2006, Section 2.1.3).
Thus, the quantitative results of a Berkeley evaluation using IEBC A4 are the SSR, WSR, and DCR. SSR and WSR are based on the capacity of the existing structure only, com-paring the first story to the second story. DCR, as its name implies, considers also the seismic demand, comparing the strength of the first story (capacity) to the earthquake-generated forces (demand) estimated by a code formula. The following subsections examine the assumptions made in SSR, WSR, and DCR calculations in the approved reports from the 39 buildings dating from the 1950s and 1960s.
4.1.1 Seismic demand. Consider first the seismic demand, which makes up the nu-merator of the DCR. Berkeley’s criteria ref-erence the 2003 edition of IEBC A4, which in turn references Section 1630.2 of the 1997 UBC (see the Terminology section of this report for discussion). The UBC gives a formula for demand in the following form: V = 0.75 * F * Ca * Na * I * W / R, where:
• V is the seismic demand, in kips (thousands of pounds), also called the “base shear” or “required strength.”
0.75 accounts for the 25 percent re-
duction allowed by IEBC A4 when applying UBC provisions to existing buildings; it represents a policy deci-sion not to hold existing buildings to the same standards as new buildings.
F is an amplification factor for rela-tively short, stiff buildings.
Ca * Na represents the site seismicity, accounting for soil type and fault dis-tance.
I is an importance factor, set equal to 1.0 for residential buildings.
W is the weight of the building, in kips (thousands of pounds).
R is a reduction factor that varies by structural system..
•
•
•
•
•
Selection of each of these parameters al-lows for some judgment and, of course, for the possibility of mistakes or misinterpre-tation of the code. Table 4-2 (next page) shows some of the values used in the 39 re-ports for buildings from the 1950s and ’60s.
In code-based earthquake engineering, cal-culation imprecision of 10 percent is com-monly accepted. The actual earthquake, when it comes, will be unique in ways the code does not even try to account for (fre-quency content, duration, etc.), so fussing over code approximations within 10 per-cent or so is not justified. Greater impreci-sion can be significant, however, especially when buildings are being compared to each other, as in this study. Table 4-3 (next page) breaks down just the combinations of F and R used in individual reports and shows that the range of typical choices could change the calculated demand, and thus the DCR, by up to 50 percent (0.67 v. 0.45). Since no reports used the F/R combination of •

24
Soft Story Risk Reduction: Lessons from the Berkeley data
Parameter Value Used No. of Buildings
F2.5 253.0 9
Other a 5
Ca * Na
0.616 30.660 25
Other b 11
R4.5 145.5 20
6.5 c 5
Table 4-2 Base shear parameters used in reports for 39 1950s-’60s buildings
a. Five reports used the more recent IBC instead of the UBC; the IBC uses a different base shear formula.
b. Values used ranged from 0.528 to 0.700. The “other” values include the five reports that used the more recent IBC instead of the UBC; the IBC uses a different character-ization of seismicity.
c. The five reports that used a value of 6.5 all used the IBC instead of the UBC. In the IBC, the meaning of R is the same, but the values allowed are different.
3.0/4.5, however, the range in demand cal-culations due to engineers’ actual choices for F and R was only as high as 24 percent (0.56 v. 0.45). With reference to Table 4-1, Firm A consistently used an F/R combina-tion of 3.0/5.5 and was the only firm to do so. Firm B consistently used an F-value of 2.5 but used R-values of 4.5 for six buildings and 5.5 for four buildings.
While a variation of 24 percent in the de-mand calculation (not yet accounting for variations in seismicity and weight as-sumptions) is not unreasonable, it can be significant, especially if paired with simi-lar variations in assumed capacity, as dis-cussed below. The following paragraphs discuss some additional observations on base shear parameters.
IEBC A4 refers directly to the UBC equation
Table 4-3 Values of F/R used in reports for 34 1950s-’60s buildings
R4.5 5.5
F2.5
0.56 (14 buildings)
0.45 (11 buildings)
3.0 0.67 (0 buildings)
0.55 (9 buildings)
that uses an F-value of 2.5. The value of 3.0 comes from UBC provisions for “simplified design” (ICBO, 1997, Section 1630.2.3.2). The Framework did not explicitly prohibit the simplified equation, but for the reports that used it, it resulted in an immediate, ar-tificial 20 percent increase in the calculated demand and DCR. As noted above, only one firm used this value, but that firm produced nine of the 39 reports discussed here.
For the product Ca * Na, 25 reports used a value of 0.44 * 1.5 = 0.66. This represented two reasonable but conservative default values. The 0.44 value for Ca corresponds to the code’s default soil type; many buildings might have been able to justify a value about 10 percent lower but used the code default. The 1.5 value for Na is prescribed by the UBC for sites within 2 km of the fault trace. In Berkeley, where seismicity is dominated by the Hayward fault, this value would ap-ply to nearly all of the buildings in the pro-gram (see Figure 3-1), though a few in the westernmost part of the city might have been able to use a value of 1.3 or 1.4. Five buildings used a value of 1.2, all improperly, as this requires a fault distance of at least 5 km, which no site in Berkeley enjoys.
The two most commonly used values of R, 4.5 and 5.5, are the only obvious options from the 1997 UBC, so engineers can not be faulted for using one or the other even though neither would be used in similar

25
Soft Story Risk Reduction: Lessons from the Berkeley data
evaluations today (see the next paragraph). The 5.5 value would have applied to struc-tures with wood structural panels (WSP); 4.5 would apply to buildings sheathed only with stucco or wood siding. In the 2003 IBC, which would have been available to all the engineers and was actually used by four different firms on five buildings, the cor-responding values are 6.5 for WSP and 2.0 for non-WSP. So one issue is that engineers using the more recent IBC would have used R-values either 18 percent less conserva-tive (6.5/5.5) or 56 percent more conser-vative (2/4.5) than UBC users. But that is a prob-lem only for studies like this one, which try to compare one evaluation to another. The bigger problem is that, of the 39 reports described in Table 4, twelve used the WSP value to evaluate structures that had no WSP sheathing. Nine of the 20 reports that used 5.5 should have used 4.5 and thus underestimated demand by 22 percent. Three of the reports that used 6.5 should have used 2, thus underesti-mating demand by a factor of more than 3. (Similarly, five of the 14 buildings that used 4.5 also had WSP sheathing and therefore could have stretched to use 5.5, but perhaps recognized that it would have been improp-er to do so; see the next paragraph.) Why this discrepancy? It’s possible that some of these mistakes were intentional, either to try to show that a bad building was okay or to demonstrate that a building was still bad even under the least conservative as-sumptions. We believe it is more likely that engineers (and the city’s reviewers) made the mistake of using properties of the ex-pected retrofit system to evaluate existing conditions. In any case, the discrepancy
complicates any analysis of the data set or of hypotheses about possible performance predictors and screening tools.
The engineers’ choices of R-values also re-veal that two problems common to code-based seismic evaluation of existing build-ings were present in the Berkeley program. First, any R-value comes with certain provi-sions about materials and detailing; if you don’t meet all those provisions, the corre-sponding R-value should not apply. The use of 4.5, 5.5, or 6.5 in the Berkeley program
was probably not justi-fied. Second, and more important as a lesson for current SWOF pro-grams, IEBC A4 (Section A403.4) was explicit that when a single R-value is applied to the analysis of an entire building, the appropri-ate value is the smallest value assigned to any of the seismic force resist-ing elements. That is, if
you design a first story retrofit of a SWOF building using a pre-2012 version of IEBC A4, your R-value will be limited by the an-tiquated construction of the upper stories. This is a flawed provision that has been corrected in the 2012 IEBC (Harris et al., 2009), but it remains the case that code-based evaluations should not assume the material and system properties of new buildings. In the Berkeley program, engi-neers charged with applying IEBC A4 and the 1997 UBC as written can perhaps not be faulted for misapplying R-values (except for using the wrong values as noted in the previous paragraph) because those codes did not make explicit distinctions between current and archaic systems. That is, even if you had wanted to account for deficient upper stories you might have ended up
It is more likely that en-gineers (and the city’s reviewers) made the mis-take of using properties of the expected retrofit system to evaluate exist-ing conditions.

26
Soft Story Risk Reduction: Lessons from the Berkeley data
0
2
4
6
8
10
12
<0.16 0.16‐0.18 0.18‐0.20 0.20‐0.22 0.22‐0.24 0.24‐0.26 0.26‐0.28
Num
ber o
f buildings
Base shear ratio
2 story
3 story
with the same high R-value. Careful us-ers of the 2006 or 2009 IEBC, how-ever, would have been instructed to use an R-value of 2, and users of the 2012 IEBC will find a different provision entirely. This means two things: First, DCR values calcu-lated by the Berkeley program have little actual meaning as gauges of acceptability and are really useful only in relative terms for studies like this one (assuming they are at least all derived in the same faulty way). Second, the DCR values calculated by the Berkeley program will not be comparable to DCR values calculated with more recent versions of the same codes.
The combined effect of all the parameters in the demand equation is often expressed as the base shear ratio, V/W, indicating the fraction of the building’s weight applied as a seismic demand. This ratio will reflect the combined effects of the issues discussed above. Figure 4-1 shows the distribution of base shear ratios for the 39 buildings, and Table 4-4 gives statistics from the distribu-tions. While about half the buildings have base shear ratios in the 0.26 – 0.28 range, the spread is large, and the outliers at the low end, at only half the median value, pull the average value down about 10 percent to
Figure 4-1 Base shear ratio, V/W, for 1950s-’60s buildings.
0.24. More important, Figure 4-1 suggests that the base shear ratios from these 39 reports are not described by a normal dis-tribution. Rather, the standard practice ap-pears to have been the most conservative (giving values at the far right end of Figure 4-1), with variation, large or small, always toward less conservatism.
Building weight. The base shear ratio is a useful benchmark, as it normalizes for weight differences between buildings, and Figure 4-1 suggests a conservative bias in the data. In calculating DCR, the weight does matter, as it directly affects the abso-lute demand. All 39 of the 1950s-’60s build-ings were similar in style and construction. As discussed above, the three-story build-ings tended to have wood structural panels while the two-story buildings didn’t, but this should have little effect on weight, and buildings with heavy concrete or masonry
Number of buildings Average Standard deviationTwo-story buildings 20 0.24 0.047Three-story buildings 19 0.24 0.035All buildings 39 0.24 0.042
Table 4-4 Base shear ratio, V/W, for 1950s-’60s buildings

27
Soft Story Risk Reduction: Lessons from the Berkeley data
elements were generally removed from the data set as non-comparable. Therefore, we should expect conventional or traditional assumptions about weight to have been used in the report calculations.
Figure 4-2 shows the distribution of unit weight for each building, where unit weight was calculated as the building’s reported total seismic weight, W, divid-ed by its gross square footage. Table 4-5 gives statistics corresponding to the fig-ure. Compared with Figure 4-1, Figure 4-2 shows something more like a normal distribution, suggesting a non-biased set of assumptions behind the weight calcula-tions. Still, there is enough spread to have an effect on DCR calculations, as two build-ings within one standard deviation of the average can already have assumed weights that differ by 30 or 40 percent.
0
1
2
3
4
5
6
7
<20 20‐24 24‐28 28‐32 32‐36 36‐40
Num
ber o
f buildings
Building unit weight [psf]
2 story
3 story
Figure 4-2 Unit weight, W/GSF [psf], for 1950s-’60s buildings.
No. of buildings Average Standard deviationTwo-story buildings a 19 29.5 4.6Three-story buildings 19 29.9 5.5All buildings 38 29.7 5.1
Table 4-5 Unit weight, W/GSF [psf], for 1950s-’60s buildings
The component parts of the assumed weights were not databased for each building. Instead, we tracked the typical assumptions made by each firm for each era of construction. Table 4-6 (next page) shows the ranges of values used for weight calculations in 1950s-’60s buildings. (Here the weights are normalized by the area
of the component, not by the gross square footage of the building.) For each compo-nent type, the spread between minimum and maximum values is large, and even the values within one standard deviation of the average represent weight differenc-es of 30 percent or more, confirming the building-level trend detailed in Figure 4-2 and Table 4-5.
From the foregoing discussion we can see that the 39 buildings, though ostensibly similar, were handled with substantial vari-ability, including mistakes in calculated seismicity, mistakes or judgmental bias in application of code parameters and formu-las, and normal (though large) error in esti-mated building weight. While these effects can sometimes be offsetting, the effect for any given building is to cast doubt on the predictive value of any assessment making
a. One two-story building did not report weight data.

28
Soft Story Risk Reduction: Lessons from the Berkeley data
Building component Firms sampled
Reports sampled
Min. Max. Average Standard deviation
Median
Wood-framed roof 19 22 9.9 17.0 13.8 2.1 15.0Wood-framed floor 19 22 8.0 20.0 12.9 3.1 12.5Perimeter wall 15 18 8.9 25.0 17.7 3.5 18.0Interior partition 14 16 6.0 19.5 9.9 3.7 9.5
Table 4-6 Component unit weights [psf] used in reports for 1950s-’60s buildings
use of these demand calculations, especially if the demand is taken as an absolute value. The demand might be useful in a relative way, for comparing one building to another, but only if the biases and assumptions are applied uniformly. Here, however, the appli-cation varied by firm and perhaps even by building, so no two demand values or DCRs can really be compared unless we know the assumptions and errors behind each one.
4.1.2 Seismic capacity. The capacity of a building measures its aggregate resistance to seismic demands. For this study, we con-sider only the lateral capacity derived from walls and partitions. That is, we are ignor-ing the capacity of diaphragms, founda-tions, and other load path elements. These other elements are of course important to a building’s performance, but it’s the walls that distinguish a SWOF building from a non-SWOF building.
Two measures of wall capacity are relevant: stiffness and strength, as reflected in the two metrics, SSR and WSR.
Stiffness. Neither IEBC A4 nor the Berke-ley Framework specified how to calculate wall stiffness. While the building code for new construction and other guidelines of-fer some useful equations, it is difficult to account reliably for all the details that af-fect wall stiffness, especially the degrad-ing response of non-engineered materials like stucco, plaster, and gypsum board, and then to combine the stiffnesses of various
wall lines into a story stiffness. Often such a calculation requires a thorough structural model beyond the normal scope of IEBC A4. Recognizing this, Section 2.1.3 of the Framework allowed engineers to use “any reasonable material and fixity assumptions … as long as similar material and fixity as-sumptions are made for the two stories be-ing compared” (Berkeley B&S, 2006), an approach borrowed essentially verbatim from the SEAOC-written commentary to the 2003 IEBC (ICC, 2005, Section A402). In other words, actual absolute stiffness values were not considered as important as relative stiffness, which could be approxi-mated any number of ways.
Not surprisingly then, the stiffness cal-culations varied widely in technique and in results for both the full database of 52 buildings and for the 39 buildings from the 1950s and ’60s. Firm A (see Table 4-1) and a few other firms applied a code-based formula for wood shear walls from 1997 UBC Standard 23-2 (now found in IBC Section 2305.3). This empirical formula, while cited specifically by IEBC A4 (Sec-tion A403.11.2.1) for the design of retrofit elements, does not apply directly to non-wood walls. Firm B appears to have applied (inscrutably) an approximation based on FEMA 356 (ASCE, 2000). Two firms made approximations based on the proportions of wall piers; while rational, these assume connections and load path elements that often do not exist. The rest of the firms es-timated the relative stiffness of adjacent

29
Soft Story Risk Reduction: Lessons from the Berkeley data
stories simply by comparing the lengths of wall piers and wall lines. Given their wide variety, we did not attempt to track the details of stiffness calculations, which do not figure into DCR values. Suffice it to say that SSR calculations, which compare the stiffness of the ground story to the second story, will reflect any errors in the stiffness approximations.
Strength. Strength calculations are in some ways as difficult and unreliable as stiffness calculations. Obsolete, non-engineered ma-terials, often with incomplete load paths, provide unknown actual strengths; those strengths degrade under cyclic earthquake loading; and different wall types reach their strengths at different displacement levels and are thus not easily combined. Since strength values figure importantly in both WSR and DCR calculations, and because the DCR calculations rely on absolute, not relative, values, we tracked the various as-sumptions used in the 39 reports.
Strength is calculated separately for each of a building’s two principal directions and is a function of:
Which walls are counted or ignored
What unit strength is assigned to each wall length
How the strength is adjusted to ac-count for door and window openings, weak connections, and simultaneous gravity loads.
•
•
•
All three of these considerations were han-dled in a variety of ways by the Berkeley re-ports, further reducing the comparability of findings.
The first item is about how walls and parti-
tions of different materials and configura-tions contribute strength to the building. Neither the Berkeley Framework nor IEBC A4 gave any guidance on this point, though both documents might have led to incorrect or incomplete calculations (as discussed further in Sections 4.2 and 4.3 of this re-port). Perhaps as a result, the engineers in the Berkeley program made a variety of judgments about which wall types and combinations to include, leading to wide discrepancies in capacity and DCR calcula-tions. This is a fundamental issue that af-fects results using almost any evaluation methodology. It is further discussed and il-lustrated in Section 4.1.3 and Section 5 of this report.
The third item above is about how a length of wall resists earthquake-induced forces. If the wall forming one side of a building is penetrated by a series of doors and win-dows, how much of that wall line should you count toward its strength? The strength is certainly less than it would be if there were no openings at all, but do the wall segments between openings act independently, or do they act as if connected to each other by the pieces of wall above and below openings? If the segment between two openings is only, say, 12 inches wide, should you count it? The Framework gave no guidance on this question. IEBC A4 (Section A403.11.2.2) explicitly allows shear walls to be designed for continuity around openings, but its pro-visions are focused more on retrofit ele-ments, not existing walls, and require rein-forcing details around the openings. FEMA P-807 (discussed more fully in Section 5 of this report) provides explicit adjustment factors for openings and overturning, re-flecting the state of practice in 2012.
None of the reports we reviewed made any consideration for openings, load path, or overturning. Instead, the engineers con-

30
Soft Story Risk Reduction: Lessons from the Berkeley data
sidered only the full-height wall segments between openings and ignored any benefits of continuous framing for a whole wall line. In some buildings, this simplification had the effect of underestimating and possibly misallocating capacity, affecting both WSR and DCR calculations. These errors are dis-cussed further in Section 5 of this report.
Finally, the second item above also brought variation into the capacity calculations. Again, neither IEBC A4 nor the Framework document prescribed a set of unit strengths for the full range of materials encountered, so engineers were left to find values from other sources. As with the building element weights, we databased samples from each firm, not each building. Table 4-7 shows the range of values used. Recall, per Table 3-2, that wood structural panels were reported in only 19 of the 39 buildings. The values used were reportedly taken or derived from building codes for new construction (dat-ing, variously, from 1994 through 2007), from ASCE 31 (ASCE, 2003), from FEMA 356 (ASCE, 2000), and from IEBC Table A4-E. For wall lines sheathed with more than
Sheathing type a Firms sampled
Reports sampled
Min. Max. Average Standard deviation
Median
Stucco b 7 11 75 275 180 59 200Gypsum board b 8 10 50 100 72 14 75WSP, 8d@3” c 4 4 430 490 475 30 490WSP, 8d@4” 3 3 380 384 381 2 380WSP, 8d@6” 6 7 220 280 246 22 240
a. Values shown are those reported for one-sided sheathing on wood studs. Combinations of sheathing materials, either on the same side or on opposite sides of framing, are not included in the table.b. Only non-zero strength values are considered in this table (see text).c. WSP indicates wood structural panels. 8d@3”, for example, indicates assumed or field-confirmed edge nailing with 8d nails at 3-inch spacing.
Table 4-7 Shear wall allowable unit strength [plf] used in reports for 1950s-’60s buildings
one material, the methods used to combine unit values were equally varied.
For existing wood structural panels, Table 4-7 shows some uniformity, at least for the assumption of WSP sheathing on one side of a framed wall segment. For stucco and gypsum board, however, the table shows a relatively wide range of values. Further, the table does not include the several cases where stucco or gypsum board were as-signed zero strength based on a misread-ing of IEBC A4 (discussed in Section 4.2 of this report). Of course, even where these materials were assigned some strength, the walls or partitions in question might not have been included consistently (see Sec-tion 4.1.3).
For calculating WSR, as long as similar as-sumptions are made for each story, the as-sumed unit strength of the walls will tend to cancel out. For DCR calculations, however, the absolute value of the strength is signifi-cant. Of interest here is not only how that strength compares to seismic demands, but how the values derived through the

31
Soft Story Risk Reduction: Lessons from the Berkeley data
judgment of multiple engineers compare to a single set of values prescribed in more current sources, such as FEMA P-807. Fig-ure 4-3 makes this comparison using data sampled from 37 reports by 21 engineering firms. Each data point shows the ultimate strength that would have been assigned to the reported wall type by FEMA P-807 ver-sus the allowable strength value used in the report. Wall types that include wood struc-tural panels are tracked separately from those that do not.
In general, Figure 4-3 shows a rational trend – wall types for which higher allowable strengths were assumed would also have been assigned higher ultimate strengths by FEMA P-807 – but details point to signifi-cant scatter and inconsistency in the capac-ity calculations:
• As noted above, some firms as-sumed no strength for wall types that FEMA P-807 would assign ultimate strengths of 200 plf or higher.
The conclusion to draw from Table 4-7 and Figure 4-3 is that consistent findings can only be achieved with a clear protocol for assigning strength values. Further, even if the Berkeley Framework had prescribed values, a different protocol, such as FEMA P-807, might reach rather different conclu-
sions. For WSP walls, IEBC A4 generally as-sumes that strength values will be derived (or simply taken) from values used for new construction. This is theoretically trouble-some, since the new construction values assume quality con-trol and detailing that might not be present in existing buildings. Even FEMA 356, de-veloped especially for existing buildings with obsolete condi-tions, did not provide default values for
As shown in Table 4-7 as well, the re-ports frequently used a strength of 200 plf for stucco or plaster sheath-ing. FEMA P-807, however, would have assigned those same wall types strengths ranging from 333 plf to nearly 1,000 plf, significantly chang-ing the total strength contributions of these non-WSP elements.
FEMA P-807 prescribes a strength of 836 plf to WSP sheathing with 8d nails at 6 inches. For this nominal construction, the reports used allow-able strength values ranging from 200 to 320 plf (ignoring the two out-liers at 400 and 510 plf, for which nailing details were not reported).
•
•
0
200
400
600
800
1000
1200
1400
1600
1800
2000
0 100 200 300 400 500 600
FEMA P‐80
7 Ultimate Strength [p
lf]
Allowable Strength Used [plf]
Non‐WSP
WSP
Figure 4-3 Ultimate strength prescribed by FEMA P-807 v. allowable strength used

32
Soft Story Risk Reduction: Lessons from the Berkeley data
WSP walls. Perhaps one of the first ben-efits from FEMA P-807 will be its protocol for assigning strength values to obsolete conditions without having to resort to the building code.
4.1.3. Twin study. The last two subsec-tions described significant variability in how the Berkeley reports calculated seis-mic demand and seismic capacity in os-tensibly similar buildings. The variability is illuminating with respect to engineering practice and instructive to jurisdictions try-ing to craft mitigation programs. Of course the variability is important also to the in-dividual building owners whose properties might have been evaluated with incorrect or unduly conservative procedures. But with so many parameters involved in the calculations, error or conservatism in some of them can offset assumptions about oth-ers, leading to something of a reversion to the mean. To look at the effect of variabil-ity on the bottom line of specific building evaluations – the DCR, WSR, and SSR cal-culations – we need to trace the cumulative effects of the many assumptions.
Interestingly, among the 39 1950s-’60s
buildings are two that are essentially iden-tical but were evaluated by different engi-neering firms. A close look at these twin buildings and their reports can tell us much about the nature of engineering in the Berkeley program and the sensitivity of typical buildings to variations in practice.Figure 4-4 shows a street view of the two buildings. They were evaluated by the firms designated Firm A and Firm B in Table 4-1. For this report, the two buildings and re-ports are designated A853 and B854. Each is a two-story building with non-WSP walls and a large ground floor parking area ac-cessed through ample openings on one of the long-side walls. The parking area takes up 55 percent of the first floor area. Ac-cording to the approved reports, A853 was built in 1959, and B854 was built in 1961. Though not reported as such, their obvious similarities and their location on adjacent lots with a shared driveway suggest they were built by the same developer from es-sentially a single design.
Figure 4-5 (next page) shows the first and second floor plans and wall layouts of Building A853, shown on the left in Figure 4-4. Building B854’s plan is a mirror image
Figure 4-4 Essentially identical buildings, A853 and B854 (Google maps, December 2011)

33
Soft Story Risk Reduction: Lessons from the Berkeley data
of A853’s. Each building has five residential units on the second floor and two units and an open parking area on the first floor.
Table 4-8 (next page) compares the as-sumed or calculated values from the build-ings’ respective reports. Observations regarding seismic demand and capacity calculations:
•
Figure 4-5 Floor plans of Building A853 (Source: Berkeley Report A853). Top: second floor. Bottom: first/ground floor. Shaded areas indicate a typical residential unit (second floor) and the open park-ing area (first/ground floor).
The two reports were very close in their estimates of building weight, differing by only about 4 percent.
The two reports calculated nearly identical seismicity, and both used the same R-value of 5.5 (improperly, since the buildings do not have WSP walls, as discussed above). However, as discussed in Section 4.1.1, Firm A used the simplified code equation for demand, taking the value F con-servatively as 3.0. This led directly to
a 20 percent higher base shear ratio and, together with the slightly higher weight estimate, a 26 percent higher total demand, V (34 k v. 27 k).
The two reports differed significantly in terms of seismic capacity. They used similar values for the strength of pe-rimeter stucco walls, but Report A853 used twice the unit strength for inte-rior gypsum board partitions.
•
•
But if the reports assumed somewhat dif-ferent unit strengths, their judgments about which walls to count and which to ignore had a vastly greater effect on their most ba-sic findings. Figures 4-6 and 4-7 (page 36) illustrate the wall lengths that each of the two reports counted when calculating first and second story strength. Report A853 counted three perimeter wall lines (inexpli-cably ignoring the short street-facing side) and nearly every interior partition in both

34
Soft Story Risk Reduction: Lessons from the Berkeley data
Report A853 Report B854Roof tributary weight 73 k 73 k2nd floor tributary weight 103 k 96 kTotal weight, W 176 k 169 kCode demand factor, F 3.0 2.5Seismicity, Ca * Na 0.65 0.66Structure parameter, R 5.5 5.5Base shear ratio, V/W 0.267 0.225ASD demand, V/1.4 a 34 k 27 kPerimeter wall allowable unit strength 150 plf 175 plfInterior wall allowable unit strength 150 plf 75 plfLong DirectionPerimeter wall total length 99 ft 105 ftInterior wall total length 50 ft 0 ftFirst story strength 22 k 18 kAggregate DCR 1.56 1.49Weak story ratio b 0.89 1.22Soft story ratio b 0.74 1.28Short DirectionPerimeter wall length 19 ft 22 ftInterior wall length 110 ft 48 ftFirst story strength 19 k 12 kAggregate DCR 1.80 2.22Weak story ratio b 0.74 1.39Soft story ratio b 0.73 1.31
a. Both reports used allowable (as opposed to ultimate) strength values and therefore converted the base shear V from an ultimate level to an allowable strength level with a conventional factor of 1.4.b. Green/red shading indicates WSR and SSR ratios greater/less than the limits used by IEBC A4 to indi-cate a deficiency: 0.8 for WSR, 0.7 for SSR. A lower ratio indicates a more serious irregularity or deficiency.
Table 4-8 Assumed and calculated values for twin buildings A853 and B854
stories. By contrast, Report B854 ignored every interior partition but one (which aligned with a stucco wall below and might have been needed to meet a diaphragm span limit) and even discounted the short-direction wall through the parking area. Both reports counted only full-height wall segments and ignored any interaction of segments separated by door or window openings.
Table 4-8 gives the calculated demands and first story DCRs for each building in each direction (a higher DCR, especially if greater than 1.0, indicates a more serious deficiency):
• Report B854 considered more of the perimeter walls and assigned them higher strengths. But because it ig-nored the interior partitions, Report

35
Soft Story Risk Reduction: Lessons from the Berkeley data
Figure 4-6 Walls included in strength calculations by Report A853. Top: second story. Bottom: first/ground story. Allowable strength used: 150 plf for both perimeter and interior walls. (Background from approved report.)
Figure 4-7 Walls included in strength calculations by Report B854. Top: second story. Bottom: first/ground story. Allowable strength used: 175 plf for perimeter walls; 75 plf for interior walls. (Back-ground from approved report.)

36
Soft Story Risk Reduction: Lessons from the Berkeley data
•
Unlike DCR, WSR and SSR are independent of demand; they merely compare the capac-ity of the first story to the capacity of the second story. Table 4-8 shows eight values calculated based on reported capacity esti-mates: one for each ratio, in each direction, for each building. Observations:
Seven of the eight values are accept-able by the IEBC A4 definitions (as indicated by green shading in the Table 4-8). Despite the visually sug-gestive tuck-under parking area and the open long side, the only calcu-lated SWOF deficiency is in the short direction.
Judgments about whether to count interior partitions affected the WSR and SSR calculations. The decision to count partitions in Report A853 led
Clearly it is impossible to conclude much about either of these buildings without a thorough vetting of the assumptions made by each report – assumptions that in isola-tion appear rational, if not perfect.
4.2 Implementing the technical criteria
The previous section describes the effects of judgments made by engineers participat-ing in the Berkeley program. This section discusses the judgments made for them and their clients, the building owners, and by the city.
The Berkeley program involved five techni-cal decisions by the city and its consultants, some for the program as a whole and some for individual buildings:
B854 actually calculated a signifi-cantly lower first story strength: 18 k v. 22 k in the long direction, 12 k v. 19 k in the short direction.
The lower assumed strength – a di-rect result of decisions about how to account for partitions – led to high-er DCR values. Even though Report A853 used a 26 percent higher de-mand, Report B854 found a 23 per-cent higher DCR in the short direc-tion: 2.22 v. 1.80.
Both reports found higher DCRs in the short direction, despite the SWOF indicator of an open long side (1.80 v. 1.56 and 2.22 v. 1.49). This is a result of the nearly solid long-direction first story wall at the back of the parking area, and it suggests a shortcoming in our presumptions about SWOF buildings and possibly in the IEBC A4 definitions of weak story, soft story, and open front deficiencies.
•
•
to ratios less than 1.0 because the open first story has so many fewer. Report B854 made the opposite decision, ignored the second story partitions, and found ratios greater than 1.0, suggesting that even with the large open parking area, the first story was still actually stronger and stiffer than the second story.
Including partitions (Report A853) found the short direction somewhat worse (with lower ratios) than the long direction. Ignoring partitions (Report B854) found the opposite: the short direction had the higher DCR but, counterintuitively, had low-er WSR and SSR.
•
•
• Creation of the inventory of subject buildings
Removal of false positives from the initial list
•

37
Soft Story Risk Reduction: Lessons from the Berkeley data
Creation of the inventory. Rabinovici (2012) discusses how the inventory process repre-sents an informal policy decision regard-ing acceptable and actionable risks. While crucial to the overall success of Berkeley’s program, the process of creating the initial building list and maintaining it as an inven-tory is not a primary subject of this study, since we have limited our review to the ap-proved reports, which were only produced for buildings that made it to the list and were not exempted. Nevertheless, the use of visible indicators to create the initial list is worth noting.
The initial list was generated in 1996 from Sanborn maps, county assessor data, and a block-by-block visual “sidewalk survey” made over the course of several months (Rabinovici, 2012). Berkeley is small enough that a list of suspect addresses could be produced from a sidewalk survey with judgments made based on the look of each building. As noted in Section 3.1, how-ever, this method appears to have missed some buildings. Without full access to the properties, and prior to the easy availabili-ty of satellite imagery, the visual survey was limited to information visible from public areas. Obstructions, or just human error, would likely have caused some buildings to be missed while similar buildings were listed. The actual rate of false positives, however, suggests that conservative as-sumptions were made, and misses for this reason, such as those noted in Section 3.1, might have been few.
In addition, to the extent that visible indi-cators actually fail to predict deficiencies, their use as the basis for the initial list might have omitted a number of buildings that, while perhaps not classic SWOF con-ditions, are likely to perform as badly or worse. Each building has two principal di-rections, and an evaluation must consider both of them. As shown in Sections 4.1 and 5.2 of this report, analysis can reveal what visible indicators might not – that the critical direction is generally the shorter direction, regardless of which side pres-ents as a stereotypical SWOF condition. Further, as shown in Section 5.1, simple indicators have essentially no useful cor-relation with the calculated results of an IEBC A4 evaluation.
Interestingly, while the Berkeley ordinance applies to all buildings of the right age, size, occupancy, etc. (Section 19.39.020), pro-gram implementation relied on develop-ment of an inventory (Section 19.39.040) and notification of owners by the Building Official (Section 19.39.050). Thus, if a build-ing was inadvertently left off the list, its ob-ligation to comply is unclear from a plain reading of the ordinance. Resolution of this issue is beyond the scope of this study. The point here is that buildings missed by the initial inventory effort might have implica-tions for the program’s completeness.
Removal of false positives. As with creation of the inventory, the process of culling it is not a primary subject of this study. Never-theless, it is interesting to note, as Table 3-1 shows, that nearly 30 percent of the listed buildings were false positives, even-tually exempted for one reason or another. Rabinovici (2012) discusses how the error rates, both false positives and false nega-tives, reflect on the legitimacy of the city as the proponent of a mitigation program.
Selection of IEBC A4 as the basic technical criteria
Development of the Framework document
Review and approval of submitted reports.
•
•
•

38
Soft Story Risk Reduction: Lessons from the Berkeley data
Selection of IEBC A4 as the basic technical criteria. At the time, IEBC A4 was the obvi-ous choice for a SWOF-targeting program. It was practical, focused on a single building type. It was enforceable, written in “code language.” It had the support of the technical community, having been developed by California engineers af-ter the 1994 Northridge earthquake, maintained by a committee of the Struc-tural Engineers Association of California, and adopted into a national model code, the International Existing Building Code or IEBC. And it had political imprimatur as well, having been referenced by the California Health and Safety Code through 2005 legislation proposed by Loni Hancock, Berkeley’s Assemblymember and former mayor (California Health and Safety Code, Sections 19160-19168).
And yet, IEBC A4 is primarily a guide for retrofit design, not for evaluation of exist-ing conditions. Its definitions of triggering deficiencies – soft, weak, or open front wall lines – are perhaps good enough to de-scribe or confirm the problem being solved by an intended retrofit, but they are not de-veloped fully enough in the chapter’s provi-sions to guide a thorough evaluation. (See the Terminology section of this report for further discussion.)
Further, because IEBC A4 focuses on retro-fit, its provisions regarding wall capacity and overall structural system performance are better suited to new retrofit elements than to obsolete existing construction. IEBC A4 generally treats retrofit elements like new construction, for which standard code equations and design parameters exist. For existing elements of obsolete or unknown construction, however, any qualified engi-
neer can derive the necessary values, but there is no single method applicable in all cases. Sometimes extremely detailed and precise calculations are called for; some-times rough estimates will do. One of the
engineer’s responsibilities is to select the techniques that suit the building, the project, and the client. As-sumptions, simplifications, and judgment are typically, and properly, applied. For consistency over many buildings, however, a more thorough code or evalua-tion guideline might be bet-
ter. Specific issues critical to evaluation (as illustrated in Section 4.1 of this report) but not addressed in IEBC A4 include:
• How to quantify an open front con-dition. As shown in the example of Section 4.1.3 (and in Section 5.2), an obviously suspect building can calcu-late as having no official weak or soft story, so the open front deficiency needs to be reliably identified. But as noted in the Terminology section of this report, the IEBC A4 definition is vague, based on an arbitrary rule of thumb presumed to indicate where “diaphragm rotation or excessive cantilever” is needed. IEBC A4 has no provisions to quantify the resistance of diaphragms and perpendicular walls to those effects.
How to reliably calculate the capac-ity – strength and stiffness – of an existing wall line or story. In the ab-sence of IEBC A4 rules, this requires judgment regarding:
IEBC A4 is primarily a guide for retrofit design, not for eval-uation of existing conditions.
•
o Which wall segments or parti-tions to count, and which to ig-nore, based on relative stiffness, fixity, and load path adequacy.

39
Soft Story Risk Reduction: Lessons from the Berkeley data
o
Which construction types to count, which to ignore, and how to combine them. In par-ticular, whether and how to combine the contributions of such disparate materials as stucco, gypsum board, and wood structural panels.
How to account for openings in wall lines.
How to account for overturn-ing resistance, or lack of it.
o
o
How to assign unit strengths to ma-terials such as stucco and gypsum board. 2003 IEBC Table A4-E pro-vides some values for “crosswalls” but is not cited from the chapter’s provisions. To confuse matters, Sec-tion A403.11.1 reads, “Gypsum or cement plaster products shall not be used to provide lateral resistance in the soft or weak story,” but this pro-vision is a conservative simplifica-tion for designing retrofit systems, not for evaluating existing condi-tions. The 2006 IEBC commentary is clear that these “nonconform-ing structural materials” should be counted toward story strength (ICC, 2007, Section A402). As for existing wood structural panels, which can be just as obsolete in their detailing as stucco or gypsum board, Table A4-E gives no values. Table A4-B then adds confusion by giving strength values, but these are for use in a non-binding “quick check” (which was removed in the 2006 edition), not for a detailed evaluation.
How to apply the provisions to crip-ple walls or wood-framed first floors. Several Berkeley buildings from the
1950s-’60s were built with a split level first floor: Concrete slab on grade for the parking area; wood-framed floor over wood cripple walls or concrete stem walls at the first floor residential units.
Finally, because IEBC A4 is focused on ret-rofit and references procedures for the design of new buildings, its use for evalu-ation – even if done consistently – can be said to miss the critical attributes of a collapse-prone SWOF condition. IEBC A4 references (and engineers on the Berke-ley program without exception used) the building code’s linear static procedure and default formulas for structure period and vertical force distribution. These are tech-nically justified only for buildings that are regular both in plan and over their height, but SWOF conditions are neither. Their ac-tual performance involves torsion in plan, concentrated deformations within a single story, and in many cases, extreme redistri-bution of internal forces from over-loaded short wall lines. A linear procedure might be used to spot a SWOF condition, which is all IEBC A4 really hopes to do, but it would be hard pressed to quantify performance in terms of DCR, drift, or ductility demands. How much this affected the findings of the Berkeley program is unclear, since the buildings were pre-selected as deficient, and it was no surprise to find them so, even by flawed calculations. Specific quantitative findings – DCR, WSR, or SSR, especially for specific wall lines – are suspect, however. This topic is addressed further in Section 5.2 of this report, where the pseudo-non-linear procedure of FEMA P-807 is applied.
Development of the Framework document. This was a wise decision, especially con-sidering the relative newness of IEBC A4 (which has a much shorter history than the building code for new construction). For a
•
•

40
Soft Story Risk Reduction: Lessons from the Berkeley data
program mandating hundreds of evaluation reports by possibly dozens of engineers over several years, consistency is far easier to achieve by setting rules and expectations up front, rather than enforcing them ad hoc, one by one, during the review process. Nev-ertheless, the Framework did not anticipate all the gaps in IEBC A4 that would ultimate-ly lead to inconsistent and sometimes in-correct reports. This is perhaps less a flaw in the initial Framework than an example of optimistic program management. In hind-sight, the Framework might have been re-vised or supplemented as early reports re-vealed new issues.
A list of issues not fully addressed by the Framework would start with the list of is-sues not fully addressed by IEBC A4 and with the list of building code parameters subject to wide ranging engineering judg-ment, discussed in Section 4.1 of this re-port. Again, the variability of reasonable as-sumptions and conservative simplifications might be acceptable on individual projects where the owner’s priorities set the scope (and where caveat emptor applies), but it didn't help the city measure the results of its ordinance in a consistent way. Addition-al observations about the Framework:
Regarding calculation of wall strength and stiffness, the Frame-work followed the lead of the 2003 IEBC A4 commentary, allowing that any set of reasonable assumptions may be used in the calculations, as long as they are applied consistently to both of the stories whose capaci-ties are being compared. However, as Table 4-8 shows, internally con-sistent assumptions can still lead to significantly different and possibly incorrect or misleading results.
The Framework added some confu-
•
•
•
sion to the question of how to calcu-late story capacity by saying, in Sec-tion 1.3, that “only those wall lines that are investigated may be consid-ered part of the lateral system during the evaluation of the structure.” The intent, of course, was to prevent over-estimation of strength or stiffness that might find a deficient building acceptable. This is a common philos-ophy of codes for new construction, but it doesn’t serve the evaluation goal of quantifying what is actually in place regardless of its compliance. Where this instruction was followed, it led to significant under-counting of existing capacity.
Framework Section 2.1.1 reads, “The evaluation shall be made based on each line of resistance considered in-dependently.” Thus, the Framework directed engineers to make WSR and SSR calculations line by line, despite the IEBC A4 definitions that clearly relate these potential deficiencies to the capacity of whole stories. This in-struction was probably based on an unfortunate statement in the 2003 and 2006 IEBC A4 commentaries that recommended a line-by-line compari-son. That commentary, however, re-flected the understanding that IEBC A4 was primarily about retrofit, so its evaluation provisions were expected to be simple and incomplete. The rea-son a line-by-line procedure is wrong, aside from being counter to IEBC A4’s own definitions, is that it misses the point of the open front wall line; the deficiency is not that a particular wall line has openings but that the next wall back might be overstressed as a result. Thus any check of an individual wall line should be focused on the wall that is there, not the wall that’s miss-

41
Soft Story Risk Reduction: Lessons from the Berkeley data
ing. The fact that it’s missing is just an indicator. Nevertheless, the Frame-work’s instruction, enforced rigor-ously by the city’s plan checker, led to meaningless calculations of extremely high DCRs or extremely low SSRs and WSRs for elements that didn’t exist or were obviously immaterial to the per-formance of the structure. These are phantom deficiencies that draw at-tention from the actual problems and sometimes condemn buildings that are not that bad.
Though not a subject of this study, the Framework gave potentially conflict-ing instructions about the required scope of retrofit design. In Section 3.1, it instructed the engineer to “cre-ate a strengthening program to rem-edy the deficiencies determined in Section 2.1.3,” which would have in-cluded overstress or excessive drift in the second story of a three-story building. In Section 4.1, however, the Framework refers to “the strength-ening that would be required to elim-inate the soft, weak, or open front wall line concern,” which would only have required work in the first story.
•
•
Review and approval of submitted reports. Use of a single outside plan check firm to re-view submitted reports was another good decision, though likely one of necessity, giv-en the anticipated volume of extra work the program would have meant for the build-ing department’s staff. As the Framework left unresolved some problems in IEBC A4, so did the plan check process reinforce the Framework. As in any new, large program, there was a learning curve for the building department, for the plan checkers, and for the engineers producing and submitting re-ports. The plan check process does appear, however, to have exacerbated some prob-
The approved reports varied quite a bit in their thoroughness. Anecdot-ally, some reports appeared quite thorough on technical points, but the engineers were still asked to provide more information, for example re-garding the building’s history. Mean-while, other reports appeared spare, even incomplete, the engineer ap-parently having learned exactly what was the minimum necessary for ap-proval.
One of the most confusing aspects of the 2003 edition of IEBC A4 was its inclusion of four checklists (Tables A4-A through A4-D) that had essen-tially no relationship to the actual provisions of the code chapter. These were removed from the 2006 edi-tion, but the program stayed with the 2003 document. The Framework was clear, in Section 2.1.2, that “[t]hese tables are not meant to be a check-list of items to be strengthened.” Yet the plan checker appears to have reviewed each report’s check-list findings thoroughly, sometimes withholding approval until all these non-substantive potential deficien-cies were addressed, and did not ob-ject when engineers addressed them with retrofit recommendations. Thus, by unduly focusing on these checklists, the plan check might have created extra work and additional confusion for some engineers and owners.
The Framework’s mistaken instruc-tion to do SSR and WSR calculations on a line-by-line basis probably con-tributed to the plan checker’s some-time insistence on calculating the
•
•
lems. Some observations about the plan check process:

42
Soft Story Risk Reduction: Lessons from the Berkeley data
DCR for a story by averaging, not ag-gregating, the DCRs from individual lines. This practice propagates the effects of meaningless DCR calcula-tions for non-contributing wall lines. It mistakenly applies the convention-al design simplification that assumes seismic forces are distributed to wall lines by tributary area alone.
The plan check process allowed the engineering reports to ratchet to-ward conservative recommenda-tions beyond the immediate intent of the program and even at odds with the reports’ own analytical results. Of the 39 reports for 1950s-’60s build-ings, 10 found no calculated SWOF condition in either direction. Yet nine of those ten recommended retrofit. Reports A853 and B854, discussed in Section 4.1.3 of this report, are good examples. By its own calculations, Report A853 found no SWOF condi-tion (the SSR and WSR values in Ta-ble 4-8 were calculated by us); nev-ertheless, it recommended retrofit in both directions. Report B854 found no SWOF condition in either direc-tion but called for retrofit in the long direction, presumably because of the visually apparent open front. In oth-er cases, reports recommended sub-stantial retrofit based only on DCR values, even though no SWOF condi-tion was identified. In at least one re-port, the engineer recommended in-stallation of wood structural panels simply because the building lacked them, even in a non-SWOF direction. In addition, many reports recom-mended adding hold-down hardware to existing walls or beefing up exist-ing footings.
This last point, about recommendations
•
reaching beyond the calculations, raises interesting questions. Allowing over-con-servatism at the engineer’s discretion is commonplace for new construction based on the building code, but it perhaps led to confusion on this project where the city intended to learn about its building stock, not regulate voluntary work one building at a time. Again, reasonable practices in one context appear to have led to less ideal out-comes – less consistency, less certainty, less measurability – in a different one.
Rabinovici (2012) has shown that under the right circumstances, new knowledge about specific hazards can motivate own-ers to undertake voluntary retrofits. To the extent that cautious recommendations lead to voluntary retrofit, perhaps the city, and even the reluctant owners, achieve a net benefit not intended by the program. Given the inconsistent assumptions and simpli-fications throughout the reports, who’s to say that each engineer is not entitled to make his own recommendations to his own clients even in the context of an ordinance? Of course, a counter argument can be made that over-conservative recommendations hurt the cause of careful, targeted mitiga-tion. Whether a city is right to endorse pri-vate over-conservatism as a public strategy, or even just look the other way in the name of laissez faire, is a policy question outside the scope of this study. The Berkeley pro-gram, no doubt with good intentions, ap-pears to have induced this ratcheting.

43
5. Building Evaluation
This section looks at the actual findings for the 39 1950s-’60s buildings. Section 5.1 considers our initial objective: to find reliable indicators of calculable SWOF de-ficiencies. Section 5.2 considers why we found none. The evaluation methodology of FEMA P-807 is applied as a way of correct-ing for the wide-ranging assumptions and simplifications in the 39 reports’ applica-tions of IEBC A4.
5.1 Predicting evaluation results with SWOF indicators
Of the 39 reports, 29 calculated a soft story or weak story deficiency and all calculated a first story DCR greater than 1.0 in at least one direction. The question here is whether those results could have been predicted by simple indicators. If reliable indicators can be identified, they could form the basis of inexpensive inventory and screening tools.
We calculated six values for each of the 39 buildings: SSR, WSR, and first story DCR in each of two directions. (In many cases our calculated values were corrections to re-ported values because, as discussed above, the reports made calculations on a line-by-line basis, whereas the metrics of interest in-volve whole stories.) As discussed in Section 4 of this report, variability in the reports’ stiffness calculations made the SSR values essentially non-comparable from one build-ing to another, so SSR was discarded as a pa-rameter for this study. The minimum WSR from either direction and the maximum DCR from either direction thus represented the results of each building evaluation. These are the values we are trying to predict with relatively simple indicators.
We calculated the following parameters for each building as potential predictors of WSR or DCR:
The maximum percentage of open perimeter wall length along any sin-gle side. This captures the commonly cited visible indicator of “garage doors and storefront windows.” The value ranges from 0 percent to 100 per-cent, in 10 percent increments.
The maximum percentage of open perimeter wall length in either di-rection. This is the sum of the per-centages for two parallel sides of the building; the larger sum from either of the two directions was taken as the critical value. The value ranges from 0 to 200 percent, in 10 percent increments.
The percentage of open ground floor area. This compares the non-residen-tial area (typically the parking area) to the total ground floor area. Some judgment was used in discerning the open area in question; in general, the open area included any contiguous portion of the ground floor with inte-rior partitions in a pattern architec-turally distinct from the residential units directly above.
The area/wall length ratio for the en-tire first story. This is the total floor area (that is, all levels) divided by the sum of all perimeter wall lengths in the first story, in both directions, discounted for wall openings. Only the perimeter walls were considered.
•
•
•
•

44
Soft Story Risk Reduction: Lessons from the Berkeley data
While this misses the potentially significant contributions of interior partitions in the first story, includ-ing those partitions would probably make this indicator unusable for sidewalk screening and would raise the usual tricky questions about which partitions to count, how much inspection is necessary, etc.
The area/wall length ratio for the first story in the critical direction. The ratio of total floor area to wall length was calculated separately for the group of perimeter walls in each direction. The larger of the two ratios was taken as the critical value.
•
Figures 5-1 through 5-3 (next page) show the relationships between three of the po-tential predictors and each of the two evalu-ation products. (Plots for the other two pre-dictors, the maximum open length on any single side and the area/length ratio for the entire first story, did not show any stronger relationship, so they are not shown here.) Each plot separates the two-story buildings from the three-story buildings as discussed in Section 3. For each data set a best-fit lin-ear regression, with R2, is also shown.1
In Figures 5-1 through 5-3, if the hypo-thetical predictive relationship existed, we would expect to see the regression lines in the DCR plots (the left side of each figure) slope up to the right, and the lines in the WSR plots (on the right) slope down to the right. Clearly, this is not the case, as some of the regression lines even show the opposite slope. More important, only two of the 12 relationships have R2 values greater than 0.1, and those two (the three-story DCR
lines in Figures 5-2 and 5-3) are only 0.39 and 0.41.
The conclusion from Figures 5-1 through 5-3 is that none of the hypothesized indi-cators can predict either DCR or WSR well enough to form the basis of a screening tool. Given the variability in the DCR and WSR calculations discussed in Section 4, is it possible that values calculated more con-sistently would yield stronger predictive relationships than those in Figures 5-1 through 5-3? Yes, it is possible. As shown in Table 4-8, different choices about which walls to count toward story capacity can change the calculated WSR from less than 1.0 to more than 1.0. To check this, we could adjust all of the reported WSR calculations to reflect consistent choices about which walls to count and what strengths to assign them. This would be an arduous task even if the reports provided all the necessary data. We can get at least a sense of the effects of consistent capacity calculations, however, from analyzing a few representative build-ings; see Section 5.2 of this report.
While the reported capacities would be hard to adjust for consistency, the reported demands are not. We calculated adjusted DCR values by replacing the reported val-ues of F, Ca * Na, and R with uniform values of 2.5, 0.660, and 5.5 respectively (see Sec-tion 4.1.1). The most promising DCR re-lationships from Figures 5-1 through 5-3 were then re-plotted based on adjusted DCRs. The impact was minimal:
For DCR v. percent open ground floor area (Figure 5-2, left), the three-story
•
1. The R2 value indicates the strength of the hypothesized relationship. An R2 value of 0.3, for example, means the indicator (plotted on the horizontal axis) explains 30 percent of the variation in the predicted value (plotted on the vertical axis). Generally, an R2 value of at least 0.5 is desired for a useful predictive relationship.

45
Soft Story Risk Reduction: Lessons from the Berkeley data
R² = 0.0246
R² = 0.0172
0.00
2.00
4.00
6.00
8.00
40 80 120 160 200
R² = 0.0013
R² = 0.0074
0.400
0.600
0.800
1.000
1.200
1.400
1.600
40 80 120 160 200
R² = 0.0056
R² = 0.3915
0.00
2.00
4.00
6.00
8.00
0% 20% 40% 60% 80% 100%
R² = 0.0643
R² = 0.0058
0.400
0.600
0.800
1.000
1.200
1.400
1.600
0% 20% 40% 60% 80% 100%
R² = 0.0882
R² = 0.4079
0.00
2.00
4.00
6.00
8.00
0 100 200 300 400 500 600 700 800
R² = 0.0071
R² = 2E‐05
0.400
0.600
0.800
1.000
1.200
1.400
1.600
0 100 200 300 400 500 600 700 800
Figure 5-1 Maximum DCR and minimum WSR v. Percent open first story perimeter walls in the critical direction, in 1950s-’60s buildings. Left: Mmaximum DCR. Right: minimum WSR. Blue diamond: two-story buildings. Red square: three-story buildings.
Figure 5-2 Maximum DCR and minimum WSR v. Percent open ground floor area, in 1950s-’60s buildings. Left: maximum DCR. Right: minimum WSR. Blue diamond: two-story buildings. Red square: three-story buildings.
Figure 5-3 Maximum DCR and minimum WSR v. ratio of total floor area to first story perimeter wall length in the critical direction, in 1950s-’60s buildings. Left: maximum DCR. Right: minimum WSR. Blue diamond: two-story buildings. Red square: three-story buildings.

46
Soft Story Risk Reduction: Lessons from the Berkeley data
5.2 FEMA P-807 evaluation
If SWOF conditions are so easy to spot, why do Figures 5-1 through 5-3 show such weak relationships? A few hypotheses:
• The capacity values used to calculate DCR and WSR were so inconsistent that they hide a true correlation with potential indicators.
Other irregularities and deficiencies, especially torsion and open front ef-fects, are significant but are not re-flected in conventional DCR and WSR calculations.
DCR and WSR are inadequate met-rics that do not capture actual SWOF deficiencies or collapse mechanisms because either:
•
•
They do not account for inelas-tic materials
They do not account for non-linear deformation modes, es-pecially inelastic drift
o
o
Figures 5-1 through 5-3 reflect the •
Each of these hypotheses is worth test-ing with additional study. The last would require data from buildings that were not pre-selected as likely SWOF buildings. For the others, existing reports provide much of the necessary data, but not all of it, since some reports did not provide full details of wall layout and assigned strength. Never-theless, we looked at five of the databased buildings as case studies.
To address the hypotheses above, one would need to apply consistent rules for counting, combining, and assigning strength to vari-ous wall and partition types; account for wall layout and potential torsion; account for the relative brittleness or ductility of various wall types over a range of defor-mations; and analyze each building with a nonlinear procedure in which acceptabil-ity is gauged by inelastic or total drift. As it happens, the new guideline document FEMA P-807 does exactly this.
Briefly, FEMA P-807 (FEMA, 2012) recog-nizes that SWOF conditions lead to non-linear response. But nonlinear analysis is especially complex and unlikely to be per-formed for vernacular wood buildings. The ATC 71-1 team therefore analyzed a matrix of several thousand woodframe building configurations and derived fragility curves and regression equations relating calcu-lable structural attributes to a probability of failure. To use the methodology, an engi-neer needs only to characterize the build-ing and apply the regression equations, thus approximating the results of a nonlin-ear analysis in probabilistic terms. Charac-
•
R2 value actually decreased from 0.39 to 0.37, and the two-story value in-creased to only 0.02.
For DCR v. area/length ratio (Figure 5-3, left), the three-story R2 value in-creased from 0.41 to 0.42, and the two-story value increased from 0.09 to 0.12.
Therefore, variability in the reports’ demand calculations cannot account for the lack of a predictive relationship between the tested indicators and DCR. If a useful relationship does exist, it is being hidden by variability in the capacity calculations.
truth: There is no significant difference between an “obvious” SWOF condition and an otherwise weak or overstressed non-SWOF building, so no indicator based on traditional SWOF ideas will predict actual performance.

47
Soft Story Risk Reduction: Lessons from the Berkeley data
terizing the building involves locating all eligible wall lines and partitions in plan, deriving wall strengths using a common set of rules and material values, and calculat-ing certain defining parameters, including a weak story ratio. (FEMA P-807 uses the notation AW for weak story ratio, but since the concept is the same and the values are directly comparable, this report uses the same acronym, WSR, for weak story ratios calculated as part of an IEBC A4 or a FEMA P-807 evaluation.)
FEMA P-807 considers issues not addressed by IEBC A4. For one thing, it allows the user to customize an evaluation or retrofit ob-jective, instead of having to comply with the pre-set (and opaque) acceptability rules of a code such as IEBC A4. Thus, FEMA P-807 can be more conservative or less conserva-tive than IEBC A4, depending on how the user sets the objective.
FEMA P-807 does not calculate a DCR per se. Instead, the results of a FEMA P-807 evaluation are a capacity, to be compared to a demand level of interest, and a corre-sponding confidence level, expressed as the probability of exceeding the specified drift limits. Among the other new ideas and ter-minology it uses are the following:
Torsion coefficient, CT. FEMA P-807 considers how the layout of walls can induce additional stresses and drifts due to torsion. The coefficient has a value between 0.0 and 1.0; the larger the value, the greater effect torsion has on the overall performance and, all other things equal, the more likely the building is to fail an evaluation.
Strength degradation ratio, CD. This factor accounts for differences in wall sheathing types, distinguishing brittle materials that fail at low drifts
•
(such as stucco) from sheathing that maintains its strength through higher drifts (such as wood struc-tural panels). CD has a value between 0.0 and 1.0; the larger the value, the more ductile the first story.
Onset of strength loss, OSL. This term represents one set of drift limits used to define acceptable performance in FEMA P-807. The OSL drift limits are said to indicate “a substantially in-creased potential for collapse” (ATC, 2012, Section 2.2.1), perhaps similar to the ASCE 41 Collapse Prevention performance level (ASCE, 2006).
Spectral acceleration capacity, Sc, and probability of exceedance, POE. These two terms work together to charac-terize the strength of the structure. Spectral acceleration capacity rep-resents the ability of the structure to resist a defined set of drift limits. It is given in terms of acceleration, as a multiple of g; the higher the value, the larger an earthquake demand, Sd, the structure can resist with the same POE. POE is the probability that the structure will perform worse than the spectral acceleration capac-ity suggests; the higher the value, the more likely the demand will ex-ceed the capacity and the structure will fail its objective. Because FEMA P-807 is probabilistic, an estimate of capacity always comes with a prob-ability of exceedance. Thus, in the ta-bles below Sc is given for a specified POE. The same information can be flipped around to give the POE that would go with a needed Sc. Thus:
•
•
•
Sc (OSL) at 20% POE means the building’s capacity for which it has only a 20 percent probability
o

48
Soft Story Risk Reduction: Lessons from the Berkeley data
Building Stories Wall types SWOF indicator RemarksA853 or B854 2 Perimeter: Stucco exterior,
gypsum board interiorPartitions: Gypsum board, two sides
Open front at long side
Described in Sec-tion 4.1.3
B826 2 Perimeter: Stucco exterior, gypsum board interiorPartitions: Gypsum board, two sides
Open front at short side
B863 2 Perimeter: Stucco exterior, gypsum board interiorPartitions: Gypsum board, two sides
None For comparison with B826
A072 3 Perimeter: Stucco plus WSP exterior, gypsum board interiorPartitions: WSP plus gypsum board, or gypsum board, two sides a
Open front at long side
E842 3 Perimeter: Stucco plus WSP exterior, gypsum board interiorPartitions: Gypsum board, two sides
Open front at short side
Table 5-1 Case study 1950s-’60s buildings selected for FEMA P-807 evaluation
5.2.1. Two-story building, long side open. Section 4.1.3 described these two buildings, designated A853 and B854. Ta-ble 4-8 and Figures 4-6 and 4-7 illustrated how decisions about which walls to include and what strengths to assign them can sig-nificantly affect the calculated WSR. Table 5-2 (next page) compares the WSR values calculated by IEBC A4 and FEMA P-807, illuminating some of the differences be-tween the two procedures. Columns A1 and B1 give the values based on assumptions in the respective reports. As discussed above, Report A reached more conservative con-clusions than Report B. Columns A2 and B2 give values using the wall lengths and loca-tions assumed by the approved reports but with material strengths assigned by FEMA
of exceeding the OSL drift limits when the capacity just matches the demand.
POE (OSL) at 1.0 g means the probability that the building will exceed the OSL drift limits given an earthquake accelera-tion demand of 1.0 g.
The following subsections give the results of FEMA P-807 analyses of five Berkeley build-ings and variations of them. The buildings were selected because they appear repre-sentative of other similar buildings and be-cause the reports included the data neces-sary for FEMA P-807 analysis. The five case study buildings are described in Table 5-1.
o
a. Presence of wood structural panels on certain short-direction interior partitions is unknown.

49
Soft Story Risk Reduction: Lessons from the Berkeley data
A1. Report A853
A2. FEMA P-807, walls per Report A853
B1. Report B854
B2. FEMA P-807, walls per Report B854
C. FEMA P-807 provisions
Long direction 0.89 1.06 1.22 1.36 0.99Short direction 0.74 0.76 1.39 1.11 0.76
Table 5-2 Weak story ratiosa calculated by approved reports and by FEMA P-807 for a two-story building with an open long side
Figure 5-4 Walls included in FEMA P-807 evaluation of Buildings A853 and B854. Top: second story. Bottom: first/ground story. Dark blue: stucco/gypsum board. Light blue: gypsum board on two sides. (Background from approved report.)
P-807. Column C gives the WSR values calculated following all the rules in FEMA P-807, for both wall inclusion and wall strength.
Figure 5-4 shows the wall lines included following FEMA P-807 provisions; dashed lines indicate openings within a single wall line. (Compare Figure 5-4 with Fig-
ures 4-6 and 4-7.) In general, FEMA P-807 counts the major interior partitions. Also, FEMA P-807 considers wall segments along the same line as part of a single wall element, then applies adjustment factors to account for openings and overturn-ing. This can result in a greater calculated strength than if only individual wall seg-ments are counted.
a. Green/red shading indicates WSR ratios greater/less than the 0.8 limit used by IEBC A4 to indicate a deficiency.

50
Soft Story Risk Reduction: Lessons from the Berkeley data
A. Walls per Report A853
B. Walls per Report B854
C. Walls per FEMA P-807 rules
D. Walls per FEMA P-807, w/ WSP
E. Fictitious wall to pass SWOF screening
Torsional propertiesEccentricity for short loads
0.7 ft 0.8 ft 1.0 ft 0.6 ft 1.0 ft
Eccentricity for long loads
5.7 ft 2.2 ft 3.7 ft 4.0 ft 1.1 ft
1st story torsional strength
1228 ft-k 844 ft-k 1640 ft-k 2652 ft-k 1774 ft-k
Torsion coefficient, CT
0.30 0.15 0.20 0.23 0.09
Long DirectionStrength degrada-tion ratio, CD
0.35 0.27 0.33 1.00 0.32
1st story strength 59 k 47 k 75 k 145 k 86 kWeak story ratio a 1.06 1.36 0.99 1.18 1.14SC (OSL) at 20% POE 0.49 g 0.49 g 0.58 g 1.56 g 0.70 gPOE (OSL) at Sd = 1.0 g
64% 63% 53% 4% 39%
POE (OSL) at Sd = 2.3 g
80+% 80+% 80+% 47% 80+%
Short DirectionStrength degrada-tion ratio, CD
0.53 0.41 0.50 1.00 0.50
1st story strength 44 k 26 k 53 k 68 k 53 kWeak story ratio a 0.76 1.11 0.76 0.83 0.76SC (OSL) at 20% POE 0.41 g 0.35 g 0.47 g 0.97 g 0.50 gPOE (OSL) at Sd = 1.0 g
76% 80+% 67% 21% 63%
POE (OSL) at Sd = 2.3 g
80+% 80+% 80+% 80+% 80+%
Table 5-3 FEMA P-807 results for variations of a two-story building with an open long side
a. Green/red shading indicates WSR ratios greater/less than the 0.8 limit used by IEBC A4 to indicate a deficiency.

51
Soft Story Risk Reduction: Lessons from the Berkeley data
Comparing Columns A1 and A2, which differ only by the strengths assigned to the various wall types, FEMA P-807 finds a somewhat high-er WSR in the long direction and es-sentially the same WSR in the short direction as Report A853. By con-trast, comparing Columns B1 and B2, FEMA P-807 finds a significantly low-er WSR in the short direction than the approved report. It’s not clear that these differences by themselves mean much, except that the material strengths prescribed by FEMA P-807 can certainly have a significant effect, for better or worse, in narrowing the engineer’s judgment.
Comparing Columns A2 and B2, we see the same sorts of differences as between the report values in Col-umns A1 and B1. That is, including the interior partitions makes a sig-nificant difference within the FEMA P-807 procedure.
Comparing Column C with Columns A1 and B1, we see that the FEMA P-807 when applied in full assesses the WSR more like the assumptions of Report A853 than Report B854, especially in the critical short direc-tion. No doubt this is due to the fact that Report A853 included contribu-tions from the first story partitions as FEMA P-807 would do, while Re-port B854 largely ignored them. That is, Figure 5-4 looks more like Figure 4-6 than Figure 4-7.
•
•
•
Observations regarding Table 5-2:
Table 5-3 gives additional results of the FEMA P-807 analyses. In addition to WSR, the table gives some of the calculated pa-rameters, such as CT and CD, and the spec-tral acceleration capacity and POE values in each direction, as described above. The two POE values correspond to hypothetical demands, one high and one relatively low. The high demand, Sd = 2.3 g, corresponds to the shaking that would be felt by a short building near Berkeley City Hall in what the building code calls the “maximum consid-ered earthquake.” The lower demand, Sd = 1.0 g, corresponds to the design-level shak-ing at a site farther from the fault, such as in San Francisco.2
In Table 5-3, Columns A and B (correspond-ing to Columns A2 and B2 in Table 5-2) give results for the wall contributions assumed by Reports A853 and B854. Except for the wall lengths and locations (shown in Fig-ures 4-6 and 4-7), all of the calculations fol-low FEMA P-807 provisions. Column C is a full application of FEMA P-807, using the wall layout shown in Figure 5-4. Thus, Col-umn C can be used to reconcile differences between the two reports for these essen-tially identical buildings. Observations:
2. In technical terms, Sd = 2.3 g is the short-period mapped spectral acceleration in the MCE at the Berkeley City Hall site per ASCE 7-10, calculated by the USGS web application at https://geohazards.usgs.gov/secure/designmaps/us/. Sd = 1.0 g is the 2/3*MCE value at a Site Class B location in the Pacific Heights neighborhood of San Francisco.
The full FEMA P-807 evaluation uses a wall layout very similar to that as-sumed by Report A853, so in terms of weak story ratio, Column C closely matches Column A in both directions.
While the WSRs are similar, the strength of the first story is signifi-cantly greater when calculated by
•
•

52
Soft Story Risk Reduction: Lessons from the Berkeley data
FEMA P-807, 27 percent larger in the long direction and 20 percent larger in the critical short direction. This is largely because of how the method-ology combines separate wall piers into single wall lines.
Still comparing Column C with Col-umn A, the higher calculated strength leads to higher Sc and lower POE val-ues. In FEMA P-807, Sc and POE, as opposed to WSR, are the metrics that matter.
•
If Column C of Table 5-3 represents our most accurate representation of the build-ing, Columns D and E address two hypo-thetical questions:
• Column D shows how the evalua-tion would change if the building had WSP sheathing instead of stucco. With the stronger material, the first story strength obviously increases, but compare Columns C and D in the short direction: The strength in-creases 28 percent, but the spectral acceleration capacity doubles. This disproportionate improvement is due in large part to the increase in the strength degradation ratio from 0.50 to 1.00. The WSP is stronger, but it is also more ductile, ensuring that all of the active elements can reach their peak strengths together.
Column E speculates about a similar stucco building, but one without vis-ible indicators of a SWOF condition. If the wall along the open long side extended one more bay, the building would not present as a SWOF condi-tion. For this variation, comparing Column E with Column C, there is no improvement in short direction spec-tral acceleration capacity because no
strength has been added in the short direction. Yet this condition would likely have escaped Berkeley’s pro-gram. Do the POE values in Column E therefore represent an acceptable performance level for existing build-ings with or without visually indicat-ed SWOF conditions? It is more rea-sonable to think they suggest flaws in the use of visible indicators for screening buildings.
•
Columns D and E of Table 5-3 are hypo-thetical. Table 5-4 compares the existing condition with three more realistic retrofit schemes. The point of the table is to gauge the impact of a feasible retrofit in the FEMA P-807 terms of spectral acceleration capac-ity and POE. Knowing the measure of an “acceptable” retrofit can help set the crite-ria for acceptable existing conditions.
The first column of Table 5-4 is the existing condition, identical to Table 5-3, Column C. Observations from Table 5-4:
The IEBC A4 prescriptive retrofit (Column B) applies the concepts from 2003 IEBC Section A405 (or 2012 IEBC Section A404). Though the building does not quite meet the provision’s eligibility rules, the prin-ciples can apply at a schematic level. The scheme involves adding WSP sheathing with 10d nails at 4 inch-es to the three accessible walls that bound the open parking area (see Figure 5-4), as opposed to adding strength along the open side. For this building, this minimally disruptive scheme cuts the probability of failure in half in each direction, at least for a 1.0 g demand. While the prescrip-tive approach is effective, it is not especially efficient for this building, as it adds as much strength to the long direction as it does to the more
•

53
Soft Story Risk Reduction: Lessons from the Berkeley data
A. Existing building (Table 5-3, Column C)
B. IEBC A4 pre-scriptive retrofit
C. Retrofit Scheme 1
D. Retrofit Scheme 2
Torsional propertiesEccentricity for short loads 1.0 ft 1.6 ft 2.8 ft 2.8 ft
Eccentricity for long loads 3.7 ft 5.1 ft 4.6 ft 0.7 ft
1st story torsional strength 1640 ft-k 1889 ft-k 1679 ft-k 2089 ft-k
Torsion coefficient, CT 0.20 0.31 0.34 0.13Long DirectionStrength degradation ratio, CD
0.33 0.80 0.81 0.77
1st story strength 75 k 92 k 80 k 86 kWeak story ratio a 0.99 1.22 1.06 1.14SC (OSL) at 20% POE 0.58 g 0.94 g 0.83 g 0.94 gPOE (OSL) at Sd = 1.0 g 53% 23% 31% 23%POE (OSL) at Sd = 2.3 g 80+% 80+% 80+% 79%Short DirectionStrength degradation ratio, CD
0.50 0.87 1.00 1.00
1st story strength 53 k 66 k 74 k 74 kWeak story ratio a 0.76 0.96 1.07 1.07SC (OSL) at 20% POE 0.47 g 0.80 g 1.03 g 1.16 gPOE (OSL) at Sd = 1.0 g 67% 33% 18% 13%POE (OSL) at Sd = 2.3 g 80+% 80+% 78% 70%
Table 5-4 FEMA P-807 results for retrofit variations of a two-story building with an open long side
a. Green/red shading indicates WSR ratios greater/less than the 0.8 limit used by IEBC A4 to indicate a deficiency.
critical short direction (compare the increases in first story strength or Sc). Also, by beefing up the existing walls, it can exacerbate existing tor-sional irregularity, here increasing CT from 0.20 to 0.31, thus (according to FEMA P-807) limiting the effec-tiveness of the retrofit elements.
Retrofits 1 and 2 (Columns C and D) are shown schematically in Fig-
ure 5-5. These use a lighter nailing pattern than the IEBC A4 prescrip-tion and take advantage of the exist-ing short direction wall through the parking area. The prescriptive ret-rofit adds a net 30 k of strength to the first story, 17 k in the long direc-tion and 13 k in the short direction. Retrofit 1 adds only 26 k of strength but, by putting more of it in the short direction, is able to maintain
•

54
Soft Story Risk Reduction: Lessons from the Berkeley data
Figure 5-5 Two first story retrofit schemes for Building A853 (or B854). Top: Retrofit 1 per Table 5-3. Bottom: Retrofit 2 per Table 5-3. Green: WSP, 8d at 4”, one or two sides as shown. (See Figure 5-4 for information not shown.)
5.2.2. Two-story building, short side open. Figures 5-6 and 5-7 show examples of a building type frequently found among the Berkeley reports. Of the 39 reports for 1950s-’60s buildings, eleven were similar to these, with long rectangular plans and tuck-under parking at one end.
The first column of Table 5-5 gives analysis
Figure 5-6 Two Berkeley buildings representative of two-story buildings with open fronts and tuck-under parking at one end, with the short side open (Google maps, December, 2011).
the long direction POE at 31 percent while cutting the critical short direc-tion POE down to 18 percent.
Retrofit 2 is more effective still, re-locating some of the long-direction retrofit elements to the open line at the front of the parking area. With 32k of additional strength, Retrofit 2 minimizes torsion and reduces the short direction POE substantially. Of course, Retrofit 2 will require new foundation elements and load path
detailing more extensive than either of the other two schemes.
•

55
Soft Story Risk Reduction: Lessons from the Berkeley data
Figure 5-7 Walls included in FEMA P-807 evaluation of Building B826. Top: second story. Bottom: first/ground story. Dark blue: stucco/gypsum board. Light blue: gypsum board on two sides. (Background from approved report.)
results for the building shown in Figure 5-7. In the long direction, the building evaluates as just about the same as the two-story building with the long side open (Table 5-4 Column A): The spectral acceleration ca-pacity is about 0.60 g and the POE is about 50 percent for a 1.0 g demand. In the short direction, however, the offset of the front-most first story wall leads to a high eccen-tricity (7.9 ft) under short direction loads, a high CT value, and a capacity of only 0.32 g.
Consider the wall layout shown in Figure 5-7. Despite the ground floor parking area, the number and length of walls and parti-tions scarcely differs between the two sto-ries. Still, the weak story ratio in the short direction is only 0.67, because the two wall segments at the back of the parking area are
separated by large openings, so their capac-ity is calculated as two short pieces, not as a single wall the full width of the building. But is this really a SWOF deficiency?
The open front with first story pipe col-umns does give the visual impression of a deficiency. Certainly, under short direction lateral loads the front end of the second floor diaphragm must cantilever from the wall at the back of the parking area. But the roof diaphragm must cantilever as well, since the second story wall at the front end has two wide windows and not much more capacity than the first story. The front wall of the building on the left side of Figure 5-6 has even less wall in the second story. In-deed, the back wall of these buildings, with substantial windows in both stories, might

56
Soft Story Risk Reduction: Lessons from the Berkeley data
A. Existing Building B826
B. Fictitious wall to pass SWOF
screening
C. Existing Building B863
D. Retrofit of Building B826
Torsional propertiesEccentricity for short loads
7.9 ft 1.6 ft 1.9 ft 1.8 ft
Eccentricity for long loads
1.9 ft 1.9 ft 0.1 ft 1.9 ft
1st story torsional strength
785 ft-k 849 ft-k 1258 ft-k 901 ft-k
Torsion coefficient, CT 0.37 0.19 0.05 0.18Long DirectionStrength degradation ratio, CD
0.39 0.39 0.36 0.39
1st story strength 60 k 60 k 61 k 60 kWeak story ratio a 1.01 1.01 1.32 1.01SC (OSL) at 20% POE 0.62 g 0.68 g 0.64 g 0.69 gPOE (OSL) at Sd = 1.0 g 49% 41% 45% 41%
POE (OSL) at Sd = 2.3 g 80+% 80+% 80+% 80+%Short DirectionStrength degradation ratio, CD
0.50 0.45 0.31 0.80
1st story strength 22 k 28 k 31 k 27 kWeak story ratio a 0.67 0.86 1.19 0.81SC (OSL) at 20% POE 0.32 g 0.43 g 0.41 g 0.59 gPOE (OSL) at Sd = 1.0 g 80+% 72% 74% 56%POE (OSL) at Sd = 2.3 g 80+% 80+% 80+% 80+%
Table 5-5 FEMA P-807 results for variations of a two-story building with an open short side
not provide that much more capacity than the front wall, though it would not have the open look of a “soft story” building.
Table 5-5, Columns B through D, address the short direction of the building in differ-ent ways:
a. Green/red shading indicates WSR ratios greater/less than the 0.8 limit used by IEBC A4 to indicate a deficiency.
Column B: By simply adding a ficti-tious stucco wall with windows to the front of the building model, so
•
that the front wall would look like the back, the 6 k of additional strength are enough to reduce the torsion and increase the capacity in the short di-rection from 0.32 g to 0.43 g. More important, the building would look to any observer like a simple two-story box with no SWOF condition at all, yet the POE would remain quite high: 72 percent probability of exceeding the OSL drift levels in a 1.0 g demand.

57
Soft Story Risk Reduction: Lessons from the Berkeley data
Figure 5-8 Walls included in FEMA P-807 evaluation of Building B863. Top: Second story. Bottom: First/ground story. Dark blue: Stucco/gypsum board. Light blue: gypsum board on two sides. (Back-ground from approved report.)
• Column C makes the same point using a different building, designated B863 and diagrammed in Figure 5-8. The building is a bit wider than B826 and the parking area does not cover the whole width of the front end, so the building does not have the tuck-under look of B826. Otherwise, both build-ings are essentially two-story stucco boxes with nearly all their strength coming from perimeter walls. Despite the lack of an apparent open front, a WSR of 1.19, and no significant torsion, the short direction capacity is still only
0.41 g and the POE still as high as 74 percent. The conclusion is that Build-ings B826 and B863 and others like them might be weak, but not because of a particular SWOF condition.
Table 5-5 Column D shows the results of a simple short direction retrofit of Building B826. At the two wall seg-ments of at the rear of the parking area (see Figure 5-7), the stucco has simply been replaced with WSP. The retrofit increases the story strength by just a few kips, enough to raise the
•

58
Soft Story Risk Reduction: Lessons from the Berkeley data
Figure 5-9 Walls included in FEMA P-807 evaluation of Building A072. Top: Upper stories. Bottom: First/ground story. Green: Stucco+WSP/gypsum board. Light blue: gypsum board, two sides. (Back-ground from approved report.)
WSR above the 0.80 criterion from IEBC A4 and to increase the capacity from 0.32 g to 0.59 g.
5.2.3. Three-story building, long side open. Figure 5-9 shows the wall layout of Building A072, a three-story building with a long side open to tuck-under parking. The building is not a prototype that occurs fre-quently in the database, but it is represen-
tative of the three-story buildings, which typically have wood structural panel shear walls.
Table 5-6 (next page) gives the FEMA P-807 results for a number of variations. Columns A and B are two possibilities for the existing condition. The perimeter walls are known to have WSP sheathing, but the construc-tion of the interior walls is uncertain. In Col-umn A, all of the first story short direction

59
Soft Story Risk Reduction: Lessons from the Berkeley data
A. Existing Build-ing A072, max
strength
B. Existing Building A072, min strength
C. Max strength, no second story
partitions
D. Fictitious wall to pass SWOF screening
Torsional propertiesEccentricity for short loads
1.0 ft 0.7 ft 1.0 ft 1.0 ft
Eccentricity for long loads
8.3 ft 8.3 ft 8.3 ft 1.5 ft
1st story torsional strength
2994 ft-k 2007 ft-k 2994 ft-k 3743 ft-k
Torsion coefficient, CT 0.33 0.47 0.33 0.08Long DirectionStrength degradation ratio, CD
1.00 1.00 1.00 1.00
1st story strength 109 k 109 k 109 k 148 kWeak story ratio a 0.93 0.93 0.93 1.26SC (OSL) at 20% POE 0.85 g 0.77 g 0.85 g 1.25 gPOE (OSL) at Sd = 1.0 g 31% 37% 30% 10%POE (OSL) at Sd = 2.3 g 80+% 80+% 80+% 65%Short DirectionStrength degradation ratio, CD
1.00 0.80 1.00 1.00
1st story strength 72 k 46 k 72 k 72 kWeak story ratio a 0.65 0.48 0.85 0.65Sc (OSL) at 20% POE 0.62 g 0.31 g 0.67 g 0.72 gPOE (OSL) at Sd = 1.0 g 54% 80+% 48% 43%POE (OSL) at Sd = 2.3 g 80+% 80+% 80+% 80+%
Table 5-6 FEMA P-807 results for variations of a three-story building with an open long side
a. Green/red shading indicates WSR ratios greater/less than the 0.8 limit used by IEBC A4 to indicate a deficiency.
walls are assumed to have WSP sheathing (and are shown as WSP in Figure 5-9). In Column B, the four interior short direction walls near the stairwells and back-of-house area, as well as the second story walls di-rectly above them, are assumed to have a
stucco finish but no WSP. The effect of these four wall lines is quite large, as can be seen by comparing Columns A and B in the short direction.
Additional observations from Table 5-6:

60
Soft Story Risk Reduction: Lessons from the Berkeley data
The open front is along a long side, but as with the two-story building, the long solid wall at the back of the parking area makes the short direc-tion critical, with a weaker first story, a lower WSR, and a lower spectral acceleration capacity. This is the case even if all the first story walls have WSP sheathing (Column A).
Column C examines whether the three long partitions in the second story contribute to the low weak sto-ry ratio and, per-haps artificially, to the low capac-ity. The walls as-sumed in Column C are the same as those in Column A, except that the second story gyp-sum board parti-tions have been removed from the model. In the long direction, Column C matches Col-umn A as expect-ed. In the short di-rection, the first story strength (and therefore the conventional DCR) is the same, as expected, the WSR has increased significantly, to 0.85, but the capacity and POE by FEMA P-807 have improved only a little. Thus, if P-807 is accurate, it is showing that WSR by itself is a red herring; the value can be well above or below any arbitrary trigger value like 0.80 and not change the actual expected per-formance as measured by Sc and POE. The WSR can reflect a number of causes and modeling decisions, but it does not account for torsion or drift and therefore does not give a reliable
measure of performance.
Column D shows a hypothetical con-dition in which the long second story wall above the parking entrances is continued to the first story so that the building no longer has an obvi-ous visible indicator. The fictitious first story wall is identical to the sec-ond story wall: Stucco over WSP, with gypsum board on the inside face, and with four long windows. Compared with Column A, Column D shows that
this hypothetical condition would essentially elimi-nate torsion and would have a sig-nificant, if not dis-positive, effect on capacity and POE. Since no strength is added in the critical short di-rection, the WSR continues to show the same mislead-ingly low value even while perfor-mance improves.
Most significant, this hypothetical building, which would not look like a stereotypical SWOF building at all, would still have a capacity and POE not that much better than the actu-al building with a completely open front.
•
•
•
5.2.4. Three-story building, short side open. Figure 5-10 (next page) shows the wall layout of Building E842, a three-story building with tuck-under parking at one end of a rectangular plan. The building is es-sentially a three-story version of the build-ings described in Section 5.2.2. Though not
Thus, if P-807 is accurate, it is showing that WSR by itself is a red herring; the value can be well above or below any arbitrary trig-ger value like 0.80 and not change the actual expected performance as measured by Sc and POE

61
Soft Story Risk Reduction: Lessons from the Berkeley data
Figure 5-10 Walls included in FEMA P-807 evaluation of Building E842. Top: Upper stories. Bottom: First/ground story. Green: Stucco+WSP/gypsum board. Light blue: gypsum board, 2 sides. (Background from approved report.)
as prototypical, at least three others among the 39 1950s-’60s buildings are similar.
Table 5-7 (next page) gives the FEMA P-807 results for a number of variations. In all cas-es, the short direction is critical, with sig-nificantly lower first story strength, lower spectral acceleration capacity, and higher POE values – despite having similar weak story ratios all greater than 0.80.
Additional observations:
In Column A, the FEMA P-807 model includes both WSP sheathing and a stucco finish on the exterior surface of perimeter walls (that is, the actual condition). The model in Column B is identical except that the exterior stucco is ignored. Clearly, the stucco
•
makes practically no difference; while strong at small drifts, the stucco is degraded and makes very little con-tribution at the drifts where the full story strength is achieved. (With FEMA P-807’s probabilistic fragility approach, the building even evalu-ates as slightly better without the stucco because when the exterior stucco is ignored the value of the WSP-sheathed wall at the back of the parking area is heightened in relative terms.)
Column C considers the effect of sheathing material. Without WSP sheathing, the perimeter walls get their strength from stucco only, much like the typical two-story buildings. The effect on WSR is minimal, but
•

62
Soft Story Risk Reduction: Lessons from the Berkeley data
•
the capacity in each direction drops by more than half. Thus, even in the three-story building, it is the abso-lute first story strength, not the rela-tive strength, that drives capacity. A high WSR disguises this fact.
Column D again considers whether an apparent open front at the end wall is actually a deficiency. The WSP wall at the back of parking area (Line E in Figure 5-10) is replaced with a typical gypsum board parti-tion, and a typical perimeter wall
A. Existing Building
E842
B. Existing Building E842,
w/o stucco
C. Existing Building E842,
w/o WSP
D. Fictitious wall to pass
SWOF screeningTorsional propertiesEccentricity for short loads 5.3 ft 5.2 ft 7.0 ft 1.6 ftEccentricity for long loads 1.6 ft 1.6 ft 0.1 ft 1.6 ft1st story torsional strength 3320 ft-k 3186 ft-k 1801 ft-k 3743 ft-kTorsion coefficient, CT 0.17 0.18 0.22 0.09Long DirectionStrength degradation ratio, CD 1.00 1.00 0.39 1.001st story strength 143 k 143 k 88 k 143 kWeak story ratio a 1.10 1.10 1.16 1.10SC (OSL) at 20% POE 1.14 g 1.13 g 0.45 g 1.19 gPOE (OSL) at Sd = 1.0 g 14% 14% 69% 12%POE (OSL) at Sd = 2.3 g 72% 72% 80+% 69%Short DirectionStrength degradation ratio, CD 0.99 0.99 0.49 0.901st story strength 65 k 65 k 56 k 71 kWeak story ratio a 0.95 1.01 1.03 1.03SC (OSL) at 20% POE 0.73 g 0.74 g 0.35 g 0.71 gPOE (OSL) at Sd = 1.0 g 42% 40% 80+% 43%POE (OSL) at Sd = 2.3 g 80+% 80+% 80+% 80+%
Table 5-7 FEMA P-807 results for variations of a three-story building with an open short side
a. Green/red shading indicates WSR ratios greater/less than the 0.8 limit used by IEBC A4 to indicate a deficiency.
with WSP, stucco, and windows is added to the first story at the open front (Line F). Comparing Column D to Column A, the reduced torsion coefficient improves the long direc-tion a bit, but in the critical short di-rection, the building actually evalu-ates as a bit worse due to the loss of the strong solid wall on Line E, even while the absolute strength and WSR go up. Again, the lesson, according to FEMA P-807, is that the visible open front condition is not the problem here. From a street view, the open

63
Soft Story Risk Reduction: Lessons from the Berkeley data
•
Bldg Stories Open side Variation WSP a
Critical direction
Dir’n WSR SC at 20% b POE at 1.0 g b
A853 or
B8542 Long
Existing building No Short 0.76 0.47 g 67%Existing building w/ WSP Yes Short 0.83 0.97 g 21%Fictitious wall added c No Short 0.76 0.50 g 63%Retrofit per IEBC A4 Yes a Short 0.96 0.80 g 33%Retrofit 1 Yes a Long 1.06 0.83 g 31%Retrofit 2 Yes a Long 1.14 0.94 g 23%
B826 2 ShortExisting building No Short 0.67 0.32 g 80+%Fictitious wall added c No Short 0.86 0.43 g 72%Retrofit Yes a Short 0.81 0.59 g 56%
B863 2 Short Existing building No Short 1.19 0.41 g 74%
A072 3 Long
Existing building, max strength Yes Short 0.65 0.62 g 54%
Existing building, min strength Yes Short 0.48 0.31 g 80+%
Existing bldg, no St-2 partitions Yes Short 0.85 0.67 g 48%
Fictitious wall added c Yes Short 0.65 0.72 g 43%
E842 3 Short
Existing building Yes Short 0.95 0.73 g 42%Existing building, no stucco Yes Short 1.01 0.74 g 40%
Existing building, no WSP No Short 1.03 0.35 g 80+%Fictitious wall added c Yes Short 1.03 0.71 g 43%
Table 5-8 Summary of FEMA P-807 case study results
a. The WSP column indicates whether the building’s seismic force-resisting system comprises primarily WSP-sheathed walls. For the retrofits of Buildings A853 (or B854) and B826, the WSP is at the first story retrofit elements only.b. Sc and POE are shown for drift limits at onset of strength loss (OSL).c. A “fictitious wall” is one added to the model along the apparent open front in order to mitigate the traditional visible indicator.
end continues to look like a tradi-tional SWOF deficiency; from a plan view, however, the first story has a substantial WSP-sheathed box with only a small eccentricity relative to the upper stories.
The critical elements in this building are the short direction rear wall (Line A in Figure 5-10) and the wall at the back of the parking area (Line E). The
Line E wall, in particular, must carry the whole front end of the three-sto-ry building. A thoughtful evaluation should find these walls, but a proce-dure like IEBC A4 will miss the Line E wall if it focuses on the red herring of the open front on Line F. FEMA P-807, while giving a more complete over-all assessment of likely performance, does not generate DCR values or other measures of specific critical elements.
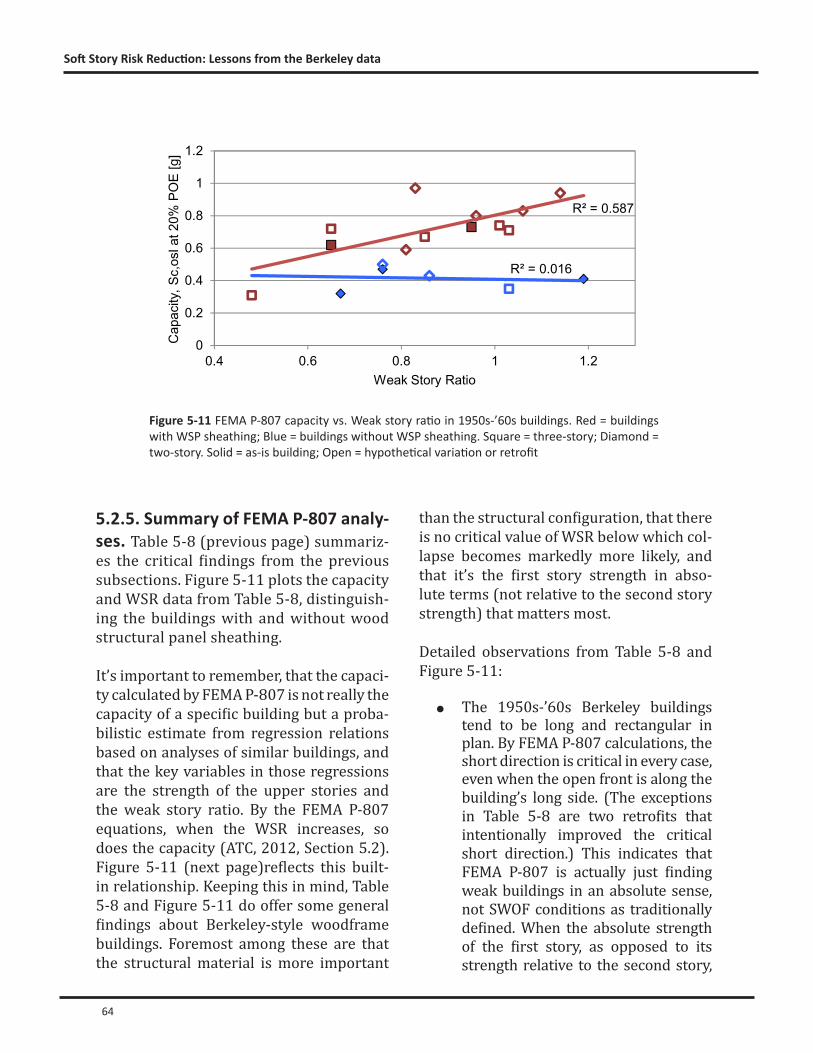
64
Soft Story Risk Reduction: Lessons from the Berkeley data
Figure 5-11 FEMA P-807 capacity vs. Weak story ratio in 1950s-’60s buildings. Red = buildings with WSP sheathing; Blue = buildings without WSP sheathing. Square = three-story; Diamond = two-story. Solid = as-is building; Open = hypothetical variation or retrofit
5.2.5. Summary of FEMA P-807 analy-ses. Table 5-8 (previous page) summariz-es the critical findings from the previous subsections. Figure 5-11 plots the capacity and WSR data from Table 5-8, distinguish-ing the buildings with and without wood structural panel sheathing.
It’s important to remember, that the capaci-ty calculated by FEMA P-807 is not really the capacity of a specific building but a proba-bilistic estimate from regression relations based on analyses of similar buildings, and that the key variables in those regressions are the strength of the upper stories and the weak story ratio. By the FEMA P-807 equations, when the WSR increases, so does the capacity (ATC, 2012, Section 5.2). Figure 5-11 (next page)reflects this built-in relationship. Keeping this in mind, Table 5-8 and Figure 5-11 do offer some general findings about Berkeley-style woodframe buildings. Foremost among these are that the structural material is more important
than the structural configuration, that there is no critical value of WSR below which col-lapse becomes markedly more likely, and that it’s the first story strength in abso-lute terms (not relative to the second story strength) that matters most.
Detailed observations from Table 5-8 and Figure 5-11:
The 1950s-’60s Berkeley buildings tend to be long and rectangular in plan. By FEMA P-807 calculations, the short direction is critical in every case, even when the open front is along the building’s long side. (The exceptions in Table 5-8 are two retrofits that intentionally improved the critical short direction.) This indicates that FEMA P-807 is actually just finding weak buildings in an absolute sense, not SWOF conditions as traditionally defined. When the absolute strength of the first story, as opposed to its strength relative to the second story,
•
R² = 0.016
R² = 0.587
0
0.2
0.4
0.6
0.8
1
1.2
0.4 0.6 0.8 1 1.2
Cap
acity
, Sc,
osl a
t 20%
PO
E [g
]
Weak Story Ratio

65
Soft Story Risk Reduction: Lessons from the Berkeley data
is controlling, and when the major-ity of strength comes from perimeter walls, it stands to reason that the di-rection with shorter walls will be crit-ical. While rational, this does compli-cate the idea behind a program that targets traditional SWOF conditions, especially if the targeted buildings are identified by the look of perimeter wall lines.
Because absolute strength is control-ling the capacity as determined by FEMA P-807, the existing sheathing material makes an enormous differ-ence. All of the case study buildings were designed in the same era with the same building codes. In Table 5-8, the three two-story buildings without WSP sheathing have capaci-ties between 0.32 g and 0.47 g. These include Building B863, which has no calculable SWOF condition and the highest WSR in the table. The two taller buildings with WSP have sig-nificantly higher existing capacities: 0.62 g and 0.73 g. Two-story Building A853, if modeled with WSP sheathing instead of stucco, has a high capac-ity of 0.97 g, and three-story Building E842, if modeled with stucco only and no WSP, has a low capacity of only 0.35 g. This confirms that it is the sheath-ing, and not some other attribute of height, mass, or configuration, that makes the principal difference. In-deed, even the worst wood-sheathed buildings evaluate as better than the best stucco-sheathed buildings. This means that a mitigation program emphasizing traditional SWOF mea-sures could miss some buildings that actually have a higher likelihood of failure. It is worth remembering that the most catastrophic collapse of a tuckunder building in the Northridge
earthquake, the Northridge Meadows Apartments, was a three-story build-ing with only limited WSP sheathing (EERI, 1996, page 168 ff).
The “fictitious wall” cases studied whether elimination of a visible indi-cator – an open front for tuck-under parking – would change the actual ca-pacity. In brief, the answer is no.
Where the short side is open, the “open front” might actu-ally be a red herring. Fictitious walls in these two cases changed capacities relative to the actual existing conditions by just 0.11 g and -0.02 g (a reduction). By contrast, a quite feasible retrofit of Building B826 without closing the open front would increase capacity by 0.27 g.
Where the long side is open, it does represent an actual defi-ciency because it leads to torsion that overtaxes the short direction walls. Yet closing the open front does not necessarily increase capacity if the walls are weak in absolute terms. In two cases with the long side open, fictitious walls increased capacities by 0.03 g and 0.10 g. By contrast, feasible retrofits of the stucco two-story building increased its capacity by 0.33 g, 0.36 g, and 0.47 g.
o
o
•
•
If absolute strength is the driving is-sue, how much is enough? That is, if a mitigation program is specifically tar-geting a subset of “worst” buildings, what capacity would those buildings need to be brought to, and what exist-ing capacity would exempt a building from retrofit? If retrofit feasibility is
•

66
Soft Story Risk Reduction: Lessons from the Berkeley data
With the case studies summarized in Section 5.2, we can revisit the question from Section 5.1 and ask if any simple indicators can re-liably predict the FEMA P-807 performance metric, Sc. Figure 5-12 shows the relation-ship between FEMA P-807 capacity and the most promising of the readily known attri-butes considered in Section 5.1: the ratio of total floor area to the total length of solid perimeter wall in the critical direction at the first story (see Figure 5-3). (Note that this
5.3 Predicting evaluation results with FEMA P-807 results
R² = 0.772
R² = 0.318
0
0.2
0.4
0.6
0.8
1
1.2
0 50 100 150 200 250 300 350 400 450 500
Cap
acity
, Sc,
osl a
t 20%
PO
E [g
]
Total area / perim. wall length, critical direction [sf/ft]
Figure 5-12 FEMA P-807 capacity vs. ratio of total floor area to first story perimeter wall length in the critical direction in 1950s-’60s buildings. Red = buildings with WSP sheathing; Blue = buildings without WSP sheathing. Square = three-story; Diamond = two-story. Solid = as-is building; Open = hypothetical variation or retrofit.
to be considered, the four feasible retrofits in Table 5-8 bring the existing stucco buildings to a capac-ity of at least 0.59 g (at 20 percen POE). Meanwhile, the ca-pacity of the case study buildings with WSP sheathing is at least 0.62 g. Thus, a practical retro-fit that would make each two-story stuc-co building at least as strong as a typi-cal three-story WSP building could shoot for a minimum acceptable capacity around 0.60 g (assuming corroboration by further studies). Whether this level of improvement would be cost-beneficial to an owner is not clear. More important from a policy perspec-tive, capacities of 0.60 g are still obviously less than expected demands, so the reduc-tion of potential losses for the housing stock as a whole might not be adequate. Requiring more, however, would likely lead to intrusive and expensive retrofit.
measure of wall length is not the length of contributing walls assumed by FEMA P-807. Rather, it is the length that is easily calcu-lable from a non-intrusive sidewalk survey.)
Table 5-8 suggests that separate relation-ships should be developed for existing buildings with and without WSP sheathing, with possibly a third category for hybrid or retrofit systems. Figure 5-12 bears this out, showing a clear gap in capacity between most of the red and blue markers.
Compared with Figure 5-3, the relationships shown in Figure 5-12 are strong (though in the case of the blue non-WSP data, this could be due to the small number of data points in two clusters widely spread apart, which is probably unrealistic). However, the rela-tionships are also relatively flat, which limits their usefulness as predictors. In any case, even if useful relationships might emerge from more analyses with FEMA P-807, the present data is not robust enough to justify a meaningful screening relationship. Figure 5-12 should therefore be understood as con-ceptual and extremely preliminary.

67
Soft Story Risk Reduction: Lessons from the Berkeley data
6. Lessons
As shown in Section 5.1, the Berkeley re-port data reveals no statistically significant relationships between readily observable indicators (based on floor area, wall length, etc.) and the engineering parameters WSR or DCR. The initial goal of this study – to de-rive a screening tool based on just such a relationship – therefore cannot be met.
But why not? What is it about these build-ings, or the Berkeley program’s engineering criteria, that makes such a common sense relationship so elusive? The answer begins with the recognition of inconsistent engi-neering practices, but it ends with the find-ing that neither the indicators traditionally used for visual surveys, nor the engineer-ing parameters that we tried to predict, are especially useful for describing the perfor-mance of these vulnerable buildings.
First, the reports calculated the seismic de-mand inconsistently, so DCRs were not di-rectly comparable (see Section 4.1.1). We were able to correct for this by substituting uniform values. Second, the reports were overly focused on the individual wall lines that appeared as open fronts, so they calcu-lated WSRs inconsistently, sometimes im-properly (Sections 4.1.2 and 4.2). We were able to correct for this in an approximate way by recalculating each report’s WSRs. Third, the reports varied widely in how they assigned material strengths to archaic ma-terials, how they combined those strengths within wall assemblies, and how they ac-counted for the contributions of perimeter walls and interior partitions (Sections 4.1.2 and 4.1.3). This we could not correct for, so the reported DCRs and WSRs were not comparable from one report to the next
and, as a result, were nearly impossible to correlate. To try to predict such ill-defined targets thus became a moot exercise.
Instead, we identified typical buildings within the Berkeley inventory and consis-tently applied an alternative evaluation method, FEMA P-807 (Section 5.2). This work led to two important findings about the nature of seismic deficiencies in these vulnerable structures:
The open front condition, while visu-ally suggestive and commonly taken as an indicator of both weak story ir-regularity and collapse potential, can be misleading. In particular, when the open front is along the short side of a building with an elongated plan, it does not necessarily predict either a deficiency or even an irregularity.
The weak story ratio, a traditional measure of irregularity, does not meaningfully distinguish acceptable buildings from more likely damage or collapse risks. A low ratio prob-ably indicates that the building’s design did not follow modern code conventions, but it is neither neces-sary nor sufficient for finding true deficiencies. The absolute strength of the first story is far more important than the relative strength of the first story to the second.
•
•
Neither of these findings should be surpris-ing, and in retrospect they read like nothing more than common sense. In fact, they are not really new. Yet engineers and mitigation advocates, in the Berkeley program and in
68
Soft Story Risk Reduction: Lessons from the Berkeley data
subsequent work, have not revised tradi-tional procedures and continue to rely on these misleading indicators.
The most important implication is that mitigation programs might be targeting or prioritizing the wrong buildings. Programs that rely on visual screening for open front conditions or define acceptability using only a WSR are not likely to find the most vulnerable buildings with much reliability. In the Berkeley program, this error was mitigated in part by the engineers’ systemic conservatism, which led them to recom-mend retrofit even in buildings with ac-ceptable WSR values (see Sections 4.2 and 6.3). In general, such overreach can put a program’s credibility in question. If build-ings are tagged as deficient even though they satisfy the evaluation criteria, it mis-allocates public energies and private funds, misconstrues the actual risk, and misin-forms individual owners and the public as a whole. On the other hand, if the stipulated definition of the key deficiency is mislead-ing, conservative engineering judgment is not a bad substitute. Either way, the Berke-ley engineers’ conservatism only affected buildings that were on the city’s list in the first place. Buildings of similarly vulnerable construction, but without visually obvious open fronts, received no attention through the Berkeley program at all.
This study is primarily about engineer-ing – about how certain buildings behave in earthquakes and about the technical tools engineers use to measure or predict that behavior. Yet engineering always takes place within a larger context. Important de-cisions about risk and policy are made by non-engineers, both before the engineer is engaged and after the engineer’s report is filed. The following sections relate the study’s technical findings to the design of mitigation programs, combining technical,
procedural, and regulatory issues.
6.1 1950s-’60s woodframe resi-dential buildings
Even a narrowly-defined set of buildings such as those targeted by Berkeley’s pro-gram can include significant diversity of age, construction, configuration, and occupancy. Of 90 reports reviewed for this study, only 52 were judged to be comparable in terms of eligibility for FEMA P-807 criteria, and to a lesser degree, IEBC A4. Of those 52, only 39 were judged structurally comparable for statistical purposes. (Section 3.2)
Diversity can make it difficult for a single engineering standard to ser-vice the entire group effectively, as discussed further in Section 6.2.
Lesson:
Construction and occupancy correlate with age. In Berkeley, most of the targeted buildings date from the 1950s and 1960s, but only the three-story buildings had WSP sheathing. Almost all of the Berkeley buildings have some occupied space on the ground floor. (Section 3.2)
Lesson: Evaluation and retrofit objec-tives appropriate to one jurisdic-tion might not apply to or meet the needs of another jurisdiction with a different building stock. For example, though geographically close, San Francisco and Oakland are expected to have older con-struction and proportionally few-er ground floor residential units than Berkeley. Findings from the 1950s-’60s buildings studied here might not apply directly to the larger and older populations.
At least for the 1950s-’60s buildings like those in Berkeley, common visual indica-
69
Soft Story Risk Reduction: Lessons from the Berkeley data
tors of SWOF conditions do not predict or correlate with calculated DCR or WSR val-ues using IEBC A4 (Section 5.1). Also, the visually suggestive open front does not al-ways indicate the building’s critical direc-tion. Thus, buildings without visually ob-vious open front conditions might still be vulnerable, though they lack the look of a classic SWOF building (Sections 4.1.3, 4.2, 5.2.1, 5.2.3).
Pre-selection of buildings based on visual attributes – Berkeley’s approach – is likely to miss build-ings at least as vulnerable as some of those targeted. A better ap-proach, if logistically feasible, is to target buildings based on known attributes (size, age, number of units) without pre-judging their adequacy, and to let owners peti-tion for exemption.
Lesson:
Despite the definitions in IEBC A4, ASCE 31, and the code for new construction, there is no clear demarcation in terms of collapse or damage potential between a “soft story” or “weak story” building and a generally obsolete woodframe structure (Sections 5.2.1 through 5.2.5, 5.3). WSR, defined by a critical value of 0.8, is not a useful predictor of capacity or performance. Further, a cal-culable SWOF condition – specifically, a low WSR – can be less of a deficiency than gen-erally weak or archaic construction materi-als. For the 1950s-’60s Berkeley buildings, two-story stucco buildings (with no wood structural panels) with marginal SWOF conditions calculated as more vulnerable than three-story buildings with wood walls and clear SWOF conditions (Sections 5.2.1 through 5.2.5).
Buildings with WSP shear walls, almost regardless of their WSR or open front conditions, have better resistance to severe damage than
Lesson:
buildings with only stucco shear walls. To a degree, this merely re-flects the material strengths pre-scribed by FEMA P-807, but that is still more rational than rely-ing on the discredited distinction between WSR values above and below a presumed critical value. Thus, one lesson here is to use meaningful engineering criteria, discussed further in Section 6.2.
This also shows how a height cri-terion for the target buildings can be self-defeating. In Berkeley, the buildings with more vulnerable stucco shearwalls are also the two-story buildings. Thus, a program that focused on buildings three stories and taller, on the rational presumption that taller buildings have more mass or more units, would have missed the buildings that are actually more likely to be red-tagged.
Lesson:
6.2 IEBC A4 and other engineering criteria
Retrofit codes, like IEBC A4, might not sup-port thorough, consistent evaluations that aim to distinguish among the targeted buildings (Section 4.2).
Lesson: The evaluation phase of a mitiga-tion program is better served by technical criteria that focus on evaluation than by provisions for retrofit design.
Selection of technical criteria must consider the tradeoff between a special purpose document, which can offer more relevant guidance and a shorter learning curve, and
Lesson:

70
Soft Story Risk Reduction: Lessons from the Berkeley data
a more comprehensive document, which will accommodate more di-versity but can also lead to more confusion and error. ASCE 31 is an example of a comprehensive evaluation standard. FEMA P-807 is an example of a special purpose evaluation tool. IEBC A4 is primar-ily a retrofit design code.
When selecting engineering crite-ria, jurisdictions should determine in advance what portion of the targeted buildings might be ineli-gible and thus require alternative criteria. The more specialized the criteria, the larger the subset of ineligible buildings is likely to be. A procedure such as FEMA P-807, for example, does not easily ac-commodate buildings with cripple walls, concrete or masonry walls, substantial grade changes or sloped sites, etc. Where more than one set of criteria will be allowed or is needed to cover the range of targeted buildings, some bench-marking or calibration of the cri-teria documents to each other will be needed.
Lesson:
Lesson:
These are generalized lessons related to a generalized finding. Specific examples of how IEBC A4 affected the Berkeley results follow.
Soft story and weak story definitions can miss significant torsional irregularity and associated deficiencies if a long solid wall on one line in the first story makes up for a lack of walls on other parallel lines (Sec-tion 4.1.3). In IEBC A4, “open front” is not carefully defined and is therefore subject to judgment (Sections 4.1, 4.2).
Engineering criteria should be Lesson:
suited not only to the buildings in question but also to the purpose of the work. In particular, screen-ing criteria should be different from detailed evaluation crite-ria, and both should be different from retrofit design criteria and from codes for new construction. In the Berkeley program, the use of WSR and SSR definitions from IEBC A4 were not only misapplied, but might have led to faulty con-clusions. But if the WSR and SSR definitions are inappropriate for evaluation, why are essentially identical definitions suitable for IEBC A4 and the building code? Because IEBC A4 and the building code are primarily for design, not evaluation, they have other pro-visions that compensate for such simplistic definitions. In design codes, WSR and SSR are appro-priate warnings to the designer, not damage predictors or unac-ceptable conditions of themselves. ASCE 31, an evaluation standard, uses the same definitions of WSR and SSR but includes additional provisions to flag deficiencies such as the use of stucco and gypboard sheathing as shear walls. So the problem seen in this study arises from the use of IEBC A4 retrofit design criteria for evaluation of existing conditions. FEMA P-807, by contrast, does not set an arbi-trary cutoff for WSR or SSR.
See Section 6.1 regarding the lack of correlation between low WSR values or open fronts and actual expected performance.
IEBC A4 (through 2009) forced the user to choose R-values that might be unjustified for

71
Soft Story Risk Reduction: Lessons from the Berkeley data
obsolete conditions. This can significantly affect DCR calculations. (Section 4.1.1)
Evaluation criteria should account for existing archaic conditions. FEMA P-807, for example, does not use reduced loads and explic-itly accounts for what R-values ap-proximate.
See Section 6.3 regarding the role of quality assurance.
Lesson:
IEBC A4 provides no guidance on how to quantify the capacity of walls and partitions in terms of unit strength, which segments to include or discount, how to account for openings and load path inadequacy, etc. This can affect the calculation of DCR, SSR, and WSR. (Sections 4.1.2, 4.2)
Lesson: Evaluation criteria should be com-plete enough to ensure consis-tent application. FEMA P-807, for example, gives specific rules for calculating capacity, ensuring bet-ter consistency, if not better ac-curacy. (Whether the FEMA P-807 capacities are perfectly correct or not, they do include rules that will bring consistency to this area of engineering practice. Sheathing types not considered in this study, including wood board sheathing or lath and plaster typical of older construction, still need to be stud-ied with similar analyses.)
See Section 6.3 regarding the role of quality assurance.
IEBC A4 has changed significantly since 2003, especially with respect to the selec-tion of R-values. Future evaluations of simi-lar buildings (or re-done calculations for the same buildings) might reach different conclusions even if the same assumptions,
simplifications, and errors are applied. (Section 4.1.1)
Jurisdictions using the more re-cent edition of IEBC A4, including Oakland, San Francisco, or even Berkeley, might reach different conclusions for similar buildings. FEMA P-807 is not yet calibrated to any version of IEBC A4. There-fore, jurisdictions seeking to use either FEMA P-807 or the latest version of IEBC A4 should perform a calibration study to establish ex-pectations.
Lesson:
6.3 Engineering practiceEngineers in the Berkeley program applied judgment to address gaps in the specified criteria. Many assumptions and simplifica-tions were rational for individual buildings but led to inconsistencies between build-ings. Some of the inconsistencies were insignificant in that they did not change overall conclusions about the presence of an IEBC A4 deficiency. In other cases, they led to opposite results for similar buildings. (Section 4.1.3)
Quality assurance is important for bridging gaps in the specified cri-teria, for interpreting the criteria to best fit the buildings in ques-tion, and to prevent errors by un-familiar engineers. Attention to the first two objectives – bridging gaps and interpreting criteria – is perhaps most necessary when the criteria are a poor fit to the task, as when a design code like IEBC A4 is used for evaluation. The third objective – reducing errors – will perhaps require the most effort when a complicated tool, such as ASCE 31, or a new one, such as FEMA P-807, is selected.
Lesson:

72
Soft Story Risk Reduction: Lessons from the Berkeley data
The engineers were sometimes instructed by the city’s plan checker to perform calcu-lations and present findings in ways with which they disagreed (Section 4.2).
Ideally, the quality assurance should involve both a guidance document produced in advance and a consistent approval process for submitted reports. Berkeley ac-tually took both of these steps but used different consultants for each one and perhaps did not antici-pate the need to coordinate them. Thus, incomplete guidance in the Framework document could not be addressed during plan check. In general, unanticipated prob-lems in applying selected criteria and producing effective reports might be reduced through a pilot program during which the entire process can be observed, criteria can be revised, and standard pro-cedures can be established.
Lesson:
To balance this hindsight, Berkeley de-serves praise for their pioneering program. Some decisions that proved imperfect were still wise and probably the best ones that could reasonably have been made given the state of knowledge at the time. In particu-lar, creating a program-specific Framework and using a single consultant for plan check reviews stand as practices that other juris-dictions should emulate.
Considering the Berkeley buildings as a group, inconsistencies in the evaluation re-ports inhibited our ability to make poten-tially useful comparisons, to derive valid statistical models, or generally to under-stand the buildings as a group. Some of the inconsistencies probably represented common sense engineering shortcuts, as opposed to errors or a lack of quality assur-
ance. (Sections 4.1.1, 4.1.2, 4.2, 5.1)
If a mitigation program intends to collect information about the targeted buildings, perhaps to in-form loss estimates or plan a ret-rofit phase, procedures should be established to ensure complete and consistent reporting to serve the jurisdiction’s goals. Otherwise, engineers will tend to use rough approximations that might be suitable to their task but not rep-resentative of the actual buildings. Unless carefully instructed oth-erwise, the engineer’s work will be cost effective for himself and for his client but might not pro-duce the information the program seeks.
Lesson:
Some engineers found no deficiencies but still recommended retrofit. In general, as-sumptions and simplifications, while nec-essary in some cases, tended to ratchet in the conservative direction. (Section 4.2)
While this finding does not affect the technical conclusions of our study, it should remind mitigation planners that engineering involves judgment, and that the engineer-owner relationship might be serv-ing priorities or desires different from those of the jurisdiction. More important, the engineer’s recommendation, even if it strays from the project criteria, probably also influences how the building owner responds, a topic covered in depth by Rabinovici (2012).
Lesson:

73
References
ABAG, 2003. “Preventing the Nightmare: Designing a Model Program to En-courage Owners of Homes and Apart-ments to Do Earthquake Retrofits.” Association of Bay Area Governments. Excerpted at http://quake.abag.ca.gov/housing/losses/.
ABAG, 2009. “Long-Term Disaster Recovery Plan, Prepared for the City of Oakland, Part One.” Association of Bay Area Governments, June 30. Available at http://quake.abag.ca.gov/govt/.
ASCE, 2000. Prestandard and Commen-tary for the Seismic Rehabilitation of Buildings (FEMA 356). Federal Emer-gency Management Agency, Novem-ber.
ASCE, 2003. Seismic Evaluation of Existing Buildings (ASCE/SEI 31-03). Ameri-can Society of Civil Engineers.
ASCE, 2006. Seismic Rehabilitation of Existing Buildings (ASCE/SEI 41-06). American Society of Civil Engineers.
ATC, 2012. Seismic Evaluation and Retro-fit of Multi-Unit Wood-Frame Build-ings with Weak First Stories (FEMA P-807). Federal Emergency Manage-ment Agency, May.
Berkeley, City of, 2005. “Potentially Haz-ardous Buildings Containing Soft, Weak, or Open Front Stories,” in Berkeley Municipal Code, Chapter 19.39.
Berkeley, Building and Safety Division,
2006. “City of Berkeley Soft Story Seis-mic Engineering Evaluation Report Framework.” January 20. Available at http://www.ci.berkeley.ca.us/Con-tentDisplay.aspx?id=622.
Berkeley, Building and Safety Division, 2011. “Inventory of Potentially Haz-ardous Soft Story Buildings: Status as of 3/21/11.” Available at http://www.ci.berkeley.ca.us/ContentDisplay.aspx?id=622.
CalEMA, 2010. State of California Multi-Hazard Mitigation Plan. Prepared by the California Emergency Manage-ment Agency, October.
California Government Code. Available at http://www.leginfo.ca.gov/cgi-bin/calawquery?codesection=gov.
California Health and Safety Code. Avail-able at http://www.leginfo.ca.gov/cgi-bin/calawquery?codesection=hsc.
CBSC, 2010. 2010 California Building Code (California Code of Regulations, Title 24, Part 2). California Building Stan-dards Commission.
EERI, 1996. Northridge Earthquake of Jan-uary 17, 1994 Reconnaissance Report, Volume 2 (Supplement C to Volume II, Publication 95-03/2), William T. Holmes and Peter Somers, eds. Earth-quake Engineering Research Institute, January.
Harris, S.K., McCormick, D.L., Bono, S.T., and Bonowitz, D., 2009. “Evaluation

74
and Retrofit Provisions for Bay Area Soft Story Woodframe Buildings,” in Proceedings of the 2009 ATC & SEI Conference on Improving the Seismic Performance of Existing Buildings and Other Structures, San Francisco, December 9-11.
ICBO, 1997. Uniform Building Code, In-ternational Conference of Building Officials.
ICC, 2003; 2006; 2009; 2012. International Existing Building Code, International Code Council.
ICC, 2005. International Existing Building Code Commentary, International Code Council.
Kamlarz, P., 2005. “Potentially Hazard-ous Soft, Weak, or Open Front Story (sic) Buildings.” October 18. Memo from the Berkeley City Manager to the Mayor and City Council, available at http://www.ci.berkeley.ca.us/Con-tentDisplay.aspx?id=622.
MacQuarrie, J., 2005. “A Hard Look at Soft Stories.” February 24. Available at http://www.ci.berkeley.ca.us/Con-tentDisplay.aspx?id=622
Oakland, City of, 2009. “Mandatory Seismic Screening Of Multiple Story Residen-tial Buildings,” in Oakland Municipal Code, Chapter 15.26.
Rabinovici, SJM, 2012 (forthcoming). Mo-tivating Private Behaviors with Public Programs: Behavioral Insights from a Local Earthquake Mitigation Ordi-nance, (Doctoral Dissertation), Uni-versity of California, Berkeley.
San Francisco, Department of Building
Inspection, 2007. Unpublished data from sidewalk survey, June 20.
San Francisco, Department of Building Inspection, 2010. “Definition and Design Criteria for Voluntary Seis-mic Upgrade of Soft-Story, Type V (wood-frame) Buildings” [Adminis-trative Bulletin 094]. April 13. Avail-able at http://www.sfdbi.org/index.aspx?page=68
SPUR, 2012. “Safe Enough to Stay.” San Francisco Planning and Urban Re-search, January. Available at www.spur.org.

75
Appendix A: Database of Approved Report Data
This Appendix presents, in a series of linked tables, a selection of the database produced from the 52 approved reports described in Section 3. In each of the following tables, the 13 pre-1950 buildings are shown shad-
Table A-1 Legend for database fields presented in Appendix A
Field Name Description Units, Typical entries
ID Berkeley case number, abbreviatedFirm Code for engineering firmAge Twentieth century decade of original constructionStories Stories above grade, not including cripple storiesUnits Residential unitsFirst floor oc-cupancy
Occupancy or use of first floor Res=Residential, Pkg=Parking, Stor=Storage, Util=Utiity, Bus=Business, Merc=Mercantile
Configuration notes
Notes regarding plan or vertical irregularities (other than SWOF conditions), crawlspaces, mixed systems, etc.
Second floor diaphragm
Construction of second floor diaphragm Plwd=Plywood or WSP, Gypbd=Gypsum board ceiling, Diag Shtg= Diagonal Board Sheathing, PWL=Plaster on Wood Lath Ceiling
Perimeter WSP
Wood structural panel sheathing on typical perimeter wall lines Yes/No = Present/Absent
Partition WSP Wood structural panel sheathing on typical interior partition lines Yes/No = Present/Absent
Perimeter wall strength
Allowable strength (unless noted as Ult) used for typical perim-eter wall lines
plf
Partition wall strength
Allowable strength (unless noted as Ult) used for typical interior wall lines
plf
GSF 1 Gross square footage, first floor sq ft
ed, so the 39 buildings discussed in detail in Section 4 remain unshaded.
Table A-1 defines the column headings and entries used in Tables A-2 through A-6.

76
GSF Tot Gross square footage, total of all floors sq ftGSF Open Gross square footage of open area at first floor sq ftGSF Open/1 Portion of the first floor judged to be open, (GSF Open) / (GSF 1)F dim Gross length of building, front side (facing street) ftB dim Gross length of building, rear side (parallel to front) ftL dim Gross length of building, left side (facing building from street) ftR dim Gross length of building, right side (facing building from street) ftF %opn % of front wall line taken by significant openings, by length %, to the nearest
10%B %opn % of rear wall line taken by significant openings, by length %, to the nearest
10%L %opn % of left wall line taken by significant openings, by length %, to the nearest
10%R %opn % of right wall line taken by significant openings, by length %, to the nearest
10%Weight Total building weight kipsF Base shear coefficient for use with 1997 UBCCa*Na Site seismicity parameters, per 1997 UBC. Where 2003 IBC was
used, Sds is listed instead.R Response modification factor per UBC or IBC.75V Code base shear factored by 0.75 per IEBC A4 kips.75V2 Shear demand for second story, corresponding to 0.75V kips.75V / W Base shear coefficient, (0.75V) / WeightLong DCR 1 Aggregate demand capacity ratio for the first story walls in the
long directionShort DCR 1 Aggregate demand capacity ratio for the first story walls in the
short directionLong WSR Weak story ratio in the long directionShort WSR Weak story ratio in the short directionStiffness calcu-lation
Method used to calculate stiffness and soft story ratio “mkQ” indicates an unclear refer-ence to FEMA 356. “IBC2305” indicates IBC, Section 2305.
Table A-1 (con’t) Legend for database fields presented in Appendix A
Field Name Description Units, Typical entries

77
Table A-2 Selected data for 52 buildings: Miscellaneous data(Buildings ordered by height and area; pre-1950 buildings shown shaded.)
ID Firm Age Stories Units First floor occupancy Configuration notes
940 H ’50s 2 5 Res (2), Bus 826 B ’60s 2 5 Res (2), Pkg, Stor, Util859 E ’60s 2 5 Res (2), Pkg 885 J ’60s 2 5 Res (2), Pkg, Util crawlspace over conc
stemwalls at res area523 I ’60s 2 6 Res (?), Pkg crawl space (assume
concrete stemwalls)379 M1 A ’50s 2 5 Res (2), Pkg, Stor, Util 1 cmu wall segment
in 1st st long dir.535 S D ’50s 2 6 Res (?), Pkg 696 A ’50s 2 7 Res (3), Pkg, Stor, Util crawlspace over conc
stemwalls at res area863 B ’60s 2 6 Res (3), Pkg 889 D ’50s 2 5 Res (2), Pkg 854 B ’60s 2 7 Res (2), Pkg 853 A ’50s 2 7 Res (2), Pkg, Stor819 B ’60s 2 8 Res (4), Pkg crawlspace with con-
crete stem walls820 B ’60s 2 8 Res (4), Pkg crawlspace with con-
crete stem walls773 B ’60s 2 6 Res (3), Pkg, Util corner setback at flr
2 over pkg area858 G ’50s 2 7 Res (3), Pkg, Util, Stor crawlspace over conc
stemwalls at res area521 C ’60s 2 5 Res (?), Pkg, Util784 B ’60s 2 5 Res (2), Pkg barbell plan897 A ’40s 2 7 Bus 869 C ’60s 2 8 Res (2), Pkg U-shape plan868 A ’50s 2 19 Res (9), Ctyd O-shape plan;
crawlspace over conc stemwalls at res area
314 P ’00s 2 8 Merc, Assy (?) large lightwell at st 2636 H ’20s 3 3 Res (1), Pkg, Util881 L ’60s 3 8 Res (3), Pkg, Util partial 3rd story626 C ’60s 3 6 Res (2), Pkg, Stor short conc stem
walls at west end302 B ’30s 3 9 Res (2), Pkg 497 F ’50s 3 8 Res (2), Pkg, Util851 B ’60s 3 10 Res (2), Pkg 426 B ’20s 3 8 Pkg, Stor, Util setback at lightwell

78
Table A-2 (con’t) Selected data for 52 buildings: Miscellaneous data(Buildings ordered by height and area; pre-1950 buildings shown shaded.)
810 O ’60s 3 8 Merc, Pkg 837 A ’60s 3 8 Res (2), Pkg, Util492 N ’60s 3 9 Res, Pkg, Stor 379 M2 A ’60s 3 8 Res (2), Pkg, Lobby, Stor829 A ’60s 3 9 Res (1), Pkg, Util, Stor842 E ’50s 3 14 Res (4), Pkg, Util830 B ’50s 3 8 Pkg, Util partial height conc
walls in st 11000 O ’10s 3 6 Bus (E) chevron braces
at storefront, vert complexity
072 A ’60s 3 9 Res (1), Pkg, Util, Stor551 U ’40s 3 9 Res (1), Pkg, Util, Stor379 B B ’60s 3 10 Pkg, Stor barbell plan379 G C ’60s 3 11 Res (1?), Pkg, Stor481 C ’60s 3 19 Res (?), Pkg, Util744 K ’60s 3 10 Pkg, Stor barbell plan811 Q ’00s 3 10 Merc trapezoid plan due to
odd site1006 R ’20s 3 nr Res (1), Merc, Lobby trapezoid plan, par-
tial mezzanine, full bsmt
884 M ’60s 3 15 Res (3), Pkg, Util845 A ’60s 3 19 Res (3), Pkg, Util, Lobby/
CtydO-shape plan
771 C ’50s 3 18 Res (4), Pkg, Driveway L-shape plan425 B ’20s 4 6 Res (bldg office), Pkg, Stor,
Util379 O S ’20s 4 18 Pkg, Lobby, Util, Stor699 T ’30s 4 24 Pkg, Stor, Util barbell plan429 A ’20s 4 37 Bus, Lobby, Pkg sloped grade at front;
variable ht walls
ID Firm Age Stories Units First floor occupancy Configuration notes

79
Table A-3 Selected data for 52 buildings: Construction and sheathing capacity(Buildings ordered by height and area; pre-1950 buildings shown shaded.)
ID Firm Stories 2nd floor diaphragm
Perimeter WSP
Partition WSP
Perimeter wall strength [plf]
Parti-tion wall strength [plf]
940 H 2 plwd, gypbd no no nr nr826 B 2 nr no no 223 64859 E 2 plwd (5/8") no no 200 0885 J 2 plwd (1/2") no no 200 150523 I 2 u ("1-inch
nominal sheathing")
no no nr nr
379 M1 A 2 plwd, gypbd no no 150 150535 S D 2 1x diag shtg no no nr nr696 A 2 plwd ("ply-
wood-like panels")
no no 150 150
863 B 2 u no no 175 nr889 D 2 plwd no no nr nr854 B 2 u no no 175 75853 A 2 plwd no no 150 150819 B 2 diag
shtg+furtex insul.
no no 175 75
820 B 2 diag shtg+furtex insul.
no no 175 75
773 B 2 plwd no no 175 75858 G 2 str shtg no no 200 80521 C 2 plwd (5 ply),
stucco (7/8" at pkg)
yes no 200 nr
784 B 2 nr no no 223 nr897 A 2 1x shtg no no 275 150869 C 2 plwd (5 ply),
stucco (7/8" at pkg)
yes no 200 0
868 A 2 plwd no no 150 150314 P 2 1x str shtg,
pwlno no 200 200
636 H 3 plwd, gypbd yes U 384 280881 L 3 plwd (5/8") yes yes 220 115626 C 3 plwd yes yes 200 200

80
302 B 3 u no no 175 75497 F 3 plwd yes no 400 150851 B 3 plwd, gypbd yes no 260 75426 B 3 nr no no 223 255810 O 3 plwd, stucco
(at pkg)yes no 240 nr
837 A 3 plwd (ply-score)
yes no 300 150
492 N 3 plwd yes no 200 nr379 M2 A 3 plwd no no 150 150829 A 3 nr no no 275 150842 E 3 plwd (5/8") yes no 260 nr830 B 3 diag shtg yes/no no 175 nr1000 O 3 1x str shtg,
pwlno no 0 0
072 A 3 plwd, pml yes no 300 150551 U 3 plwd yes no 300 nr379 B B 3 plwd (5/8
t&g)yes no 260 75
379 G C 3 plwd (5 ply), stucco (at pkg)
yes no 200 nr
481 C 3 plwd yes yes 200 200744 K 3 plwd ("wood
floor sheath-ing")
yes no 260 220
811 Q 3 diag shtg no (diag shtg)
no nr nr
1006 R 3 1x shtg no no 500 (ult) 500 (ult)884 M 3 plwd (1.125") yes yes 380 380845 A 3 plwd (1.125") yes yes 380 380771 C 3 plwd (3/4") yes yes 425 200425 B 4 nr yes yes 260 260379 O S 4 diag shtg no (horiz
shtg)no 400 200
699 T 4 1x6 str shtg no no 175 0429 A 4 str shtg no no 300 300
Table A-3 (con’t) Selected data for 52 buildings: Construction and sheathing ca-pacity (Buildings ordered by height and area; pre-1950 buildings shown shaded.)
ID Firm Stories 2nd floor diaphragm
Perimeter WSP
Partition WSP
Perimeter wall strength [plf]
Parti-tion wall strength [plf]

81
Table A-4 Selected data for 52 buildings: Area, dimensions, and measures of openness (Buildings ordered by height and area; pre-1950 buildings shown shaded.)
ID Stories GSF 1
GSF Tot
GSF Open
GSF Open/1
F dim
B dim
L dim
R dim
F %opn
B %opn
L %opn
R %opn
940 2 1380 2944 500 0.362 20.0 22.0 65.0 65.0 100 0 0 50826 2 1922 4116 522 0.271 24.7 24.7 77.8 77.8 100 60 60 50859 2 2080 4160 672 0.323 32.0 32.0 65.0 65.0 100 0 70 60885 2 2012 4248 576 0.286 24.0 32.0 76.0 76.0 20 50 60 70523 2 2400 5000 667 0.278 29.0 29.0 100.0 100.0 100 nr nr nr379 M1
2 2515 5030 597 0.238 32.0 32.0 78.6 78.6 100 80 50 50
535 S 2 2533 5066 753 0.297 35.0 26.0 86.0 86.0 100 0 60 60696 2 2348 5104 411 0.175 26.3 22.4 104.8 104.8 100 80 50 70863 2 2555 5110 340 0.133 35.0 35.0 70.0 73.0 60 60 50 60889 2 2565 5130 570 0.222 28.5 28.5 90.0 90.0 100 70 50 80854 2 2436 5177 1344 0.552 24.0 24.0 101.5 101.5 60 30 90 10853 2 2486 5381 1356 0.545 24.0 24.0 102.0 102.0 50 30 10 90819 2 2737 5813 330 0.121 32.3 32.3 84.7 82.7 60 40 80 50820 2 2737 5813 330 0.121 32.3 32.3 84.7 82.7 60 40 80 50773 2 2956 5967 711 0.241 63.0 70.3 34.0 31.0 100 40 60 50858 2 3025 6050 740 0.245 55.0 55.0 55.0 55.0 80 40 30 50521 2 3030 6060 625 0.206 30.2 30.2 100.3 100.3 100 50 80 70784 2 2978 6234 1232 0.414 32.0 42.0 104.0 104.0 70 60 70 20897 2 3724 7448 2820 0.757 51.0 51.0 70.0 70.0 70 30 20 0869 2 3817 8150 2112 0.553 40.0 65.0 80.0 80.0 0 50 20 20868 2 7153 14928 790 0.110 87.0 87.0 101.4 101.4 60 30 50 50314 2 7569 15138 4530 0.598 87.0 87.0 87.0 87.0 70 0 20 100636 3 864 2600 346 0.400 24.0 24.0 36.0 36.0 50 70 90 10881 3 2347 5689 369 0.157 32.5 32.5 72.2 72.2 0.6 50 40 50626 3 1826 5742 716 0.392 83.0 83.0 20.3 20.3 70 60 50 50302 3 2387 7160 780 0.327 39.5 31.0 69.5 69.5 100 60 50 60497 3 2208 7176 368 0.167 32.0 32.0 69.0 69.0 100 20 50 50851 3 2412 7236 1214 0.503 38.0 30.0 78.0 78.0 60 100 60 30426 3 2454 7362 1491 0.608 49.0 43.0 54.0 54.0 100 0 30 70810 3 2475 7426 1387 0.560 34.0 34.0 72.8 72.8 80 100 40 70837 3 2284 7644 410 0.180 31.5 31.5 72.5 72.5 30 80 60 30492 3 2782 8346 257 0.093 39.0 39.0 71.0 71.0 60 100 60 60379 M2
3 2719 8546 621 0.228 42.5 42.5 67.5 67.5 80 30 50 50
829 3 2750 9030 1074 0.391 50.0 50.0 55.0 55.0 80 80 0 30842 3 2835 9345 675 0.238 27.0 27.0 105.0 105.0 100 20 70 40

82
Table A-4 (con’t) Selected data for 52 buildings: Area, dimensions, and measures of openness (Buildings ordered by height and area; pre-1950 buildings shown shaded.)
ID Stories GSF 1
GSF Tot
GSF Open
GSF Open/1
F dim
B dim
L dim
R dim
F %opn
B %opn
L %opn
R %opn
830 3 2896 9412 2706 0.934 32.0 32.0 90.5 90.5 40 20 0 01000 3 3337 9459 3337 1.000 71.0 71.0 48.0 45.0 70 10 30 0072 3 2926 9590 1492 0.510 74.0 81.5 37.0 37.0 100 70 30 30551 3 3330 9989 1680 0.505 42.5 42.5 87.0 80.0 60 100 30 20379 B 3 3434 10302 1532 0.446 41.4 41.4 103.0 103.0 60 90 60 20379 G 3 3740 11220 2993 0.800 31.0 31.0 106.0 106.0 70 100 90 30481 3 3850 11550 2216 0.576 42.0 35.0 110.0 110.0 80 30 40 70744 3 4011 12033 1308 0.326 41.0 41.8 103.0 103.0 60 100 30 30811 3 4400 12800 nr nr nr nr nr nr 100 nr nr 01006 3 4837 13677 3685 0.762 74.7 74.7 55.0 74.5 100 0 0 0884 3 4545 14115 1681 0.370 72.0 72.0 60.0 65.0 70 100 20 0845 3 6300 18300 2100 0.333 75.0 87.5 73.0 61.0 40 100 30 0771 3 6277 20212 2288 0.364 73.0 30.5 164.0 164.0 70 30 80 50425 4 2140 8560 960 0.449 48.0 48.0 46.0 46.0 100 40 20 20379 O 4 4190 16760 2900 0.692 41.5 41.5 101.0 101.0 80 60 10 10699 4 5051 20642 2953 0.585 51.0 65.0 111.0 111.0 100 10 60 60429 4 5223 20892 3198 0.612 50.0 41.0 123.0 123.0 80 nr nr nr

83
Table A-5 Selected data for 52 buildings: Weight and seismic demand parameters (Buildings ordered by height and area; pre-1950 buildings shown shaded.)
ID Firm Stories GSF Tot Weight F Ca*Na R .75V .75V2 .75V / W940 H 2 2944 54 na Sds=1.15 6.5 7.2 4.1 0.133826 B 2 4116 110 2.5 0.66 4.5 30.4 18.6 0.276859 E 2 4160 127 2.5 0.66 5.5 28.5 16.6 0.225885 J 2 4248 139 2.5 0.66 4.5 37.3 21.9 0.269523 I 2 5000 nr 2.5 0.66 4.5 nr nr 0.275379 M1 A 2 5030 164 3 0.65 5.5 43.5 17.4 0.265535 S D 2 5066 129 na Sds=1.23 6.5 18.4 8.7 0.142696 A 2 5104 193 3 0.66 5.5 52.1 22.1 0.270863 B 2 5110 161 2.5 0.66 4.5 44.2 27.6 0.275889 D 2 5130 134 na Sds=1.22 6.5 18.9 9.4 0.141854 B 2 5177 169 2.5 0.66 5.5 37.9 22.8 0.225853 A 2 5381 176 3 0.65 5.5 46.9 19.5 0.267819 B 2 5813 186 2.5 0.66 4.5 51.4 30.0 0.276820 B 2 5813 186 2.5 0.66 4.5 51.4 30.0 0.276773 B 2 5967 147 2.5 0.66 4.5 40.5 23.2 0.275858 G 2 6050 213 2.5 0.53 4.5 46.2 27.3 0.218521 C 2 6060 136 2.5 0.66 5.5 30.6 16.9 0.225784 B 2 6234 182 2.5 0.66 5.5 41.0 22.9 0.225897 A 2 7448 215 3 0.65 5.5 57.1 27.1 0.266869 C 2 8150 214 2.5 0.66 4.5 58.9 30.9 0.275868 A 2 14928 481 3 0.62 5.5 121.0 70.0 0.252314 P 2 15138 394 2.5 0.53 4.5 129.9 81.8 0.330636 H 3 2600 nr 2.5 0.66 5.6 11.0 nr 0.221881 L 3 5689 113 na 0.62 6.5 20.0 14.0 0.178626 C 3 5742 134 2.5 0.66 4.5 37.2 29.7 0.278302 B 3 7160 236 2.5 0.66 4.5 65.0 53.5 0.275497 F 3 7176 190 na Sds=1.33 6.5 28.7 23.1 0.150851 B 3 7236 285 2.5 0.66 5.5 64.3 51.5 0.226426 B 3 7362 267 2.5 0.66 4.5 73.4 59.8 0.275810 O 3 7426 270 2.5 0.62 5.5 56.7 45.4 0.210837 A 3 7644 230 3 0.66 5.5 62.2 41.6 0.270492 N 3 8346 255 2.5 0.70 5.5 57.4 44.5 0.225379 M2 A 3 8546 276 3 0.65 5.5 73.4 47.4 0.266829 A 3 9030 184 3 0.66 5.5 49.8 39.9 0.270842 E 3 9345 344 2.5 0.66 5.5 73.4 58.9 0.213830 B 3 9412 277 2.5 0.62 4.5 71.1 65.4 0.2571000 O 3 9459 450 2.5 0.62 nr nr nr nr072 A 3 9590 355 3 0.66 5.5 95.9 61.6 0.270

84
Table A-5 (con’t) Selected data for 52 buildings: Weight and seismic demand parameters (Buildings ordered by height and area; pre-1950 buildings shown shaded.)
ID Firm Stories GSF Tot Weight F Ca*Na R .75V .75V2 .75V / W551 U 3 9989 283 3 0.66 4.5 81.2 50.4 0.286379 B B 3 10302 374 2.5 0.66 5.5 84.0 66.6 0.225379 G C 3 11220 288 2.5 0.66 4.5 79.3 64.3 0.275481 C 3 11550 365 2.5 0.62 4.5 93.6 74.6 0.257744 K 3 12033 351 2.5 0.66 5.5 79.2 62.9 0.226811 Q 3 12800 285 2.5 0.66 3.5 99.8 79.9 0.3501006 R 3 13677 796 2.5 0.53 4.5 173.2 130.2 0.218884 M 3 14115 446 2.5 0.66 5.5 100.5 80.4 0.225845 A 3 18300 467 3 0.66 5.5 126.1 77.6 0.270771 C 3 20212 540 2.5 0.66 4.5 148.1 113.1 0.274425 B 4 8560 341 2.5 0.66 5.5 76.7 70.3 0.225379 O S 4 16760 451 2.5 0.66 5.5 101.5 92.1 0.225699 T 4 20642 352 2.5 0.53 4.5 115.8 103.9 0.329429 A 4 20892 651 3 0.60 5.5 160.1 119.0 0.246

85
Table A-6 Selected data for 52 buildings: IEBC A4 metrics: DCR and WSR (Build-ings ordered by height and area; pre-1950 buildings shown shaded.)
ID Firm Stories
Perim-eter wall strength [plf]
Parti-tion wall strength [plf]
.75V Long DCR 1
Short DCR 1
Long WSR
Short WSR
Stiffness calcula-tion
940 H 2 nr nr 7.2 nr nr nr nr none826 B 2 223 64 30.4 1.34 3.76 0.91 0.92 mkQ859 E 2 200 0 28.5 4.02 1.67 0.48 1.11 none885 J 2 200 150 37.3 3.00 1.40 0.77 1.75 none523 I 2 nr nr nr nr nr nr nr none379 M1 A 2 150 150 43.5 1.47 1.60 0.98 0.87 IBC2305535 S D 2 nr nr 18.4 0.71 2.78 nr nr none696 A 2 150 150 52.1 1.96 1.75 0.78 0.87 IBC2305863 B 2 175 nr 44.2 2.19 2.47 nr 2.14 mkQ889 D 2 nr nr 18.9 2.94 2.86 nr nr none854 B 2 175 75 37.9 1.49 2.22 1.22 1.39 mkQ853 A 2 150 150 46.9 1.56 1.80 0.89 0.74 IBC2305819 B 2 175 75 51.4 2.94 2.38 1.22 1.00 mkQ820 B 2 175 75 51.4 2.94 2.38 1.22 1.00 mkQ773 B 2 175 75 40.5 1.68 2.49 NC nr none858 G 2 200 80 46.2 nr nr 0.63 nr H/L
proxy521 C 2 200 nr 30.6 1.44 2.24 0.68 0.65 none784 B 2 223 nr 41.0 1.06 1.51 0.90 0.82 mkQ897 A 2 275 150 57.1 0.78 2.47 1.13 0.71 IBC2305869 C 2 200 0 58.9 2.18 3.77 1.13 0.66 none868 A 2 150 150 121.0 1.44 1.36 0.87 0.93 IBC2305314 P 2 200 200 129.9 4.24 4.31 nr nr none636 H 3 384 280 11.0 0.61 0.44 nr nr none881 L 3 220 115 20.0 0.99 1.01 1.04 1.19 none626 C 3 200 200 37.2 1.56 2.63 0.60 0.93 none302 B 3 175 75 65.0 2.54 6.97 1.29 0.58 mkQ497 F 3 400 150 28.7 2.35 1.10 0.81 1.25 Rel.
rigidity851 B 3 260 75 64.3 1.35 2.80 1.97 1.03 mkQ426 B 3 223 255 73.4 1.54 1.96 1.47 1.40 mkQ810 O 3 240 nr 56.7 2.19 3.92 nr nr none837 A 3 300 150 62.2 2.22 1.84 0.95 1.01 IBC2305492 N 3 200 nr 57.4 2.60 3.20 2.11 0.79 none379 M2 A 3 150 150 73.4 2.24 2.36 1.03 0.76 IBC2305829 A 3 275 150 49.8 0.85 2.80 1.21 0.88 IBC2305

86
842 E 3 260 nr 73.4 2.26 4.73 1.25 1.00 none830 B 3 175 nr 71.1 1.63 6.45 3.03 0.90 mkQ1000 O 3 0 0 nr nr nr nr nr none072 A 3 300 150 95.9 2.07 1.85 1.20 0.81 IBC2305551 U 3 300 nr 81.2 nr nr nr nr none379 B B 3 260 75 84.0 1.19 3.44 2.01 1.23 mkQ379 G C 3 200 nr 79.3 3.60 16.20 0.79 0.91 none481 C 3 200 200 93.6 3.93 2.49 0.82 0.86 none744 K 3 260 220 79.2 nr nr nr nr none811 Q 3 nr nr 99.8 nr nr nr nr none1006 R 3 500 (ult) 500 (ult) 173.2 2.34 1.18 0.58 0.73 FEMA
356884 M 3 380 380 100.5 1.54 1.35 1.09 1.17 none845 A 3 380 380 126.1 1.81 0.69 1.44 2.09 IBC2305771 C 3 425 200 148.1 1.57 1.66 0.73 0.83 none425 B 4 260 260 76.7 2.23 2.45 0.71 1.62 mkQ379 O S 4 400 200 101.5 0.91 8.67 0.37 0.13 none699 T 4 175 0 115.8 1.56 nr nr nr none429 A 4 300 300 160.1 1.17 3.11 1.35 0.42 IBC2305
Table A-6 (con’t) Selected data for 52 buildings: IEBC A4 metrics: DCR and WSR (Buildings ordered by height and area; pre-1950 buildings shown shaded.)
ID Firm Stories
Perim-eter wall strength [plf]
Parti-tion wall strength [plf]
.75V Long DCR 1
Short DCR 1
Long WSR
Short WSR
Stiffness calcula-tion