BENZODIAZEPINE-MEDIATED REGULATION OFa1, a2, b1–3 AND …
12
BENZODIAZEPINE-MEDIATED REGULATION OF a1, a2, b1–3 AND g2 GABA A RECEPTOR SUBUNIT PROTEINS IN THE RAT BRAIN HIPPOCAMPUS AND CORTEX* S. CHEN,² X. HUANG,² X. J. ZENG,² W. SIEGHART‡ and E. I. TIETZ²§ ²Department of Pharmacology, Medical College of Ohio, 3035 Arlington Ave., Toledo, OH 43614-5804, U.S.A. ‡Department of Biochemical Psychiatry, University Clinic for Psychiatry, Vienna, Austria Abstract —Prolonged flurazepam exposure regulates the expression of selected (a1, b2, b3) GABA A receptor subunit messenger RNAs in specific regions of the hippocampus and cortex with a time-course consistent with benzodiazepine tolerance both in vivo and in vitro. In this report, the immunostaining density of six specific GABA A receptor subunit (a1, a2, b1–3 and g2) antibodies was measured in the hippocampus and cortex, among other brain areas, in slide-mounted brain sections from flurazepam-treated and control rats using quantitative computer-assisted image analysis techniques. In parallel with the localized reduction in a1 and b3 subunit messenger RNA expression detected in a previous study, relative a1 and b3 subunit antibody immunostaining density was significantly decreased in flurazepam-treated rat hippocampal CA1, CA3 and dentate dendritic regions, and in specific cortical layers. Quantitative western blot analysis showed that b3 subunit protein levels in crude homogenates of the hippocampal dentate region from flurazepam-treated rats, an area which showed fairly uniform decreases in b3 subunit immunostaining (16–21%), were reduced to a similar degree (18%). The latter findings provide independent support that relative immunostaining density may provide an accurate estimate of protein levels. Consistent with the absence of the regulation of their respective messenger RNAs immediately after ending flurazepam administration, no changes in the density of a2, b1 or b2 subunit antibody immunostaining were found in any brain region. g2 subunit antibody staining was changed only in the dentate molecular layer. The selective changes in GABA A receptor subunit antibody immunostaining density in the hippocampus suggested that a change in the composition of GABA A receptors involving specific subunits (a1 and b3) may be one mechanism underlying benzodiazepine anticonvulsant tolerance. q 1999 IBRO. Published by Elsevier Science Ltd. Key words: tolerance, flurazepam, quantitative immunohistochemistry, dentate gyrus, limbic system, CA1 pyramidal cells. Although effective anxiolytics and hypnotics, the clinical use of benzodiazepines as anticonvulsants is limited by tolerance development during prolonged administration. A large body of evidence has indicated that benzodiazepine tolerance is related to a reduction in GABA A receptor-mediated fast inhi- bitory synaptic transmission (for reviews see Refs 2 and 27). The native GABA A receptor is a pentamer composed of combinations of homologous proteins derived from five sub- unit families with multiple variants (a1–6, b1–4, g1–3, d1 and e1). 8,11,34 The GABA A receptor macromolecule contains binding domains for GABA and several allosteric modulators, including a well-characterized benzodiazepine binding site. 59 Benzodiazepines potentiate GABA A receptor-mediated inhi- bitory function by increasing the opening probability of the integral Cl 2 channel, 52,62 and may increase Cl 2 channel conductance. 13 Although the synaptic mechanisms mediating benzodiaze- pine tolerance have not been determined, evidence has accu- mulated that a change in subunit-specific expression of neuronal GABA A receptor subtypes may modify inhibitory function during long-term benzodiazepine treat- ment. 21,22,27,29,30,44,49,65,66,80,81 Consistent with this hypothesis, time-dependent changes in the mRNA expression of specific GABA A receptor subunits (a1, b2 and b3) were localized to distinct hippocampal and cerebral cortical cell groups, 65,66 following one-week oral flurazepam administration. None the less, no direct link has been provided between changes in GABA A receptor subunit mRNA expression, changes in subunit protein expression and changes in GABA A receptor function. The recent availability of subunit-specific antibodies for GABA A receptor subunit variants prompted these immuno- histochemical studies. The specific goal was to establish whether there is a relationship between the reduced expres- sion of specific GABA A receptor subunit mRNAs in hippo- campal and cortical neurons, 65,66 and the expression of selected GABA A receptor subunit proteins (a1, a2, b1–3 and g2). This relationship was investigated after an in vivo benzodiazepine treatment which reliably results in decreased GABA A receptor function in CA1 pyramidal cells, 73–78 but not dentate granule cells. 46 A reliable and sensitive compu- ter-assisted image analysis method 23 was used to detect regio- nal differences in GABA A receptor subunit protein immunostaining in the hippocampus, cortex and selected rat brain regions immediately after cessation of one-week oral flurazepam administration. The validity of this methodology to detect changes in rat brain protein levels was also assessed by western blot analysis of the b3 subunit antibody in crude homogenates of the dentate region of the hippocampus. EXPERIMENTAL PROCEDURES Animal model Rats orally administered flurazepam in the drinking water for one week become tolerant to benzodiazepine suppression of pentylenete- trazole-induced seizures in vivo, 53,54 diazepam’s action to potentiate 33 Neuroscience Vol. 93, No. 1, pp. 33–44, 1999 Copyright q 1999 IBRO. Published by Elsevier Science Ltd Printed in Great Britain. All rights reserved 0306-4522/99 $20.00+0.00 PII: S0306-4522(99)00118-9 Pergamon *Portions of this work have appeared in abstract form: Soc. Neurosci. Abstr. (1996) Abstract 22, 1285. §To whom correspondence should be addressed. Abbreviations: HRP, horseradish peroxidase; OD, optical density; TBS, Tris-buffered saline.
Transcript of BENZODIAZEPINE-MEDIATED REGULATION OFa1, a2, b1–3 AND …

BENZODIAZEPINE-MEDIATED REGULATION OFa1, a2, b1–3 AND g2 GABAA
RECEPTOR SUBUNIT PROTEINS IN THE RAT BRAIN HIPPOCAMPUS ANDCORTEX*
S. CHEN,† X. HUANG,† X. J. ZENG,† W. SIEGHART‡ and E. I. TIETZ†§†Department of Pharmacology, Medical College of Ohio, 3035 Arlington Ave., Toledo, OH 43614-5804, U.S.A.
‡Department of Biochemical Psychiatry, University Clinic for Psychiatry, Vienna, Austria
Abstract—Prolonged flurazepam exposure regulates the expression of selected (a1,b2,b3) GABAA receptor subunit messengerRNAs in specific regions of the hippocampus and cortex with a time-course consistent with benzodiazepine tolerance bothin vivoandin vitro. In this report, the immunostaining density of six specific GABAA receptor subunit (a1, a2,b1–3 andg2) antibodieswas measured in the hippocampus and cortex, among other brain areas, in slide-mounted brain sections from flurazepam-treatedand control rats using quantitative computer-assisted image analysis techniques. In parallel with the localized reduction ina1 andb3 subunit messenger RNA expression detected in a previous study, relativea1 andb3 subunit antibody immunostaining densitywas significantly decreased in flurazepam-treated rat hippocampal CA1, CA3 and dentate dendritic regions, and in specific corticallayers. Quantitative western blot analysis showed thatb3 subunit protein levels in crude homogenates of the hippocampal dentateregion from flurazepam-treated rats, an area which showed fairly uniform decreases inb3 subunit immunostaining (16–21%), werereduced to a similar degree (18%). The latter findings provide independent support that relative immunostaining density mayprovide an accurate estimate of protein levels. Consistent with the absence of the regulation of their respective messenger RNAsimmediately after ending flurazepam administration, no changes in the density ofa2, b1 orb2 subunit antibody immunostainingwere found in any brain region.g2 subunit antibody staining was changed only in the dentate molecular layer.
The selective changes in GABAA receptor subunit antibody immunostaining density in the hippocampus suggested that a changein the composition of GABAA receptors involving specific subunits (a1 andb3) may be one mechanism underlying benzodiazepineanticonvulsant tolerance.q 1999 IBRO. Published by Elsevier Science Ltd.
Key words: tolerance, flurazepam, quantitative immunohistochemistry, dentate gyrus, limbic system, CA1 pyramidal cells.
Although effective anxiolytics and hypnotics, the clinical useof benzodiazepines as anticonvulsants is limited by tolerancedevelopment during prolonged administration. A large bodyof evidence has indicated that benzodiazepine tolerance isrelated to a reduction in GABAA receptor-mediated fast inhi-bitory synaptic transmission (for reviews see Refs 2 and 27).The native GABAA receptor is a pentamer composed ofcombinations of homologous proteins derived from five sub-unit families with multiple variants (a1–6,b1–4,g1–3, d1ande1).8,11,34 The GABAA receptor macromolecule containsbinding domains for GABA and several allosteric modulators,including a well-characterized benzodiazepine binding site.59
Benzodiazepines potentiate GABAA receptor-mediated inhi-bitory function by increasing the opening probability of theintegral Cl2 channel,52,62 and may increase Cl2 channelconductance.13
Although the synaptic mechanisms mediating benzodiaze-pine tolerance have not been determined, evidence has accu-mulated that a change in subunit-specific expression ofneuronal GABAA receptor subtypes may modify inhibitoryfunction during long-term benzodiazepine treat-ment.21,22,27,29,30,44,49,65,66,80,81Consistent with this hypothesis,time-dependent changes in the mRNA expression of specificGABAA receptor subunits (a1, b2 andb3) were localized todistinct hippocampal and cerebral cortical cell groups,65,66
following one-week oral flurazepam administration. Nonethe less, no direct link has been provided between changesin GABAA receptor subunit mRNA expression, changes insubunit protein expression and changes in GABAA receptorfunction.
The recent availability of subunit-specific antibodies forGABAA receptor subunit variants prompted these immuno-histochemical studies. The specific goal was to establishwhether there is a relationship between the reduced expres-sion of specific GABAA receptor subunit mRNAs in hippo-campal and cortical neurons,65,66 and the expression ofselected GABAA receptor subunit proteins (a1, a2, b1–3andg2). This relationship was investigated after anin vivobenzodiazepine treatment which reliably results in decreasedGABAA receptor function in CA1 pyramidal cells,73–78 butnot dentate granule cells.46 A reliable and sensitive compu-ter-assisted image analysis method23 was used to detect regio-nal differences in GABAA receptor subunit proteinimmunostaining in the hippocampus, cortex and selected ratbrain regions immediately after cessation of one-week oralflurazepam administration. The validity of this methodologyto detect changes in rat brain protein levels was also assessedby western blot analysis of theb3 subunit antibody in crudehomogenates of the dentate region of the hippocampus.
EXPERIMENTAL PROCEDURES
Animal model
Rats orally administered flurazepam in the drinking water for oneweek become tolerant to benzodiazepine suppression of pentylenete-trazole-induced seizuresin vivo,53,54 diazepam’s action to potentiate
Regulation of hippocampal GABAA receptor subunit proteins 33
33
NeuroscienceVol. 93, No. 1, pp. 33–44, 1999Copyrightq 1999 IBRO. Published by Elsevier Science Ltd
Printed in Great Britain. All rights reserved0306-4522/99 $20.00+0.00PII: S0306-4522(99)00118-9
Pergamon
*Portions of this work have appeared in abstract form:Soc. Neurosci. Abstr.(1996) Abstract 22, 1285.
§To whom correspondence should be addressed.Abbreviations: HRP, horseradish peroxidase; OD, optical density; TBS,
Tris-buffered saline.

CA1 pyramidal cell population responsesin vitro74 and zolpidem’saction to prolong miniature inhibitory postsynaptic current decay.77
During oral flurazepam administration, rats become tolerant to benzo-diazepine anticonvulsant actions, but not dependent. Rats do not showany overt behavioral effects or a spontaneous withdrawal syndrome,and only very mild precipitated abstinence signs, e.g., piloerection canbe elicited with a very high dose (16 mg/kg, i.v.) of the antagonist,flumazenil.68
Adult, male Sprague–Dawley rats (Harlan, Indianapolis, IN; initialweight 180–225 g) received flurazepam for one week in 0.02%saccharin (100 mg/kg for three days, 150 mg/kg for four days) astheir sole source of drinking water. Only rats that consumed a criteriondose,66,75i.e. a weekly average of.100 mg/kg/day, were used in theseexperiments. Control rats received saccharin water for the same lengthof time.66,75Rats were killed for brain section preparation immediatelyafter ending one-week flurazepam administration, when maximalreductions in botha1 andb3 subunit mRNA expression were detectedin the hippocampus and cortex.24,65
Brain section preparation
Sections (10mm) cut from saline-perfused brains derived fromflurazepam-treated and matched control rats were postfixed for detec-tion of antibody staining. Immediately after the end of one-weekflurazepam or saccharin treatment, rats were anesthetized with keta-mine (80 mg/kg, i.m.) and transcardially perfused with 200 ml ice-cold0.9% saline for 2 min at a constant rate (100 ml/min) to reduce the non-specific immunolabeling prior to postfixation of sections. Rat brainswere rapidly frozen in isopentane (2708C) in an acetone/dry ice bathfor 15 s. Parasagittal brain sections (10mm) were cut on a cryostat at2128C and thaw-mounted on to poly-l-lysine-coated slides forimmunohistochemical studies.27 Brain sections were stored at2708Cuntil used.
Polyclonal GABAA receptor subunit antibodies
Detailed descriptions of the polyclonal antibodies used werereported recently by Sperket al.61 The antibodies were raised in rabbitsagainst rat specific amino acid residues of thea1, a2, b1–3 andg2subunits of the GABAA receptor (a1: 1–9;a2: 416–424;b1: 350–404;b2: 351–405;b3: 345–408;g2: 316–352).8,16 The a1 anda2 anti-bodies were coupled to keyhole limpet hemocyanine. Thea1 antibodywas directed against the N-terminus and contained a C-terminalcysteine. Thea2 antibody was directed against the C-terminus andcontained an N-terminal cysteine. Each antibody was affinity purifiedwith corresponding peptides immobilized on thiopropyl-Sepharose 6B.The b1–3 andg2 antibodies were against maltose binding proteinfusion proteins purified using immobilized glutathione-S-transferasefusion proteins. The specificity of each GABAA receptor subunit anti-body was reported previously.16,41,61,70,79The monoclonal anti-actinantibody used for western blot analysis, as a control for total protein,binds to a highly conserved region of actin, an abundant cytoskeletalprotein.
Immunostaining for specific GABAA receptor subunit antibodies
For quantitative measurements in sections derived from experimen-tal groups, tissue prefixation was undesirable, since the degree of fixa-tion between treated and control rats would be difficult to controlduring perfusion. Therefore, flurazepam-treated and control sectionswere postfixed and handled in parallel throughout all procedures, asdescribed previously.24 Flurazepam-treated and control brain sections(10mm) were warmed to room temperature under vacuum for 30 min.Brain sections were immersed in 4% paraformaldehyde (or plus 0.2%picric acid) for 8 min, then washed for 2×5 min in 300 mM Tris–HClsaline buffer (pH 7.2) at room temperature.24,82 Fixed sections wereblocked for 30 min at room temperature with 10% normal goat serum(v/v) plus 0.02% Triton X-100 (v/v) in Tris buffer prior to applicationof the primary antibody (a1: 3mg/ml;a2,b1–3 andg2: 10mg/ml) andincubated overnight at 48C. After three 5-min washes in buffer,matched flurazepam-treated and control sections were incubated withbiotinylated anti-rabbit immunoglobulin G F(ab0)2 fragment (1:250,v/v, Boehringer Mannheim, Mannheim, Germany) for 1 h at 248C.Sections were washed for 3×5 min in buffer and incubated withavidin–biotin–peroxidase complex (1:100 v/v; Vector Laboratories,Burlingame, CA) for 1 h. Immunostaining was visualized followingimmersion of matched flurazepam-treated and control sections in
freshly made, filtered 0.06% diaminobenzidine (Sigma ChemicalCo., St Louis, MO). Hydrogen peroxide (0.02%) was added immedi-ately before the chromogen reaction was initiated. The chromogenreaction was allowed to proceed for no more than 5 min and wasidentical for flurazepam-treated and control groups. Intense stainingwas avoided, as overreaction would interfere with quantitation.27
Sections were dehydrated through 75%, 95% and 100% ethanol(4 min each), cleared with xylene and coverslipped with Permount(Fisher, Pittsburgh, PA) for acquisition of digitized images. Theprimary antibody was left out of the incubation in adjacent sectionsas a negative control. Additional negative controls were used for thebsubunit antibodies, i.e. sections were incubated in the presence of eachb subunit primary antibody preadsorbed with 10mg/ml of the respec-tive fusion proteins for 24 h.
Quantitative measurement of GABAA receptor subunit antibodystaining
Immunostaining intensities in the brain regions of interest weremeasured using a computer-assisted image analysis system.24 A lightbox (Northern Light, Imaging Research, St Catherines, Ontario,Canada) provided constant illumination underneath the slide. Lightintensity was adjusted to provide optimal contrast among differentbrain subregions on tissue sections, but was held constant acrossgroups. The images of the hippocampus and other brain areas ofinterest were acquired with a high-resolution CCD camera (SierraScientific, Sunnyvale, CA) with the aid of NIH Image software(v. 1.59). Images of flurazepam-treated (n�8) and matched control(n�8) brain sections were digitized at the same time, with the samedegree of illumination under identical conditions. Grey values, whichreflect immunostaining density, were measured over the regions ofinterest on the digitized images.24 Specific immunostaining over anarea of interest was defined by subtraction of the background greylevel value measured over the white matter area nearest the regionof interest. Background values were not significantly different betweengroups (P.0.05). All data are expressed as mean^S.E.M. of the rawgrey level values. Regional variations in the distribution of meanGABAA receptor subunit protein staining were compared using arepeated measures ANOVA. Post hoc comparisons were made withorthogonal contrasts.
Quantitative western blot analysis of dentateb3 subunit protein levels
Immunoblot analysis using theb3 subunit antibody was carried outin the dentate region of the hippocampus microdissected from separategroups of one-week flurazepam-treated (n�6) and control (n�6) rats,killed immediately after drug or vehicle removal. Rats were decapi-tated and the left hippocampus was dissected into ice-cold pre-gassed(95% O2/5% CO2) buffer containing (in mM): NaCl 120, KCl 5.0,MgSO4 1.3, NaH2PO4 1.2 CaCl2 2.4, NaHCO3 26, d-glucose 10 (pH7.3). Six to eight 500–750mm transverse sections were cut on a Vibra-tome from the entire hippocampus and stored in ice-cold buffer. Thedentate gyrus (,8 mg tissue, wet weight), including the polymorphregion, was dissected under a microscope (×20, A.O. Instr., Buffalo,NY) on ice and homogenized 20 strokes in 100ml of 0.32 M sucrose ina Potter–Elvejheim homogenizer. Crude homogenates were stored at2808C until used. Protein concentrations were determined usingbovine serum albumin as standard.33
Protein from each flurazepam-treated and control rat dentate gyruswas applied to alternate lanes of each of two 11% sodium dodecylsulfate–polyacrylamide gels. One gel was used for subsequent detec-tion of theb3 subunit protein (,10mg/lane). The second gel was usedfor subsequent detection of actin (,5.25mg/lane; BoehringerMannheim Corp., Indianapolis, IN), to control for total protein,using identical dilutions of the crude dentate homogenates. The mole-cular weights of protein samples were estimated from pre-stained stan-dards (14,300–200,000; Gibco BRL, Gaithersurg, MD). The proteinwas transferred from the gels to Immobilon (polyvinylidene fluoride)membranes (Fisher Biotech, Pittsburgh, PA) for 1 h (90 mA) usingsemi-dry transfer techniques. Membranes were blocked overnight at48C in 2.5% non-fat dry milk in Tris-buffered saline (TBS)/0.1%Tween-20 (Fisher Biotech). Membranes were rinsed for 2×5 min inblocking solution and incubated for 1 h with the primary antibody (b3subunit: 1mg/ml; actin: 1mg/ml) in blocking solution containing0.02% sodium azide at room temperature with shaking. Membraneswere rinsed for 3×5 min with TBS/Tween-20. In preliminary immuno-blot analyses, anti-b3 subunit and anti-actin immunoreactivity on
S. Chenet al.34

membranes was detected using a secondary antibody conjugated toalkaline phosphatase. For quantification ofb3 subunit and actinimmunoreactivity on membranes, the enhanced chemiluminescencemethod (ECL, Amersham, Arlington Heights, IL) was used.Membranes were incubated with the appropriate horseradish peroxi-dase (HRP)-linked secondary antibody [b3 subunit: anti-rabbitimmunoglobulin G–HRP (New England Biolabs, Beverly, MA),1:2000 in TBS/1% gelatin/0.02% sodium azide; actin: anti-mouseimmunoglobulin G–HRP (New England Biolabs), 1:5000 in TBS/gelatin/sodium azide] for 1 h at room temperature. After three 5-minwashes in Tris/Tween-20, membranes were reacted with the chemi-luminescent substrate (Pierce, Rockford, IL) for 1 min. Reactedmembranes were exposed to RX X-ray film (Fuji Medical Systems,U.S.A., Stamford, CT) for 5 s to 20 min and developed.
The density of the bands reflecting theb3 subunit protein or actinprotein was quantified using a densitometer (Model GS-670, BioRad,Hercules, CA) and Molecular Analyst Software (v. 1.1, BioRad). Filmdensity, measured as transmittance, was expressed as volume-adjustedoptical density (OD/mm2). Adjusted OD values, reflectingb3 subunitprotein levels, were determined for each dentate gyrus.b3 subunitprotein level estimates were normalized to the respective individualdensity values reflecting actin protein levels and were expressed as aratio. The difference between the means of the ratios calculated fromdensitometric measures of protein levels derived from control (n�6)and flurazepam-treated (n�6) dentate gyrus was analysed using a one-tailed paired Student’st-test with a significance level ofP#0.05.
RESULTS
Relative subunit antibody immunostaining patterns
Relativea1, a2 andg2 subunit antibody immunostainingpatterns in the hippocampus and other brain regions weresimilar to those extensively described previously using boththe light microscopic and electron microscopic techniques(Fig. 1),15,18,19,42,60,61,82and therefore will not be described infurther detail. The distribution of theb2 subunit has beendescribed previously by Morenoet al.,40 using an antibody
to an alternative epitope. The comparative distributions of theb1–3 antibodies are provided in detail in Sperket al.61
Benzodiazepine regulation of GABAA receptor subunitprotein immunostaining
Computer-assisted image analysis techniques, developedpreviously in our laboratory,24 were used to evaluate theintensity of immunostaining in 10-mm parasagittal rat brainsections (Table 1). Immunostaining density over the hippo-campus and other selected brain areas was compared insections derived from one-week flurazepam-treated andcontrol rats to determine the relative amount of each antigenpresent (n�6–8/group). Grey values over the areas of intereston digitized images of parasagittal brain sections were used torepresent the density ofa1, a2, b1–3 andg2 GABAA recep-tor subunit antibody immunostaining and to statisticallycompare staining between experimental groups (Tables 1–3). For comparisons of changes in levels of protein expressionamong the six subunit antibody staining patterns, the data inthe text and in Figs 4 and 7 are expressed as a percentage ofcontrol expression.
Regulation ofa subunit antibody immunostaining
In comparison to other brain areas, e.g., the cerebral cortex,cerebellum, thalamus and inferior colliculus,a1 antibodyimmunostaining density in parasagittal sections was lowerin the hippocampal formation (Fig. 1). A decrease ina1 sub-unit antibody immunostaining density was found in severalsubregions of the hippocampus (Table 1, Figs 2, 4) and cortex(Table 2, Figs 3, 6) in sections derived from flurazepam-treated rats versus their matched controls. In the hippocampus,
Regulation of hippocampal GABAA receptor subunit proteins 35
Fig. 1. Digital images of serial parasagittal brain sections from a representative control rat. Sections (10mm) were immunostained with one of six specificGABAA receptor subunit subunit antibodies (a1, a2, b1–3,g2). Regional variations in immunohistochemical staining were examined using high-resolutioncomputer-assisted image analysis. The times for the chromogen reactions were non-saturating and not always comparable among subunits. Furthermore, sincedifferences exist among antibody affinities and since the staining protocol was carried out independently for each antibody, only relative comparisons ofstaining density can be made within sections. Immunostaining density was compared in subregions of the hippocampus and cortex, as well as the caudate–putamen, thalamus, substantia nigra pars reticulata (SNpr), inferior and superior colliculus, and cerebellum. Thea1 andb2 subunit antibodies had a similarstaining distribution in the midbrain and had a higher staining density in the cortex than the hippocampus. Thea1 andb2 subunit antibodies were lower in thehippocampus than for other immunopositive regions. Thea2 andb3 antibodies had a similar immunostaining distribution in parasagittal sections except thattheb3 antibody labeled the granule cell layer in the cerebellum, whereasa2 subunit antibody staining was almost absent in the cerebellum.a2,b1,b3 andg2subunit antibodies all strongly labeled the hippocampus with varying distributions.a2, b3 andg2 subunit antibodies also strongly labeled the caudate–putamen and superior colliculus, whereasa1, b2 andg2 antibodies labeled the thalamus, inferior colliculus and substantia nigra pars reticulata, whereg2subunit staining was relatively low. All subunit antibodies labeled cortical layers with varying densities. The cerebellar granule cell layer was stronglyimmunopositive forb2 andb3 subunit antibodies, while the cerebellar molecular layer was strongly positive fora1 andg2 antibodies. Thea2 andb1 subunit
antibodies showed little or no staining in either cerebellar layer.

the mean relative grey value was significantly decreased influrazepam-treated brain sections in CA1 dendritic regions,i.e. a 21% decrease in stratum oriens, a 21% decrease instratum radiatum and a 35% decrease in stratum lacunosum(Table 1, Fig. 4). No significant differences were foundbetween groups in the pyramidal cell layer (Table 1). Asignificant decrease in staining density was also found inthe CA3 strata oriens (238%) and lucidum (238%), butnot the CA3 stratum pyramidale (Table 1, Fig. 4). In thedentate gyrus, a comparison of flurazepam-treated and controlrats indicated a significant decrease in the mean grey valuebetween groups in the inner (233%) and outer (235%)molecular layers, but not in the granule cell or polymorph
cell layers (Fig. 4). Preliminary experiments in 20-mm para-sagittal sections derived from a second group of treated andcontrol rats (n�8/group) revealed similar significant decreasein a1 subunit antibody immunostaining in hippocampalsubregions (data not shown).
A significant decrease ina1 subunit antibody immuno-staining density was also detected in the cortical layers ofparasagittal sections. The pattern of change was most consis-tent in layers V and VI across all cortical regions measured,i.e. the frontal, parietal and occipital cortices (Figs 3, 6).There was also a significant decrease ina1 immunostainingin parietal cortex layer IV (226%) in flurazepam-treatedsections (Fig. 6, Table 2). A similar non-significant trend
S. Chenet al.36
Table 1. Subunit antibody immunostaining in the hippocampus
Subregion a1 a2 b1 b2 b3 g2
CA1SO Control 12.8 0.8 17.6 1.2 27.1 2.0 5.0 0.3 31.9 2.1 53.0 1.3
FZP-treated 10.1 0.7 17.8 1.5 29.4 2.3 5.1 0.4 25.9 2.2 51.2 1.5P value 0.01* 0.94 0.42 0.88 0.04* 0.35
SP Control 10.9 0.7 16.9 0.9 25.6 2.7 5.1 0.3 28.1 1.2 40.2 1.4FZP-treated 9.5 0.5 18.3 1.8 25.6 3.3 4.8 0.4 23.2 3.2 39.7 1.6P value 0.09 0.50 0.99 0.62 0.12 0.81
SR Control 9.9 0.6 14.9 1.2 24.4 2.1 4.7 0.2 28.8 1.8 58.1 1.7FZP-treated 7.9 0.5 17.0 1.3 25.3 2.2 5.0 0.4 21.5 2.7 55.2 1.9P value 0.02* 0.24 0.75 0.45 0.03* 0.24
SL-M Control 20.1 2.9 24.8 1.9 35.3 1.6 7.0 0.3 35.8 2.2 48.9 1.9FZP-treated 13.0 0.7 27.3 2.4 35.7 2.0 6.8 0.4 30.8 2.2 46.4 1.1P value 0.01* 0.40 0.85 0.64 0.10 0.24
CA2SO Control 11.3 1.8 16.9 1.1 32.9 2.7 4.7 0.4 22.0 1.5 50.7 0.9
FZP-treated 8.0 0.5 17.7 1.3 30.7 3.3 4.4 0.3 18.1 1.9 49.7 1.7P value 0.06 0.63 0.74 0.54 0.11 0.58
SP Control 11.4 2.0 18.0 1.2 30.5 2.3 5.0 0.4 22.8 1.4 40.8 1.5FZP-treated 8.3 0.7 19.6 1.9 25.0 3.6 4.6 0.2 18.6 2.0 42.3 1.3P value 0.10 0.45 0.38 0.35 0.08 0.42
SR Control 8.1 2.0 16.2 1.3 31.1 2.5 4.4 0.4 22.7 1.8 56.0 1.1FZP-treated 6.3 0.5 18.6 1.3 28.1 3.0 4.4 0.4 16.9 1.8 54.9 1.6P value 0.30 0.19 0.64 1.00 0.03* 0.56
CA3SO Control 10.8 2.1 23.8 1.8 32.8 1.9 4.9 0.4 32.2 1.0 56.7 1.0
FZP-treated 6.7 0.4 24.8 1.8 33.6 2.0 5.1 0.3 29.7 0.8 54.4 1.3P value 0.03* 0.68 0.77 0.64 0.06 0.17
SP Control 5.3 0.8 18.0 1.5 21.1 2.0 3.9 0.3 19.9 0.9 43.4 1.3FZP-treated 3.8 0.4 21.0 2.6 22.5 2.3 3.8 0.3 19.4 2.4 41.4 1.3P value 0.06 0.32 0.62 0.84 0.82 0.26
SL Control 10.3 1.6 26.0 1.9 33.4 2.0 4.8 0.3 37.4 1.9 61.1 1.2FZP-treated 6.4 0.5 28.7 1.8 34.1 1.9 4.9 0.2 32.1 1.5 58.4 1.2P value 0.01* 0.29 0.80 0.97 0.03* 0.12
DentatePC (CA4) Control 5.2 0.7 24.4 2.4 23.6 2.1 3.9 0.4 30.8 1.5 42.9 1.0
FZP-treated 4.0 0.4 29.9 2.9 25.7 2.8 3.7 0.3 24.4 2.6 41.5 1.1P value 0.10 0.14 0.51 0.73 0.04* 0.33
GC Control 8.4 0.9 23.4 2.0 26.7 2.7 4.2 0.4 33.2 1.3 33.2 1.5FZP-treated 6.6 0.6 28.3 2.3 28.1 2.9 3.9 0.5 27.3 2.6 31.4 1.4P value 0.10 0.11 0.71 0.68 0.05* 0.36
OM Control 16.3 1.4 — — — 47.7 2.1 —FZP-treated 10.7 0.6 — — — 40.1 1.9 —P value ,0.01* 0.01*
IM (IM 1OM) Control 13.1 1.3 (35.1 2.6) (36.0 1.4) (5.0 0.3) 43.7 2.3 (55.7 2.0)FZP-treated 8.8 0.6 (38.9 2.6) (37.1 2.1) (5.0 0.3) 35.4 2.1 (51.3 1.1)P value ,0.01* 0.31 0.62 0.95 0.01* 0.05*
Mean( S.E.M.) relative grey level.*Significant difference between control and flurazepam (FZP)-treated groups,P#0.05.Control:a1, n�6; a2, b1, b3, g2, n�7; b2, n�8; flurazepam-treated: all antibodies,n�8.CA1–CA3: SO, stratum oriens; SP, stratum pyramidale; SR, stratum radiatum; SL-M, stratum lacunosum-moleculare; SL, stratum lucidum.Dentate: PC, polymorph (CA4) cells; GC, granule cells; OM, outer molecular layer; IM, inner molecular layer.
Regulation of hippocampal GABAA receptor subunit proteins 37
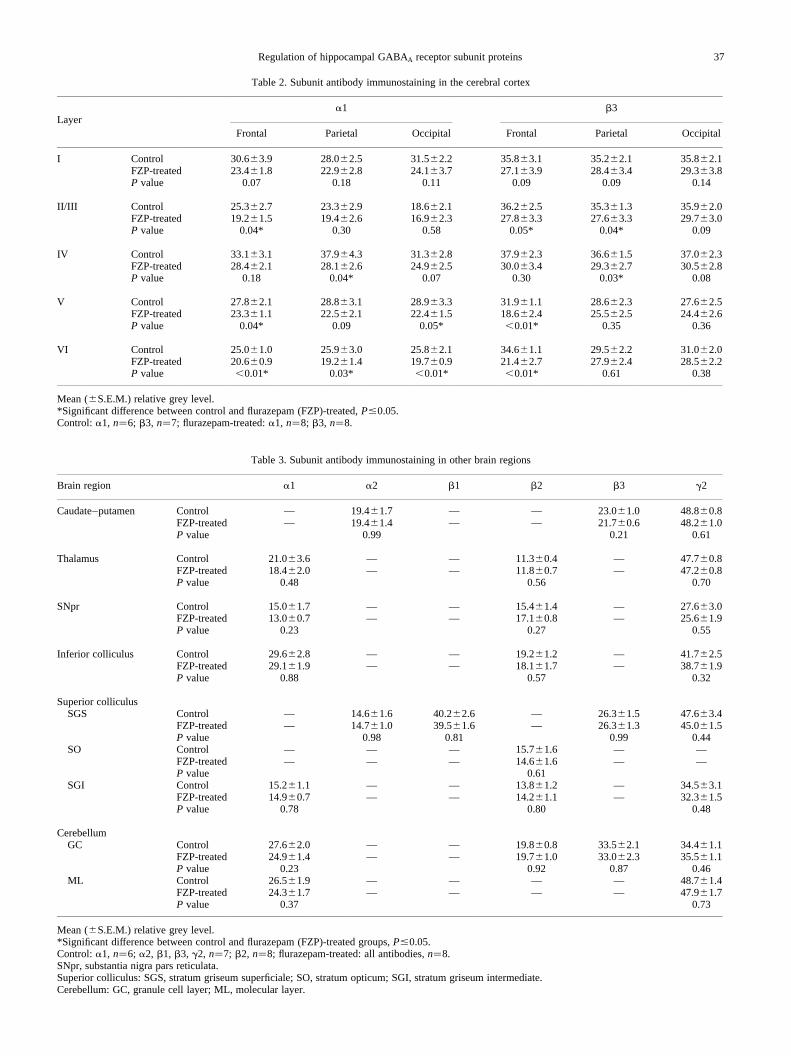
Table 2. Subunit antibody immunostaining in the cerebral cortex
a1 b3Layer
Frontal Parietal Occipital Frontal Parietal Occipital
I Control 30.6 3.9 28.0 2.5 31.5 2.2 35.8 3.1 35.2 2.1 35.8 2.1FZP-treated 23.4 1.8 22.9 2.8 24.1 3.7 27.1 3.9 28.4 3.4 29.3 3.8P value 0.07 0.18 0.11 0.09 0.09 0.14
II/III Control 25.3^2.7 23.3 2.9 18.6 2.1 36.2 2.5 35.3 1.3 35.9 2.0FZP-treated 19.2 1.5 19.4 2.6 16.9 2.3 27.8 3.3 27.6 3.3 29.7 3.0P value 0.04* 0.30 0.58 0.05* 0.04* 0.09
IV Control 33.1 3.1 37.9 4.3 31.3 2.8 37.9 2.3 36.6 1.5 37.0 2.3FZP-treated 28.4 2.1 28.1 2.6 24.9 2.5 30.0 3.4 29.3 2.7 30.5 2.8P value 0.18 0.04* 0.07 0.30 0.03* 0.08
V Control 27.8 2.1 28.8 3.1 28.9 3.3 31.9 1.1 28.6 2.3 27.6 2.5FZP-treated 23.3 1.1 22.5 2.1 22.4 1.5 18.6 2.4 25.5 2.5 24.4 2.6P value 0.04* 0.09 0.05* ,0.01* 0.35 0.36
VI Control 25.0 1.0 25.9 3.0 25.8 2.1 34.6 1.1 29.5 2.2 31.0 2.0FZP-treated 20.6 0.9 19.2 1.4 19.7 0.9 21.4 2.7 27.9 2.4 28.5 2.2P value ,0.01* 0.03* ,0.01* ,0.01* 0.61 0.38
Mean ( S.E.M.) relative grey level.*Significant difference between control and flurazepam (FZP)-treated,P#0.05.Control:a1, n�6; b3, n�7; flurazepam-treated:a1, n�8; b3, n�8.
Table 3. Subunit antibody immunostaining in other brain regions
Brain region a1 a2 b1 b2 b3 g2
Caudate–putamen Control — 19.4^1.7 — — 23.0 1.0 48.8 0.8FZP-treated — 19.4 1.4 — — 21.7 0.6 48.2 1.0P value 0.99 0.21 0.61
Thalamus Control 21.03.6 — — 11.3 0.4 — 47.7 0.8FZP-treated 18.4 2.0 — — 11.8 0.7 — 47.2 0.8P value 0.48 0.56 0.70
SNpr Control 15.0 1.7 — — 15.4 1.4 — 27.6 3.0FZP-treated 13.0 0.7 — — 17.1 0.8 — 25.6 1.9P value 0.23 0.27 0.55
Inferior colliculus Control 29.6 2.8 — — 19.2 1.2 — 41.7 2.5FZP-treated 29.1 1.9 — — 18.1 1.7 — 38.7 1.9P value 0.88 0.57 0.32
Superior colliculusSGS Control — 14.6 1.6 40.2 2.6 — 26.3 1.5 47.6 3.4
FZP-treated — 14.7 1.0 39.5 1.6 — 26.3 1.3 45.0 1.5P value 0.98 0.81 0.99 0.44
SO Control — — — 15.7 1.6 — —FZP-treated — — — 14.6 1.6 — —P value 0.61
SGI Control 15.2 1.1 — — 13.8 1.2 — 34.5 3.1FZP-treated 14.9 0.7 — — 14.2 1.1 — 32.3 1.5P value 0.78 0.80 0.48
CerebellumGC Control 27.6 2.0 — — 19.8 0.8 33.5 2.1 34.4 1.1
FZP-treated 24.9 1.4 — — 19.7 1.0 33.0 2.3 35.5 1.1P value 0.23 0.92 0.87 0.46
ML Control 26.5 1.9 — — — — 48.7 1.4FZP-treated 24.3 1.7 — — — — 47.9 1.7P value 0.37 0.73
Mean ( S.E.M.) relative grey level.*Significant difference between control and flurazepam (FZP)-treated groups,P#0.05.Control:a1, n�6; a2, b1, b3, g2, n�7; b2, n�8; flurazepam-treated: all antibodies,n�8.SNpr, substantia nigra pars reticulata.Superior colliculus: SGS, stratum griseum superficiale; SO, stratum opticum; SGI, stratum griseum intermediate.Cerebellum: GC, granule cell layer; ML, molecular layer.
was seen in the occipital cortex, whereas frontal cortex layersII/III showed a significant reduction (224%) in a1 subunitimmunostaining (Table 2). No significant differences ina1subunit immunostaining density were detected in the cerebel-lar molecular or granule cell layers. There were also nobetween-group differences ina1 subunit antibody immuno-staining density in the other brain regions measured, i.e. thethalamus or cerebellum (Table 3).
The cerebral cortex, caudate–putamen, superior colliculusand dentate regions were among those brain regions mostdensely labeled with thea2 subunit antibody (Fig. 1). Theimmunostaining density of thea2 subunit antibody was
measured in the hippocampus (Table 1, Fig. 4) andcaudate–putamen, the two strongly immunoreactive brainareas, as well as in the cerebral cortex and cerebellum.There were no significant differences in immunostainingbetween groups in any of the brain regions measured (Tables2, 3, Fig. 6).
Regulation ofb subunit antibody immunostaining
Theb1 subunit antibody stained the cerebral cortex, super-ior colliculus, midbrain and hippocampus most intensely (Fig.1). There were no differences inb1 immunostaining between
S. Chenet al.38
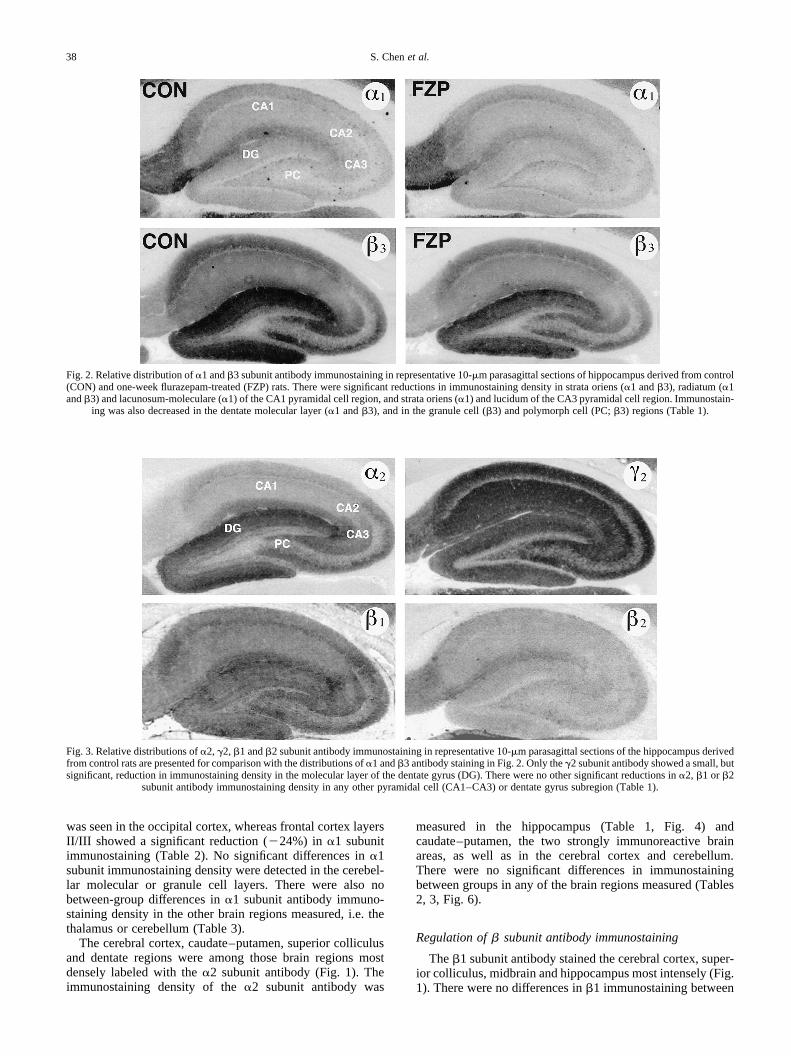
Fig. 3. Relative distributions ofa2,g2,b1 andb2 subunit antibody immunostaining in representative 10-mm parasagittal sections of the hippocampus derivedfrom control rats are presented for comparison with the distributions ofa1 andb3 antibody staining in Fig. 2. Only theg2 subunit antibody showed a small, butsignificant, reduction in immunostaining density in the molecular layer of the dentate gyrus (DG). There were no other significant reductions ina2,b1 orb2
subunit antibody immunostaining density in any other pyramidal cell (CA1–CA3) or dentate gyrus subregion (Table 1).
Fig. 2. Relative distribution ofa1 andb3 subunit antibody immunostaining in representative 10-mm parasagittal sections of hippocampus derived from control(CON) and one-week flurazepam-treated (FZP) rats. There were significant reductions in immunostaining density in strata oriens (a1 andb3), radiatum (a1andb3) and lacunosum-moleculare (a1) of the CA1 pyramidal cell region, and strata oriens (a1) and lucidum of the CA3 pyramidal cell region. Immunostain-
ing was also decreased in the dentate molecular layer (a1 andb3), and in the granule cell (b3) and polymorph cell (PC;b3) regions (Table 1).

groups in any hippocampal region (Table 1, Fig. 6), thecerebral cortex (Table 2, Fig. 7) or cerebellum (Table 3).
The whole-brain regional distribution pattern ofb2 subunitimmunostaining was similar to thea1 subunit antibody,although somewhat lower in intensity in the hippocampusand cortex (Fig. 1). As with theb1 subunit antibody, therewere no significant differences inb2 subunit antibody
immunostaining between groups in the hippocampus (Table1), cerebral cortex (Table 2), caudate–putamen, thalamus orcerebellum (Table 3).
The b3 subunit antibody prominently immunostainedmany brain regions, including the cerebral cortex, midbrain,caudate–putamen, superior colliculus, the cerebellar granulecell layer and the hippocampus (Fig. 1). In contrast to
Regulation of hippocampal GABAA receptor subunit proteins 39
Fig. 5. Crude homogenates of the dentate gyrus microdissected from the hippocampus of flurazepam-treated (n�6) and control (n�6) rats were subjected tosodium dodecyl sulfate–polyacrylamide gel electrophoresis and western blot analysis. (A) Immunoblot using a specific polyclonal antibody to the GABAA
receptorb3 subunit. The signals over dentate samples (10mg protein/lane) from control (C1–C6) and flurazepam-treated (T1–T6) rats were visualized on filmusing the enhanced chemiluminescence technique. A broad band, representing the N-glycosylatedb3 subunit, centered at about 56,000 mol. wt, was revealedafter 20 min exposure. (B) Immunoblot of a specific anti-actin antibody to the identical crude dentate homogenates (5.25mg protein/lane), as a control for totalprotein. The film was exposed for 5 s, revealing a band of mol. wt 42,000. Owing to the strong chemiluminescence, the fainter bands in B were the result oferrant re-exposure during removal of the film from the cassette and were not used for analysis. The OD/mm2 measurements derived from theb3 subunitimmunoblot were normalized to those from the actin immunoblot and expressed as a ratio. (C)b3 subunit protein level, as a fraction of actin protein per dentategyrus sample, was compared between control and flurazepam-treated rats. The signal was quantified by measuring the volume-adjusted optical density (OD/mm2) of each band from a densitometric image of film transmittance. The asterisk represents a significant (P�0.047) 18% reduction in the mean (^S.E.M.)b3
subunit protein level in the dentate gyrus after one-week flurazepam treatment.
Fig. 4. The percentage change in the distribution of GABAA receptor subunit antibody immunostaining in the hippocampus following one-week oralflurazepam administration. Relative grey level was measured over digitized images of immunostained hippocampal subregions [CA1 and CA2: SO, stratumoriens; SP, stratum pyramidale; SR; stratum radiatum; SL-M, stratum lacunosum-moleculare; CA3: SO, stratum oriens; SP, stratum pyramidale; SL, stratumlucidum; dentate gyrus: OM, outer molecular layer; IM, inner molecular layer; GC, granule cell layer; PC, polymorph cell layer (formerly CA4 pyramidal celllayer)] from control or one-week flurazepam-treated rats (Table 1). Bars: black,a1; white,a2; left cross-hatch,b1; horizontal line,b2; grey,b3; right cross-
hatch,g2. Asterisks denote significant differences between control and flurazepam-treated mean (^ S.E.M.) relative grey level values,P#0.05.

immunostaining with the otherb subunits, b3 subunitimmunoreactivity was significantly decreased in the CA1region of flurazepam-treated rat hippocampus. A significantdecrease in staining density was measured in strata oriens(219%) and radiatum (225%), but not strata pyramidale(217%) and lacunosum (214%) (Table 1, Fig. 4). In theCA3 region, a significant decrease in immunostaining densitywas also found in stratum lucidum (214%) (Table 1, Fig. 4).In the dentate gyrus,b3 antibody staining density was signi-ficantly decreased in flurazepam-treated brain sections in theinner (219%) and outer (216%) molecular layers, as well asthe granule cell (218%) and polymorph cell (221%) layers(Table 1, Fig. 4).
In comparison toa1 subunit immunostaining, theb3 sub-unit showed a similar pattern of significantly decreasedimmunostaining in the frontal cortex layers, although themagnitude of the decrease was two-fold greater in layers Vand VI (II/III, 223%; V,242%; VI, 238%; Table 2, Fig. 7).Similarly, the pattern of decrease inb3 immunostaining waslike that of thea1 antibody, i.e. significantly decreased inlayer IV of the parietal cortex (219%) with a similar trendin layer IV of the occipital cortex (Table 2, Fig. 7). However,unlike thea1 subunit antibody, theb3 subunit antibody stain-ing was not modified in layers V or VI of the parietal andoccipital cortices following chronic flurazepam treatment(Table 2, Fig. 7). There were also no changes inb3 subunitantibody staining in the caudate–putamen or cerebellar gran-ule cell layer (Table 3, Fig. 1).
Western blot analysis ofb3 subunit protein level in thedentate gyrus
A broad band centered at mol. wt 56,000, representing theN-glycosylated GABAA receptorb3 subunit,6,57 was detectedon immunoblots using both the secondary antibody conju-gated to alkaline phosphatase and that linked to HRP (Fig.5A). A minor band, at mol. wt,53,000, was visualized when
the alkaline phosphatase colorometric reaction was extended(data not shown). The anti-actin antibody recognized a singleband (mol. wt 42,000) using the enhanced chemilumines-cence method (Fig. 5B). A comparison of the densitometricreadings from the film overlying dentate homogenate samplesderived from flurazepam-treated (n�6) and control rats(n�6) is shown in Fig. 5C. There was a significant(P�0.047) 18% reduction inb3 subunit protein levels inthe dentate gyrus immediately after ending flurazepam treat-ment. The degree of reduction inb3 subunit protein levels indentate homogenates was similar to that detected usingimmunohistochemical methods in brain sections (Fig. 4;216% to221%).
Regulation ofg2 subunit antibody immunostaining
g2 subunit antibody staining was widely distributed amongbrain regions in parasagittal sections (Fig. 1), with equivalentimmunostaining densities in the CA1–CA3 and dentateregions (Fig. 3).g2 subunit antibody staining was not signifi-cantly changed between groups in any pyramidal cell regionin the hippocampus (Table 1, Fig. 4). In the dentate gyrusmolecular layer, theg2 staining density in flurazepam-treatedbrain sections showed a small (28%), but significant,decrease in density across the molecular layer in comparisonto control sections (Table 1, Fig. 4). No significant differencesbetween groups were detected in the dentate granule cell layer(Table 1). The density ofg2 subunit immunoreactivity wasalso not significantly decreased between groups in any layerof the cerebral cortex (Table 2, Fig. 7), caudate–putamen,thalamus or cerebellum (Table 3).
DISCUSSION
Using specific GABAA receptor polyclonal antibodies,these experiments were designed to investigate the regulationof selected subunit proteins by benzodiazepine allosteric
S. Chenet al.40
Fig. 6. Relative distributions ofa1 andb3 subunit antibody immunostaining in representative 10-mm parasagittal sections of the parieto-occipital cortexderived from control (CON) and one-week flurazepam-treated (FZP) rats. Relative grey level was measured over digitized images of each cortical layer: I, II/III, IV, V and VI. There were significant reductions in botha1 andb3 subunit immunostaining density in several layers of the frontal, parietal and occipital
cortices (Table 2).

modulators. The gross brain regional distributions of subunitantibody staining in this report were consistent with thepatterns of associated subunit antibodies identified byimmunoprecipitation and immunofluorescence studies.14,35,39
In the parasagittal plane sampled (Fig. 1),a1, b2 and g2subunit proteins were enriched in the thalamus, pallidum,inferior colliculus and in certain cortical areas. Thea2, b3and g2 subunits appeared more prevalent in the dentategyrus, caudate–putamen, superior colliculus and outerlayers of cortex. These findings conform to previousreports of enriched mRNA expression in these same brainregions.71 The somatic versus dendritic co-localization ofcertain subunit proteins in the hippocampus and cortex isprobably related to the localized assembly of a variety ofGABAA receptor subtypes and the functional heterogeneityof the GABA and allosteric modulator responses in
hippocampal1,30,36,45,58,67and cortical neurons.25,56The discretelocalization ofa1, a2, b1–3 andg2 subunit proteins rein-forced the likelihood that different GABAA receptor subtypesexist on different subcellular domains of hippocampal andcortical principle cell types. For example, thea2 subunitprotein, previously localized to axo-axonic synapses on theaxon initial segment of the hippocampal pyramidal cell,43
may be more likely to be associated with theb1 or b3 sub-unit.4,39 The a1 subunit, found on a subset of synapses onpyramidal cell somata and on proximal and distaldendrites,4,43 has frequently been associated with theb2 andg2 subunits,5,14 and was prominently localized to hippocam-pal interneurons.17,34,38,39The regulation ofa1 andb3 subunitproteins in pyramidal cell dendritic regions suggests that ana1b3g2-containing GABAA receptor subtype may be regu-lated following long-term flurazepam treatmentin vivo.
The discrete suppression of GABAA receptor function inCA1 pyramidal cells during prolonged flurazepam adminis-tration47,73,75–78and the associated regionally localized, time-dependent reductions in the expression of specific GABAA
receptor subunit mRNAs65,66warranted quantitative immuno-histochemical studies of selected hippocampal and corticalGABAA receptor subunit proteins (a1, a2, b1–3 andg2).Taken together with the findings ofin situ hybridizationstudies,65,66 the results of these quantitative immunohisto-chemical studies suggested that changes in the expression ofspecific GABAA receptor mRNAs (a1 andb3 subunits) weremirrored by changes in their respective subunit proteins. Thereliability and validity of using image analysis to make quan-titative measurements of changes in chromogen stainingdensity in brain sections were established previously.24
None the less, whether such changes in GABAA receptor sub-unit antibody immunostaining density reflect changes in sub-unit protein levels could not be assessed directly in tissuesections. Accordingly, it was necessary to further validatethis methodology using an independent method, quantitativewestern blot analysis, to detect changes in subunit proteinlevels. The dentate gyrus was selected for analysis for tworeasons. First, among all hippocampal subregions, the dentategyrus can be most reliably microdissected. More importantly,the dentate showed the most consistent, significant reductionsin b3 subunit antibody staining across the molecular layers(inner: 19%; outer: 16%) and the granule cell (18%) andpolymorph cell regions (221%) (Fig. 4), and thus wasexpected to be least sensitive to small localized variationsin b3 subunit protein levels. The finding thatb3 subunitprotein levels were significantly reduced in crude homo-genates of the dentate region of the hippocampus usingimmunoblot analyses (Fig. 7) further established the validityof computer-assisted image analysis of immunohistochemicalstaining to measure relative subunit protein levels. The simi-larity in degree of reduction (,18%) in subunit protein usingboth methods (Figs 4, 5) suggested that immunostainingdensity may provide an accurate estimate of subunit proteinlevels in various brain regions. Although there are limitationsas to the cellular resolution which can be achieved, the simpleimage analysis techniques described provided a rapid, reliablescreen of regional changes in protein levels,24 without thespecialized equipment required for more quantitativeapproaches at the subcellular level.42,60
This is the first report of the differential, localizedregulation of GABAA receptor proteins (a1, a2, b1–3 andg2) in the hippocampus after chronic benzodiazepine
Regulation of hippocampal GABAA receptor subunit proteins 41
Fig. 7. The percentage change in the distribution of GABAA receptor sub-unit antibody immunostaining in parietal cortex layers following one-weekflurazepam administration. Relative grey level was measured over digitizedimages of cortical layers I, II/III, IV, V and VI from control or one-weekflurazepam-treated rats (Table 2). Bars: black,a1; white, a2; left cross-hatch,b1; horizontal line,b2; grey,b3; right cross-hatch,g2. Asterisksdenote significant differences between control and flurazepam-treated mean
(^S.E.M.) relative grey level values,P#0.05.

treatment paralleling changes in their respective mRNAs.64,67
The relationship between changes in receptor protein andalterations in GABAA receptor properties must be resolved.Both [3H]flunitrazepam9,69 and [3H]zolpidem (unpublishedobservations) binding was reduced in the CA1 region of thehippocampus immediately after flurazepam treatment wasstopped. GABA/benzodiazepine receptors were also func-tionally uncoupled.9 Changes in the number or affinity ofbinding sites for GABA and benzodiazepine agonists havebeen demonstrated inconsistently after various benzodiaze-pine treatments.2,5,9,26,50,68Alternatively, a reduced allostericinteraction, i.e. decreased functional coupling, betweenGABA and benzodiazepine binding sites on native9,17,23,51,64
and recombinant32,50,72GABAA receptors is a uniform finding.Studies of GABA/benzodiazepine receptor coupling in agedrats suggested that a decreased allosteric modulation with agewas related to the decreased amount ofa1 subunit protein.55
Conversely, although GABA agonist exposure resulted inGABAA receptor internalization,8 neither receptor down-regulation or internalization,50 nor changes ina1 subunitmRNA or protein expression,32 could account for benzodiaze-pine agonist-mediated uncoupling in recombinant expressionsystems. Structural or other post-translational modificationsof the receptor, i.e. phosphorylation of specific GABAA sub-units,34 were proposed mechanisms responsible for bothbenzodiazepine receptor down-regulation5 and GABA/benzo-diazepine receptor uncoupling,50 although reports conflict.31
The role of a switch in GABAA receptor subunits in mediat-ing functional changes in GABA receptor function remainsspeculative and will require an analysis of the time-course ofchanges ina1 andb3 (andb2) subunit proteins in the hippo-campus. Such a switch could result in a change in the pharma-cological response to GABA or to benzodiazepine receptorligands. A decreased potency of thea1 subunit-selectiveimidazopyridine, zolpidem, to potentiate GABA currents indissociated CA1 pyramidal cells of chronic diazepam-treatedrats,28 and the reduced ability of zolpidem to potentiate thedecay of CA1 pyramidal cell miniature inhibitory postsynap-tic currents,77 suggest that the function ofa1-containingGABAA receptor subtypes may be selectively impaired afterprolonged flurazepam treatment. The finding thata1 subunitstaining was reduced in CA1 dendritic regions is consistentwith this possibility. Whether a reduction in theb3 subunitprotein, as reflected in the reduction ofb3 antibody staining,may play a permissive or a more integral role in the reductionof GABAA receptor function remains to be determined. Thebsubunit of the GABAA receptor plays a critical role in sub-cellular targeting of assembled receptors and may haveimportant functions to regulate receptor localization orclustering.10,46 Hadinghamet al.20 reported little influence of
b subunit substitution on GABA-mediated currents in twoheterologous expression systems, whereas transient transfec-tion of b3 versusb1 or b2 subunits into HEK-293 cellsincreased GABA affinity 2.5-fold ina1bxg2 recombinantreceptors.12 Thus, the increase inb2 subunit mRNA expres-sion in CA1 pyramidal cells two days after ending flurazepamadministration, concomitant with the decreasedb3 subunitmRNA24 andb3 subunit protein expression in CA1 dendriticregions, could account for the 2.5-fold decreased GABAA
agonist potency in the CA1 region of the hippocampus offlurazepam-tolerant rats,74 although a similarb subunit switchmight be expected to increase, rather than decrease, zolpidemaffinity.4
CONCLUSIONS
Although the time-courses of localized reductions ina1and b3 subunit proteins were consistent with changes intheir respective subunit mRNAs, the dynamic relationshipamong the regulation of receptor subunit mRNAs, subunitprotein and the final insertion of functional receptors at thesynapse is a current topic of inquiry. Studies of the effects ofGABA exposure on chick cortical neuron GABAA receptora1 subunit mRNA anda1 polypeptide revealed a delayed,use-dependent decline ina1 subunit translation,38 consistentwith the decreaseda1 subunit mRNA.3 Whether a similardelay in the repression of GABAA receptor subunit biosynth-esis may occur following benzodiazepine exposure requiresfurther investigation.63 Such a mechanism could explain theone-week delay in the reduction ofa1 andg2 mRNA in thecortex of mice administered lorazepam for two weeks,29 incontrast to the reduction in benzodiazepine receptor numberand GABA-mediated chloride uptake following only oneweek of benzodiazepine treatment.37 It will be important todetermine the temporal pattern of changes in subunit proteinexpression following chronic benzodiazepine administrationin comparison to the time-course of the change in the expres-sion of GABAA receptor subunit mRNAs.17,22,27,29,44,65,66,80,81
Such information may help to clarify the relationship betweenchanges in protein expression (e.g., ofa1, b2 andb3 sub-units) and changes in the GABAergic function of some (CA1pyramidal cells), but not other (CA3 pyramidal cells anddentate granule cells), hippocampal principal cell types inbenzodiazepine-tolerant rats.28,47,48,75,76,78
Acknowledgements—We would like to thank Eugene Orlowski, ScottLilly and Bradley Van Sickle for technical assistance, and Dr LindaDokas for expert assistance with immunoblot analyses and helpfulcomments regarding the final manuscript. This work was supportedby National Institutes of Health grants R01DA04075 andK02DA00180 to E.I.T.
REFERENCES
1. Alger B. E. and Nicoll R. A. (1982) Pharmacological evidence for two kinds of GABA receptors on rat hippocampal pyramidal cells studiedin vitro.J. Physiol.328,125–141.
2. Barnes E. M. Jr (1996) Use-dependent regulation of GABAA receptors.Int. Rev. Neurobiol.39, 53–77.3. Baumgartner B. J., Harvey R. J., Darlison M. G. and Barnes E. M. Jr (1994) Developmental up-regulation and agonist-dependent down-regulation of
GABAA receptor subunit mRNAs in chick cortical neurons.Brain Res.—Molec. Brain Res.26, 9–17.4. Benke D., Fritschy J.-M., Trzeciak A., Bannwarth W. and Mo¨hler H. (1994) Distribution, prevalence and drug binding profile ofg-aminobutyric acid type
A receptor subunits differing in theb-subunit variant.J. biol. Chem.269,27,100–27,107.5. Brown M. J. and Bristow D. R. (1996) Molecular mechanisms of benzodiazepine-induced downregulation of GABAA receptora1 subunit protein in rat
cerebellar granule cells.Br. J. Pharmac.118,1103–1110.6. Buchstaller A., Fuchs K. and Sieghart W. (1991) Identification ofa1, a2 anda3 subunit isoforms of the GABAA–benzodiazepine receptor in the rat
brain.Neurosci. Lett.129,237–241.
S. Chenet al.42

7. Burt D. R. and Kamatchi G. L. (1991) GABAA receptor subunits: from pharmacology to molecular biology.Fedn Proc. Fedn Am. Socs exp. Biol.5,2916–2923.
8. Calkin P. A. and Barnes E. M. Jr (1994) Gamma-aminobutyric acid-A (GABAA) agonists down-regulate GABAA/benzodiazepine receptor polypeptidesfrom the surface of chick cortical neurons.J. biol. Chem.269,1548–1553.
9. Chen S., Cox A. and Tietz E. I. (1995) Temporal regulation of GABAA receptor (GABAR) binding and coupling in flurazepam (FZP) tolerant rats.Soc.Neurosci. Abstr.21, 1590.
10. Connolly C. N., Wooltorton J. R. A., Smart T. and Moss S. J. (1996) Subcellular localization ofg-aminobutyric type A receptors is determined bybsubunits.Proc. natn. Acad. Sci. U.S.A.93, 9899–9904.
11. Davies P. A., Hanna M. C., Hales T. G. and Kirkness E. (1997) Insensitivity to anesthetic agents conferred by a class of GABAA receptor subunit.Nature385,820–823.
12. Ducic I., Caruncho H. J., Zhu W. J., Vicini S. and Costa E. (1995)g-Aminobutyric acid gating of Cl2 channels in recombinant GABAA receptors.J. Pharmac. exp. Ther.272,438–445.
13. Eghball M., Curmi J. P., Birnir B. and Gage P. W. (1997) Hippocampal GABAA channel conductance increased by diazepam.Nature388,71–75.14. Fritschy J.-M., Benke D., Mertens S., Oertel W. H., Bachi T. and Mo¨hler H. (1992) Five subunits of type A GABA receptors identified in neurons by
double and triple immunofluorescence staining with subunit-specific antibodies.Proc. natn. Acad. Sci. U.S.A.89, 6726–6730.15. Fritschy J.-M. and Mo¨hler H. (1995) GABAA-receptor heterogeneity in the adult rat brain: differential regional and cellular distribution in seven major
subunits.J. comp. Neurol.359,154–194.16. Fuchs K., Adamiker D. and Sieghart W. (1990) Identification ofa2 anda3 subunits of the GABAA–benzodiazepine receptor complex purified from the
brains of young rats.Fedn Eur. biochem. Socs Lett.261,52–54.17. Gallager D. W., Marley R. J. and Hernandez T. D. (1991) Biochemical and electrophysiological mechanisms underlying benzodiazepine tolerance and
dependence. InThe Biological Bases of Drug Tolerance and Dependence(ed. Pratt J.), pp. 49–70. Academic, New York.18. Gao B. and Fritschy J.-M. (1994) Selective allocation of GABAA receptors containing thea1 subunit to neurochemically distinct subpopulations of rat
hippocampal interneurons.Eur. J. Neurosci.6, 837–853.19. Gutierrez A., Khan A. U. and De Blas A. L. (1994) Immunocytochemical localization ofg2 short andg2 long subunits of the GABAA receptor in the rat
brain.J. Neurosci.14, 7168–7179.20. Hadingham K. L., Wingrove P. B., Wafford K. A., Bain C., Kemp J. A., Palmer K. J., Wilson A. W., Wilcox A. S., Sikela J. M., Ragan C. I. and Whiting
P. J. (1993) Role of theb subunit in determining the pharmacology of humang-aminobutyric acid type A receptors.Molec. Pharmac.44,1211–1218.21. Heninger C., Saito N., Tallman J. F., Garrett K. M., Vitek M. P., Duman R. S. and Gallager D. W. (1990) Effects of continuous diazepam administration
on GABAA subunit mRNA in rat brain.J. molec. Neurosci.2, 101–107.22. Holt R. A., Bateson A. N. and Martin I. L. (1996) Chronic treatment with diazepam or abecarnil differently affects the expression of GABAA receptor
subunit mRNAs in the rat cortex.Neuropharmacology35, 14157–14163.23. Hu X.-J. and Ticku M. K. (1994) Chronic flurazepam treatment produces decreased efficacy of the benzodiazepine ligands and pentobarbital withg-
aminobutyric acidA receptors in cortical neurons.J. Pharmac. exp. Ther.270,485–490.24. Huang X., Chen S. and Tietz E. I. (1996) Immunocytochemical detection of regional protein changes in rat brain sections using computer-assisted image
analysis.J. Histochem. Cytochem.44, 981–987.25. Huntsman M., Jackson P. J. and Jones E. G. (1994) Lamina-specific expression and activity-dependent regulation of seven GABAA receptor subunit
mRNAs in monkey visual cortex.J. Neurosci.14, 236–2259.26. Hutchinson M. A., Smith P. F. and Darlinton C. L. (1996) The behavioral and neuronal effects of chronic administration of benzodiazepine anxiolytic and
hypnotic drugs.Prog. Neurobiol.49, 73–97.27. Impagnatiello F., Persold C., Longone P., Caruncho H., Fritschy J.-M., Costa E. and Guidotti A. (1996) Modifications ofg-aminobutyric acidA receptor
subunit expression in rat neocortex during tolerance to diazepam.Molec. Pharmac.49, 822–831.28. Itier V., Granger P., Perrault G., Depoortere H., Scatton B. and Avenet P. (1996) Protracted treatment with diazepam reduces benzodiazepine receptor-
mediated potentiation ofg-aminobutyric acid-induced currents in dissociated rat hippocampal neurons.J. Pharmac. exp. Ther.279,1092–1099.29. Kang L. and Miller L. G. (1991) Decreased GABAA receptor subunit mRNA concentrations following chronic lorazepam administration.Br. J. Pharmac.
103,1283–1287.30. Kapur J. and Macdonald R. L. (1996) Pharmacological properties of GABAA receptors from acutely dissociated rat dentate granule cells.Molec.
Pharmac.50, 458–466.31. Klein R. L., Mascia M. P., Harkness P. C., Hadingham K. L., Whiting P. J. and Harris R. A. (1995) Regulation of allosteric coupling and function of stably
expressedg-aminobutyric acid (GABA)A receptors by chronic treatment with GABAA and benzodiazepine agonists.J. Pharmac. exp. Ther.274,1484–1492.32. Klein R. L., Whiting P. J. and Harris R. A. (1994) Benzodiazepine treatment causes uncoupling of recombinant GABAA receptors expressed in stably
transfected cells.J. Neurochem.63, 2349–2351.33. Lowry O. H., Rosebrough N. J., Farr A. L. and Randall R. J. (1951) Protein measurement with the Folin phenol reagent.J. biol. Chem.193,265–275.34. Macdonald R. L. and Olsen R. W. (1994) GABAA receptor channels.A. Rev. Neurosci.17, 569–602.35. McKernan R. M. and Whiting P. J. (1996) Which GABAA-receptor subunits really occur in the brain?Trends Neurosci.19, 139–143.36. Miles R., Toth K., Gulyas A. I., Hajos N. and Freund T. F. (1996) Differences between somatic and dendritic inhibition in the hippocampus.Neuron16,
515–523.37. Miller L. G., Greenblatt D. J., Barnhill J. G. and Shader R. I. (1988) Chronic benzodiazepine administration. I. Tolerance is associated with benzodia-
zepine receptor downregulation and decreasedg-aminobutyric acid A receptor function.J. Pharmac. exp. Ther.246,170–177.38. Miranda J. D. and Barnes E. M. Jr (1997) Repression ofg-aminobutyric acid Type A receptora1 polypeptide biosynthesis requires chronic agonist
exposure.J. biol. Chem.272,16,288–16,294.39. Mohler H., Knoflach F., Paysan J., Motejlek K., Benke D., Lu¨scher B. and Fritschy J.-M. (1995) Heterogeneity of GABAA-receptors: cell specific
expression, pharmacology, and regulation.Neurochem. Res.20, 631–636.40. Moreno J. I., Piva M. A., Miralles C. P. and De Blas A. L. (1994) Immunocytochemical localization of theb2 subunit of the gamma-aminobutyric acidA
in the rat brain.J. comp. Neurol.350,260–271.41. Mossier B., To¨gel M., Fuchs K. and Sieghart W. (1994) Immunoaffinity purification ofg-aminobutyric acidA (GABAA) receptors containingg1-subunits.
J. biol. Chem.269,25,777–25,782.42. Nusser Z., David J., Roberts B., Baude A., Richards G., Sieghart W. and Somogyi P. (1995) Immunocytochemical localization of thea1 andb2/3
subunits of the GABAA receptor in relation to specific GABAergic synapses in the dentate gyrus.Eur. J. Neurosci.7, 630–646.43. Nusser Z., Sieghart W., Benke D., Fritschy J.-M. and Somogyi P. (1996) Differential synaptic localization of two major gamma-aminobutyric acid type A
receptor alpha subunits on hippocampal pyramidal cells.Proc. natn. Acad. Sci. U.S.A.93, 11,939–11,944.44. O’Donovan M. C., Buckland P. R., Spurlock G. and McGuffin P. (1992) Bi-directional changes in the levels of messenger RNAs encodingg-
aminobutyric acid A receptora subunits after flurazepam treatment.Eur. J. Pharmac.226,335–341.45. Pearce R. A. (1993) Physiological evidence for two distinct GABAA responses in rat hippocampus.Neuron10, 189–200.46. Perez-Velazquez J. L. and Angelides K. J. (1993) Assembly of GABAA receptor subunits determines sorting and localization in polarized cells.Nature
361,457–460.47. Poisbeau P., Williams S. J. and Mody I. (1997) Silent GABAA synapses during flurazepam withdrawal are region specific in the hippocampal formation.
J. Neurosci.17, 3467–3475.
Regulation of hippocampal GABAA receptor subunit proteins 43

48. Poncer J. C., Durr R., Ga¨hwiler B. H. and Thompson S. M. (1996) Modulation of synaptic GABAA receptor function by benzodiazepines in area CA3 ofrat hippocampal slice cultures.Neuropharmacology35, 1169–1179.
49. Primus R. J. and Gallager D. W. (1992) GABAA receptor subunit mRNA levels are differentially influenced by chronic FG 7142 and diazepam exposure.Eur. J. Pharmac.226,21–28.
50. Primus R. J., Yu J., Xu J., Hartnett C., Meyyappan M., Kostas C., Ramabhadran T. V. and Gallager D. W. (1996) Allosteric uncoupling after chronicbenzodiazepine exposure of recombinantg-aminobutyric acidA receptors expressed in Sf9 cells: ligand efficacy and subunit selectivity.J. Pharmac. exp.Ther.277,882–890.
51. Roca D. J., Schiller G. D., Friedman L., Rosenberg I., Gibbs T. and Farb D. (1990)g-Aminobutyric acidA receptor regulation in culture: altered allostericinteractions following prolonged exposure to benzodiazepines, barbiturates and methylxanthines.Molec. Pharmac.37, 710–719.
52. Rogers C. J., Twyman R. E. and Macdonald R. L. (1994) Benzodiazepine and beta-carboline regulation of single GABAA receptor channels of mousespinal neurones in culture.J. Physiol.475,69–82.
53. Rosenberg H. C. (1995) Differential expression of benzodiazepine anticonvulsant cross-tolerance according to time following flurazepam or diazepamtreatment.Pharmac. Biochem. Behav.51, 363–368.
54. Rosenberg H. C., Tietz E. I. and Chiu T. H. (1985) Tolerance to the anticonvulsant action of benzodiazepines: relationship to decreased receptor density.Neuropharmacology24, 639–644.
55. Ruano D., Vizuete M., Cano J., Machado A. and Vitorica J. (1992) Heterogeneity in allosteric interaction between theg-aminobutyric acid (GABA)binding site and three different benzodiazepine binding sites of the GABAA/benzodiazepine receptor complex in the rat nervous system.J. Neurochem.58, 485–493.
56. Ruano D., Perrais D., Rossier J. and Ropert N. (1997) Expression of GABAA receptor subunit mRNAs by layer V pyramidal cells of the rat primary visualcortex.Eur. J. Neurosci.9, 857–862.
57. Schofield P. R., Darlison M. G., Fujita N., Burt D. R., Stephenson F. A., Rodriguez H., Rhee L. M., Ramachandran J., Reale V., Glencorse T. A., SeeburgP. H. and Barnard E. A. (1987) Sequence and functional expression of the GABAA receptor shows a ligand-gated receptor superfamily.Nature328,221–227.
58. Scho¨nrock B. and Bormann J. (1993) Functional heterogeneity of hippocampal GABAA receptors.Eur. J. Neurosci.5, 1042–1049.59. Sieghart W. (1995) Structure and pharmacology ofg-aminobutyric acidA receptor subunits.Pharmac. Rev.47, 181–234.60. Somogyi P., Fritschy J.-M., Benke D., Roberts J. D. B. and Sieghart W. (1996) Theg2 subunit of the GABA receptor is concentrated in synaptic junctions
containing thea1 andb2/3 subunits in hippocampus, cerebellum and globus pallidus.Neuropharmacology35, 1425–1444.61. Sperk G., Schwarzer C., Tsunashima K., Fuchs K. and Sieghart W. (1997) GABAA receptor subunits in the rat hippocampus—I. Immunocytochemical
distribution of 13 subunits.Neuroscience80, 987–1000.62. Study R. E. and Barker J. L. (1981) Diazepam and (2)-pentobarbital: fluctuation analysis reveals different mechanisms for potentiation of GABA
responses in cultured central neurons.Proc. natn. Acad. Sci. U.S.A.78, 7180–7184.63. Tehrani M. H. J. and Barnes E. M. Jr (1997) Sequestration ofg-aminobutyric acidA receptors on clathrin-coated vesicles during chronic benzodiazepine
administrationin vivo. J. Pharmac. exp. Ther.283,384–390.64. Tietz E. I., Chiu T. H. and Rosenberg H. C. (1989) Regional GABA/benzodiazepine receptor chloride channel coupling after acute and chronic
benzodiazepine treatment.Eur. J. Pharmac.167,57–65.65. Tietz E. I., Huang X., Chen S. and Ferencak W. J. III (1999) Temporal and regional regulation ofa1,b2 andb3, but nota2,a4,a5,a6,b1 org2 GABAA
receptor subunit messenger RNAs following one week oral flurazepam administration.Neuroscience91, 327–341.66. Tietz E. I., Huang X., Weng X., Rosenberg H. and Chiu T. H. (1994) Expression ofa1,a5, andg2 GABAA receptor subunit mRNAs measuredin situ in
rat hippocampus and cortex following chronic flurazepam administration.J. molec. Neurosci.4, 277–292.67. Tietz E. I., Kapur J., and Macdonald R. L. (1999) Functional GABAA receptor heterogeneity of acutely dissociated hippocampal CA1 pyramidal cells.J.
Neurophysiol.81, 1575–1586.68. Tietz E. I. and Rosenberg H. C. (1988) Behavioral measurement of benzodiazepine tolerance and GABAergic subsensitivity in the substantia nigra pars
reticulata.Brain Res.438,41–51.69. Tietz E. I., Rosenberg H. C. and Chiu T. H. (1986) Autoradiographic localization of benzodiazepine receptor downregulation.J. Pharmac. exp. Ther.236,
284–292.70. Togel M., Mossier B., Fuchs K. and Sieghart W. (1994)g-Aminobutyric acidA receptors displaying association ofg3-subunits withb2/3 and differenta-
subunits exhibit unique pharmacological properties.J. biol. Chem.269,12,993–12,998.71. Wisden W., Laurie D. J., Monyer H. and Seeburg P. H. (1992) The distribution of 13 GABAA receptor subunit mRNAs in the rat brain. I. Telencephalon,
diencephalon, and mesencephalon.J. Neurosci.12, 1040–1062.72. Wong G., Lyon T. and Skolnick P. (1994) Chronic exposure to benzodiazepine receptor ligands uncouples theg-aminobutyric acid type A receptor in
WSS-1 cells.Molec. Pharmac.46, 1056–1062.73. Xie X.-H. and Tietz E. I. (1991) Chronic benzodiazepine treatment of rats induces reduction of paired-pulse inhibition in CA1 region ofin vitro
hippocampal slices.Brain Res.561,69–77.74. Xie X.-H. and Tietz E. I. (1992) Reduction in potency of selective GABAA agonists and diazepam in CA1 region ofin vitro hippocampal slices from
chronic flurazepam treated rats.J. Pharmac. exp. Ther.262,204–210.75. Zeng X. and Tietz E. I. (1994) Impairment of feedforward inhibition in CA1 region of hippocampus after chronic benzodiazepine treatment.Neurosci.
Lett. 173,40–44.76. Zeng X. and Tietz E. I. (1997) Depression of both early and late monosynaptic inhibitory postsynaptic potentials in hippocampal CA1 neurons following
chronic benzodiazepine administration.Synapse25, 125–136.77. Zeng X. J. and Tietz E. I. (1999) Benzodiazepine tolerance at GABAergic synapses on hippocampal CA1 pyramidal cells.Synapse31, 263–277.78. Zeng X., Xie X.-H. and Tietz E. I. (1995) Reduction of GABA-mediated IPSPs in hippocampal CA1 pyramidal neurons following oral flurazepam
administration.Neuroscience66, 87–99.79. Zezula J., Fuchs K. and Sieghart W. (1991) Separation ofa1,a2 anda3 subunits of the GABAA–benzodiazepine receptor complex by immunoaffinity
chromatography.Brain Res.563,325–328.80. Zhao T., Chiu T. H. and Rosenberg H. C. (1994) Reduced expression ofg-aminobutyric acid Type A/benzodiazepine receptorg2 anda5 subunit mRNAs
in brain regions of flurazepam-treated rats.Molec. Pharmac.45, 657–663.81. Zhao T., Chiu T. H. and Rosenberg H. C. (1994) Decreased expression ofg-aminobutyric acid Type A/benzodiazepine receptorb subunit mRNAs in
flurazepam-tolerant rats.J. molec. Neurosci.5, 181–192.82. Zimprich F., Zezula J., Sieghart W. and Lassmann H. (1991) Immunohistochemical localization of thea1,a2 anda3 subunit of the GABAA receptor in
the rat brain.Neurosci. Lett.127,125–128.
(Accepted24 February1999)
S. Chenet al.44