Benton, MWL - A theoretical study of the economic and environmental impacts of incorporating housing...
114
A theoretical study of the economic and environmental impacts of incorporating housing structures into a Canterbury dairy farm (LUDF) A dissertation submitted in partial fulfilment of the requirements for the Degree of Bachelor of Agricultural Science with Honours at Lincoln University by Matthew William Leaux Benton Lincoln University 2014
-
Upload
matt-benton -
Category
Documents
-
view
40 -
download
4
Transcript of Benton, MWL - A theoretical study of the economic and environmental impacts of incorporating housing...

A theoretical study of the economic and environmental impacts of
incorporating housing structures into a Canterbury dairy farm
(LUDF)
A dissertation
submitted in partial fulfilment
of the requirements for the Degree of
Bachelor of Agricultural Science with Honours
at
Lincoln University
by
Matthew William Leaux Benton
Lincoln University
2014

i
Abstract of a dissertation submitted in partial fulfilment of the
requirements for the Degree of Bachelor of Agricultural Science with Honours.
A theoretical study of the economic and environmental impacts of
incorporating housing structures into a Canterbury dairy farm (LUDF)
by
Matthew William Leaux Benton
In parts of New Zealand, economic drivers are causing intensification of dairying in order to maintain
a competitive advantage for low-cost milk production. These practices have contributed to increased
nitrate leaching, which has resulted in a regulatory push to reduce these adverse environmental
effects. A method of reducing this degradation of water quality is to remove cows from pasture
during ‘at-risk’ periods, and move them into a housing structure, to capture their effluent for
reapplication at a later date.
This study examined both the environmental and economic impacts of incorporating a housing
structure within the Lincoln University Dairy Farm (LUDF), by modelling proposed housing-
incorporated systems and restricted grazing practices with both Overseer® 6 and ExcelTM. An
investment analysis indicated the pre-tax and pre-financing real (constant value dollars) IRR (over a
12 year period) of the current system is 7.63%, the fully enclosed freestall system was 7.24% and the
roofless version of this system was 7.82%. This resulted in an increase in marginal returns of 4.66%
(housed) and 9.41% (roofless). This suggests that the proposed systems could maintain or increase
relative profitability, while reducing the nitrate leaching levels by 38%. Contributing factors to
increased profitability and relative increased milk production in the proposed systems are increased
pasture production, extended lactation and increased supplementary feeding, as well as reductions
in fertiliser application. Supplementary feed utilisation is also improved. A sensitivity analysis
predicted that the proposed systems still remained viable with changing milk price, supplementary
feed costs, total farm working expenses and machinery costs, although decreasing milk production
significantly reduced profitability.
A potential disadvantage of this practice is the capital cost of erecting such a structure. The fully
enclosed structure cost $2,390,500, and the roofless structure cost $1,529,500. This resulted in a
capital cost per kg of N leaching mitigated of $995 and $637 respectively, although this capital was
compensated by increased income. Significant risks to the proposed systems include external price
variance and a lack of previous adoption.

ii
It is concluded that a housing-incorporated system in Canterbury is economically and
environmentally viable, although practical-based research is required to ensure feasibility.
Keywords: Dairy farming, housing structure, wintering barn, environmental, economic, Canterbury,
nitrate leaching, housed wintering, profitability, pasture-based, OVERSEER®

iii
Acknowledgements
The following dissertation concludes a wonderful 4 years at Lincoln University, and I would not have been
possible to achieve what I have without the assistance of a few people, who I would now like to express
my deep gratitude to.
Firstly I would like to thank Dr Marvin Pangborn, my supervisor for this project. I have learnt a great deal
from you about agriculture, agribuiness and beyond. Without your invaluable knowledge and guidance, I
would not have been able to produce this report. To have such a great mentor for this project has been a
massive priviledge, thanks for sparking my passion for the dairy industry. Also, thanks to Ian Domigan for
your expertise in engineering, and assistance with this project.
I would also like to thank all the lecturers at Lincoln University who have taught me so much, in particular
Guy Trafford, for your expertise in farm management, and accepting my work no matter how delayed,
Sharon Lucock, for your knowledge of new venture planning, and your assistance in assembling my excel
mastersheet and Keith Woodford, for your incredible knowledge of all things agriculture.
To Ron Pellow, Rangi Holland and Trevor Green, the industry professionals who have assisted with this
report. Your input into this report has been vital, thank you for being so open and obliging with your
knowledge, and for donating your time to assisting my research.
To DairyNZ (in particular Susan Stokes) and the Sir Arthur Sims Trust, thank you for the assistance and
financial support throughout my studies. With your help I’ve managed to avoid any financial woes and
been able to focus on my studies, something that has benefitted me greatly.
I would like to thank all of the incredible friends I have made during my time at Lincoln, I’ve been so lucky
to meet such a great group of people. To my flatmates of the past 3 years; Brandon – my partner in crime,
Natalie – the eternal optimist and Bentley – for keeping me humble. Also to Kendall, Linda and Emma
from Tonga Place, Tom and Reid from the Stables and Josiah, Tara and Bev at the Refugee Camp, thank
you all for putting up with me. To the commerce postgraduate students, Nikki Brown, Kate Downie-
Melrose, Angus McKenzie and Nick Evans, thank you for your insights and discussions through the year,
I’m sure you’ll all go far. In particular I’d like to thank Marc Brakenrig, for leading the way for the past 4
years, and keeping me on track. We’ve come a long way since Southland hall and MGMT 103 in 2011, and
I look forward to keeping in touch as we move into life after university.
Finally, to my Mother, Anne-Mary, thanks for your encouragement throughout my degree, and managing
keeping me on the straight-and-narrow. And to my Father, Andrew, thank you for your amazing farming
guidance and advice, as well as general life advice. You’ve been great role models to me, and I’m very
lucky to have you supporting me in whatever I do.

iv
Table of Contents
Acknowledgements ..................................................................................................................... iii
Table of Contents ........................................................................................................................ iv
List of Tables ............................................................................................................................. viii
List of Figures ............................................................................................................................... x
Chapter 1 : Introduction ................................................................................................................ 1
Chapter 2 : Literature Review ........................................................................................................ 2
2.1 Introduction ................................................................................................................................... 2
2.2 Nitrogen Losses from dairying ....................................................................................................... 3
2.2.1 The issue of nitrate leaching ............................................................................................. 3
2.2.2 The effect of nitrate leaching on waterways .................................................................... 3
2.2.3 Public perception of dairying ............................................................................................ 4
2.3 Current wintering systems in New Zealand ................................................................................... 4
2.4 Use of structures/restricted grazing to control N leaching ........................................................... 5
2.5 Effect of structures on animal health ............................................................................................ 9
2.6 Literature review conclusion ....................................................................................................... 10
2.6.1 Hypothesis ....................................................................................................................... 11
Chapter 3 : Methods ................................................................................................................... 12
3.1 Introduction ................................................................................................................................. 12
3.2 Research Questions ..................................................................................................................... 12
3.3 Proposed quantitative methods .................................................................................................. 12
3.3.1 Economic analysis ........................................................................................................... 12
3.3.2 Environmental analysis ................................................................................................... 13
3.4 Proposed systems ........................................................................................................................ 13
3.4.1 Current system ................................................................................................................ 13
3.4.2 Proposed housing-incorporated systems ....................................................................... 15
3.5 Assumptions ................................................................................................................................. 15
3.5.1 Financial assumptions ..................................................................................................... 16
3.5.2 Present system assumptions........................................................................................... 18
3.5.3 Proposed system changes ............................................................................................... 19

v
3.6 Methods summary ....................................................................................................................... 26
Chapter 4 : Environmental Analysis ............................................................................................. 27
4.1 Changes in Overseer® assumptions by system ............................................................................ 27
4.2 Overseer® results ......................................................................................................................... 29
4.2.1 Current system ................................................................................................................ 30
4.2.2 Housed system ................................................................................................................ 30
4.2.3 Roofless system ............................................................................................................... 30
Chapter 5 : Economic Analysis ..................................................................................................... 32
5.1 Introduction ................................................................................................................................. 32
5.2 System details .............................................................................................................................. 32
5.2.1 Total supplementary feed volumes ................................................................................ 33
5.2.2 Comparison of farm working expenses .......................................................................... 34
5.2.3 Annual budgets ............................................................................................................... 35
5.3 Proposed economic values of the benefits of incorporating structures (Appendix I) ................. 36
5.4 Proposed economic values of the costs of incorporating structures (Appendix H) .................... 37
5.5 Investment apprasial ................................................................................................................... 37
5.5.1 Current system ................................................................................................................ 38
5.5.2 Housed system ................................................................................................................ 39
5.5.3 Roofless system ............................................................................................................... 40
5.5.4 Comparison (Marginal returns) ....................................................................................... 41
5.5.5 Statement of assets/liabilities ......................................................................................... 41
Chapter 6 : Discussion ................................................................................................................. 43
6.1 Environmental results .................................................................................................................. 43
6.1.1 Factors which influenced environmental results ............................................................ 43
6.1.2 Other environmental considerations .............................................................................. 44
6.1.3 Cost of N mitigation ........................................................................................................ 45
6.2 Financial results as compared to research question ................................................................... 46
6.2.1 Comparison to previous literature .................................................................................. 47
6.3 Benefits and costs of proposed system ....................................................................................... 50
6.3.1 Benefits ........................................................................................................................... 50
6.3.2 Costs ................................................................................................................................ 53
6.4 Sensitivity Analyses ...................................................................................................................... 55
vi
6.4.2 Multiple scenario analysis ............................................................................................... 59
6.5 Other opportunities ..................................................................................................................... 61
6.6 Risks ............................................................................................................................................. 64
Chapter 7 : Conclusions .............................................................................................................. 66
7.1 Research questions ...................................................................................................................... 66
7.2 Benefits and risks of system adoption ......................................................................................... 67
7.3 Limitations of Research ................................................................................................................ 67
7.4 Future Research Topics ................................................................................................................ 68
Chapter 8 : Addendum ................................................................................................................ 70
References ................................................................................................................................. 72
Appendix A: Housing Structure Design ........................................................................................ 76
Appendix B Price Assumptions .................................................................................................... 79
Other assumptions ................................................................................................................................. 79
Funding assumptions ............................................................................................................................. 80
Depreciation assumptions...................................................................................................................... 80
Appendix C System Details .......................................................................................................... 81
Appendix D Annual Budget ......................................................................................................... 82
Appendix E Investment Appraisal ................................................................................................ 83
Current system ....................................................................................................................................... 83
Proposed housing structure-incorporated system ................................................................................ 85
Proposed roofless structure-incorporated system ................................................................................ 87
Marginal returns..................................................................................................................................... 89
Appendix F Depreciation Schedules ............................................................................................. 91
Current system ....................................................................................................................................... 91
Proposed housing structure-incorporated system ................................................................................ 91
Proposed roofless structure-incorporated system ................................................................................ 92

vii
Appendix G Loan Schedules ........................................................................................................ 94
Proposed housing structure-incorporated system ................................................................................ 94
Proposed roofless structure-incorporated system ................................................................................ 95
Appendix H Proposed system costs ............................................................................................. 96
Current and proposed system supplementary feed consolidation ....................................................... 96
Repairs and maintenance of proposed housing structures ................................................................... 97
Other costs ............................................................................................................................................. 97
Appendix I Proposed system benefits .......................................................................................... 98
Appendix J Effluent system assumptions ....................................................................................100
Housed system ..................................................................................................................................... 100
Roofless system .................................................................................................................................... 101
Appendix K Statement of Assets and Liabilities ...........................................................................102
Current system ..................................................................................................................................... 102
Proposed housing structure-incorporated system .............................................................................. 102
Proposed roofless structure-incorporated system .............................................................................. 103

viii
List of Tables
Table 1: Model predicted operating profit for four wintering systems over 35 independently
simulated climate years (Beukes et al., 2011) ..................................................................... 8
Table 2: Base economic results for a modelled housed system (Journeaux, 2013)* .............................. 8
Table 3: Nutrient discharge (kg/ha) for a sedimentary soil of base and housed systems (Journeaux,
2013) .................................................................................................................................... 9
Table 4: System information for the LUDF from 2009/10 to 2012/13................................................... 14
Table 5: Soils data for LUDF (SIDDC, 2014) ............................................................................................ 14
Table 6: Climate data for LUDF .............................................................................................................. 15
Table 7: Diminishing value depreciation rates for farm equipment (IRD, 2014b) ................................ 16
Table 8: Current LUDF assets (Pellow, personal communication, 2014) ............................................... 18
Table 9: Income for the current system (Appendix D) ........................................................................... 19
Table 10: Farm working expenses for the current system (Appendix D) ............................................... 19
Table 11: Assumed system detail changes for proposed systems ......................................................... 20
Table 12: Costings of housing and effluent structures (Green, personal communication, 2014;
Lotter, personal communication, 2014) ............................................................................ 20
Table 13: Institutional loan value for the proposed systems (Appendix B) ........................................... 21
Table 14: Supplementary feed assumptions for proposed systems (Appendix H) ................................ 22
Table 15: Monthly feeding levels in the proposed systems (Journeaux, 2013; Pellow, personal
communication, 2014) ....................................................................................................... 23
Table 16: Production assumptions for current and proposed systems (Appendix C) ........................... 24
Table 17: Summary of extra tractor costs in the proposed systems ..................................................... 26
Table 18: Farm scenario differences in Overseer® assumptions for current and proposed systems.... 28
Table 19: Dairy enterprise differences in Overseer® assumptions for current and proposed
systems .............................................................................................................................. 28
Table 20: Structure Overseer assumptions for proposed systems ........................................................ 29
Table 21: Nitrogen fertiliser and effluent assumptions for current and proposed systems................. 29
Table 22: Nutrients removed summary for the current system ............................................................ 30
Table 23: Nutrients removed summary for the proposed housed system ............................................ 30
Table 24: Nutrients removed summary for the proposed roofless system ........................................... 31
Table 25: Summary of assumptions for current and proposed systems (see Appendix C) ................... 33
Table 26: Supplementary feed consolidation for current and proposed systems ................................. 34
Table 27: Comparison of farm working expenses for current and proposed systems (Appendix D) .... 35
Table 28: Definitions of annual budget KPI's ......................................................................................... 35
Table 29: Summary of annual budget (Appendix D) .............................................................................. 36

ix
Table 30: Summary of wintering structure benefits .............................................................................. 37
Table 31: Summary of wintering structure costs ................................................................................... 37
Table 32: 12 year pre finance and tax IRR and NPV values for the current system ............................... 38
Table 33: 12 year post finance and tax IRR and NPV values for the current system ............................. 39
Table 34: 12 year pre finance and tax IRR and NPV values for the housed system ............................... 39
Table 35: 12 year post finance and tax IRR and NPV values for the housed system ............................. 40
Table 36: 12 year pre finance and tax IRR and NPV values for the roofless system .............................. 40
Table 37: 12 year post finance and tax IRR and NPV values for the roofless system ............................ 41
Table 38: Pre finance and tax marginal returns of the proposed systems compared to the current
system ................................................................................................................................ 41
Table 39: Statement of assets and liabilities for the current and proposed systems ............................ 42
Table 40: Capital cost of N mitigation .................................................................................................... 45
Table 41: Pre finance and tax real cost or benefit of N mitigation at different discount rates ............. 46
Table 42: Summary of investment appraisal for current and proposed systems .................................. 47
Table 43: Comparison of housing structure costs for proposed systems vs Journeaux (2013), De
Wolde (2006) and NZIPIM (2014) ...................................................................................... 47
Table 44: Comparison of current and proposed wintering costs ........................................................... 49
Table 45: Sensitivity analysis of changing housing structure cost ......................................................... 55
Table 46: Sensitivity analysis of changing milk price.............................................................................. 56
Table 47: Sensitivity analysis of changing average supplementary feed price* .................................... 57
Table 48: Sensitivity analysis of changing milk production .................................................................... 58
Table 49: Sensitivity analysis of changing farm working expenses ........................................................ 58
Table 50: Sensitivity analysis of increasing machinery costs ................................................................. 59
Table 51: 'All gone right' and ‘all gone wrong’ scenario analysis for current and fully housed
systems .............................................................................................................................. 60
Table 52: 'All gone right' and ‘all gone wrong’ scenario analysis for current and roofless systems ...... 61
Table 53: PKE specifications (DairyNZ, 2014; Winton Stock Feed, 2014) .............................................. 63
Table 54: Housing structure costs for housed and roofless systems ..................................................... 66
Table 55: Pre finance and tax IRR's for the current and proposed systems .......................................... 66
Table 56: N leaching summary for current and proposed systems ....................................................... 67
Table 57: Amended changes to N application rates .............................................................................. 70

x
List of Figures
Figure 1: Dairy cattle in the North and South islands (2007-2012) (Statistics New Zealand, 2013) ........ 2
Figure 2: 2010 Southland wintering systems (Dalley, 2013) .................................................................... 5
Figure 3: Farm leaching during winter in Southland (Monaghan et al., 2004) ........................................ 6
Figure 4: Monthly pasture growth rates on ‘Bog Burn’ (Monaghan et al., 2004) .................................... 7
Figure 5: Ranking of health and welfare issues in dairy housing systems compared to pasture
based management (Arnold et al., 2009) ............................................................................ 9

1
Chapter 1:
Introduction
The New Zealand dairy industry is a major contributor to the New Zealand economy, and a significant
player in the world dairy trade scene. The industry consists of over 4.82 million cows, producing 19.1
billion litres of milk on 1.6 million hectares (DairyNZ Limited, 2011). New Zealand exports 95% of
produced milk, making it the largest cross-border dairy trader worldwide, accounting for one-third of all
global dairy trade (MPI, 2014) and for a quarter of all New Zealand merchandise exports. This results in
the dairy industry being an important aspect of the New Zealand economy, and is often considered as
the economies ‘backbone’.
In recent years, there has been increasing public scrutiny about the impact that dairy farming has on the
surrounding environment. With increasing intensity of dairying, particularly in Canterbury, there has
been an observable decline in water quality (Monaghan, 2012), due to the growing amounts of Nitrogen
leaching into both underground aquifers and surface water. Not only is this decline in water quality a
risk to human health (Di & Cameron, 2002), it is also a threat to the ‘clean, green’ image used by New
Zealand to market its agricultural exports overseas.
This quantitative study begins with a review of the existing literature in Chapter 2 regarding nitrate
leaching caused by dairy cow wintering, the use of housing structures and restricted grazing practices to
mitigate these adverse environmental effects, and the economic effects of the use of these practices in
a farming system. Chapter 3 outlines the method of the study, and the assumptions made to construct a
hypothetical system with a housing structure incorporated. The economic analysis of the system will be
undertaken using Microsoft ® ExcelTM, while the environmental analysis will use Overseer® 6 to calculate
the ‘Nitrogen lost to water’ figure of the systems. Chapter 4 contains the economic results of the study,
while Chapter 5 has the environmental results. Chapter 6 contains a discussion of these results. The
study concludes with a summary of findings, as well as limitations of the study, and future research
topics that arise from the study.

2
Chapter 2:
Literature Review
2.1 Introduction
The purpose of this chapter is to review existing literature with regard to nitrate leaching in New
Zealand, and the use of housing structures and restricted grazing practices in order to mitigate the
adverse environmental effects caused by nitrate leaching, as well as the economic effect of these
practices on the system.
The New Zealand Dairy Industry has experienced large growth in dairy cattle numbers, with an increase
of 1.2 million cows (from 5.2 million to 6.4 million) in the period between 2007 and 2012 (Figure 1). The
majority of this growth has occurred in the South Island, with the conversion of traditional sheep and
beef properties into more intensive dairy farms due to higher levels of profitability (Fonterra, 2013).
Figure 1: Dairy cattle in the North and South islands (2007-2012) (Statistics New Zealand, 2013)
The typical New Zealand dairy model has cows calving in spring, and producing milk until late autumn.
This results in a period over the winter when the cows are out of lactation (dried off) and allowed to
regain condition for the following season (De Wolde, 2006). This practice is commonly referred to as
‘wintering’. During this period, soil water levels are often at or near field capacity, and Nitrogen (N)
being applied to the soil by cows through urine or faeces that is not used by the plants will eventually be
leached out of the soil profile and into waterways (Di & Cameron, 2002; Ledgard, Klein, Crush, &
Thorrold, 2000). This leaching is exaggerated as the plants being grazed by the cattle are in a period of
minimal growth or dormancy due to low soil temperatures. Typical soils used for wintering in
Canterbury are light (Di, Cameron, Moore, & Smith, 1998), which are more prone to leaching than the
volcanic soils of traditional dairying regions such as the Waikato and Taranaki (Thorrold, 2000). An

3
alternative option for a wintering system is to use standoff structures, and restrict the grazing time of
the cows. This will minimise the time cows spend on waterlogged soils, and their effluent can be
captured, treated and stored for application onto pasture when the plants are growing, therefore
reducing leaching losses (de Klein, 2001). Aside from wintering, another period of significant leaching
losses is during the ‘shoulders’ of the season, or late autumn and early spring. During this period, the
cows are still grazing pasture and excreting urine onto soils, which may be under similar cold and wet
environmental conditions as the wintering period.
2.2 Nitrogen Losses from dairying
2.2.1 The issue of nitrate leaching
As New Zealand dairying is predominantly pasture based, cows spend nearly all their time on paddocks
grazing. Pastoral based systems are low cost, and give New Zealand a competitive economic advantage
in the production of milk (Lees, 2014). Winter is the time of year when this is not the case, as cows are
typically grazing small areas of crop. However, this can give rise to N losses from leaching to
groundwater. This leaching is caused when the supply of N into the soil is greater than the uptake by the
plants, and any leftover N is drained away with the water (Di & Cameron, 2002). The form of N most
prone to leaching is nitrate (NO3-) (Di et al., 1998), which is a large component of cow urine patches.
Nitrate has a negative charge, and is repelled from the cation exchange sites (CEC) in the soil colloids,
causing it to accumulate in the soil profile, and is prone to leaching through the soil profile during
periods of high drainage. The concentration of nitrate in a cows urine patch varies, but is believed to be
approximately 1000kgN/ha when applied to the paddock (Silva, Cameron, Di, & Hendry, 1999). This
nitrate concentration is too high for plant uptake, causing it to accumulate in the soil profile and in turn
the excess N is leached, producing the greatest period of N losses from a pastoral based grazing system
(Silva et al., 1999).
The ‘shoulders’ of the season can provide environmental conditions conducive of leaching. This also is a
period of reduced plant growth due to lower environmental temperatures, and any application of N
(such as urine patches from cows) will not be utilised fully by the plants. If this accumulation of nutrients
is followed by (or coincides with) a period of significant drainage, there can be substantial N losses to
waterways (Di & Cameron, 2002).
2.2.2 The effect of nitrate leaching on waterways
With the intensification of agriculture, there has been an observed decline in water quality and the
ecological condition of waterways and aquifers (Bradley et al., 2011). There are multiple potential
negative effects of nitrate on waterways and aquifers. One of these effects, called eutrophication, is
caused when nitrate enters waterways, and causes increased growth of algae and other plants in the

4
waterway. This in turn causes a shading effect in the water, preventing light entering the water and
effectively suffocating the water of oxygen (Van der Molen, Breeuwsma, & Boers, 1998). This can be
catastrophic to aquatic life and in affected streams the numbers of fish and other aquatic life are in
decline.
The nitrate levels in water can also have adverse effects on humans. In high concentrations in water, it
can cause cancer, and methaemogloginaemia, or ‘blue baby syndrome’ in infants. Because of this, the
World Health Organisation has a guideline value for nitrate of 50mg/L in water (World Health
Organization, 1984). With continuing losses of N into waterways, freshwater in New Zealand could
exceed this guideline and the water become unsafe to drink.
2.2.3 Public perception of dairying
Thorrold (2000) warns that farmers need to be aware of the perceptions of their farming practices,
relayed to non-farmers by the visual appearance of their farms and its surrounds. If the perception of
farmers is negative, and farmers are believed to not be making an effort to mitigate their environmental
effect, it may result in legislation restricting farming practices. This movement has already begun, with
the Canterbury Land and Water Regional Plan currently being brought into effect by Environment
Canterbury (ECan). This includes legislation to enforce Nitrogen leaching limits for farming systems
(Environment Canterbury, 2014). This should not be the only reason for farmers to mitigate the
environmental effect of their system; they should also be conscious that farming requires the
environment to produce product, and if the environment becomes degraded, it will also threaten their
production.
2.3 Current wintering systems in New Zealand
The definition of animal wintering is not consistent across the country, varying with differing climatic
conditions and management preferences, but a description (based on Southland practices) is ‘the
management approach undertaken to feed animals over the 12 week period from late May to late
August’ (Monaghan, 2012). As wintering proceeds calving in a traditional dairying system, it is important
to keep a healthy environment for the late development of the foetus (Cottier, 2000), as well as
preparing the cow for upcoming lactation. As cows typically lose condition over the course of the milking
season, wintering is an important period for the cows to regain condition, and reach target body
condition scores (BCS) to ensure optimal milk production and animal welfare in the following season.
Traditionally, New Zealand farmers use a low-cost approach to wintering; it is seen as an expense with
minimal returns, and often is a low priority for farmers who focus on milk production first. Despite this
view, previous studies state that wintering systems are important to the financial viability of the entire
system, as they protect soils and pasture production, which influences milk production in the following

5
season (Beukes, Gregorini, Romera, & Dalley, 2011; Thorrold, 2000). In the past, this low cost approach
has led to adverse environmental impacts being ignored in pursuit of low-cost methods. Unfortunately
winter is the period when the greatest losses of nutrients to waterways occur in dairy systems. It is also
an important aspect of the whole farm system, possibly accounting for 20-25% of total farm working
expenses (Cottier, 2000).
This low-cost approach varies between regions of the country. The most common method in South
Island dairying is the use of forage crops (Dalley, 2011) such as kale, due to their high yield allowing a
small area to sustain a large number of cows, and therefore maximise the area available for the dairy
platform. Dalley (2013) reports that 60% of Southland farmers use a winter crops as their wintering
practice (Figure 2). This method is not without flaws, as many cows fail to achieve BCS targets for calving
(Dalley, 2011), the utilisation of the crop is poor, and leaching levels off these crops are often very high
(>153kgN/ha/yr) (Monaghan, 2012).
Figure 2: 2010 Southland wintering systems (Dalley, 2013)
The adoption of off-pasture wintering systems is becoming more common (Beukes et al., 2011; Dalley,
2011) particularly in Southland, where they are seen to be more economically viable than forage crops
(Beukes et al., 2011; De Wolde, 2006) and in high rainfall areas of the North Island, where the potential
for soil and pasture damage is greatest.
2.4 Use of structures/restricted grazing to control N leaching
Duration-controlled grazing practices, in conjunction with the use of cow housing and/or feed-pad
facilities, reduces both the time that cows spend in paddocks and the quantity of excreta deposited in
paddocks (Christensen, Hanly, Hedley, & Horne, 2010; de Klein, Paton, & Ledgard, 2000). This strategy is
best used during high risk periods, such as in heavy rain events or when the soil is waterlogged (such as
in autumn and spring), to limit the amount of time the cows are on the paddock during the highest risk
periods for leaching. This practice decreases the number of dung and urine patches distributed to the

6
paddock, and hence, reduces the potential for N leaching. (de Klein, 2001) The collected excreta from
the standoff structure is then spread evenly and at nutrient rates and timings that match plant uptake
(Chadwick, Ledgard, & Brown, 2002).
Monaghan et al. (2004) reported that in a trial at Bog Burn in Southland, 60% of the total farms leaching
occurred during the winter months, on 15% of the farms land area (Figure 3). This represents a
considerable portion of the total farm leaching during a relatively short timeframe. He concluded that
this was due to:
1. Relatively large amounts of mineral nitrogen remaining in the soil in late autumn
2. The deposition of much excretal N onto the winter crop when the plant uptake was
correspondingly low.
Figure 3: Farm leaching during winter in Southland (Monaghan et al., 2004)
These results were also achieved by Christensen et al. (2010) who reported a 41% decrease in nitrate
leaching when the average time on pasture was halved compared to a standard grazing treatment. This
60% leaching, if captured using a standoff structure, could not just reduce N losses by a considerable
amount, but also be utilised for increasing plant growth during periods of greater pasture growth.
Figure 4 shows the growth rates on ‘Bog Burn’, and shows the minimal growth over the winter period
when this high leaching rate occurs. If the excreta is stored, and reapplied during spring, not only will it
reduce leaching, but could increase grass production, and in turn milk production.

7
Figure 4: Monthly pasture growth rates on ‘Bog Burn’ (Monaghan et al., 2004)
A drawback of using a standoff structure is the required increase in capital expenses and/or operating
costs (de Klein, 2001). De Wolde (2006) and Journeaux (2013) assumed a $1500-$2000/cow erection
cost for a fully enclosed wintering shed, while NZIPIM (2014) details a $3220/cow cost for a recently
erected fully enclosed housing shed in Canterbury. A study of housing costs by Benton (unpublished)
found that this figure varies greatly depending on the features of the structure, and can be anywhere
between $500 to $4500 per cow. Ideally, this cost of capital would be covered by increased production.
By reducing leaching, nutrients are conserved to be used to increase pasture production or replace
fertilizer. This increased production (or reduction in costs) may cause greater income, which will cover
some of the cost of the structure. Aside from this, there are other benefits from restricted grazing of
cows during the winter. de Klein (2001) reports that a reduction in cow traffic, or ‘pugging’ during this
period, can increase pasture production by between 2% and 20%, due to the cows not trampling pasture
and soils during the winter period, and therefore allowing the pasture to be in optimum condition for
spring growth.
Beukes et al. (2011) studied the profitability and risk of wintering strategies in Southland. They
compared four strategies (all brassica, all pasture, grass silage on a standoff pad and grass silage in a
housing system) by modelling the financial and environmental risk of the systems. They concluded that
the housing system provided the highest returns, both financially (Table 1) and environmentally,
followed by the all pasture system, then the loafing pad.
8
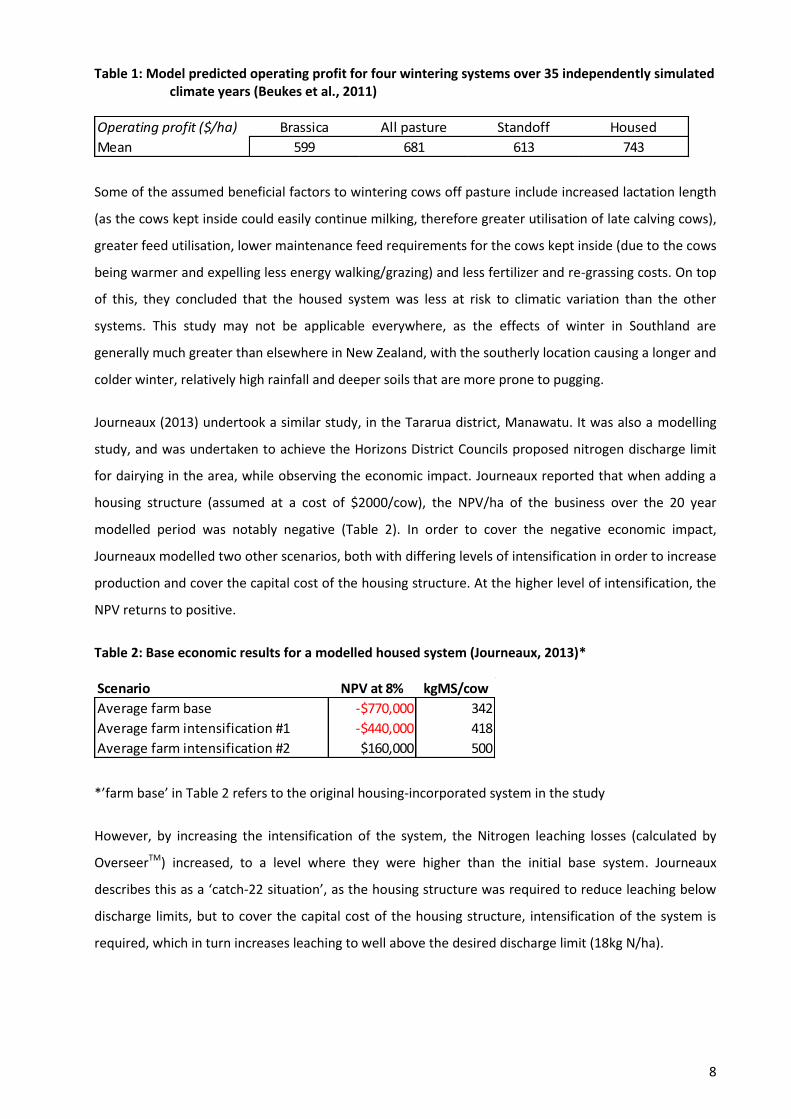
Table 1: Model predicted operating profit for four wintering systems over 35 independently simulated climate years (Beukes et al., 2011)
Some of the assumed beneficial factors to wintering cows off pasture include increased lactation length
(as the cows kept inside could easily continue milking, therefore greater utilisation of late calving cows),
greater feed utilisation, lower maintenance feed requirements for the cows kept inside (due to the cows
being warmer and expelling less energy walking/grazing) and less fertilizer and re-grassing costs. On top
of this, they concluded that the housed system was less at risk to climatic variation than the other
systems. This study may not be applicable everywhere, as the effects of winter in Southland are
generally much greater than elsewhere in New Zealand, with the southerly location causing a longer and
colder winter, relatively high rainfall and deeper soils that are more prone to pugging.
Journeaux (2013) undertook a similar study, in the Tararua district, Manawatu. It was also a modelling
study, and was undertaken to achieve the Horizons District Councils proposed nitrogen discharge limit
for dairying in the area, while observing the economic impact. Journeaux reported that when adding a
housing structure (assumed at a cost of $2000/cow), the NPV/ha of the business over the 20 year
modelled period was notably negative (Table 2). In order to cover the negative economic impact,
Journeaux modelled two other scenarios, both with differing levels of intensification in order to increase
production and cover the capital cost of the housing structure. At the higher level of intensification, the
NPV returns to positive.
Table 2: Base economic results for a modelled housed system (Journeaux, 2013)*
*’farm base’ in Table 2 refers to the original housing-incorporated system in the study
However, by increasing the intensification of the system, the Nitrogen leaching losses (calculated by
OverseerTM) increased, to a level where they were higher than the initial base system. Journeaux
describes this as a ‘catch-22 situation’, as the housing structure was required to reduce leaching below
discharge limits, but to cover the capital cost of the housing structure, intensification of the system is
required, which in turn increases leaching to well above the desired discharge limit (18kg N/ha).
Operating profit ($/ha) Brassica All pasture Standoff Housed
Mean 599 681 613 743
Scenario NPV at 8% kgMS/cow
Average farm base -$770,000 342
Average farm intensification #1 -$440,000 418
Average farm intensification #2 $160,000 500

9
Table 3: Nutrient discharge (kg/ha) for a sedimentary soil of base and housed systems (Journeaux, 2013)
2.5 Effect of structures on animal health
As well as the economic and environmental effects of housing structure incorporation, there is also an
effect on animal health and welfare. Arnold, Verkerk, Gregory, and Matthews (2009) undertook a survey
of farmers in New Zealand who have incorporated housing structures, and their effect on animal health.
They contacted these farmers and their associated vets to establish how certain categories of animal
health were affected by the addition of a housing structure compared to pasture based management.
Figure 5 shows a summary of their results. The covered deep litter structures had the best animal health
benefits, with improvements over every category (excluding dirtiness). All other structures showed
improvements in cow condition, thermal challenge and lying time, with similar or worse results for hoof
health, injury and mastitis. All structure types had increased dirtiness.
Figure 5: Ranking of health and welfare issues in dairy housing systems compared to pasture based management (Arnold et al., 2009)

10
De Wolde (2006) also reviewed animal health advantages and disadvantages. He noticed issues with
cows adapting to the system, but also noted that these problems were significantly reduced once cows
adapted to using the structure. He concluded that the housed wintering increased rates of accidents and
injuries, while abortions reduced, and cows gained condition more easily. Udder and hoof health was
relatively unaffected. This study was observed on a system in its first season using the housing structure,
and de Wolde stated that these initial issues should improve with time as the cows familiarise with the
new system.
2.6 Literature review conclusion
The growth in the dairy industry over the past decade has resulted in land intensification, which has
resulted in a greater environmental impact. An increase in excreta produced by cows onto the land has
resulted in an increased N leaching problem, which is causing negative effects on waterways and
aquifers.
This leaching loss, which is particularly prominent during the ‘shoulders’ of the milking season and
during the winter, can be reduced by restricting the grazing time of cows, and removing them onto a
standoff structure during high risk periods. By removing the cows from the pasture, the cows’ high-
nitrate excreta will be collected, rather than applied onto pasture to be lost through drainage. Not only
can the incorporation of standoff structures reduce leaching, but can also influence production. Other
benefits from the removal of cows include reduced pugging, better utilisation of feed, reapplication of
valuable nutrients, and lower maintenance requirements for cows. These may result in less wastage of
feed, which then can be utilised for milk production, leading to increased profitability on farm. Arnold et
al. (2009) concluded from their surveys that: “In general, farmers believed their housing system had
impacted positively on their business”
Dalley (2013) reported that 45% of farmers had changed their wintering system over the previous 5
years, with 14% of those changing because of environmental reasons and to protect wet paddocks. This
reflects that farmers are open to changing their practices if they see benefit from it, and that some are
open to modify their practices to mitigate adverse environmental effects. The major barrier to change
was the capital requirement, with 61% of respondents identifying this as an issue preventing change.
The literature review covered a broad range of literature, from 12 different sources. It followed some
specialists on the subject, such as R. M. Monaghan, D. E. Dalley and C. A. M. de Klein, who each have
multiple works cited. The majority of the covered literature was recent, making it more relevant,
although some older references were used for more basic concepts. The review covered the process of
leaching, and then concluded that the use of standoff structures is a viable strategy for wintering in New
Zealand, from both an economic and environmental perspective, although each case must be
considered individually.

11
As Environment Canterbury is currently implementing the Land & Water Regional Plan for Canterbury,
the environmental impacts of dairying will become the farmer’s liability, and there is an emerging
demand for the development of mitigation techniques.
While reviewing the literature, a distinct gap was found: There was a lack of data on the use of wintering
structures in Canterbury. There was ample data on Southland wintering systems, where the financial
impacts of wintering are much greater, and also available data from the Manawatu, but none directly
applicable to Canterbury dairying.
2.6.1 Hypothesis
From this review, the following hypothesis was created;
‘A housing structure can be incorporated into a Canterbury dairy farming system to reduce N leaching,
while maintaining the economic viability of the system.’

12
Chapter 3:
Methods
3.1 Introduction
The purpose of this project is to model a change at the Lincoln University Dairy Farm (LUDF). The LUDF is
located near Lincoln Township, in the Selwyn District of Canterbury. Founded in 2001, following its
conversion from a dryland sheep operation, its aim is to achieve “maximum sustainable profit
embracing the whole farm system (SIDDC, 2014) by increasing productivity, minimising adverse
environmental effects, achieving acceptable animal welfare standards all while providing readily
accessible information that is relevant to progressive Canterbury and South Island dairy farmers.” It is an
186ha intensive, fully irrigated system 3 dairy farm, of which 160.1ha is the effective dairy platform,
with an additional 14ha of run-off. There is 3.7 staff units required on the farm annually, and the cows
are milked through a 50 bale rotary milking shed. The farm is currently one of the highest producing
pasture-based dairy farms in Canterbury. Incoming environmental regulations pose a serious threat to
the high producing, high profitability enterprise.
This model will involve the inclusion of structures for use during at-risk periods of the season to control
N leaching. The modelled changes to the system will be analysed quantitatively for both economic and
environmental sustainability.
3.2 Research Questions
The gap in literature leads to 3 research questions:
1. What is the cost of adding housing structures to the LUDF?
2. How will the profitability of a system with a housing structure incorporated compare to the
existing system?
3. How will the proposed system compare to the current system on an environmental basis?
3.3 Proposed quantitative methods
3.3.1 Economic analysis
The analysis is an economic cost-benefit analysis. The major change in the system financially will be the
addition of the housing structure. This structure will be priced as realistically as possible, using actual
industry figures. Other figures that will be altered will be adjusted using expert opinion and calculated

13
estimates of the most likely real-world scenario. These will primarily be modelled from historical LUDF
data. The ‘expert opinion’ will be provided by industry professionals.
A financial analysis between the current system and the two proposed systems will be performed using
Microsoft ExcelTM. This will comprise a whole farm annual budget, to discover the influence of the
structure on annual production and the eventual final profitability figures. In addition to the whole-farm
budget, a 12 year investment appraisal (including depreciation and loan schedules) as well as the
identification of assumed benefits and costs of a housed wintering system will be provided.
The investment analysis is undertaken with the use of price assumptions to detail the annual cash and
tax flows over a period of years (in this case 12) in order to calculate a final internal rate of return (IRR)
and net present values (NPV) of the enterprise at different discount rates. This is a technique for
comparing the profitability of different systems over a predetermined time period.
3.3.2 Environmental analysis
For the environmental analysis, the computer modelling software Overseer® 6 will be used. Overseer® is
an ‘agricultural management tool which assists farmers and their advisers to examine nutrient use and
movements within a farm to optimize production and environmental outcomes’ (MPI, FANZ and
AgResearch, 2013). The primary output from Overseer® which will be analysed is the ‘N lost to water’
figure, or the Nitrogen Leached figure, as this is currently the greatest (regulatory) limiting factor to
production at the LUDF. This figure is calculated from a wide range of on-farm factors, such as climate,
soils, production data, stock numbers and fertilizer inputs.
The programme has a margin of error of +/- 30% (MPI, FANZ, & AgResearch, 2013), which is a significant
margin, but it is currently considered the best tool for modelling, and is accepted as standard by
regulatory entities. The Overseer ® analysis will be completed with assistance from a trained
representative of the Ravensdown Fertiliser Co-operative.
3.4 Proposed systems
3.4.1 Current system
The current system will be determined using the guidance and recommendations from industry
professionals. In the current system, the farm is run as a conventional dairy unit, with cows on pasture
during lactation and with the majority of cows being wintered off-farm. Data from the 2012/13 season
will be used as base data, due to atypical system adjustments occurring in the 2013/14 system to test
whether the farm could operate within legislated limits. The 2012/13 data is more typical of how the
farm has performed historically.

14
Production data:
The property milked a peak of 630 cows in the 2012/13 season, at a stocking rate of 3.94 cow/ha. These
cows produced 477kgMS/cow. Table 4 provides historic data on the LUDF farming system:
Table 4: System information for the LUDF from 2009/10 to 2012/13
Soils:
The property has varying soils, typical of the area but in some cases atypical of Canterbury’s free-
draining soils. The classification of soils on the property is approximately:
Table 5: Soils data for LUDF (SIDDC, 2014)
Soil types % Milking Platform
Free-draining shallow stony soils (Eyre soils) 5
Deep sandy soils (Paparua and Templeton soils) 45
Imperfectly drained soils (Wakanui soils) 30
Heavily, poorly-drained soils (Temuka soils) 20
These soils, which have a reasonable percentage of heavy soils with imperfect drainage, are prone to
damage in wetter months, and are required to be carefully managed to prevent damage. Despite this,
the mixture of heavy and light soils, when properly managed, can provide a good management tool due
to the flexibility their differing properties provide.
Climate:
The LUDF is located on the East Coast of the South Island, and the area is influenced by drying Norwest
winds, Easterly sea winds and Southerly fronts, which bring cold weather and rain. As the property is
fully irrigated, the lack of consistent annual rainfall has minimal effect on production. The annual rainfall
2009/10 2010/11 2011/12 2012/13
Total kg/MS supplied 273,605 264,460 297,740 300,484
Ave kgMS/cow 415 395 471 477
Ave kgMS/ha 1710 1653 1861 1878
Farm Working Expenses / kgMS $3.38 $3.86 $3.92 $3.84
Dairy Operating Profit / ha $4,696 $6,721 $4,526 $4,665
Payout [excl. levy] $/kg $6.37 $7.80 $6.30 $6.12
Return on assets 7% 7% 6% 6%
Stock numbers
1 July cow numbers 685 694 665 650
Max. cows milked 660 669 632 630
Days in milk 266 271 272 273
Stocking rate Cow equiv. / ha 4.13 4.18 3.95 3.94
Stocking rate Kg liveweight / ha 1,941 1,914 1,860 1,878
Cows wintered off. No. Cows / weeks 570 / 9 652 / 8.4 650 / 9.8 650/9.8
No. Yearlings grazed On/Off 0 / 160 0 / 166 0 / 141 0/138
No. Calves grazed On/Off 0 / 160 0 / 194 0 / 190 0/156

15
of 666mm is supplemented by 450mm of annual irrigation. The average evapotranspiration for Lincoln is
870mm/year. Table 6 provides additional climate information for the LUDF:
Table 6: Climate data for LUDF
Climate Mean annual maximum temperature 32oc
Mean annual minimum temperature 4oc
Average days of screen frost 36 days per annum Mean average bright sunshine Average annual rainfall
2040 hours per annum 666 mm
3.4.2 Proposed housing-incorporated systems
With the proposed change in the farming system, a housing structure will be built on farm, allowing the
cows to be removed from the pasture during ‘at-risk’ periods and fed a ration in the structure. The
consequential effluent from the cows will be collected in a new effluent facility, treated, and reapplied
onto the farm. Two potential housing structures have been designed for this purpose, a fully-enclosed,
720 cow free-stall ‘wintering barn’, and a similar structure, but roofless. The roofless housing structure
system has been considered due to the high capital cost of erecting a housing structure. By constructing
a structure without a roof, the construction cost will be reduced. The climate at the LUDF may allow a
roofless structure, due to low-rainfall, and a lack of extreme climatic events.
Both of these structures have a central feed lane, separating two identical arrangements of the free-
stalls with scraper lanes for the removal of effluent from the structure. Appendix A shows a blueprint of
a wintering barn, designed by a commercial company. The roofless structure will use the same building
blueprint as the fully-enclosed system, just with the roof removed, and an increased-capacity effluent
system due to additional rainfall that will need to be managed.
The incorporation of the housing system will change the overall farming system, including wintering all
cows on farm, greater supplementary feed fed to the cows, reduced fertiliser application and less
pasture/soil damage. With a system change of this magnitude, a number of assumptions have been
developed. These assumptions are detailed in section 3.5.
3.5 Assumptions
The proposed systems have been based on the current LUDF system, with appropriate adjustments
made to relevant aspects. This section will detail these assumptions, with section 3.5.1 outlining the
financial assumptions relevant to all three systems, section 3.5.2 showing present system assumptions,
and section 3.5.3 detailing the system changes in the proposed systems.

16
3.5.1 Financial assumptions
Milk price
In order to ensure an accurate comparison between the current and proposed systems, a $6.50/kgMS
milk payout figure was assumed for all systems as the long-term average milksolids payout. The
Fonterra dividend was assumed to be $0.32/share, as this was the 2012/13 dividend figure as well as an
accurate representation of a dividend accompanying a $6.50/kgMS payout.
Fertiliser costs
With the change in system, there is a reduction in fertiliser use. To evaluate the economic impact of this,
the market cost of urea and superphosphate were taken from the Ravensdown* price schedule. Prices
retrieved on 30/9/2014 were as follows:
Urea cost: $612 per tonne (Ravensdown, 2014b)
Super phosphate cost: $316 per tonne (Ravensdown, 2014a)
*Ravensdown is a fertiliser co-operative operating throughout New Zealand
Share price
As Fonterra requires one share per kg of milk solids supplied to the co-operative, the Fonterra share
price is a required assumption. This figure was taken from the NZX markets, where Fonterra’s shares are
listed as the ‘FSF’ (Fonterra Shareholders Fund). Retrieved on the 3/10/2014:
Fonterra Farmers Fund share value (listed as FSF on NZX): $6.38 (NZX, 2014)
It is assumed that this is the long term average share price in the investment appraisal, with no inflation
adjustment.
Depreciation rates
Table 7: Diminishing value depreciation rates for farm equipment (IRD, 2014b)
Depreciation rates were kept constant for all three scenarios, with all depreciation rates coming from
the Inland Revenue Department (IRD) standard diminishing depreciation rates (post 2006) as found on
the IRD website.
Depreciation rates
Machinery: 13%
Centre pivots 20%
Cowshed 6%
Housing structure 6%

17
Interest rates
An interest rate for interest-only loans was assumed based on current figures retrieved from the
Westpac New Zealand website:
Interest-only business loans 6% per annum (Westpac, 2014)
Cow cost
The IRD standard value for mixed aged dairy cattle was used. As the cow numbers do not change
between the different scenarios, this value is constant throughout the model:
Friesian (and related breeds) mixed age cows: $1963 (IRD, 2014c)
Supplementary feed costs
Grass silage is the only supplementary feed used in the current LUDF system. The proposed system will
have the addition of fodder beet into the diet to be fed in-shed, along with pasture silage:
Fodder beet (20%DM): $0.36/kgDM $72/tonne lifted/ delivered (Benton, personal
communication 2014; Lucas 2014)
Pasture silage (30%DM): $0.37/kgDM $110/bale (Ellesmere Agriculture Ltd, personal
communication 2014)
The pasture silage will be purchased locally, and the fodder beet will be produced on the Lincoln
University Ashley Dene farm, where the current LUDF wintering takes place, and sold to the dairy unit at
market rates. The fodder beet price consists of $0.26/kgDM as a market rate for the feed in situ, with an
extra $0.05/kgDM for the cost of lifting (and loss of leaf during the process) and $0.05/kgDM for
transport to the dairy platform.
Investment appraisal assumptions
Tax rate
The IRD has a standard tax rate on company profits, as outlined on their website:
IRD tax rate (for income years 2012 or later) 28% (IRD, 2014a)
Capital gain rate
The capital gain rate for appreciating assets in the model (land) was assumed by a conservative estimate
to be 2.0% per annum.
Income development
Income development is an assumption for the investment appraisal to estimate the annual increase of
produce prices received by the business. It was conservatively estimated at 1.0% per annum.

18
Inflation
The average inflation rate for the past 3 years, as determined by the Reserve Bank of New Zealand, was
used as an assumed inflation rate:
Inflation rate: 1.2% per annum (Reserve Bank of New Zealand, 2014)
3.5.2 Present system assumptions
Current asset values
The summary of the current LUDF assets valid to the housing-structure proposal are as follows:
Table 8: Current LUDF assets (Pellow, personal communication, 2014)
The value of the 186ha dairy platform of LUDF is valued at $50,000 per ha, as an assumption of the
current dairy land value. This is a relatively high value, but is consistent with recent farm sales in
Canterbury. The irrigation, plant, machinery and cowshed values are all estimates of current values from
the farm business manager (Pellow, personal communication, 2014). The livestock and share value are
outlined in section 3.5.1.
Current income
Table 9 shows the income for LUDF, which is listed on the SIDDC website (SIDDC, 2014). The information
from the 2012/13 season was used. Note that the milksolid revenue has been adjusted from a $6.12
payout (actual 2012/13 payout) to a $6.50 payout, to ensure an accurate comparison with proposed
systems. All other figures are actual figures from the 2012/13 season.
Dairy land 186 ha 50,000$ 9,300,000$
9,300,000$
350,000$
Milking shed 720,000$
1,070,000$
Plant and machinery
500,000$
500,000$
Dairy cows 650 1,963$ 1,275,950$
Total livestock value 1,275,950$
Fonterra shares 300,484 6.38$ 1,917,088$
Total share value 1,917,088$
14,063,038$
-$
-$
Including 100HP tractor, feed out wagon,
pasture mower and milking equipment
Current system assets
Total current assets
Current Liabilities
Bank loan
Total current liabilities
Total land value
Total plant and machinery value
Irrigation equipment
Total infrastructure value

19
Table 9: Income for the current system (Appendix D)
Current expenses
The LUDF farm working expenses in total and per kgMS are presented in Table 10 The only variance
from the published data was to the ‘Gibberellin’ category (denoted with an *) as this row previously
contained the cost of Eco-N applications, which have since been removed due to regulatory changes.
These were assumed to be $160/ha and applied uniformly across the farm, reducing the cost to an
approximate figure of the gibberellin.
Table 10: Farm working expenses for the current system (Appendix D)
3.5.3 Proposed system changes
The proposed systems will be heavily based on the current system, with adjustments made in identified
areas which would be affected by the introduction of a housing structure.
Income 2012 -13 per kgMS
Milksolid Payout $/kgMS 6.50$ -
Dividend /share 0.32$ -
Milksolid Revenue 1,953,146$ 6.50$
Dividend 96,000$ 0.32$
Surplus dairy stock 182,337$ 0.61$
Stock Purchases 25,740-$ 0.09-$
Gross Farm Revenue 2,205,743$ 7.34$
Farm working expenses 2012 -13 per kgMS
Replacement grazing & meal 163,852$ 0.55$
Winter grazing - incl. freight 137,904$ 0.46$
Feed Grass silage purchased 93,492$ 0.31$
Fodder beet purchased -$ -$
Silage making & delivery 9,087$ 0.03$
Gibberellin* 30,000$ 0.10$
Nitrogen 112,973$ 0.38$
Fertiliser & Lime 33,288$ 0.11$
Irrigation - All Costs 55,471$ 0.18$
Re-grassing 14,790$ 0.05$
Staff Employment 217,865$ 0.73$
Land Electricity-farm 27,049$ 0.09$
Administration 21,528$ 0.07$
Freight & Cartage 89$ 0.00$
Rates & Insurance 21,020$ 0.07$
Repairs & Maintenance 61,766$ 0.21$
Shed Expenses excl power 7,560$ 0.03$
Vehicle Expenses 34,922$ 0.12$
Weed & Pest 1,340$ 0.00$
Cash Farm Working Expenses 1,156,526$ 3.85$

20
Assumed system details for both the current and proposed systems are outlined in Table 11. The land
area, both effective and total have remained constant across all three systems, while the effluent area
on both the proposed systems has been expanded to accommodate the extra effluent collected from
the housing structure. Cow numbers, both wintered and peak, and stocking rate have been kept
constant to allow a fair comparison, as has the breed of the cows – the proposed system would use the
same cows as currently on farm. The average liveweight of cows has been increased to 500kg, as in the
proposed systems there will be less walking requirements and ability to put on weight more easily.
Rainfall level will be the same. Detailed system changes are found in Appendix C.
Table 11: Assumed system detail changes for proposed systems
Cost of housing structure and effluent system
In order to ensure figures are as realistic as possible, a commercial firm was consulted. The firm
provided a quote for the construction of 2 potential housing structures – a fully enclosed 720 cow
freestall barn and a similar 720 cow structure without a roof (design is outlined in Appendix A).
Table 12: Costings of housing and effluent structures (Green, personal communication, 2014; Lotter, personal communication, 2014)
These structures have two mirrored rows of free-stalls with rubber bedding for the cows to rest on, and
‘scraper lanes’ in-between the rows to remove the effluent. These bedding areas are then separated by
a central feed lane, which is wide enough for a tractor and feed-out wagon to drive down and feed the
Current Housed System Roofless System
Effective area (Dairy platform, ha) 160.1 160.1 160.1
Total area (ha) 186.0 186.0 186.0
Effluent area (ha) 34 128 128
1st July cow numbers 650 650 650
Peak cows milked 630 630 630
Stocking rate 3.94 3.94 3.94
Breed Crossbred Crossbred Crossbred
Liveweight (kg) 477 500 500
Rainfall (mm) 666 666 666
Fully enclosed housing structure:
2,300,000$
Effluent system 90,500$
Total cost 2,390,500$
Cost/cow 3,678$
Roofless housing structure:
1,400,000$
Effluent system 129,500$
Total cost 1,529,500$
Cost/cow 2,353$

21
cows. Cows are free to lie down, walk around, eat or socialise with other cows. The areas of the shed
can be sectioned off with subdividing gates, in order to keep different groups of cows separate, such as
dry cows, mixed aged cows and heifer mobs.
These structures then require an effluent storage facility, the price of which was quoted by another firm
involved in effluent systems (Lotter, personal communication, 2014). This system was based on the
calculated amount of effluent to be collected from the housing structure. This effluent figure was
determined with the use of the dairy effluent storage calculator (DESC, Massey University (2013)). The
fully housed system will require a 250m3 effluent pond, while the roofless structure required a larger
750m3 facility. This is to allow storage for 12 months to ensure the effluent can be applied at the correct
times. The breakdown of these costs and the summary of the DESC can be seen in Appendix J.
The increasing volume of effluent collected from the housing structure will then be stored, and
reapplied to the dairy platform as fertiliser during the season. This has resulted in the effluent area
increasing from 34ha to 128ha.
Cost of other equipment
The addition of the housing structure will change the whole farm system, requiring extra equipment to
allow the system to run:
New tractor
The farm is currently set up with infrastructure and machinery that can also be used in a housing-
incorporated system. The only additional equipment required is an extra tractor, for general farm work
while the main tractor is used for feeding in the housing structure:
Additional loader tractor: $100,000 (Pellow, personal communication, 2014)
Details on funds required for development
With the addition of extra capital expenditure, there is a requirement to cover these costs with a bank
loan. This is the cumulative value of the new housing structure, new Fonterra shares and the additional
tractor. The breakdown of debt servicing can be found in Appendix G.
Table 13: Institutional loan value for the proposed systems (Appendix B)
New loan (housed):
2,703,694$
6% per annum (Interest only)
New loan (roofless):
1,802,500$
6% per annum (Interest only)

22
Altered feeding levels
The proposed systems will involve changing the levels of supplementary feed available to cows at
certain times of year. All supplementary feed will now be fed in the housing structure, unlike in the
current system which feeds supplement in the paddock. The main change is the movement from
‘wintering off-farm’ to ‘wintering on-farm’ (in the housing structure) and the inclusion of fodder beet in
the diet, to be fed in-shed in a ration with pasture silage. The costing of the feed are detailed in section
3.5.1.
Table 14: Supplementary feed assumptions for proposed systems (Appendix H)
Ration composition
The ration fed in shed is a 60:40 mix of fodder beet and pasture silage. This ration allows sufficient
energy to be eaten by cows without the risk of metabolic issues that arise from a diet of only fodder
beet. Fodder beet and grass silage are two cheap sources of feed that are easily accessible locally for the
LUDF, and can be fed out in-shed with the existing machinery. Palm Kernel Extract (PKE) was not
considered as a potential feed source, due to an existing LUDF policy.
Utilisation
With the ration being fed in-shed (on the central feed lane), there will be a relatively high level of
utilisation assumed. The fully enclosed system will have slightly higher utilisation than the roofless
structure, due to better shelter from wind and rain preserving the feed. The assumed utilisation figures
were:
Fully enclosed housing structure utilisation 95%
Roofless housing structure utilisation 92%
Feeding levels
The amount of feed fed in the sheds was determined as a percentage of total diet per cow for each
corresponding month of the year. As the cows are being wintered inside the structure, the values for
Wintering barn feed
Feed cost: DM % $/kgDM Portion of ration
Fodderbeet ($/tonne, lifted
and delivered)$72 20% 0.36$ 60%
Pasture silage ($/bale) $110 30% 0.37$ 40%Feed
utilisation95%
Roofless barn feed
Feed cost: DM % $/kgDM Portion of ration
Fodderbeet ($/tonne) $72 20% 0.36$ 60%
Pasture silage ($/bale) $110 30% 0.37$ 40%Feed
utilisation92%

23
June and July are 100% of feeding in shed. The cows are fed a portion of their ration during late lactation
and calving (in August) in the shed. The percentages of feeding in-shed were based on Journeaux’s
(2013) model and modified with assistance from LUDF management. The level of total cow intake was
determined by LUDF management:
Table 15: Monthly feeding levels in the proposed systems (Journeaux, 2013; Pellow, personal communication, 2014)
Note: these figures do not directly correspond to the amount of time spent in the shed; generally the
time spent in the shed will be greater than the percentage shown in order to collect greater volumes of
effluent.
Changes in production
There is an assumed increase in cow milksolid production, due to an increased rate of total feed
supplied (supplement feeding and total pasture production), less energy used on maintenance and more
days in milk. Production has been assumed to be 530kgMS/cow in the fully enclosed system, with the
roofless system slightly lower at 520kgMS/cow (Table 16). This per cow increase has also resulted in a
milksolids/ha increase, as well as a total production increase.
The lactation length has been extended on both proposed systems as the use of the housing structure
allows cows to be milked for longer as the barn is adjacent to the milking shed, and cows are able to be
easily milked through the barn into the wintering period. This results in lactation length increasing to
305 and 300 days for the housed and roofless systems, pushing the final dry off date to the 1st of July
and 20th of June respectively (from the 20th of May). This is only for a select percentage of late calving
and high producing cows, with the average dry-off date being approximately 31st of May. The income for
these cows during May was assumed to be 1.7kgMS/day, with additional costs of 5kg of feed at
40c/kgDM, and $3.00 extra of fixed costs. This resulted in a daily profit per cow of $6.05. June assumed
the same costs, with a reduced average production of 1.4kgMS/day for a daily profit per cow of $4.10.
Further details of extended lactation are outlined in Appendix I. No winter milk premium is assumed.
Calving date and body condition score (BCS) at calving will remain the same. The latter has been kept
constant under recommendation from farm management (Pellow, personal communication, 2014), as
Time in barn
Percentage
feeding in-shed
Feeding level
(kgDM/day)
March 20% 17
April 20% 17
May 30% 15
June 100% 10
July 100% 10
August 30% 15

24
5.1 is the desired BCS at calving for the LUDF. Although previous literature by Journeaux (2013) suggest
that housing structures allow for greater condition gain over the wintering period, it is assumed that
rather than increase the BCS of cows at calving, feed levels will be structured so they only reach the
desired condition. This is the reason for the lack of condition gain shown in Appendix I.
The income from surplus dairy stock will also increase. There is an assumed reduction in replacement
rate (from 21% to 18%) due to greater longevity of cows in the herd. This allows more replacement
heifers to be sold as surplus stock, which is outlined in Appendix I. This is based on recommendations by
Journeaux (2013) and Pellow (personal communication, 2014).
Table 16: Production assumptions for current and proposed systems (Appendix C)
Also, with the purchase of extra Fonterra shares, there will be an increased dividend income in the
proposed systems. These are equivalent to the additional shares purchased multiplied by the set
dividend payout ($0.32).
Breeding expenses
There will be a slight reduction in breeding expenses, due to the improvement of cow condition allowing
for improved fertility.
Fertiliser and Lime
With the increased volume of effluent being collected from the cows during the season/winter, and the
ability to reapply this effluent as fertiliser during the growing period, there is a reduction of fertiliser
required to be applied in the form of Urea and Superphosphate. The reduction in N fertiliser has been
assumed at 200kgN/ha (Pellow, personal communication, 2014) from 350kgN/ha to 150kgN/ha, and
500kg of superphosphate/ha, as assumed by Journeaux (2013). These changes are outlined in Appendix
I. In order to maintain a suitable soil pH, an annual lime application has been assumed at 1 tonne/ha.
Extra labour
With the cows now being wintered on farm, and fed higher rates of supplements in the housing
structure, there is an increased labour requirement through the year. This is outlined in Appendix H:
Additional staff requirement: $21,000 (Pellow, personal communication, 2014)
12/13 Housed System Roofless System
kgMS/cow 477 530 520
Lactation length (days) 273 305 300
Replacement rate 21% 18% 18%
BCS at PSC 5.1 5.1 5.1
Planned start of calving 3-Aug 3-Aug 3-Aug
Dry-off date 20-May 1-Jul 20-Jun

25
Electricity
With an increased lactation length, the milking shed will be in use for longer during the year. Also, the
housing structures will require power to operate lighting, water and the effluent system. Both of these
factors will increase the electricity requirement of the systems, and the electricity cost has been
adjusted accordingly. The housed system will have higher electricity costs than the roofless system, due
to an increased requirement for lighting and ventilation.
Rates & insurance
With the addition of extra capital in the proposed systems, there will be an increase in rates and
insurance. The cost of these for both proposed systems have been increased.
Repairs and Maintenance
The added housing structures will require regular repairs and maintenance (R&M), as they will
experience regular wear-and-tear from cow traffic and environmental factors. The assumed cost of R&M
in year 1 is 0.5% of the initial capital cost of each of the structures, increasing by 0.3% (for the fully-
enclosed structure) and 0.5% (for the roofless structure) annually, until year 11 when it remains
constant (at 3.2% for the housed system, and 5% for the roofless system). These figures were derived
from Journeaux (2013). The reason for differing R&M rates is because of the assumption that the fully
enclosed shed will have less wear-and-tear from the environment, as it is more sheltered from rain,
wind, hail and other weather-related damage. The full cost of housing structure R&M is outlined in
Appendix H.
Shed expenses
As stated in ‘electricity’, there will be greater use of the milking shed in the proposed systems. To
account for this, there was a small increase in milking shed expenses for the roofless system, with a
slightly larger increase for the housed system.
Vehicle expenses
With the incorporation of a housing structure, there is a time requirement for feeding out with the
tractor and feed-out wagon during the months that the structure is in use. This time has been valued at
$42 an hour to cover the cost of diesel, repairs and maintenance as well as insurance:
Tractor fuel 100HP tractor @ 75% 21 litres/hr $30 (Trafford & Trafford, 2011)
Tractor R&M and insurance (average per hr) $12 (Pellow, personal communication,
2014)
Table 17 details the time spent feeding out per day, determined by the amount of the total diet being
fed daily; 20% of the diet was fed out in 30 minutes, 30% took an hour, and 100% took 2 hours of tractor

26
work daily. These were totalled to calculate the tractor hours per month, and then a total value of
tractor hours attributable to the housing structure was calculated.
Table 17: Summary of extra tractor costs in the proposed systems
Cost of additional shares
With increasing milk production, there is a requirement for extra shares in order to supply Fonterra:
Fully enclosed housing structure 33,416 shares: $213,194
Roofless housing structure 27,116 shares: $173,000
3.6 Methods summary
This Chapter has outlined the research methods for this project and detailed the similar assumptions for
modelling as well as the differences between the ‘as is’ scenario and the proposed changes. Chapter 4
will present the findings of the Overseer® based environmental analysis, and Chapter 5 provides details
of the economic results.
Extra tractor costs hrs/day hrs/month
March 0.5 15.5
April 0.5 15.0
May 1.0 31.0
June 2.0 60.0
July 2.0 62.0
August 1.0 31.0
TOTAL: 214.5 hours
Operating costs (fuel/R&M/insurance) 42$
Additional tractor cost: 9,009$

27
Chapter 4:
Environmental Analysis
This chapter will address research question 3: “How will the proposed system compare to the current
system on an environmental basis?” Section 4.1 contains the assumptions made for the Overseer®
analysis of the three systems, while section 4.2 details the resulting Overseer ® output.
Overseer results are a guideline, and have a large margin of error (+/- 30%). As Overseer versions
update, the N leached figure often changes. This should be considered when reading the
environmental results of this study.
4.1 Changes in Overseer® assumptions by system
In order to model the environmental impact of the proposed systems, a number of assumptions were
made for the Overseer® inputs in order to make the model as realistic as possible. The current system
was modelled with actual data from the 2012-13 season, with figures supplied by Pellow (personal
communication, 2014) and Glass (2013). The proposed systems were modelled from this base data, with
adjustments made where changes occurred. This section will identify the adaptations to the overseer
model.
Table 18 details the differences in the farm scenario assumptions for the three systems. The defined
effluent blocks have been changed from the current system, with greater areas of certain soil types now
in the effluent area. The Wakanui soil area expanded from 4.3ha to 48.1ha, Eyre from 3.0ha to 8.0ha,
and Templeton from 26.7ha to 72.0ha. The non-effluent Temuka block has remained the same size
(32.0ha), as have the blocks in trees.
The major change is the inclusion of the housing structure. In the Overseer® model, the two proposed
systems have the ‘wintering pad, animal shelter or housing’ option selected, and the destination of all
supplements is set to be ‘fed in these structures’. The volumes of pasture silage, fodder beet and total
supplement have all been increased from the current system to reflect system changes.

28
Table 18: Farm scenario differences in Overseer® assumptions for current and proposed systems
Table 19 shows assumptions of the dairy enterprise for the three systems. On-farm cow numbers
increase in the proposed systems, with the range growing from 26-630 to 610-650 due to the movement
of cow wintering from off-farm to on-farm. Replacement rate of the herd was reduced from 21% to
18%, and milksolid production and lactation length was increased to reflect the assumptions in section
3.5.3.
Table 19: Dairy enterprise differences in Overseer® assumptions for current and proposed systems
Table 20 details the assumptions with regards to the housing structures. The ‘housed’ system assumes a
covered wintering pad or animal shelter, with no bunker lining material and it is scraped clean with no
water. Liquid effluent is collected and stored in a holding pond, which is sprayed onto selected blocks
regularly. Solid effluent is spread on the ‘non-effluent Temuka’ block in January and again in February.
The roofless system assumes an ‘uncovered wintering pad, with an inert bedding pad, which is lined,
subsurface drained with the effluent captured, and the surface regularly scraped’. Liquid effluent is
collected and stored in a holding pond, which is then sprayed frequently onto selected blocks. The
scraped solids are stored for up to 12 months under cover and then spread onto the ‘non-effluent
Temuka’ block in January and February.
Farm Scenario Current Housed Roofless
Blocks (ha) Effluent Wakanui 4.3 48.1 48.1
Effluent Eyre 3.0 8.0 8.0
Effluent Templeton 26.7 72.0 72.0
Non-Effluent Temuka 32.0 32.0 32.0
Non-Effluent Wakanui 43.8 - -
Non-Effluent Eyre 5.0 - -
Non-Effluent Templeton 45.3 - -
Trees - Templeton 1.0 1.0 1.0
Trees - Wakanui 1.0 1.0 1.0
Structures -
'Wintering pad, animal
shelter or housing'
'Wintering pad, animal
shelter or housing'
Supplements
Purchased, good quality pasture
silage (tDM) 273 296 300
Destination Dairy on blocks 'Fully enclosed housing' 'Roofless housing'
Purchased, custom supplement,
fodder beet (tDM) - 449 458
Destination - 'Fully enclosed housing' 'Roofless housing'
Total dry weight 273 745 758
Enterprises - Dairy Current Housed Roofless
Numbers Specific monthly stock nos. Range from 26-630 Range from 610-650 Range from 610-650
Replacement rate 21% 18% 18%
Production Milk solids 300484 330900 327600
Lactation length 273 305 300

29
Both systems assume similar time spent on the pad, with 20% of feed in March and April, 30% in May
and August, and 100% in June and July as in line with the system assumptions in section 3.5.3.
Note: as roofless free-stall structures are not common, they are not set as default in Overseer®. A
structure (roofless feed pad) which would serve a similar purpose was used with the available Overseer®
defaults.
Table 20: Structure Overseer assumptions for proposed systems
The application rates of both fertiliser and effluent are changed in the proposed system, from
288kgN/ha (on the effluent blocks) to 150kgN/ha, and from 368kgN/ha (on the non-effluent blocks) to
280kgN/ha for both proposed systems. This coincides with an increase in liquid effluent applied to the
effluent blocks, as liquid effluent will be applied from both the milking shed and the housing structure.
The pond is emptied annually, allowing for solids from the housing structure to be removed and applied
to the non-effluent block in January and February.
Table 21: Nitrogen fertiliser and effluent assumptions for current and proposed systems
4.2 Overseer® results
The primary output of the Overseer® results is the ‘nutrients removed’ figures, in particular the losses of
Nitrogen (N) to water.
Structures Housed Roofless
Pad type
Covered wintering pad or animal
shelter Uncovered wintering pad
Bunker management No lining material -
Cleaning by scraping (no water) -
Bedding pad -
Inert, lined, subsurface drained
and effluent captured
- Surface scraped regularly
Solid effluent - Spread on selected blocks
- Stored under cover
- 12 months storage
Liquid Effluent Holding pond - spray regularly Holding pond - spray regularly
Solids spread on selected blocks Solids spread on selected blocks
Time spent on pad 20% in March and April, 30% in May and August, 100% in June and July
Blocks Current Housed Roofless
Fertiliser Effluent blocks 288kgN/ha 150kgN/ha 150kgN/ha
Non-effluent blocks 368kgN/ha 280kgN/ha 280kgN/ha
Effluent Effluent blocks Liquid effluent Liquid effluent Liquid effluent
Non-effluent blocks - Solid app - Jan & Feb Solid app - Jan & Feb

30
4.2.1 Current system
Table 22 shows the nutrient outputs from the current system annually. 138kgN/ha is removed as
products, 164kgN/ha is removed to the atmosphere, and 39kgN/ha is lost to water annually. The latter is
the most important comparative figure of the Overseer® reports to be analysed in Chapter 6.
Table 22: Nutrients removed summary for the current system
This results in a total N loss annually of 6542kg N over the dairy platform.
4.2.2 Housed system
Table 23 details the nutrient removal of the proposed housed system. It shows an increase in N
removed as products (to 149kgN/ha) and to atmosphere (164kgN/ha), but a reduction in the N lost to
water figure of 38% to 24kgN/ha.
Table 23: Nutrients removed summary for the proposed housed system
This results in a total N loss annually of 4067kg N over the dairy platform, a reduction of 2475kg N.
4.2.3 Roofless system
Table 24 details the nutrient removal of the proposed roofless system. It shows an increase in N
removed as products (to 146kgN/ha) and to atmosphere (161kgN/ha) compared to the current system,
but a reduction in the N lost to water figure of 38% to 24kgN/ha.

31
Table 24: Nutrients removed summary for the proposed roofless system
This results in a total N loss annually of 3931kg N over the dairy platform, a reduction of 2604kg N.

32
Chapter 5:
Economic Analysis
5.1 Introduction
The economic analysis undertaken in this chapter compares the current system run at the LUDF (in
2012/13) and models two separate systems utilising housing structures. All analysis was undertaken on
Microsoft ExcelTM, and identified system assumptions, an annual budget of expenses and income and a
12 year investment appraisal (including depreciation and loan schedules). The assumed financial
benefits and costs of a housed wintering system will be identified.
5.2 System details
Table 25 shows herd details for the current and two proposed systems. Total milk solid production has
increased in the two proposed systems, which results in an increase per hectare and per kg of liveweight
of 11% for the housed system and 9% for the roofless system, across all figures. The replacement rate
has dropped in both proposed systems by 3% below the current system (detailed in Appendix I).
The supplementary feed has been split into wintering feed, and lactation supplements, for an accurate
comparison between the current and proposed systems. Note that the current system involves
wintering on Lincoln University’s Ashley Dene farm, while the proposed system has feed fed in-shed.
They are both considered imported feed for this comparison.
The total amount of winter feed required has dropped by approximately 26%, from 535 tonnes/DM to
421 and 426 tonnes/DM respectively. In contrast, the volume of lactation supplement has increased by
51 and 60 tonnes, or an increase of 80kg/cow and 95kg/cow respectively. This has consisted of a
reduction in pasture silage fed during lactation, but has been replaced with the addition of fodder beet
as a lactation supplement. The resultant total volumes of feed show a slight reduction in supplements in
the proposed systems, of 10kg/cow (housed) and 8kg/cow (roofless) or 64 tonnes and 50 tonnes. A
summary of supplementary feed volumes is detailed in Table 26. There has also been an increase in
pasture consumed, with a per hectare increase of 4% (Appendix I) from 16.8 tDM/ha to 17.5tDM/ha due
to a decrease in pugging resulting in less wastage of pasture and improved spring growth (Hockings,
2012). This was reflected in a 190kg increase in pasture-eaten per cow.
In terms of overall feed supplied (summation of both home-grown and supplementary feed), there was
a small increase in feed supplied in both the proposed systems of under 2%.

33
Table 25: Summary of assumptions for current and proposed systems (see Appendix C)
5.2.1 Total supplementary feed volumes
The assumed ration mix, utilisation, feeding levels and percentage of diet fed in-shed gives the total
supplementary feed volumes required annually, shown in Table 26. Both proposed systems show a
reduction in wintering supplement purchased, an increase in purchased lactation supplement, and a
reduction in total supplement (both overall and per cow)
Current Housed System Roofless System
Total MS production 300,484 333,900 327,600
Replacement rate 21% 18% 18%
kgMS/ha 1,877 2086 2046
kgMS/kg liveweight 1.00 1.06 1.04
% imported feed 21% 19% 19%
Wintering
Fodder beet (tDM) - 255 259
Pasture silage (tDM) - 167 167
Total wintering feed (tDM) 535 422 426
Lactation supplements
Fodder beet (tDM) - 195 200
Pasture silage (tDM) 273 129 133
Imported supplement tonnes/cow 0.43 0.51 0.53
Total imported lactation supplement (tDM) 273 324 333
Total Supplements
Fodder beet (tDM) - 449 458
Pasture silage (tDM) - 296 300
Current total imported feed (tDM) 809 745 758
Total imported feed (tonnes/cow) 1.28 1.18 1.20
Current home-grown feed eaten tDM/cow 4.81 5.00 5.00
Current home-grown feed eaten tDM/ha 16.8 17.5 17.5
Total feed tDM/cow 6.09 6.18 6.20
Total feed (tDM) 3,498 3,543 3,556

34
Table 26: Supplementary feed consolidation for current and proposed systems
5.2.2 Comparison of farm working expenses
The inclusion of a housing structure influences the whole farm system, and Table 27 shows the changes
to farm working expenses (FWE), and their cost per kg of milksolid, in the proposed systems compared
to the current system. Some of the expenses remained constant (such as animal health, replacement
expenses, silage making, gibberellin, irrigation, re-grassing, administration, freight and weed & pest)
while many were modified for the proposed system.
There was a reduction in breeding expenses, from $51,644 in the current system to $45,000 in the
housed system and $47,000 in the roofless. These financial benefits can be found in Appendix I. Winter
grazing costs in the current system are removed, but replaced by a significant increase in pasture silage
and fodder beet expenses. The current system has no fodder beet expenses. Supplementary feed
consolidations are detailed in Appendix H.
Nitrogen fertiliser costs reduced from $112,973 to $31,950 in both proposed systems. Other
fertiliser/lime costs were reduced from $33,288 to $15,992, employment costs increased by $21,000,
and electricity increased to $40,000 in the housed system and $35,000 in the roofless system. Rates and
insurance increased to $25,000 in the proposed systems, while repairs and maintenance increased to
$105,990 in the housed system, and $103,827 in the roofless system. Shed expenses increased to $8500
in the housed system and $8000 in the roofless system, while vehicle expenses increased by $9009 in
both proposed systems.
Current system (12/13)
Purchased supplement per cow
Wintering 823 x650 535 tonnes
Purch supp 434 x630 273 tonnes
808 tonnes
1,257 kg/cow
Proposed housed system
Purchased supplement per cow
Wintering 648 x650 421 tonnes
Purch supp 514 x630 324 tonnes
745 tonnes
1,163 kg/cow
Proposed roofless system
Purchased supplement per cow
Wintering 655 x650 426 tonnes
Purch supp 529 x630 333 tonnes
759 tonnes
1,184 kg/cow

35
Table 27: Comparison of farm working expenses for current and proposed systems (Appendix D)
5.2.3 Annual budgets
This section provides a summary of the annual budgets for the three systems, with calculations such as:
Table 28: Definitions of annual budget KPI's
Gross Farm Revenue (GFR) The summation of all farm income streams
Farm Working Expenses (FWE) The expenses attributable to on-farm production
FWE/kgMS Cost of FWE per kg of milksolids produced
Depreciation Estimate of the lost value of depreciating assets held by the farm
Total Operating Expenses The sum of FWE and depreciation
Dairy Operating Profit (DOP) GFR minus Total Operating Expenses – effectively the annual
book surplus for the dairy enterprise
DOP/ha DOP per effective hectare of land on the dairy platform
Cash Operating Surplus (or Earnings
Before Interest and Tax – EBIT)
The sum of all cash operations on the farm for the year before
debt servicing and tax, or the GFR minus the FWE.
Currentper kgMS
Housed
System per kgMS
Roofless
System per kgMS
Cow Costs Animal Health 60,886$ 0.20$ 60,886$ 0.18$ 60,886$ 0.19$
Breeding Expenses 51,644$ 0.17$ 45,000$ 0.13$ 47,000$ 0.14$
Replacement grazing & meal 163,852$ 0.55$ 163,852$ 0.49$ 163,852$ 0.50$
Winter grazing - Herd incl. freight 137,904$ 0.46$ -$ -$ -$ -$
Feed Grass silage purchased 93,492$ 0.31$ 108,523$ 0.33$ 110,117$ 0.34$
Fodder beet purchased -$ -$ 161,789$ 0.48$ 165,036$ 0.50$
Silage making & delivery 9,087$ 0.03$ 9,087$ 0.03$ 9,087$ 0.03$
Gibberellin* 30,000$ 0.10$ 30,000$ 0.09$ 30,000$ 0.09$
Nitrogen 112,973$ 0.38$ 31,950$ 0.10$ 31,950$ 0.10$
Fertiliser & Lime 33,288$ 0.11$ 15,992$ 0.05$ 15,992$ 0.05$
Irrigation - All Costs 55,471$ 0.18$ 55,471$ 0.17$ 55,471$ 0.17$
Re-grassing 14,790$ 0.05$ 14,790$ 0.04$ 14,790$ 0.05$
Staff Employment 217,865$ 0.73$ 238,865$ 0.72$ 238,865$ 0.73$
Land Electricity-farm 27,049$ 0.09$ 40,000$ 0.12$ 32,000$ 0.10$
Administration 21,528$ 0.07$ 21,528$ 0.06$ 21,528$ 0.07$
Freight & Cartage 89$ 0.00$ 89$ 0.00$ 89$ 0.00$
Rates & Insurance 21,020$ 0.07$ 25,000$ 0.07$ 25,000$ 0.08$
Repairs & Maintenance 61,766$ 0.21$ 105,990$ 0.32$ 103,827$ 0.32$
Shed Expenses ex. power 7,560$ 0.03$ 8,500$ 0.03$ 8,000$ 0.02$
Vehicle Expenses 34,922$ 0.12$ 43,931$ 0.13$ 43,931$ 0.13$
Weed & Pest 1,340$ 0.00$ 1,340$ 0.00$ 1,340$ 0.00$
Cash Farm Working Expenses 1,156,526$ 3.85$ 1,182,584$ 3.54$ 1,178,762$ 3.60$
Farm Working Expenses

36
Table 29 shows the comparison of the three systems’ annual budget. The gross farm revenue increases
for the two proposed systems, and the overall farm working expenses (FWE) for the two proposed
systems are slightly higher than the current system, but still very similar. This results in a drop in the
FWE/kgMS figure. There is a large increase in depreciation, due to the new purchased infrastructure
having a high value, with the housed system much higher than both the current system and the roofless
system. Because of the increased depreciation, total operating expenses for both proposed systems
increased to be higher than the current system (20% and 15% respectively). This resulted in the dairy
operating profits (DOP) of all three systems to be similar, with the roofless system having the highest
profit, followed by the current system then the housed. This corresponded to a DOP/ha increase of
$56/ha in the roofless system, and a decrease of $23/ha in the housed system. The full annual budget is
detailed in Appendix D.
Table 29: Summary of annual budget (Appendix D)
5.3 Proposed economic values of the benefits of incorporating structures (Appendix I)
Table 30 contains the proposed system benefits attributable to the housing structure for both the
housed and roofless systems. This table shows approximate figures directly attributable to the addition
of the housing structure. Both systems have a reduction to grazing fees of $137,904, an increased dry
matter production to the value of $58,276, and an increase in milk income in May worth $48,025. They
also both have an increase in excess stock to the value of $24,063 and a reduction in fertiliser worth
$67,896. The housed system also has an increase in milk production in June worth $14,465, a reduction
in breeding expenses valued at $6,644 and an additional increase in milk production worth $96,438, for
a total benefit attributable to the wintering shed worth $453,711. The roofless system does not have an
increased milk production in June, but has a reduction in breeding expenses worth $4,644 and a total
additional milk production increase of $69,953 for a total benefit of $410,761. Neither system had any
financial benefit from improved cow condition.
Current Housed System Roofless System
Gross Farm Revenue 2,205,743$ 2,457,858$ 2,414,892$
Cash Farm Working Expenses 1,156,526$ 1,182,584$ 1,178,762$
FWE/kgMS 3.85$ 3.54$ 3.60$
Depreciation est. 105,000$ 334,630$ 282,970$
Total Operating Expenses 1,261,526$ 1,517,214$ 1,461,732$
Dairy Operating Profit (DOP) 944,217$ 940,644$ 953,160$
DOP/ha 5,898$ 5,875$ 5,954$
Cash Operating Surplus (or EBIT) 1,049,217$ 1,275,274$ 1,236,130$

37
Table 30: Summary of wintering structure benefits
5.4 Proposed economic values of the costs of incorporating structures (Appendix H)
Table 31 shows the proposed additional costs directly attributable to the addition of a housing structure
for the housed and roofless systems. The purchase of supplementary fodder beet increased costs by
$161,789 for the housed system and $165,036 for the roofless system, and additional pasture silage
purchases cost $15,031 for the housed system, and $16,625 for the roofless system. Extra labour in both
proposed systems was valued at $21,000, and additional tractor hours were valued at $9009. R&M on
the housing structures was $44,224 for the housed and $42,061 for the roofless system, and other costs
amounted to $17,871 for the housed, and $9371 for the roofless system.
Table 31: Summary of wintering structure costs
5.5 Investment apprasial
The purpose of the investment appraisal is to identify the financial viability of the current and proposed
farming enterprises over a 12 year period. This will be achieved by determining internal rates of return
(IRR) and net present values (NPV) of the system at selected discount rates. Discount rates are
Wintering structure benefits Housed Roofless
Saved grazing fees 137,904$ 137,904$
Increased DM production 58,276$ 58,276$
Increased milking period (May) 48,025$ 48,025$
Increased milking period (June) 14,465$ -$
Improved cow condition - -
Reduced dry/empty cows 24,063$ 24,063$
Saved urea costs 42,601$ 42,601$
Saved superphosphate costs 25,296$ 25,296$
Reduced breeding expenses 6,644$ 4,644$
Increased overall milk production 96,438$ 69,953$
Financial benefits attributable to
the housing structure 453,711$ 410,761$
Annual value
Wintering structure costs Housed Roofless
Fodder beet cost 161,789$ 165,036$
Pasture silage cost 15,031$ 16,625$
Increased labour 21,000$ 21,000$
Tractor cost 9,009$ 9,009$
Increased R&M 44,224$ 42,061$
Other costs 17,871$ 9,371$
Financial costs attributable to the
housing structure 268,925$ 263,102$
Annual value
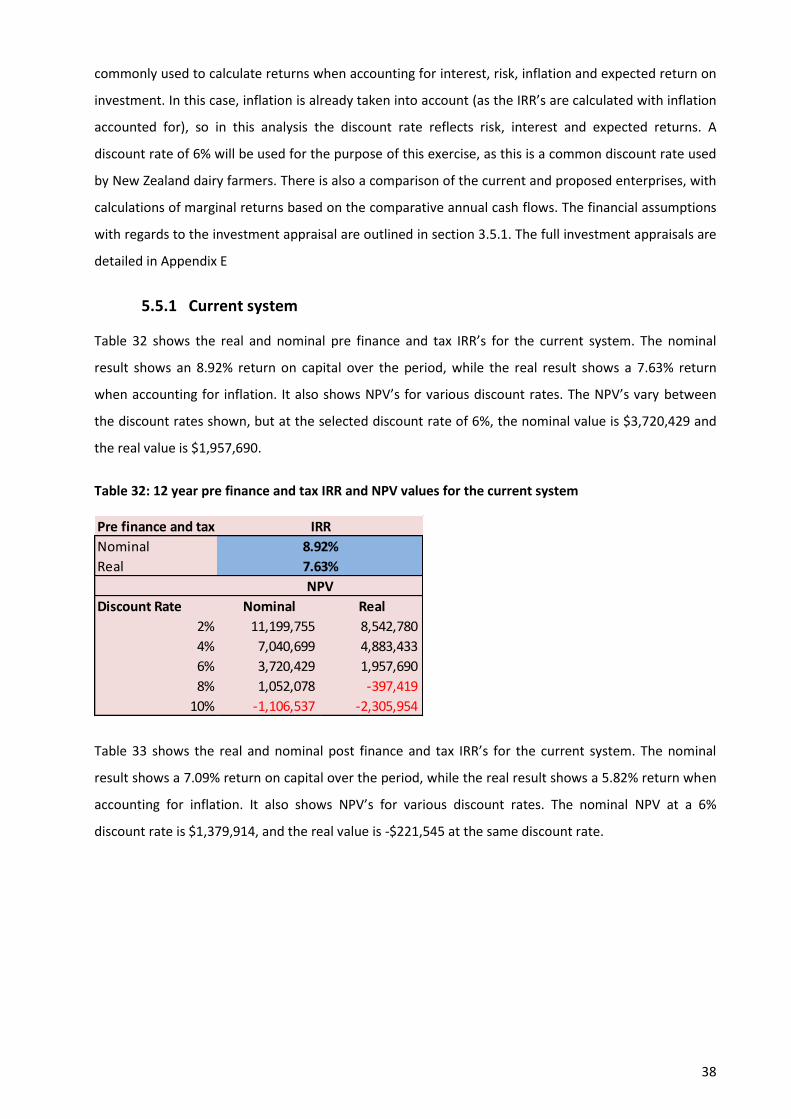
38
commonly used to calculate returns when accounting for interest, risk, inflation and expected return on
investment. In this case, inflation is already taken into account (as the IRR’s are calculated with inflation
accounted for), so in this analysis the discount rate reflects risk, interest and expected returns. A
discount rate of 6% will be used for the purpose of this exercise, as this is a common discount rate used
by New Zealand dairy farmers. There is also a comparison of the current and proposed enterprises, with
calculations of marginal returns based on the comparative annual cash flows. The financial assumptions
with regards to the investment appraisal are outlined in section 3.5.1. The full investment appraisals are
detailed in Appendix E
5.5.1 Current system
Table 32 shows the real and nominal pre finance and tax IRR’s for the current system. The nominal
result shows an 8.92% return on capital over the period, while the real result shows a 7.63% return
when accounting for inflation. It also shows NPV’s for various discount rates. The NPV’s vary between
the discount rates shown, but at the selected discount rate of 6%, the nominal value is $3,720,429 and
the real value is $1,957,690.
Table 32: 12 year pre finance and tax IRR and NPV values for the current system
Table 33 shows the real and nominal post finance and tax IRR’s for the current system. The nominal
result shows a 7.09% return on capital over the period, while the real result shows a 5.82% return when
accounting for inflation. It also shows NPV’s for various discount rates. The nominal NPV at a 6%
discount rate is $1,379,914, and the real value is -$221,545 at the same discount rate.
Pre finance and tax
Nominal
Real
Discount Rate Nominal Real
2% 11,199,755 8,542,780
4% 7,040,699 4,883,433
6% 3,720,429 1,957,690
8% 1,052,078 -397,419
10% -1,106,537 -2,305,954
8.92%
7.63%
IRR
NPV

39
Table 33: 12 year post finance and tax IRR and NPV values for the current system
The current system has a closing real asset value of $15,689,470 (when accounting for inflation), and
when the cumulative annual cash flow is added, the nominal closing balance is $27,109,951. This is in
comparison to the opening asset value of $14,063,038.
5.5.2 Housed system
Table 34 shows the real and nominal pre finance and tax IRR’s for the proposed housing-incorporated
system. The nominal IRR is 8.53%, while the real is 7.24%. Nominal NPV is $3,703,894, while real NPV is
$1,715,017 at a discount rate of 6%:
Table 34: 12 year pre finance and tax IRR and NPV values for the housed system
Table 35 shows the real and nominal post finance and tax IRR’s for the proposed housing-incorporated
system. The nominal IRR is 7.18%, while the real is 5.91%. Nominal NPV is $1,455,261, while real NPV is
-$106,216 at a discount rate of 6%:
Post finance and tax
Nominal
Real
Discount Rate Nominal Real
2% 8,219,655 5,782,925
4% 4,408,476 2,439,092
6% 1,379,914 -221,545
8% -1,042,232 -2,352,443
10% -2,991,733 -4,070,155
IRR
7.09%
5.82%
NPV
Pre finance and tax
Nominal
Real
Discount Rate Nominal Real
2% 12,118,192 9,132,889
4% 7,443,484 5,014,679
6% 3,703,894 1,715,017
8% 692,090 -947,027
10% -1,749,839 -3,109,325
IRR
8.53%
7.24%
NPV
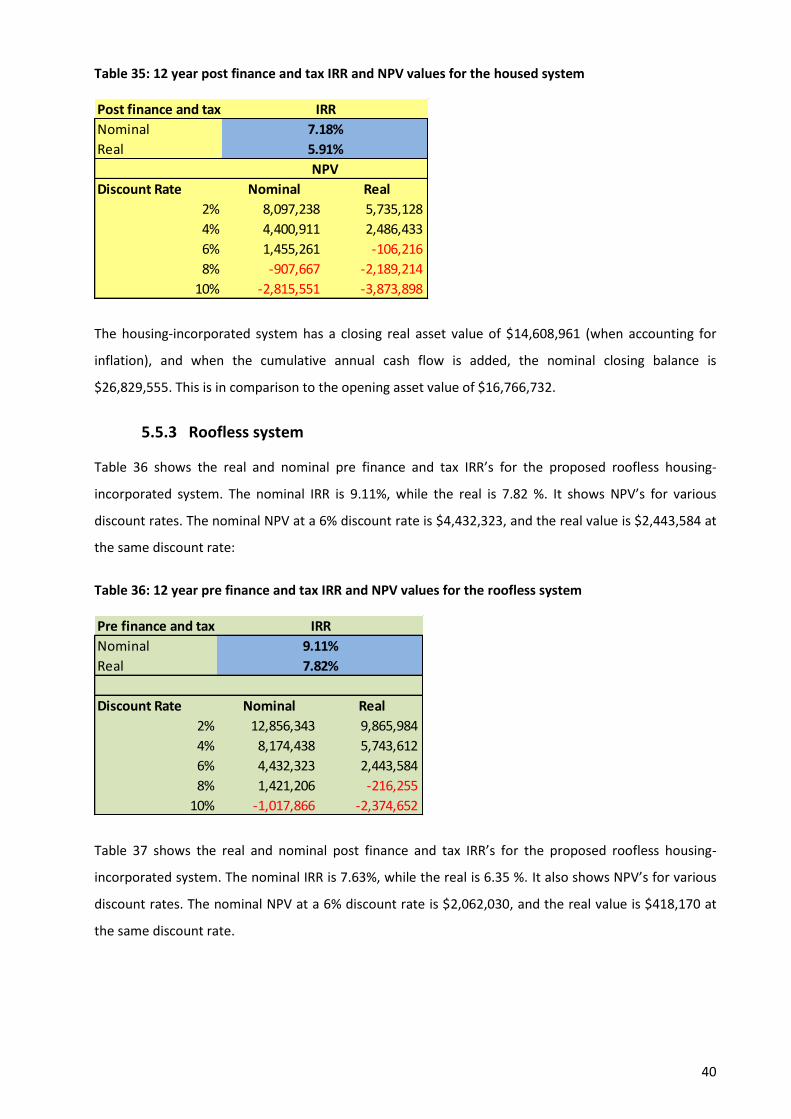
40
Table 35: 12 year post finance and tax IRR and NPV values for the housed system
The housing-incorporated system has a closing real asset value of $14,608,961 (when accounting for
inflation), and when the cumulative annual cash flow is added, the nominal closing balance is
$26,829,555. This is in comparison to the opening asset value of $16,766,732.
5.5.3 Roofless system
Table 36 shows the real and nominal pre finance and tax IRR’s for the proposed roofless housing-
incorporated system. The nominal IRR is 9.11%, while the real is 7.82 %. It shows NPV’s for various
discount rates. The nominal NPV at a 6% discount rate is $4,432,323, and the real value is $2,443,584 at
the same discount rate:
Table 36: 12 year pre finance and tax IRR and NPV values for the roofless system
Table 37 shows the real and nominal post finance and tax IRR’s for the proposed roofless housing-
incorporated system. The nominal IRR is 7.63%, while the real is 6.35 %. It also shows NPV’s for various
discount rates. The nominal NPV at a 6% discount rate is $2,062,030, and the real value is $418,170 at
the same discount rate.
Post finance and tax
Nominal
Real
Discount Rate Nominal Real
2% 8,097,238 5,735,128
4% 4,400,911 2,486,433
6% 1,455,261 -106,216
8% -907,667 -2,189,214
10% -2,815,551 -3,873,898
IRR
NPV
7.18%
5.91%
Pre finance and tax
Nominal
Real
Discount Rate Nominal Real
2% 12,856,343 9,865,984
4% 8,174,438 5,743,612
6% 4,432,323 2,443,584
8% 1,421,206 -216,255
10% -1,017,866 -2,374,652
7.82%
IRR
9.11%

41
Table 37: 12 year post finance and tax IRR and NPV values for the roofless system
The housing-incorporated system has a closing real asset value of $15,694,621 (when accounting for
inflation), and when the cumulative annual cash flow is added, the nominal closing balance is
$28,062,656. This is in comparison to the opening asset value of $15,865,538.
5.5.4 Comparison (Marginal returns)
Marginal returns are the performance of the proposed system in comparison to the current system. A
positive marginal IRR indicates an improvement compared to the current system. Both the housed and
roofless systems show an improvement of IRR compared to the current system, with the roofless system
recording a 9.41% (real) and 10.72% (nominal) marginal return, while the housed system recorded more
modest improvements of 4.66% (real) and 5.91% (nominal). The figures used were pre finance and tax,
as they give a better indication of the actual farm performance, and are more generally applicable,
rather than the influence of specific debt and tax structures of the business.
Table 38: Pre finance and tax marginal returns of the proposed systems compared to the current system
5.5.5 Statement of assets/liabilities
Table 39 details the asset and liabilities summary of the three systems. The fixed assets are the same for
all systems (land value of $9.3 million, irrigation value of $350,000 and cowshed value of $720,000) with
the only difference being the housing structure, worth $2,390,500 for the fully enclosed system and
$1,529,500 for the roofless system. The plant and machinery value for the current system is $500,000,
while the proposed systems are valued at $600,000. The value of cows is the same for each system
($1,275,950), and the share value increases from the current system ($1,917,088) to the roofless system
($2,090,088) to the housed system ($2,130,282). The total asset value in year 1 for the current system is
$14,063,038, the housed system is $16,766,732 and the roofless system is $15,865,538.
Post finance and tax
Nominal
Real
Discount Rate Nominal Real
2% 9,066,817 6,573,763
4% 5,166,440 3,148,324
6% 2,062,030 418,170
8% -424,991 -1,772,297
10% -2,430,300 -3,541,344
IRR
7.63%
6.35%
Marginal returns Housed System Roofless System
Real IRR 4.66% 9.41%
Nominal IRR 5.91% 10.72%

42
The current system does not have any liabilities assumed, while the housed system has $2,703,694 and
the roofless system has $1,802,500.
Table 39: Statement of assets and liabilities for the current and proposed systems

43
Chapter 6:
Discussion
This Chapter will discuss the modelled results of the present and proposed farm systems from an
environmental and economic basis, along with the key factors that affected the results. In sections 6.1
and 6.2, the environmental and economic results are discussed. The economic analysis use pre finance
and tax figures where appropriate, as they give a more appropriate indication of the effect on the
general farming system rather than the finance and tax structures of a specific enterprise. The perceived
benefits of incorporating a wintering structure are proposed in 6.3 with sensitivity analyses presented in
6.4. Where appropriate, results will be compared to the literature reviewed in Chapter 2. Other
opportunities possible from a shed system are covered in 6.5. Finally, section 6.6 will outline risks.
6.1 Environmental results
As discussed in Chapter 2, much of the N leached from a farming system occurs in late autumn and
winter. As both of the proposed systems capture effluent during these high risk periods, a reduction in
total N leaching was expected. The results in Chapter 4 show that without an increase in cow numbers
for the farm system, there is a reduction in N lost to water for both of the housing-incorporated
systems.
In both proposed systems, the ‘N lost to water’ figure is reduced to 24kgN/ha, from 39kgN/ha in the
current system. This represents a 38% reduction in N leaching, which is a significant reduction. This is in
line with the results obtained by de Klein and Ledgard (2001), who reported a 34% reduction in N
leaching with the use of restricted grazing on New Zealand dairy systems. This level of reduction will
cover the current proposed N leaching requirements for the Selwyn-Waihora plan (Environment
Canterbury, 2014).
6.1.1 Factors which influenced environmental results
Supplementary feeds
With the addition of on-farm wintering, and an increase in lactation supplements, there has been an
increase in total supplements fed on farm. Overseer® predicts that this will results in volume of N added
by supplements to increase from 42kgN/ha/yr to 88 kgN/ha/yr and 89kgN/ha/yr in the housed and
roofless systems respectively. This increase in supplementary N will result in increased N being excreted
by animals on farm as effluent.

44
Stock numbers
With the addition of on-farm wintering, there will be an increase in stock numbers on farm for the year.
Unlike in the current system, where cows are brought onto the farm from the wintering block as they
are ready to calve, wintered cows are always on the dairy platform, meaning there will be an increased
amount of effluent put onto the dairy platform across the year.
Addition of the housing structure
The major change influencing environmental effects is the inclusion of the housing structures. In both
proposed systems, the potential effects of the ‘at risk’ periods for wintering are minimised by removing
cows from pasture and capturing their effluent in the housing structure. The use of a suitably sized
holding pond allows effluent to be held for longer periods and thus flexibility of effluent applications.
This results in effluent only being applied at ‘safe’ times for leaching. This change has a significant
influence on leaching levels, accounting for a large percentage of the N leaching reduction.
Effluent
The amount of effluent collected by the housing structure was modelled using the Dairy Effluent Storage
Calculator (DESC), and was also calculated by the default values in Overseer®. The increase in the total
amount of effluent collected due to the use of the housing structure results in an increase in the amount
of effluent being applied to the dairy platform. Since no effluent is exported and the on-farm effluent
area expanded, the requirement for fertiliser (both urea and superphosphate) is reduced. As this
effluent is uniformly applied to pasture, rather than in highly concentrated doses such as in a urine
patch, and at a time when plants have a greater uptake of nutrients, this leads to increased nutrient
efficiency and reduced nutrient loss.
Fertiliser
With the increase in effluent being captured and spread onto the dairy platform as fertiliser, there is a
reduction in fertiliser required to be purchased for application. This increase in effluent application
ensures similar pasture growth rates can be achieved to ensure the assumed milk production can be
achieved.
6.1.2 Other environmental considerations
E Coli from effluent
With the increased levels of effluent being captured and reapplied as fertiliser, there is an increased risk
of environmental contaminants other than nutrients having an environmental impact. Effluent can
contaminate water with E Coli, which can make water unsafe for human consumption. Effluent
applications need to be closely monitored for this reason.

45
N lost to atmosphere figure
Although the ‘N lost to water’ figure is the subject of focus in this report, ‘N lost to atmosphere’ is also
an adverse environmental effect that needs to be taken into account. All ‘N lost to atmosphere’ figures
in this study remain relatively constant. This figure, however, needs to also be considered, as N2O
(Nitrous Oxide) is a gas with significant Global Warming Potential (GWP), and the environmental effects
of Greenhouse Gases have come under scrutiny in the past, and could potentially again in the future.
N loss reduction on the current wintering pad
Monaghan et al. (2004) reported the significant environmental effect of the wintering platform. In the
proposed systems, the cows will no longer be grazing forage crops on the wintering block, resulting in a
significant reduction in N losses on that block. Although that is not relevant to the Overseer® analysis
undertaken in this report, it does result in a large reduction in the indirect environmental effects of the
whole dairy enterprise.
Variations in actual performance
SIDDC (2014) detailed that any variances in assumed production practices can cause substantially
different N-loss levels in the actual system – this needs to be considered. If the environmental
performance is worse than predicted, it will negate any positive environmental influence of
incorporating the housing structure.
6.1.3 Cost of N mitigation
With forthcoming regulation to reduce the environmental effects of farming practices, dairy operators
are going to be faced with costs to reduce their N leaching, either by a reduction in farming intensity
causing lower production, or expenses to mitigate leaching, such as the introduction of a housing
structure. This gives rise to a ‘cost per unit N mitigated’ figure. As in this scenario the housing-
incorporated system increases productivity, thus a ‘cost of capital per unit N mitigated’ figure has been
calculated for the two proposed housing structures. As both housing structures had the same reduction
in leaching, the roofless structure was a much cheaper capital cost per kg N mitigated:
Table 40: Capital cost of N mitigation
The net benefit (or cost) of the investment per kg N mitigation can also be expressed on an annual basis
using the concept of converting the NPV of the investment to an equivalent annuity at the appropriate
discount rate. For example, if an investor has a required time preference of x4%, a discount rate of x4%
Total cost Cost/ha N mitigated
Capital cost /
kg N mitigated
Roofless housing structure 1,529,500$ 9,553$ 15kg N/ha 637$
Enclosed housing structure 2,390,500$ 14,931$ 15kg N/ha 995$

46
would be selected for both the calculation of the NPV and the conversion thereof to an equivalent
annuity.
This allows for a benefit/cost of the investment at different discount rates. When an annuity is then
undertaken on the marginal results, then divided by the amount of N mitigation caused by this change in
system, an annual value per kg of N mitigated is established for different discount rates:
Table 41: Pre finance and tax real cost or benefit of N mitigation at different discount rates
At the selected 6% discount rate, the housed system has a negative real NPV. This results in an
equivalent annual cost of $11.70/kg of N leaching reduction. The roofless system has a positive real NPV
at 6% discount rate, which means there is no ‘cost’ for N mitigation at this discount rate. The roofless
system is positive until a 10% discount rate, at which the cost of N mitigation is $3.87/kg of N leaching
reduction.
This cost per unit N leaching reduction could become the biggest limiting factor to farming practices in
the future, and is an important KPI to analyse for investments which have the purpose of N mitigation.
6.2 Financial results as compared to research question
The addition of a housing structure comes at significant capital cost, and in order to remain financially
competitive, a level of increased output or reduced costs (or combination of both) will need to occur to
cover the capital cost. The fully-enclosed wintering structure has a significantly larger capital cost than
the roofless structure, with greater rates of annual depreciation and interest, and so will have to
perform significantly better than the roofless and current systems to ensure its viability.
In year 1, the two proposed systems both had increased production, with an 11% (housed) and 9%
(roofless) increase in milksolid production compared to the current system. This resulted in nearly the
same level of increase in Gross Farm Revenue (GFR). Farm Working Expenses remained very similar,
with increase of expenses in some categories in the proposed systems, with reductions in others. With
increasing GFR and similar FWE, the Cash Operating Surplus (or EBIT) of the proposed systems were 22%
(housed) and 18% (roofless) higher than the current system. Once depreciation was taken into account,
to give Total Operating Expenses, the proposed systems had higher Total Operating Expenses, resulting
in similar levels of Dairy Operating Profit, with the roofless system being the most profitable, followed
Housed Roofless
2% $22.55 $48.05
4% $5.65 $35.20
6% -$11.70 $22.26
8% -$29.47 $9.23
10% -$47.64 -$3.87
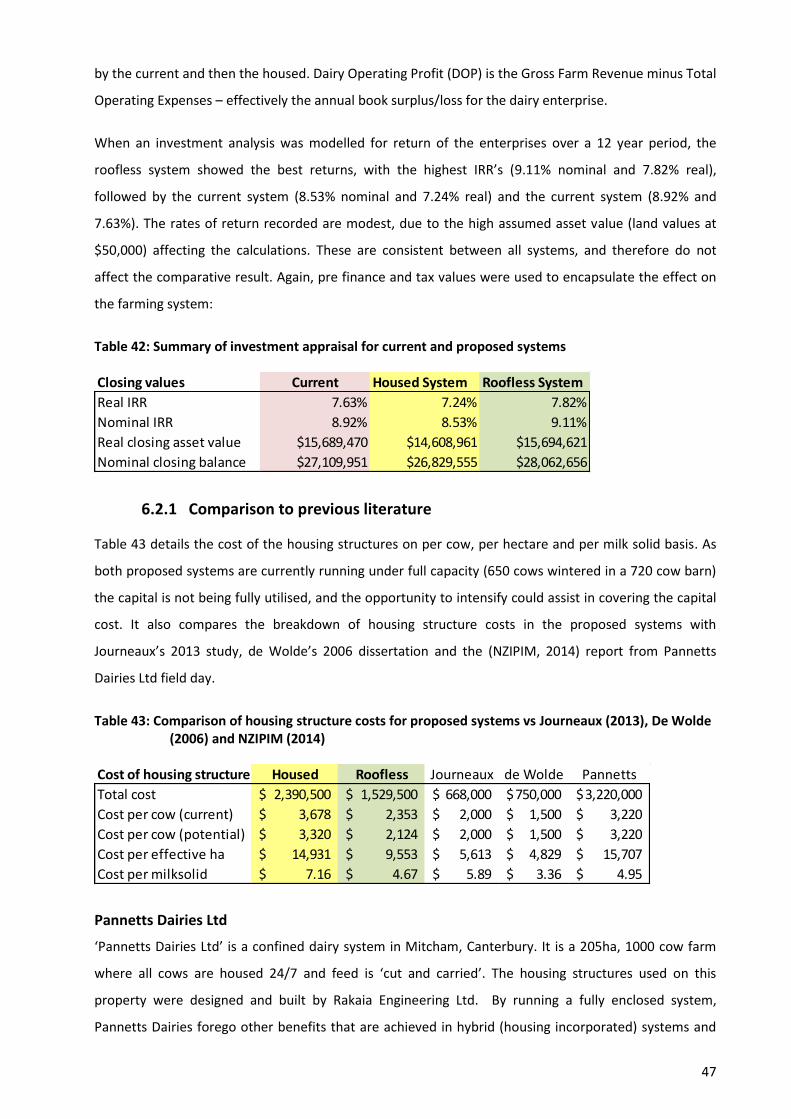
47
by the current and then the housed. Dairy Operating Profit (DOP) is the Gross Farm Revenue minus Total
Operating Expenses – effectively the annual book surplus/loss for the dairy enterprise.
When an investment analysis was modelled for return of the enterprises over a 12 year period, the
roofless system showed the best returns, with the highest IRR’s (9.11% nominal and 7.82% real),
followed by the current system (8.53% nominal and 7.24% real) and the current system (8.92% and
7.63%). The rates of return recorded are modest, due to the high assumed asset value (land values at
$50,000) affecting the calculations. These are consistent between all systems, and therefore do not
affect the comparative result. Again, pre finance and tax values were used to encapsulate the effect on
the farming system:
Table 42: Summary of investment appraisal for current and proposed systems
6.2.1 Comparison to previous literature
Table 43 details the cost of the housing structures on per cow, per hectare and per milk solid basis. As
both proposed systems are currently running under full capacity (650 cows wintered in a 720 cow barn)
the capital is not being fully utilised, and the opportunity to intensify could assist in covering the capital
cost. It also compares the breakdown of housing structure costs in the proposed systems with
Journeaux’s 2013 study, de Wolde’s 2006 dissertation and the (NZIPIM, 2014) report from Pannetts
Dairies Ltd field day.
Table 43: Comparison of housing structure costs for proposed systems vs Journeaux (2013), De Wolde (2006) and NZIPIM (2014)
Pannetts Dairies Ltd
‘Pannetts Dairies Ltd’ is a confined dairy system in Mitcham, Canterbury. It is a 205ha, 1000 cow farm
where all cows are housed 24/7 and feed is ‘cut and carried’. The housing structures used on this
property were designed and built by Rakaia Engineering Ltd. By running a fully enclosed system,
Pannetts Dairies forego other benefits that are achieved in hybrid (housing incorporated) systems and
Closing values Current Housed System Roofless System
Real IRR 7.63% 7.24% 7.82%
Nominal IRR 8.92% 8.53% 9.11%
Real closing asset value $15,689,470 $14,608,961 $15,694,621
Nominal closing balance $27,109,951 $26,829,555 $28,062,656
Cost of housing structure Housed Roofless Journeaux de Wolde Pannetts
Total cost 2,390,500$ 1,529,500$ 668,000$ 750,000$ 3,220,000$
Cost per cow (current) 3,678$ 2,353$ 2,000$ 1,500$ 3,220$
Cost per cow (potential) 3,320$ 2,124$ 2,000$ 1,500$ 3,220$
Cost per effective ha 14,931$ 9,553$ 5,613$ 4,829$ 15,707$
Cost per milksolid 7.16$ 4.67$ 5.89$ 3.36$ 4.95$

48
are a different type of dairy producer altogether, but the housing structure costs are comparable.
Pannett’s accommodates more cows and produces substantially more per cow, meaning the cost per
cow is much higher than the roofless structure, de Wolde’s structure and Journeaux’s assumptions. But
due to the high production from the cows, the cost of the shed per milksolid is lower than the housed
system and in Journeaux’s study.
De Wolde (2006)
De Wolde’s results were favourable, reporting that housed wintering was more profitable, as well as
reducing N leaching compared to traditional wintering on forage crops in Southland. His study was
completed in 2006, and showed an actual cost of $1500 per cow for a fully-enclosed housing barn (he
undertook the study on his Southland properties). This study was undertaken nearly a decade ago, and
the market rates for housing structures have since increased significantly, with a similar fully housed
barn quoted by a commercial firm in 2014 costing nearly 2.5 times as much. When compared on a per
effective ha basis, de Wolde’s structure is again the cheapest, costing less than half of the comparative
roofless structure in the proposed system, and on a per milksolid basis it is also significantly cheaper
than all others considered.
Journeaux (2013)
Journeaux’s results were considered ‘problematic’, as although they reduced N leaching, they required
intensification to become financially viable (see table 2). When compared to the proposed systems, the
housing structure was less expensive on per cow and per effective hectare basis, and was only more
expensive than the roofless structure on a per milksolid basis. Despite this, the two proposed systems
are financially viable, while Journeaux’s study is not.
In Journeaux’s study, there is the requirement for a tractor upgrade to the value of $80,000, which
wasn’t required in either of the proposed systems. When this cost is accounted for, the cost of the
facility rises to approximately that of the roofless system on a per cow basis, and the housed system on
a per milksolid basis.
There are also other assumptions in this study that vary from Journeaux’s:
The reduced replacement rate, increase in pasture production (due to reduced pugging), saved fertiliser
cost and slightly higher milk price all contribute to a higher level of profitability for the proposed
systems. Journeaux assumed that lactation supplement levels would remain the same (5%) while the
Assumed benefits Housed Roofless Journeaux
Reduced replacement rate 3% 3% 2%
Increased pasture production 4% 4% 2%
Saved fertiliser 200kgN/ha 200kgN/ha 150kgN/ha
Milk price 6.50$ 6.50$ 6.20$

49
proposed systems have an increase in supplementary feed compared to the current system (10% to
12%) in order to feed the cows sufficiently during the periods spent in-shed in the shoulders of the
season. Journeaux also assumed a discount rate of 8% as his benchmark for NPV calculations. As with de
Wolde’s study, Journeaux’s was modelled in a differing environment and climatic conditions to the
proposed systems in Canterbury.
A combination of all these factors results in the proposed systems being financially viable (without
intensification) in this study, while Journeaux’s study was concluded to be uneconomic without
intensification.
Comparison of wintering costs
In order to calculate the effect of the change in wintering systems, a comparison of the current
wintering regime and the proposed wintering regimes must be undertaken when all costs (and benefits)
of wintering are taken into account. Table 44 shows the costs directly applicable to wintering in the
current and proposed systems. Fifty percent of structure depreciation and R&M, electricity, and
additional staff and tractor costs were attributed to wintering, while the increase in milking shed
expenses were entirely attributed to wintering. The cost of winter milking was added to the costs:
Table 44: Comparison of current and proposed wintering costs
Table 44 shows that when all factors are accounted for, the direct costs of wintering in the proposed
system increase significantly compared to the current system. The major influence on these figures is
the housing structure depreciation and R&M, as half of the annual cost for both of these figures was
considered as being attributable to wintering. The period of wintering is decreased in the proposed
system due to lactation length being increased, and this benefit is accounted for by the ‘increased
milking’ period figures for May and June.
Wintering cost Current Housed Roofless
100% of cows off farm for 9.8
weeks at $22/week 137,904$ -$ -$
Fodder beet cost (June/July) -$ 91,629$ 93,091$
Pasture silage cost (June/July) -$ 61,214$ 61,265$
Additional staff cost -$ 10,500$ 10,500$
Shed expenses -$ 940$ 440$
Electricity -$ 6,476$ 2,476$
Structure R&M -$ 22,112$ 21,031$
Structure Depreciation -$ 52,201$ 33,399$
Tractor costs -$ 9,009$ 9,009$
Increased milking (May) -$ 48,025-$ 48,025-$
Increased milking (June) -$ 14,465-$ 14,465-$
Total 137,904$ 191,591$ 168,721$

50
Implications for current LUDF system
In simple terms, in order to be more profitable compared to the current system, the addition of the
housing structures in the proposed systems must create more financial benefits than the cost of their
inclusion. The cost of wintering is increased (as above), but despite this, the inclusion of the housing
structure allows for flow-on effects through the season (such as reduced pugging and increased total
milk production) which outweigh the increased cost of wintering, and in turn result in increasing the
overall profitability of the system.
6.3 Benefits and costs of proposed system
6.3.1 Benefits
Animal health
Animal health changes have been based on Arnold et al. (2009), and the findings from their survey.
There are multiple factors in the proposed system which improves cow health. As the cows spend time
in the housing structure during the period of poorer weather, there is an assumed reduction in
environmental sicknesses or metabolic issues, as they are in more controlled climatic condition,
particularly in the fully-housed scenario. There may be less of a thermal challenge for the cows as they
are in a controlled environment, and lying time will be increased as they have decent bedding and less
of a walking requirement to eat. Injury rates were assumed to be relatively similar.
There may also be a reduction in cow lameness, with the reduced requirement of cow walking,
particularly in the wet autumn/winter conditions. Arnold et al. (2009) reported similar instances
(between the housing structures and pasture based practices) of lameness in their study, as the cows
were still spending periods outdoors during winter. With the cows enclosed for the duration of winter
with no requirement to go outside, they could have a slight improvement of hoof health, although none
was assumed in this study.
The increase in dirtiness reported by Arnold et al. (2009) could be caused by multiple factors. The design
of the housing structure has an effect on dirtiness, with many of the structures reported using litter
bases, and no comment on the design having an effluent removal system. In the freestall structures
used in this study, dirtiness is mitigated by the design of the structure, with the cows lying in the stall in
a position where their effluent will land in the ‘scraper lane’, and be cleared by the scraper.
Also, a cause of dirtiness is overstocking within the housing structure (O'Driscoll, Boyle, French, Meaney,
& Hanlon, 2008). With these proposed housing structures running at well below capacity (650 cows in a
720 cow structure) there shouldn’t be a large increase in dirtiness. For this reason, dirtiness scores were
assumed to be similar to the pasture based system.

51
Despite improvements in other areas of animal health, there are also negative effects of cows being
enclosed in close proximity to each other. One disadvantage of a confined system is the increased
instance of environmental mastitis (staphylococcus aureus and coliforms). As the cows will continue to
be milked for a period solely through the housing structure, there will an environment created which
can lead to these pathogens increasing. Without close monitoring, there can be a substantial occurrence
of mastitis, reducing the quality (somatic cell count) and quantity of milk harvested. This effect can be
minimised by keeping the housing structure clean, and close observation of cows showing signs of
mastitis.
As there are both positive and negative effects on animal health with the proposed systems, the animal
health cost was assumed to be the same, although with good management of the structure, some net
benefits could potentially be realised.
With increasing public scrutiny on farming systems, in particular animal welfare practices, any
improvement in animal health will improve the perceived animal welfare practices of farmers, reducing
public pressure in that aspect.
Winter grazing
By moving the wintering of cows from Ashley Dene to on-farm, there is no longer an off-farm winter-
grazing cost. This is a reduction of about $138,000. There is also no longer a requirement to monitor the
progress of cows on winter grazing. Also, there is less risk of a sub-standard grazier not putting the
required condition on the cows for the upcoming season. However, this benefit is offset by the new cost
of wintering the cow’s on-farm, which was discussed previously.
Pasture production
The improvement in pasture production is due to the reduction in pugging on-farm during the at-risk
periods, due to restricted grazing practices. As LUDF does not currently have significant pugging, the
assumed increase in pasture production of 4% was at the lower end of the 2-20% range described by de
Klein (2001).
Unlike in Journeaux’s 2013 study, there was no assumption for increased pasture production due to
increased effluent application, as this was offset with a reduction in fertiliser costs.
Milk production
There is a significant increase in overall milk production in the proposed systems, with an increase of
11% for the housed system, and 9% for the roofless system. There are multiple factors contributing to
this, including increased pasture production, extended lactation and increased levels of lactation
supplement. As the main source of income for the system, this increased production is important for
covering the cost of the housing structure and ensuring the viability of the system.

52
Cow condition
With the use of the housing structure for cow wintering, it is much easier for cows to put on body
condition over this period. This is due to increased utilisation of feed, and a reduction in maintenance
requirements compared to the traditional system. Therefore it can be assumed that cows could gain
additional condition compared to the current system, which would theoretically improve production
over the season. Despite this, it has been assumed that there is no improvement in BCS at calving. This
benefit has been realised by a reduction in the volume of feed required to get the cows to the required
BCS of 5.1, and therefore a reduction in costs.
Replacement rate
Dry/empty cows are inefficient, unproductive elements of a farming system and any reduction in their
number will improve profitability. With the improvement in cow living conditions in the
winter/shoulders of the season, and improved animal health in the proposed systems, there has been
an assumed reduction in the number of dry and empty cows, resulting in a reduction in the replacement
rate of cows by 3% (from 21% to 18%). This results in an increase in excess stock sales, to the value of
$24,000. This will also lead to faster genetic improvement within the herd, as only the best heifers will
fill the 18% of replacements, meaning the extra 3% of replacements sold will be the heifers of least
genetic merit.
Fertiliser costs
With the increase in effluent collected, there is a reduction for the requirement of imported fertiliser;
both urea and superphosphate. This is due to the increased rate of effluent to be applied to pasture as
fertiliser. This recycling of nutrients has significant financial benefits, worth nearly $68,000 a year, based
on a 200kg/ha reduction in N, and a 500kg/ha reduction in superphosphate. There are also significant
environmental implications of this change of practice.
Feed utilisation
Supplementary feed is fed in-shed on a concrete central feed lane, in a relatively sheltered environment.
This results in relatively high utilisation of feed, and minimal feed wastage compared to the current
system, where the utilisation of feed in the wintering system and the feeding of lactation supplements is
much lower, due to the inability of the cows to harvest all available feed when fed in the paddock. This
improved utilisation results in less feed required to be purchased for similar cow performance, resulting
in a reduction of expenses.
Cow maintenance requirement
In the proposed system, the cows will spend an increasing amount of time in the controlled
environment of the housing structure as the weather deteriorates, therefore reducing the time they
spend on cold soil/mud, and in the fully-enclosed scenario they will also be sheltered from any rain, hail

53
or snow that may occur during this period. This will reduce the amount of energy the cows spend on
keeping themselves warm, hence improving their feed conversion ratio (FCR).
In the proposed system the cows will walk less, as their ration is always on-hand near their sleeping
area. This reduces the requirement to walk from the paddock to the milking shed, as well as foraging in
the paddock during winter. This benefit (along with improved utilisation) is realised in the amount of
feed supplied during the winter period, as cows will only require 10kgDM a day rather than the 12kgDM
currently budgeted in the traditional system.
More self-contained
As the animals are wintered on farm in the proposed system, there will be no significant period that
they spend off farm. This could mean improved monitoring of individual stock, and the herd as a whole,
as they are under constant observation by the permanent LUDF staff. This could also mean less
exposure to disease, as the cows do not come in close proximity to other herds during this period.
Reduction in breeding expenses
With the cows in better condition during the season due to improved animal health and wintering
performance, there will be improved fertility within the herd, resulting in a reduction in breeding
expenses required to get the animals pregnant.
6.3.2 Costs
Cost of the housing structure/effluent system
The breakdown of the housing structure cost is detailed in Table 43. It is a significant financial cost to
incorporate a structure, with the cost of the structure in both proposed systems being higher than the
combined book value of stock. The cost of including a housing structure is the main restrictive barrier to
their incorporation on Canterbury dairy farms. The amount of capital required would have to be
borrowed in most cases, and since they are merely covering their cost of capital for no substantial extra
profit, there is likely to be a reluctant response to their adoption. Also, there would be a reluctance to
borrow capital to fund a depreciating asset of this value.
It is also an illiquid asset; if the decision is made to include a housing system and it does not have the
desired effect on the farming system, there are few other uses for it and it does not have a substantial
salvage value. This is a risk to their incorporation.
Labour
In the proposed systems, it is assumed that another half a full-time staff unit will be required each year,
raising the staff units from 3.7 to 4.2. With the cows in the shed, more labour will be required to

54
monitor the cows, as well as the extra time required to feed out the ration to the cows with the tractor
every day. This comes at a cost of $21,000 annually.
As well as the increased labour requirement, staff will have to adapt to a new type of farming system,
with different challenges to a conventional pasture-based system. This will involve increased staff
training. With few similar systems to learn from in New Zealand, this may be a challenge.
As the lactation is extended, and the cows are on-farm all year round, there is less of a ‘quiet period’ on
the farm as there is during winter currently. This is often when staff take their annual leave, other
general farm maintenance occurs, and the staff generally get a chance to have a reduced workload and
recharge for the following season. In the proposed system, this period will be minimised, which could
result in fatigue issues, and higher staff turnover.
Machinery
With the increased tractor hours occurring when feeding out in-shed, there will be a direct cost
associated with that ($42 an hour, section 3.5.3) as well as an indirect cost, as there will be a higher
turnover of machinery than the current system due to greater workload. There is also the capital
requirement for another smaller tractor for general farm work with the increased workload of the
current tractor, which will also require debt servicing.
LUDF currently has the machinery to support the proposed system (100HP tractor, feed-out wagon).
This substantially reduced the capital cost of the proposed system, and other comparative farms may
not have the existing machinery, which could change the financial viability of this system.
Repairs and Maintainence
As with most structures on a dairy farm, with cow traffic and general wear-and-tear there will be an
R&M cost associated with the housing structures. The rigid steel free stalls are prone to bending under
pressure from cows, the rubber matting will need occasional repairs, and the moving parts (such as the
effluent scraper) will require regular maintenance. As the structure ages, there will be an increasing
R&M requirement as the equipment gets older and more run-down. This is assumed in section 3.5.3
The roofless structure will require a higher rate of R&M as it is less sheltered from environmental
damage than the fully-enclosed structure.
In the proposed systems, there could also be a reduction in on-farm R&M as the cows will spend more
time in the shed rather than walking on wet lanes over this period. However, no financial benefit was
assumed in this model.

55
Management of the extra effluent
The increased volume of effluent will need extra time in order to be correctly managed. There are
significant consequences (both financially and environmentally) of overflowing effluent facilities, and
over application of any area can result in punishments from regulatory entities. Staff would have to be
sufficiently trained in order to ensure the effluent was dealt with appropriately, to allow full benefits
from its use as fertiliser, while avoiding any regulatory issues.
6.4 Sensitivity Analyses
This section will analyse the effect of changing external and internal system assumptions, and their
effect on the overall viability of the farming enterprise. Analysis will be completed on the Internal Rate
of Return (IRR), marginal IRR’s compared between the current and proposed systems, and Dairy
Operating Profit (DOP). All IRR’s are calculated from pre finance and tax cash flows.
Housing structure cost
The cost of housing structures has increased in recent years, as shown in Table 43. As the addition of the
housing structure is the major financial change to the proposed systems, any change in the cost of
building the structure will influence the profitability of the systems. Table 45 shows the effect of an
increase in the construction cost of the housing structure, by 10%, 30% and 50%, and its effect on IRR,
marginal returns and DOP. As the cost of the housing structure increased, the IRR, marginal returns and
DOP all decreased, with the marginal returns for the fully housed system being reduced to 0.66% -
making the investment only just financially viable before finance and tax. The increase in costs had less
of an effect on the roofless system, as its lower construction cost resulted in less increases in overall
cost of the structure.
Although both systems drop to below the DOP of the current system, the IRR’s don’t fall dramatically,
and marginal returns remain positive, showing that even with a 50% increase in construction cost, the
investment is still viable if it produces the expected additional production.
Table 45: Sensitivity analysis of changing housing structure cost
Milk price
In recent years, the farm gate milk price paid by Fonterra (and other dairy co-operatives in New Zealand)
has varied significantly from season to season. As milk price is the most significant external factor
Housed Roofless Housed Roofless Housed Roofless
+10% 7.07% 7.72% 3.63% 8.44% $922,589 $940,910
+30% 6.74% 7.53% 1.96% 6.85% $886,479 $916,410
+50% 6.43% 7.35% 0.66% 5.63% $850,369 $891,910
Housing
structure cost
Real IRR Marginal IRR DOP
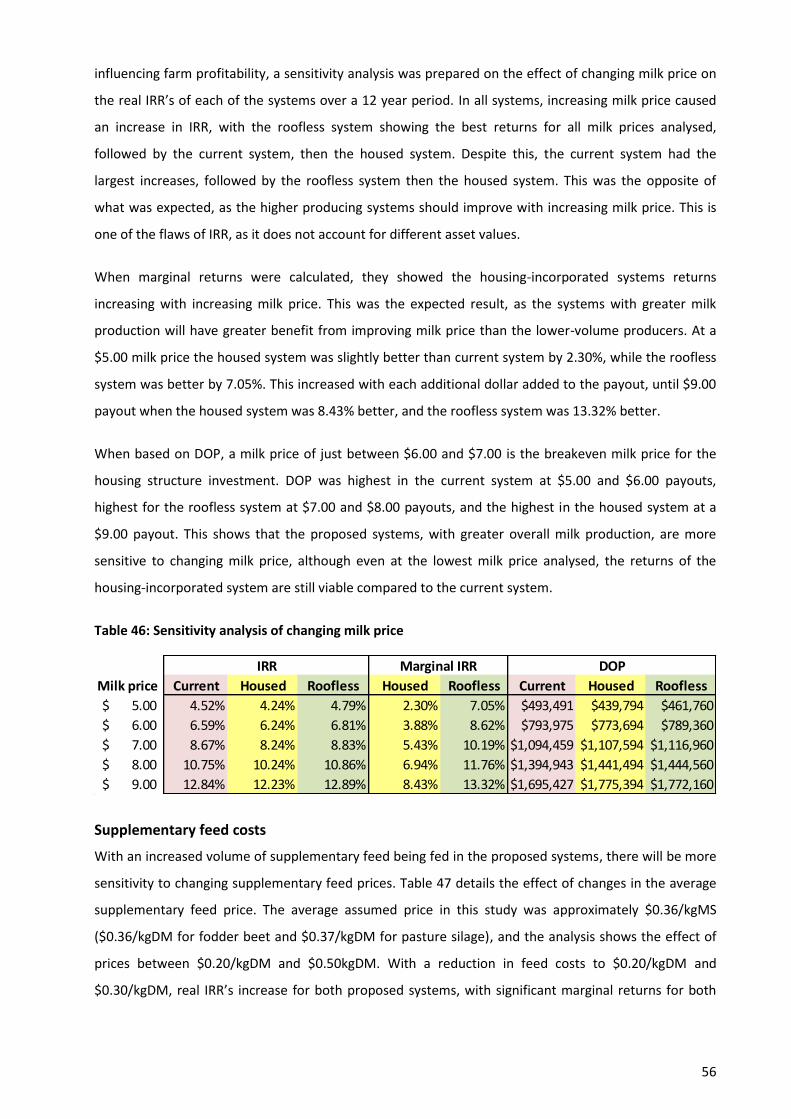
56
influencing farm profitability, a sensitivity analysis was prepared on the effect of changing milk price on
the real IRR’s of each of the systems over a 12 year period. In all systems, increasing milk price caused
an increase in IRR, with the roofless system showing the best returns for all milk prices analysed,
followed by the current system, then the housed system. Despite this, the current system had the
largest increases, followed by the roofless system then the housed system. This was the opposite of
what was expected, as the higher producing systems should improve with increasing milk price. This is
one of the flaws of IRR, as it does not account for different asset values.
When marginal returns were calculated, they showed the housing-incorporated systems returns
increasing with increasing milk price. This was the expected result, as the systems with greater milk
production will have greater benefit from improving milk price than the lower-volume producers. At a
$5.00 milk price the housed system was slightly better than current system by 2.30%, while the roofless
system was better by 7.05%. This increased with each additional dollar added to the payout, until $9.00
payout when the housed system was 8.43% better, and the roofless system was 13.32% better.
When based on DOP, a milk price of just between $6.00 and $7.00 is the breakeven milk price for the
housing structure investment. DOP was highest in the current system at $5.00 and $6.00 payouts,
highest for the roofless system at $7.00 and $8.00 payouts, and the highest in the housed system at a
$9.00 payout. This shows that the proposed systems, with greater overall milk production, are more
sensitive to changing milk price, although even at the lowest milk price analysed, the returns of the
housing-incorporated system are still viable compared to the current system.
Table 46: Sensitivity analysis of changing milk price
Supplementary feed costs
With an increased volume of supplementary feed being fed in the proposed systems, there will be more
sensitivity to changing supplementary feed prices. Table 47 details the effect of changes in the average
supplementary feed price. The average assumed price in this study was approximately $0.36/kgMS
($0.36/kgDM for fodder beet and $0.37/kgDM for pasture silage), and the analysis shows the effect of
prices between $0.20/kgDM and $0.50kgDM. With a reduction in feed costs to $0.20/kgDM and
$0.30/kgDM, real IRR’s increase for both proposed systems, with significant marginal returns for both
Milk price Current Housed Roofless Housed Roofless Current Housed Roofless
5.00$ 4.52% 4.24% 4.79% 2.30% 7.05% $493,491 $439,794 $461,760
6.00$ 6.59% 6.24% 6.81% 3.88% 8.62% $793,975 $773,694 $789,360
7.00$ 8.67% 8.24% 8.83% 5.43% 10.19% $1,094,459 $1,107,594 $1,116,960
8.00$ 10.75% 10.24% 10.86% 6.94% 11.76% $1,394,943 $1,441,494 $1,444,560
9.00$ 12.84% 12.23% 12.89% 8.43% 13.32% $1,695,427 $1,775,394 $1,772,160
IRR Marginal IRR DOP

57
the housed (6.81% and 10.15%) and roofless (12.18% and 16.57%) systems. There is a corresponding
increase in DOP for both systems.
Similarly, the IRR is reduced when the feed price increases from the assumed price of $0.36/kgDM. At
the highest feed price analysed ($0.50/kgDM), the marginal return for the housed system becomes
negative, showing that at this feed price, the current system is more profitable than the housed. The
roofless system’s marginal return is also reduced to 3.25%, showing it is still more profitable than the
existing system with a significant increase in feed price.
An increase of $0.10/kgDM of supplementary feed reduces DOP by approximately $75,000 for the two
proposed systems. The proposed systems are slightly more sensitive than the current, but as the
majority of feed supplied to the animals is still pasture, changing prices don’t have a big effect on the
IRR.
Also, although the proposed systems have increased volumes of supplementary feed, they no longer
have to deal with a winter grazier, reducing their price sensitivity to winter grazing costs.
Note: this does not observe the effect of changing supplementary feed cost on the current system, as
insufficient information was available on the purchase of supplementary feed.
Table 47: Sensitivity analysis of changing average supplementary feed price*
*Compared to the current IRR of 7.63% (real), marginal returns of 4.66% (housed) and 9.41% (roofless),
and DOP of $944,217
Milk production
In the proposed systems, there are many assumptions with regards to milk production. When applied to
a practical situation, the resulting production from the shed systems could be much lower than
expected for unforeseen reasons, or contrarily could be higher than assumed. Table 48 shows the effect
of changing production, from a per cow reduction of the assumed production of 50kgMS to an increase
of 10kgMS. The reduction of 50kgMS returns production to a similar level as the current system. These
reductions have a large impact on IRR’s and marginal returns, with a reduction to current production
levels resulting in both the housed and roofless system IRR’s being reduced by over 1% over the 12 year
period. Marginal returns were also affected, with a reduction of 50kgMS/cow causing both proposed
Housed Roofless Housed Roofless Housed Roofless
0.20$ 7.97% 8.59% 10.15% 16.57% $1,061,879 $1,076,563
0.30$ 7.52% 8.12% 6.81% 12.18% $987,340 $1,000,688
0.40$ 7.07% 7.64% 3.34% 7.75% $912,802 $924,812
0.50$ 6.62% 7.17% -0.30% 3.25% $838,263 $848,937
DOPAverage supplement
price ($/kgDM)
Real IRR Marginal IRR

58
systems to have negative marginal returns (-6.04% for housed, and -3.26% for roofless). This also causes
a decrease in DOP of over $200,000, which is well below the current systems production.
The level of production required to ‘break even’ for the investment (which is a marginal return of 0%) is
about 485kgMS/cow for the roofless system, and slightly under 505kgMS/cow in the housed system.
This sensitivity analysis shows that production level is very important to the success of the proposed
systems, with extra milk income required to cover the capital cost of adding the housing structure.
Table 48: Sensitivity analysis of changing milk production
Farm working expenses
Aside from supplementary feed price, total farm working expenses (FWE) will have an effect on the
profitability of the enterprises. Table 49 shows the effect of changing FWE’s on IRR’s, marginal returns
and DOP, with a 10% reduction, and an increase of 10% and 20% analysed. This analysis showed that
changing FWE’s had a large effect on IRR’s and DOP, but did not change the marginal returns between
enterprises, with the roofless system having the best returns for all figures analysed, while the current
and housed systems stayed very similar for all figures.
Table 49: Sensitivity analysis of changing farm working expenses
Extra machinery
In the proposed systems, there has only been a $100,000 expense for farm machinery (for a new loader
tractor), as the housing-incorporated system would use existing farm machinery to feed-out in-shed. In
the situation where the existing machinery is not sufficient to operate in the new system, there would
IRR Marginal IRR DOP
480 (302,400) 5.95% -6.04% $725,814
500 (315,000) 6.47% -1.55% $811,746
520 (327,600) 6.98% 2.64% $897,678
540 (340,200) 7.50% 6.62% $983,610
IRR Marginal IRR DOP
470 (296,100) 6.49% -3.26% $738,330
490 (308,700) 7.02% 1.87% $824,262
510 (321,300) 7.56% 6.91% $910,194
530 (333,900) 8.09% 11.89% $996,126
Housed
Roofless
Milk production:
kgMS per cow (total)
Current Housed Roofless Housed Roofless Current Housed Roofless
-10% 8.44% 7.96% 8.56% 4.78% 9.54% $1,059,870 $1,058,902 $1,071,036
0% 5.82% 5.91% 6.85% 4.66% 9.41% $944,217 $940,644 $953,160
+10% 6.82% 6.52% 7.08% 4.54% 9.28% $828,564 $822,385 $835,284
+20% 6.02% 5.81% 6.35% 4.41% 9.15% $712,912 $704,127 $717,408
Marginal IRR DOPReal IRRFarm Working
Expenses

59
be a greater capital expense for machinery. An example of this increase would be the requirement for a
mixer wagon rather than the existing feed-out wagon, and a higher HP tractor to pull it. Increasing these
machinery costs in $100,000 increments (at a $6.50/kgMS payout) had very little effect on both the
IRR’s for the housed and roofless systems, changing the IRR’s by less than 0.2% over a 12 year period.
Marginal effects were also slightly reduced by approximately 1.5% for both systems, but still remained
positive. There was also minimal effect on DOP, with the tripling of machinery cost changing the DOP by
less than 3%. This shows that even if the cost of machinery was significantly more expensive, it would
have little effect on the rate of return of the business.
Table 50: Sensitivity analysis of increasing machinery costs
6.4.2 Multiple scenario analysis
This section analyses the effect of multiple factors changing simultaneously, and their effect on the
resulting profitability of the proposed systems. There will be two scenario analyses for each proposed
system; ‘all gone right’, where factors influential to the financial viability of the system are adjusted to
their maximum feasible levels, and an ‘all gone wrong’ scenario, where the same factors are minimised.
The changing factors are milk price, supplementary feed cost, milk production, housing structure cost
and interest rates. The DOP, IRR’s and marginal returns after 12 years are the results observed.
Note: these scenarios have been deliberately manipulated to change the factors most influential to the
proposed systems, to see the effects of the ‘best case’ and ‘worst case’ scenarios.
Housed system
In the ‘all gone right’ scenario, milk price was increased to $9.00/kgMS, supplement cost was reduced to
$0.30/kgDM, proposed system milk production was increased to 540kgMS/cow, the housing structure
cost was reduced by $500,000 and interest rates reduced to 4%. When put under these conditions, the
current system IRR increased to 12.84%, but the housed system increased to 13.11%, for a marginal
return of 15.05%. The DOP also increased to $1,920,056 compared to the current systems $1,695,427. In
contrast, when these factors were minimised, with a milk price of $5.00/kgMS, supplementary feed
costs increased to $0.45/kgDM, proposed milk reduction reduced to current levels (480kgMS/cow),
housing structure costs increased to $2,800,000 and interest rates increased to 8%, the current system
showed an IRR of 4.52%, while the housing-incorporated system dropped to 2.58%. This showed a
marginal return of -9.92%. The current systems DOP decreased to $493,491 and the housed systems
Housed Roofless Housed Roofless Housed Roofless
100,000$ 7.24% 7.82% 4.66% 9.41% $940,644 $953,160
200,000$ 7.17% 7.74% 4.20% 8.65% $927,644 $940,160
300,000$ 7.10% 7.67% 3.77% 7.96% $914,644 $927,160
New machinery cost
Real IRR Marginal IRR DOP

60
DOP dropped to $167,852. This shows that the proposed system is more sensitive to changing external
and on-farm factors than the current system, but conversely it is better equipped to capitalise on
improving conditions.
Table 51: 'All gone right' and ‘all gone wrong’ scenario analysis for current and fully housed systems
Roofless system
As detailed above, the factors with the greatest impact on the proposed roofless system were adjusted
to create an ‘all gone right’ and an ‘all gone wrong’ scenario to see its impact on resultant IRR’s and
DOP’s. All adjustments were the same as above, except per cow production was decreased by 10kgMS
across all figures, and the housing structure cost was reduced by $400,000 in the ‘all gone right’
scenario, and increased by $400,000 in the ‘all gone wrong’ scenario. In the ‘all gone right’ scenario, the
roofless system recorded an IRR of 13.99%, with a marginal return of 26.01%, while in the ‘all gone
wrong’ scenario it was reduced to 3.17% with a marginal return of -6.41%. The current system IRR’s
were the same as above. The DOP also varied between the scenarios, with the ‘all gone right’ scenario
showing a DOP of $1,913,404, while the ‘all gone wrong’ scenario had a reduction to $192,895. This
shows that the roofless system is less sensitive to changing external and internal factors than the
housed system, and has much better marginal returns, both under best and worst case scenarios.
Scenario Summary Current Values: All gone right All gone wrong
Changing Cells:
Milk Price ($/kgMS) 6.50$ 9.00$ 5.00$
Supplement cost ($/kgDM) 0.50$ 0.30$ 0.45$
Milk Production (kgMS/cow) 530 540 480
Housing structure cost 2,300,000$ 1,800,000$ 2,800,000$
Interest rates 6% 4% 8%
Result Cells:
Current system DOP $944,217 $1,695,427 $493,491
Housed system DOP $940,644 $1,920,056 $167,852
Current system IRR 7.63% 12.84% 4.52%
Housed system IRR 7.24% 13.40% 2.58%
Marginal IRR's 4.66% 17.44% -9.92%

61
Table 52: 'All gone right' and ‘all gone wrong’ scenario analysis for current and roofless systems
6.5 Other opportunities
The introduction of a housing structure may cause opportunities to arise within the farming system.
These are opportunities that have not been taken into account in this study, but this section will identify
them and their potential future application:
Use of shed as calving tool
Calving is a difficult and important time during the dairy season, and there can be complications with
the current system of cows being calved outdoors, such as the wet and often cold early spring
conditions. With the housing infrastructure, there is potential to develop a calving area in conjunction
with the shed to be used as a calving platform. This would improve the monitoring of calving cows and
give them a more controlled environment in which to calve. Arnold et al. (2009) reported that 34%
respondents to their survey used their housing structure for calving. This would have to be considered
during the construction of the housing structure, as a maternity area would have to be incorporated into
the design of the shed as cows would not be able to safely calve in the free-stall area.
Use of shed as breeding tool
In the confined systems of the Southern United States of America, the housing structures have lockable
head bales which cows put their heads through to eat from the feed lane. This allows the cows to be
locked into these bales, making for ease of observation for mating purposes. They would be fed in the
shed for a period during mating for this purpose, before returning to pasture. This is a potential
opportunity for use in the proposed systems, as minimal extra infrastructure would be required in order
to set this system up, and it could improve mating practices.
Scenario Summary Current Values: All gone right All gone wrong
Changing Cells:
Milk Price ($/kgMS) 6.50$ 9.00$ 5.00$
Supplement cost ($/kgDM) 0.36$ 0.30$ 0.45$
Milk Production (kgMS/cow) 520 530 470
Housing structure cost 1,400,000$ 1,000,000$ 1,800,000$
Interest rates 6% 4% 8%
Result Cells:
Current system DOP $944,217 $1,695,427 $493,491
Roofless system DOP $953,160 $1,913,404 $192,895
Current system IRR 7.63% 12.84% 4.52%
Roofless system IRR 7.82% 13.99% 3.17%
Marginal IRR's 9.41% 26.01% -6.41%

62
Use at different times of the year
The climate in Canterbury is often unpredictable, and unseasonal weather frequently occurs, which can
be detrimental to the farming operation. The housing structure can be used to soften the effects of this
unseasonal weather, and the ability to bring cows inside for protection from unexpected weather could
be an effective risk-mitigation tool. Potential situations where the shed could be utilised are:
During hot summer days for shade from the sun (fully-enclosed structure only)
Out-of-season snow – cows could be removed from the paddock to protect the paddock and
improve cow comfort
In hail, wind or flooding, to reduce the climatic impact on the cows and the cows impact on the
pasture.
Expansion
The number of cows wintered in both proposed systems is 650, with peak milking numbers of 630. The
selected housing structures are designed for a potential capacity of 720 cows. This design was chosen
for increased area per cow, as well as potential for future expansion with the extra capacity to increase
cow numbers. This could result in increased overall production, which could also increase the
profitability of the enterprise and assist in covering the capital cost of the shed. As the housing
structures allow the cows to be contained and fed inside 24/7, there is no limit in the amount of extra
time the cows can spend inside, as long as sufficient feed can be imported to feed them. It is much
easier to intensify with the proposed systems, as the volume of supplementary feed is simply increased
and fed out in-shed, allowing for greater production. It also allows for rapid expansion if conditions
change, for example an increase in milk price could be quickly followed by an increase in supplementary
feed to capitalise on increased prices.
Despite this, Journeaux (2013) modelled two intensification scenarios in his study (Table 3), and
although increasing intensification increased the financial viability of the enterprise, it also increased the
environmental impact of the system. Any intensification of the system has to be approached with
caution for this reason.
Palm Kernel Extract
Palm kernel extract (PKE) is ‘a by-product of the palm oil industry in South East Asia. It is a dry, gritty
meal with low palatability, but with reasonable levels of energy (ME) and protein, and is relatively easy
to introduce to cows over a range of farm systems’ (DairyNZ, 2014). PKE is a commonly used, easily
sourced supplementary feed on Canterbury dairy farms, and has the potential to be fed out as a cheap,
high protein supplementary feed in the housing structure during the winter:

63
Table 53: PKE specifications (DairyNZ, 2014; Winton Stock Feed, 2014)
Due to its high protein, fat and energy content, PKE is an effective feed for putting on cow condition,
and is often used in autumn when cow condition becomes a focus. This would make it fit well into the
potential housed system as a feed used in conjunction with pasture silage to assist in cow condition gain
in autumn and winter. At a cost of $0.31/kgDM, it would also provide feed cost savings as it is
significantly lower cost than pasture silage and lifted/transported fodder beet.
LUDF currently has a ‘no-PKE’ policy for its system due to the bio-security risks that arise from its
importation and for political reasons, but it is a feed that has the potential to be added to the ration fed
in-shed, allowing for improved weight gain performance and a reduction in supplementary feed costs.
Aside from PKE, there are many other alternative feeds that could be researched to see if they can
reduce costs. These include maize silage, lucerne silage, wheat, barley or triticale. An advantage of the
proposed system is that these feeds can be easily interchanged; if one feed were to increase in price
dramatically, another could be selected to fill its place in the ration.
Use of late calving/carry-over cows
As the housing structure provides controlled conditions which allow the extension of lactation, late
calving cows have the potential to be better utilised and milked as long as desired. There is also the
option to continue to milk empty cows and get them back in calf for an autumn calving. This would
result in utilising the cowshed year round, therefore increasing the capital efficiency of the investment.
The financial viability of this practice is dependent on winter premiums for milk, which aren’t necessarily
going to be paid by Fonterra in future. The LUDF may not have the enough scale to produce enough
empty cows to justify running the shed year round, but it is an option for other adopters with greater
cow numbers. Implementing autumn calving does not encourage a tighter calving spread, and could
result in the system becoming increasingly confinement based as less emphasis goes on fertility.
Other investment opportunities
With the substantial capital requirements of building a housing structure, there are opportunity costs
that are forgone to undertake this investment. With the $1.5million roofless structure, and more so with
the $2.4million housed structure, an alternative investment would be to purchase more runoff land, or
PKE
Cost (per tonne) $280
Cost (per kgDM) $0.31
Energy (MJME) 11.0-11.5
Crude Protein (minimum) 16%-18%
Fat (minimum) 10%-13%
Dry Matter 90%

64
extend the dairy platform. This would be investing in an appreciating asset rather than a depreciating
one. At $40,000/ha for runoff land, the roofless structure could purchase 38ha of runoff, and the housed
structure 60ha of runoff. Despite this, investing in extra land may not have the environmental mitigation
effects of the housing structure, and finding a runoff block of correct size which is suitable to the
property and available on the market within budget is unlikely.
6.6 Risks
Lack of previous adopters
The incorporation of fully-enclosed cow barns is a relatively new technique, with the majority of
adopters in colder, wetter climates such as Southland, where there are greater perceived benefits. A
roofless free stall barn for this purpose is yet to be trialled in New Zealand. Any cow barns being
adopted in Canterbury are generally for fully-contained ‘cut and carry’ systems, where the cows are
inside all year round. As the adoption of wintering barns in pasture-based systems is in its infancy in
Canterbury, there is a risk associated with their adoption, as they are currently unproven. There were a
large number of assumptions in this study, any of which may not perform as expected in an actual
situation.
A roofless wintering structure is particularly risky, as there are unpredictable issues that could arise,
such as the wet environment causing metabolic issues, lameness or other management issues such as
the management of increased effluent. Also, staff would need correct training to adapt to the atypical
system.
Production variances
There is significant risk associated with per cow production, as the assumed level of production is reliant
on many beneficial factors that are also assumed throughout the model. If one (or more) of these
beneficial factors don’t occur in the real system, for example there is no increase in pasture production
due to reduced pugging or the increase in effluent application doesn’t have the expected effect, then
milk production will be affected, resulting in the profitability of the system to be compromised.
Feed price sensitivity
In the proposed system, there is an increase in the exposure to external price factors. One of the major
changes in the system is the movement from wintering off-farm to on-farm. Although the majority of
feed for wintering in both cases is to be grown on the LUDF support block, Ashley Dene, by increasing
the amount of grass silage purchased as well as the new requirement to lift and transport fodder beet,
the proposed systems are more vulnerable to external price changes. This is noted in section 6.4, which
shows the effect of increasing feed prices on the IRR’s of the system.

65
Interest rate risk
With the erection of the new housing structure, there will be an increase of the businesses debt levels.
This results in the business being more susceptible to interest rate changes, made particularly risky
considering the housing structures are depreciating assets.
Cow adaption to new system
As well as the human factor that requires learning in the new system, the cows also have to adapt to the
change in their routine. Although reports of barn-adopters say that cows enjoy the housing structures,
there is still an element of cow training that needs to be undertaken. The existing cows have set
routines. There is a risk that certain cows won’t take to the system well, which could result in the culling
of these cows. De Wolde (2006) reported issues with this, including white line disease, thin hooves,
cows lying in alleyways, stress and cows becoming entangled in areas of the structure. He also reported
that most of these problems “sorted themselves out within a period of about ten days.”
Also, with the cows spending the winter inside in the warm, controlled environment, there is the
potential for cows to go ‘soft’ and not want to leave the structure come spring, or have a drop in
performance as they adapt to the return outside. This is a factor that would have to be observed upon
implementation of the system.
Salvage value
Aside from a housing structure being an illiquid asset with minimal salvage value, the influence of the
housing structure on land value also needs to be considered. As shown in Table 43 (section 6.3), the cost
of adding a housing structure on a per hectare basis is $14,931 for the fully enclosed structure, and
$9,553 for the roofless structure, but this capital cost may not be reflected in the overall land value, due
to scepticism within the industry over the use of housing structures. Unlike infrastructure such as the
addition of irrigation, the cost of which is generally reflected in overall land values (i.e. irrigation
infrastructure costing $15,000 a hectare may result in a $20,000 a hectare increase in land values),
housing structures are unlikely to even reflect their depreciated salvage value in overall land values (i.e.
a housing structure erected at a cost of $15,000/ ha may not increase land values). As the housing
structure is built with borrowed funds, this presents a risk in the event of the farm being sold; the
borrowed funds for the housing structure may not be recovered in the sale value. There is a lack of
market data on the subject, due to the adoption of these structures being a relatively new practice and
minimal sales of housing-incorporated farms having occurred.

66
Chapter 7:
Conclusions
This chapter will answer the research questions and discuss the benefits and risks of adopting housing
systems. Section 7.3 will comment on the limitations of the research and section 7.4 will suggest future
research.
From the literature review this dissertation identified a gap in the information surrounding the inclusion
of housing for a Canterbury dairy farm. A hypothesis was developed that suggested: ‘A housing structure
can be incorporated into a Canterbury dairy farming system to reduce N leaching, while maintaining the
economic viability of the system.’ To confirm the hypothesis the following research questions were
formulated.
7.1 Research questions
What is the cost of adding housing structures to the LUDF?
The cost of incorporating a housing structure is outlined in Table 12, with the breakdown of costs on per
cow, per hectare and per milksolid basis detailed in Table 43. A fully-enclosed housing structure, with
effluent facilities would cost $2,392,000, while a similar facility, but roofless would cost $1,529,500.
Table 54: Housing structure costs for housed and roofless systems
How will the profitability of a system with a housing structure incorporated compare to the existing system?
All three systems returned a similar level of economic performance, as measured by an investment
appraisal undertaken to calculate the Internal Rates of Return of the three systems. The roofless system
showed the best Internal Rates of Return, followed by the current system, and then the housed system.
This means the housing structure-incorporated systems can cover the additional capital cost through
indirect productive and cost reduction improvements.
Table 55: Pre finance and tax IRR's for the current and proposed systems
Cost of housing structure Housed Roofless
Total cost 2,390,500$ 1,529,500$
Cost per cow (current) 3,678$ 2,353$
Cost per cow (potential) 3,320$ 2,124$
Cost per effective ha 14,931$ 9,553$
Cost per milksolid 7.16$ 4.67$
Closing values Current Housed System Roofless System
Real IRR 7.63% 7.24% 7.82%

67
How will the proposed system compare to the current system on an environmental basis?
In both proposed systems, the ‘N lost to water’ figure reduced to 24kgN/ha, from 39kgN/ha in the
current system. This represents a 38% reduction in N leaching, which is a significant improvement.
Table 56: N leaching summary for current and proposed systems
Therefore the results of this model confirm the hypothesis that incorporating a housing system for
partial housing in autumn and total housing in winter will reduce nitrogen to water. The dairy operating
profit for the current system and the two proposed systems incorporating housing were similar. An
invest analysis of all three options gave a slight advantage to the roofless system.
7.2 Benefits and risks of system adoption
The incorporation of a housing structure may improve pasture production, increase lactation length and
overall milk production, while reducing fertiliser costs. Significant risks to the viability of the system
include production variances, increased sensitivity to external prices and a lack of adopters and practical
studies on the subject.
LUDF has existing infrastructure and machinery which makes the incorporation of a shed cheaper and
easier: other farms may need extra effluent application equipment, bigger tractors/feed out wagons and
increased land area, which may affect the viability of specific enterprises. Sensitivities to show the effect
of changing infrastructure and machinery requirements were undertaken and concluded that increasing
requirement for extra equipment affected profitability, but the system still remained viable at all
sensitivity levels tested.
Success of the system is due to the high preforming LUDF – with high production per ha and per cow,
the cost of the housing structure is diluted. Other farming systems with lower per cow production may
not get the same returns on the capital.
7.3 Limitations of Research
This research is based on theoretical modelling of both the current system and proposed housing-
incorporated systems. This involved a large number of assumptions about the system, all of which have
a margin of error associated with them. With large numbers of variables being inputted into both
ExcelTM and Overseer®, there is the potential for human error associated with these figures, although
multiple checks of these numbers were undertaken to minimise this error figure, and industry experts
were utilised to validate assumptions. As the study has not been run practically, there could also be
some unaccounted for variables that arise within the system when applied to a commercial dairy farm.
Overseer® summary Current Housed System Roofless System
N lost to water (kg N/ha) 39 24 24

68
In addition, the study was based on a single farm, the Lincoln University Dairy Farm. This is a top
performing, benchmark farm, and so results from this study may not be directly applicable to other dairy
farms around Canterbury. Also, differing sizes of farms will have different management challenges with
the incorporation of sheds as well as higher capital costs. As the success of this model depends on the
current farming system at the LUDF and its level of infrastructure/machinery, results must be viewed in
the context of that particular farm.
The roofless shed is a concept that is yet to be practically tested in New Zealand conditions. This means
the assumptions made for this system were more speculative and have a larger margin of error. The
actual performance of this system in a practical situation could be very different.
7.4 Future Research Topics
As this is a theoretical study, there are many untested assumptions used in order to get an approximate
overview of how the system will perform. The next stage for this line of research would be to practically
test different elements of the housing-incorporated systems.
As stated in section 7.3, there are a number of limiting factors to theoretical studies. To further
reinforce the results of this study, a practical version of the study could be undertaken to see the actual
impact of a housing structure on a whole farm dairy system. A potential location for this study could be
at the Lincoln University farm ‘Ashley Dene’, where there are currently plans in place for the inclusion of
a small-scale research dairy unit with a focus on sustainable farming practices while maintaining
profitability.
The feed rations used in the housing structures for this study were suggested rations that have not been
practically applied. As 19% of total annual ration is consumed in the housing structures, the potential to
optimise this ration to improve productive performance of the cows could justify future research.
In this study, many of the farm system assumptions were kept the same in order to ensure a fair study.
In a practical situation, many of the elements of the whole-farm system will change in order to optimise
the use of the shed. This is a valid line for further research, investigating the potential for intensification
of the system to enhance the economic performance, and better utilise the housing structure asset,
while still remaining environmentally viable.
A variable that is critical to the success of the model is the use of the extra collected effluent. A large
drop in imported fertiliser requirements has been suggested, with the assumption that the extra
effluent will sustain pasture production to the same levels as in the current system. This is a line for
potential research, to investigate the volume and composition of the effluent collected from the housing
structure, and how effective it is for increased pasture production.

69
The use of the housing structure in this model was based on recommendation from industry experts and
previous studies, and no specific rules with regards to the use of the shed were established. A potential
area of future research would be to ‘create decision rules’ on when to use the shed outside of the
proposed times suggested in this project. Examples could include after a certain volume of rain, or when
pasture covers decline significantly over a time period.
As mentioned in section 6.5, there is potential for the housing structure to be used as a calving platform
and for assistance in calf rearing. This is a potential area for future research, into the feasibility to
moving calving inside the housing structures, to ensure an improved start to the season for both cows
and calves, as well as better utilisation of the structure.
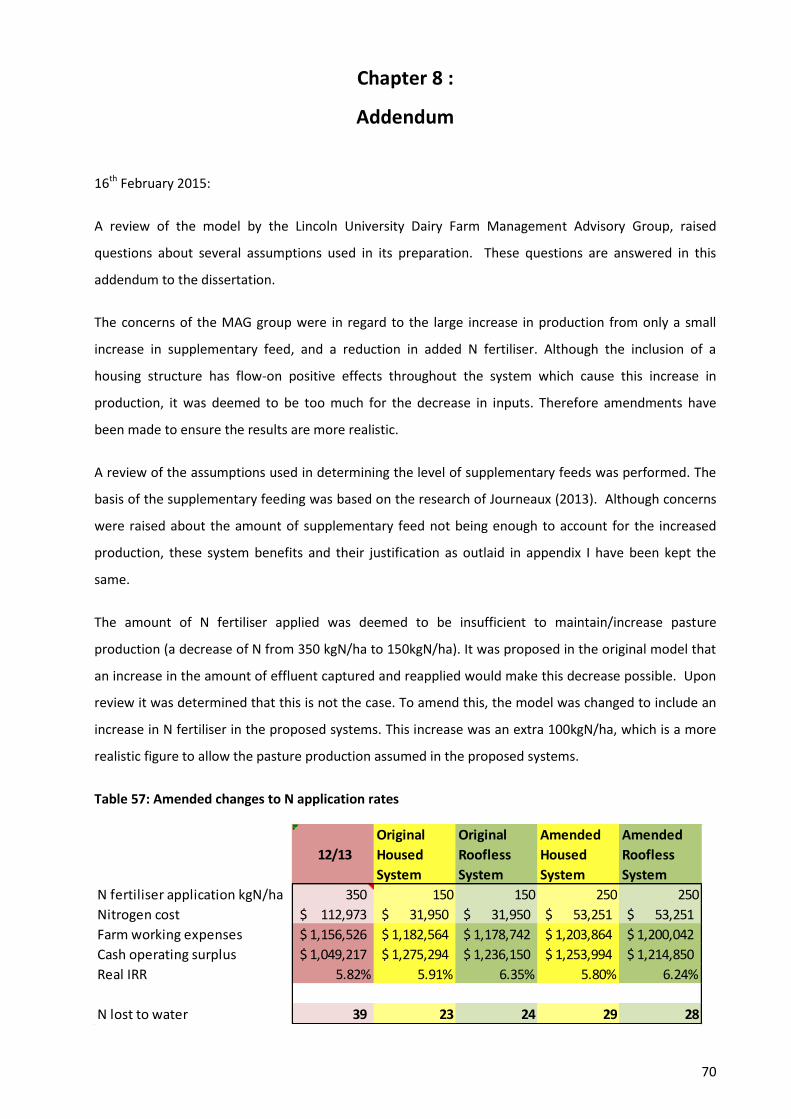
70
Chapter 8 :
Addendum
16th February 2015:
A review of the model by the Lincoln University Dairy Farm Management Advisory Group, raised
questions about several assumptions used in its preparation. These questions are answered in this
addendum to the dissertation.
The concerns of the MAG group were in regard to the large increase in production from only a small
increase in supplementary feed, and a reduction in added N fertiliser. Although the inclusion of a
housing structure has flow-on positive effects throughout the system which cause this increase in
production, it was deemed to be too much for the decrease in inputs. Therefore amendments have
been made to ensure the results are more realistic.
A review of the assumptions used in determining the level of supplementary feeds was performed. The
basis of the supplementary feeding was based on the research of Journeaux (2013). Although concerns
were raised about the amount of supplementary feed not being enough to account for the increased
production, these system benefits and their justification as outlaid in appendix I have been kept the
same.
The amount of N fertiliser applied was deemed to be insufficient to maintain/increase pasture
production (a decrease of N from 350 kgN/ha to 150kgN/ha). It was proposed in the original model that
an increase in the amount of effluent captured and reapplied would make this decrease possible. Upon
review it was determined that this is not the case. To amend this, the model was changed to include an
increase in N fertiliser in the proposed systems. This increase was an extra 100kgN/ha, which is a more
realistic figure to allow the pasture production assumed in the proposed systems.
Table 57: Amended changes to N application rates
12/13
Original
Housed
System
Original
Roofless
System
Amended
Housed
System
Amended
Roofless
System
N fertiliser application kgN/ha 350 150 150 250 250
Nitrogen cost 112,973$ 31,950$ 31,950$ 53,251$ 53,251$
Farm working expenses 1,156,526$ 1,182,564$ 1,178,742$ 1,203,864$ 1,200,042$
Cash operating surplus 1,049,217$ 1,275,294$ 1,236,150$ 1,253,994$ 1,214,850$
Real IRR 5.82% 5.91% 6.35% 5.80% 6.24%
N lost to water 39 23 24 29 28

71
This change in the level of nitrogen applied influenced both the environmental and economic results.
The extra fertiliser application incurred additional costs for the farm working expenses, as well as
influencing the resultant N leaching from the system. The areas of the model that were influenced have
been identified, and are displayed in Table 57. While there is minimal effect on the economic results
(the real IRR for both proposed scenarios changed by 0.11%), it does have a significant effect on the
OverseerTM results. The ‘N lost to water figure’ increased from 23 to 29 in the fully housed system and
from 24 to 28 in the roofless system. This was due to the greater level of N being applied to the soil, and
thus a greater amount of N in the soil profile resulting in more lost through drainage. Despite this
increase, the figures still present a reduction on the existing system, with reductions of approximately
30%.
Summary:
Increasing nitrogen applications by 100 kgN/ha increased N leaching by 26% for the fully housed system
and 17% for the roofless system, but this is still an improvement on levels of leached in the base year of
39 kgN/ha.
The additional nitrogen increased farm working expenses by $21,300 and decreased the cash operating
surplus accordingly. This change had a minimal effect on the IRR.

72
References
Arnold, N. A., Verkerk, G. A., Gregory, R., & Matthews, L. R. (2009). Identification of potential impacts of
New Zealand dairy housing systems on dairy cow welfare. Proceedings of the New Zealand
Society of Animal Production, 69, 54-56.
Beukes, P. C., Gregorini, P., Romera, A. J., & Dalley, D. E. (2011). The profitability and risk of dairy cow
wintering strategies in the Southland region of New Zealand. Agricultural Systems, 104(7), 541-
550.
Bradley, D., Denley, W., Henderson, A., Hoffmann, P., Jenkins, C., & Kitson, J. (2011). Our Threats: How
safe are we from floods, droughts and other extreme climate events? Report on the State of
Southland's Freshwater Environment, 4.
Chadwick, D. R., Ledgard, S. F., & Brown, L. (2002). Nitrogen flows and losses in dairy farms in New
Zealand and the UK: Effects of grazing management.
Christensen, C. L., Hanly, J. A., Hedley, M. J., & Horne, D. J. (2010). Reducing nitrate leaching losses by
using duration-controlled grazing of dairy cows. World Congress of Soil Science, Soil Solutions for
a Changing World, 19th.
Cottier, R. (2000). The Winter: the Alternatives. Side website: Farmwise.
DairyNZ. (2014). Palm Kernel Extract (PKE). Retrieved 31/10, 2014, from
http://www.dairynz.co.nz/feed/supplements/supplement-types/palm-kernel-extract-pke/
DairyNZ Limited. (2011). GoDairy. Retrieved 25/09/2014, from http://www.godairy.co.nz/the-big-
picture/facts-and-figures
Dalley, D. E. (2011). The challenges of animal wintering from a sustainability perspective. Proceedings of
the New Zealand Society of Animal Production, 71, 172-175.
Dalley, D. E. (2013). Southern Wintering Systems: DairyNZ.
de Klein, C. A. M. (2001). An analysis of environmental and economic implications of nil and restricted
grazing systems designed to reduce nitrate leaching from New Zealand dairy farms. II. Pasture
production and cost/benefit analysis. New Zealand Journal of Agricultural Research, 44(2-3),
217-235. doi: 10.1080/00288233.2001.9513479
de Klein, C. A. M., & Ledgard, S. F. (2001). An analysis of environmental and economic implications of nil
and restricted grazing systems designed to reduce nitrate leaching from New Zealand dairy
farms. I. Nitrogen losses. New Zealand Journal of Agricultural Research, 44(2-3), 201-215. doi:
10.1080/00288233.2001.9513478
de Klein, C. A. M., Paton, J., & Ledgard, S. (2000). An evaluation of a strategic de-stocking regime for
dairying to improve nitrogen efficiency and reduce nitrate leaching from dairy farms in nitrate-
sensitive areas. Proceedings of the New Zealand Grassland Association, 62, 105-110.

73
De Wolde, A. (2006). An alternative wintering system for Southland. (Master of Professional Studies),
Lincoln University.
Di, H. J., & Cameron, K. C. (2002). Nitrate leaching in temperate agroecosystems: sources, factors and
mitigating strategies. Nutrient Cycling in Agroecosystems, 64(3), 237-256. doi:
10.1023/a:1021471531188
Di, H. J., Cameron, K. C., Moore, S., & Smith, N. P. (1998). Nitrate leaching from dairy shed effluent and
ammonium fertiliser applied to a free-draining pasture soil under spray or flood irrigation. New
Zealand Journal of Agricultural Research, 41(2), 263-270.
Environment Canterbury. (2014). Selwyn - Waihora the focus of Variation 1 of Land & Water Regional
Plan. Retrieved 21/4/2014 http://ecan.govt.nz/news-and-notices/news/Pages/sw-focus-on-
variation-lwrp.aspx
Fonterra. (2013). Farmgate Milk Prices. from
http://www.fonterra.com/nz/en/Financial/Farmgate+Milk+Price
Glass, C. (2013). LUDF Overseer Report: Ravensdown.
Hockings, B. (2012, March). The pros and cons of putting cows in barns. Dairy Exporter, 146-147.
IRD. (2014a). Business Tax Rates. Retrieved 18/4, 2014, from http://www.ird.govt.nz/business-income-
tax/paying-tax/tax-rates/bit-taxrates-companytax.html
IRD. (2014b). Inland Revenue Depreciation Rates. from http://www.ird.govt.nz/technical-
tax/determinations/depreciation/cirs-table-of-dep-rates.html
IRD. (2014c). Inland Revenue Livestock Tax Values. from http://www.ird.govt.nz/technical-
tax/determinations/livestock/national-averages/livestock-nationalavemarketvalues-2014.html
Journeaux, P. (2013). Economic Analysis on the Value of Winter Housing for Dairy Farming in Tararua
District. Paper presented at the New Zealand Agricultural & Resource Economics Society (inc)
Conference, Lincoln University.
Ledgard, S. F., Klein, C. A. M. d., Crush, J. R., & Thorrold, B. S. (2000). Dairy farming, nitrogen losses and
nitrate-sensitive areas. Proceedings of the New Zealand Society of Animal Production, 60, 256-
260.
Lucas, S. (2013). Farm Visit Notes: Macfarlane Rural Business.
Massey University. (2013). Dairy Effluent Storage Calculator. Retrieved from
http://flrc.massey.ac.nz/FDE.html
Monaghan, R. M. (2012). The impacts of animal wintering on water and soil quality. Environment
Southland.
Monaghan, R. M., de Klein, C. A. M., Smeaton, D., Stevens, D. R., Hyslop, M. G., & Drewry, J. J. (2004).
The environmental and economic performance of dairy systems within the four Best Practice
Dairy Catchments: FertResearch.
MPI. (2014). Dairy. Retrieved 25/9/2014, from http://www.mpi.govt.nz/agriculture/pastoral/dairy.aspx

74
MPI, FANZ, & AgResearch. (2013). Overseer 6. from http://www.overseer.org.nz/
NZIPIM. (2014). Pannetts Dairies Ltd - Introduction to Free Stall Dairy Housing in Canterbury: New
Zealand Institute of Primary Industry Management.
NZX. (2014). Fonterra Shareholders Fund (FSF). Retrieved 3rd October, 2014, from
https://www.nzx.com/markets/NZSX/securities/FSF
O'Driscoll, K., Boyle, L., French, P., Meaney, B., & Hanlon, A. (2008). The effect of out-wintering pad
somatic cell score and mastitis design on dirtiness score, incidence in dairy cows. Animal, 2(6),
912-920. doi: 10.1017/s1751731108001882
Pellow, R. (2014). Personal Communication. SIDDC.
Ravensdown. (2014a). Superphosphate Properties. Retrieved 30th September, 2014, from
http://www.ravensdown.co.nz/nz/products/pages/fertiliser/arable-and-
pastoral/superphosphate.aspx
Ravensdown. (2014b). Urea Properties. Retrieved 30th September, 2014, from
http://www.ravensdown.co.nz/nz/products/Pages/fertiliser/arable-and-pastoral/urea.aspx
Reserve Bank of New Zealand. (2014). Inflation. from
http://www.rbnz.govt.nz/statistics/key_graphs/inflation/
SIDDC. (2014). LU Dairy Farm. from http://www.siddc.org.nz/lu-dairy-farm/
Silva, R. G., Cameron, K. C., Di, H. J., & Hendry, T. (1999). A lysimeter study of the impact of cow urine,
dairy shed effluent, and nitrogen fertiliser on nitrate leaching. Australian Journal of Soil
Research, 37, 357-369.
Thorrold, B. S. (2000). Environmental Impacts of Wintering Systems. Hamilton: AgResearch.
Trafford, G., & Trafford, S. (2011). Farm Technical Manual. Lincoln University, Christchurch, New
Zealand.
Van der Molen, D. T., Breeuwsma, A., & Boers, P. C. M. (1998). Agricultural nutrient losses to surface
water in the Netherlands: Impact, strategies, and perspectives. Journal of Environmental
Quality, 27(1), 4-11.
Westpac. (2014). Agribusiness. Retrieved 29/10, 2014, from http://www.westpac.co.nz/agribusiness/
Winton Stock Feed. (2014). Palm Kernel Expeller. from
http://www.wintonstockfeed.co.nz/products/palm-kernel/
World Health Organization. (1984). Guidelines for drinking water quality, recommendations (Vol. 1):
WHO, Geneva, Switzerland.

75
Personal Communication
Benton, A. (2014). Personal communication. Fodder beet costings. Amuri Dairying Ltd.
Ellesmere Agriculture Ltd. (2014). Personal communication. Pasture silage costings.
Green, T. (2014). Personal communication. 720 cow wintering barn. REL group.
Lees, N. (2014). Personal communication. MGMT 340 lectures. Lincoln University.
Lotter, M. (2014). Personal communication. Effluent system design. Plucks Engineering.
Pellow, R. (2014). Personal Communication. Lincoln University Dairy Farm. SIDDC.
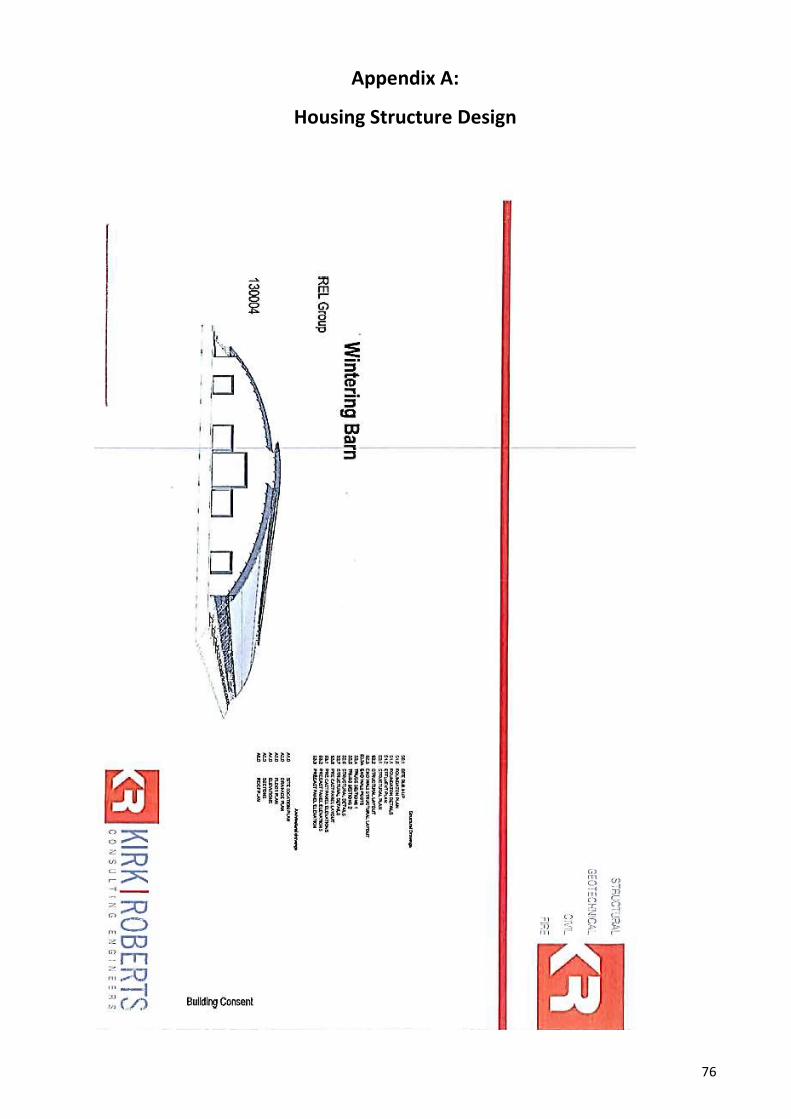
76
Appendix A:
Housing Structure Design

77

78
Note: Appendix A is a schematic plan of a potential housing structure, the version shown is a 526 cow
structure.
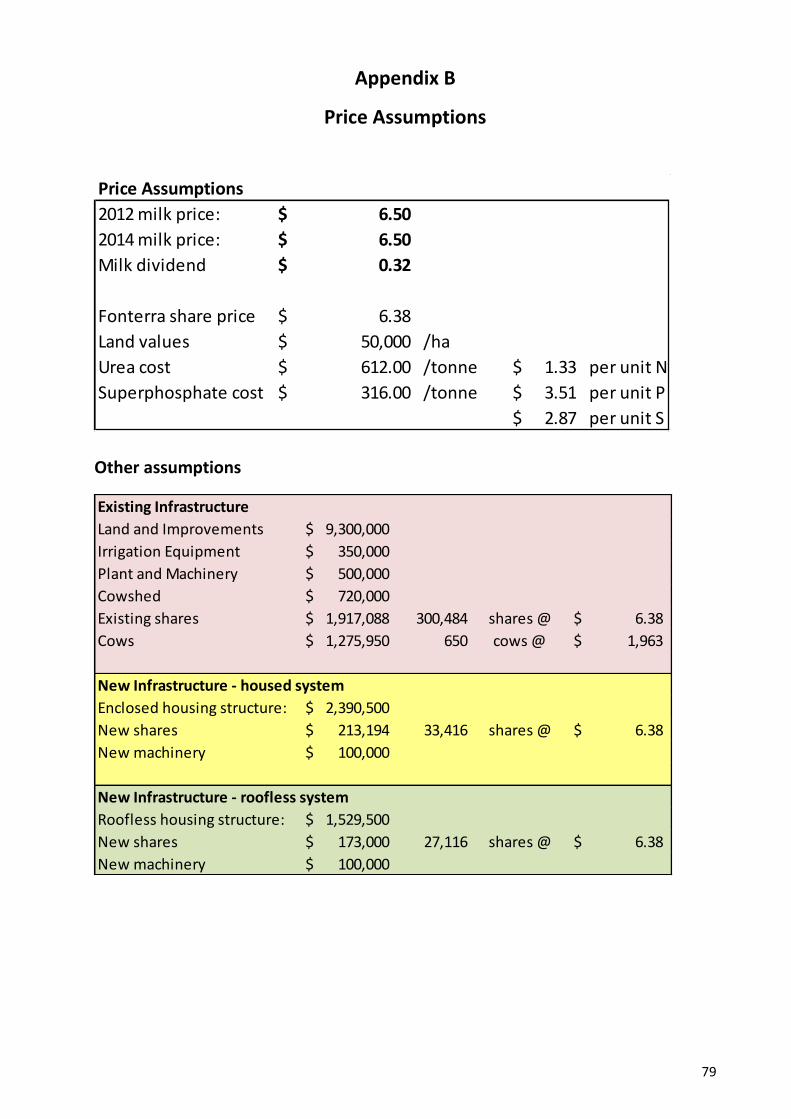
79
Appendix B
Price Assumptions
Other assumptions
Price Assumptions
2012 milk price: 6.50$
2014 milk price: 6.50$
Milk dividend 0.32$
Fonterra share price 6.38$
Land values 50,000$ /ha
Urea cost 612.00$ /tonne 1.33$ per unit N
Superphosphate cost 316.00$ /tonne 3.51$ per unit P
2.87$ per unit S
Existing Infrastructure
Land and Improvements 9,300,000$
Irrigation Equipment 350,000$
Plant and Machinery 500,000$
Cowshed 720,000$
Existing shares 1,917,088$ 300,484 shares @ 6.38$
Cows 1,275,950$ 650 cows @ 1,963$
New Infrastructure - housed system
Enclosed housing structure: 2,390,500$
New shares 213,194$ 33,416 shares @ 6.38$
New machinery 100,000$
New Infrastructure - roofless system
Roofless housing structure: 1,529,500$
New shares 173,000$ 27,116 shares @ 6.38$
New machinery 100,000$

80
Funding assumptions
Depreciation assumptions
Funding Depreciation rates
Existing loan: Machinery: 13%
-$ Centre pivots 20%
5% per annum (Ammortised) Cowshed 6%
Housing structure 6%
New loan (housed):
2,703,694$
6% per annum (Interest only)
New loan (roofless):
1,802,500$
6% per annum (Interest only)

81
Appendix C
System Details
Current Housed System Roofless System
Effective area (Dairy platform, ha) 160.1 160.1 160.1
Total area (ha) 186.0 186.0 186.0
Effluent area (ha) 34 128 128
1st July cow numbers 650 650 650
Peak cows milked 630 630 630
Stocking rate 3.94 3.94 3.94
Lactation length (days) 273 305 300
Breed Crossbred Crossbred Crossbred
Replacement rate 21% 18% 18%
Liveweight (kg) 477 500 500
Total MS production 300,484 333,900 327,600
kgMS/ha 1,877 2086 2046
kgMS/cow 477 530 520
kgMS/kg liveweight 1.00 1.06 1.04
N fertiliser application kgN/ha 350 150 150
% imported feed 21% 19% 19%
Rainfall (mm) 666 666 666
Planned start of calving 3-Aug 3-Aug 3-Aug
BCS at PSC 5.1 5.1 5.1
Dry-off date 20-May 1-Jul 20-Jun
Wintering
Wintered off - June 100% 0% 0%
Wintered off - July 100% 0% 0%
Fodder beet (tDM) - 255 259
Pasture silage (tDM) - 167 167
Total wintering feed (tDM) 535 422 426
Lactation supplements
Fodder beet (tDM) 0 195 200
Pasture silage (tDM) 273 129 133
Imported supplement tonnes/cow 0.43 0.51 0.53
Total imported lactation supplement (tDM) 273 324 333
Total Supplements
Fodder beet (tDM) - 449 459
Pasture silage (tDM) - 296 300
Current total imported feed (tDM) 809 745 759
Total imported feed (tonnes/cow) 1.28 1.18 1.20
Current home-grown feed eaten tDM/cow 4.81 5.00 5.00
Current home-grown feed eaten tDM/ha 16.8 17.5 17.5
Total feed tDM/cow 6.09 6.18 6.20
Total feed (tDM) 3,498 3,543 3,556
N leached kgN/ha 39 24 24
82
Appendix D
Annual Budget
*Gibberellin cost has Eco-N portion removed due to regulatory changes since 2012/13
Year ending May 31Current
per kgMS
Housed
System per kgMS
Roofless
System per kgMS
Total Milk production (kgMS) 300,484 333,900 327,600
Milk Prod / ha kgMS/ha 1,877 2,086 2,046
Peak Cow Nos and Prod. 630 630 630
Staff 3.7 4.2 4.2
Income Milksolid Payout $/kgMS 6.50$ 6.50$ 6.50$
Dividend /share 0.32$ 0.32$ 0.32$
Milksolid Revenue 1,953,146$ 6.50$ 2,170,350$ 6.50$ 2,129,400$ 6.50$
Dividend 96,000$ 0.32$ 106,848$ 0.32$ 104,832$ 0.32$
Surplus dairy stock 182,337$ 0.61$ 206,400$ 0.62$ 206,400$ 0.63$
Stock Purchases 25,740-$ 0.09-$ 25,740-$ 0.08-$ 25,740-$ 0.08-$
Gross Farm Revenue 2,205,743$ 7.34$ 2,457,858$ 7.36$ 2,414,892$ 7.37$
Expenses
Cow Costs Animal Health 60,886$ 0.20$ 60,886$ 0.18$ 60,886$ 0.19$
Breeding Expenses 51,644$ 0.17$ 45,000$ 0.13$ 47,000$ 0.14$
Replacement grazing & meal 163,852$ 0.55$ 163,852$ 0.49$ 163,852$ 0.50$
Winter grazing - Herd incl. freight 137,904$ 0.46$ -$ -$ -$ -$
Feed Grass silage purchased 93,492$ 0.31$ 108,523$ 0.33$ 110,117$ 0.34$
Fodder beet purchased -$ -$ 161,789$ 0.48$ 165,036$ 0.50$
Silage making & delivery 9,087$ 0.03$ 9,087$ 0.03$ 9,087$ 0.03$
Gibberellin* 30,000$ 0.10$ 30,000$ 0.09$ 30,000$ 0.09$
Nitrogen 112,973$ 0.38$ 31,950$ 0.10$ 31,950$ 0.10$
Fertiliser & Lime 33,288$ 0.11$ 15,992$ 0.05$ 15,992$ 0.05$
Irrigation - All Costs 55,471$ 0.18$ 55,471$ 0.17$ 55,471$ 0.17$
Re-grassing 14,790$ 0.05$ 14,790$ 0.04$ 14,790$ 0.05$
Staff Employment 217,865$ 0.73$ 238,865$ 0.72$ 238,865$ 0.73$
Land Electricity-farm 27,049$ 0.09$ 40,000$ 0.12$ 32,000$ 0.10$
Administration 21,528$ 0.07$ 21,528$ 0.06$ 21,528$ 0.07$
Freight & Cartage 89$ 0.00$ 89$ 0.00$ 89$ 0.00$
Rates & Insurance 21,020$ 0.07$ 25,000$ 0.07$ 25,000$ 0.08$
Repairs & Maintenance 61,766$ 0.21$ 105,990$ 0.32$ 103,827$ 0.32$
Shed Expenses excl. power 7,560$ 0.03$ 8,500$ 0.03$ 8,000$ 0.02$
Vehicle Expenses 34,922$ 0.12$ 43,931$ 0.13$ 43,931$ 0.13$
Weed & Pest 1,340$ 0.00$ 1,340$ 0.00$ 1,340$ 0.00$
Cash Farm Working Expenses 1,156,526$ 3.85$ 1,182,584$ 3.54$ 1,178,762$ 3.60$
FWE/kgMS 3.85$ - 3.54$ - 3.60$ -
Depreciation est. 105,000$ 0.35$ 334,630$ 1.00$ 282,970$ 0.86$
Total Operating Expenses 1,261,526$ 4.20$ 1,517,214$ 4.54$ 1,461,732$ 4.46$
Dairy Operating Profit (DOP) 944,217$ 3.14$ 940,644$ 2.82$ 953,160$ 2.91$
DOP/ha 5,898$ - 5,875$ - 5,954$ -
Cash Operating Surplus (or EBIT) 1,049,217$ 3.49$ 1,275,274$ 3.82$ 1,236,130$ 3.77$

83
Appendix E
Investment Appraisal
Current system

84

85
Proposed housing structure-incorporated system

86

87
Proposed roofless structure-incorporated system

88

89
Marginal returns

90

91
Appendix F
Depreciation Schedules
Current system
Proposed housing structure-incorporated system
Item Machinery Item Centre Pivots Item Cowshed
Opening 500,000 Opening 350,000 Opening 720,000
DV rate 13% DV rate 20% DV rate 6% Total
Dep.
Years Opening Dep. Closing Years Opening Dep. Closing Years Opening Dep. Closing Years
1 500,000 -65,000 435,000 1 350,000 -70,000 280,000 1 720,000 -43,200 676,800 1 -178,200
2 435,000 -56,550 378,450 2 280,000 -56,000 224,000 2 676,800 -40,608 636,192 2 -153,158
3 378,450 -49,199 329,252 3 224,000 -44,800 179,200 3 636,192 -38,172 598,020 3 -132,170
4 329,252 -42,803 286,449 4 179,200 -35,840 143,360 4 598,020 -35,881 562,139 4 -114,524
5 286,449 -37,238 249,210 5 143,360 -28,672 114,688 5 562,139 -33,728 528,411 5 -99,639
6 249,210 -32,397 216,813 6 114,688 -22,938 91,750 6 528,411 -31,705 496,706 6 -87,040
7 216,813 -28,186 188,627 7 91,750 -18,350 73,400 7 496,706 -29,802 466,904 7 -76,338
8 188,627 -24,522 164,106 8 73,400 -14,680 58,720 8 466,904 -28,014 438,890 8 -67,216
9 164,106 -21,334 142,772 9 58,720 -11,744 46,976 9 438,890 -26,333 412,556 9 -59,411
10 142,772 -18,560 124,212 10 46,976 -9,395 37,581 10 412,556 -24,753 387,803 10 -52,709
11 124,212 -16,148 108,064 11 37,581 -7,516 30,065 11 387,803 -23,268 364,535 11 -46,932
12 108,064 -14,048 94,016 12 30,065 -6,013 24,052 12 364,535 -21,872 342,663 12 -41,933
Item Machinery Item Centre Pivots Item Cowshed
Opening 500,000 Opening 350,000 Opening 720,000
DV rate 13% DV rate 20% DV rate 6%
Years Opening Dep. Closing Years Opening Dep. Closing Years Opening Dep. Closing
1 500,000 -65,000 435,000 1 350,000 -70,000 280,000 1 720,000 -43,200 676,800
2 435,000 -56,550 378,450 2 280,000 -56,000 224,000 2 676,800 -40,608 636,192
3 378,450 -49,199 329,252 3 224,000 -44,800 179,200 3 636,192 -38,172 598,020
4 329,252 -42,803 286,449 4 179,200 -35,840 143,360 4 598,020 -35,881 562,139
5 286,449 -37,238 249,210 5 143,360 -28,672 114,688 5 562,139 -33,728 528,411
6 249,210 -32,397 216,813 6 114,688 -22,938 91,750 6 528,411 -31,705 496,706
7 216,813 -28,186 188,627 7 91,750 -18,350 73,400 7 496,706 -29,802 466,904
8 188,627 -24,522 164,106 8 73,400 -14,680 58,720 8 466,904 -28,014 438,890
9 164,106 -21,334 142,772 9 58,720 -11,744 46,976 9 438,890 -26,333 412,556
10 142,772 -18,560 124,212 10 46,976 -9,395 37,581 10 412,556 -24,753 387,803
11 124,212 -16,148 108,064 11 37,581 -7,516 30,065 11 387,803 -23,268 364,535
12 108,064 -14,048 94,016 12 30,065 -6,013 24,052 12 364,535 -21,872 342,663

92
Proposed roofless structure-incorporated system
Item Housing barn Item New machinery
Opening 2,390,500 Opening 100,000
DV rate 6% DV rate 13% Total
Dep.
Years Opening Dep. Closing Years Opening Dep. Closing Years
1 2,390,500 -143,430 2,247,070 1 100,000 -13,000 87,000 1 -334,630
2 2,247,070 -134,824 2,112,246 2 87,000 -11,310 75,690 2 -299,292
3 2,112,246 -126,735 1,985,511 3 75,690 -9,840 65,850 3 -268,744
4 1,985,511 -119,131 1,866,380 4 65,850 -8,561 57,290 4 -242,215
5 1,866,380 -111,983 1,754,398 5 57,290 -7,448 49,842 5 -219,069
6 1,754,398 -105,264 1,649,134 6 49,842 -6,479 43,363 6 -198,783
7 1,649,134 -98,948 1,550,186 7 43,363 -5,637 37,725 7 -180,923
8 1,550,186 -93,011 1,457,175 8 37,725 -4,904 32,821 8 -165,131
9 1,457,175 -87,430 1,369,744 9 32,821 -4,267 28,554 9 -151,108
10 1,369,744 -82,185 1,287,559 10 28,554 -3,712 24,842 10 -138,606
11 1,287,559 -77,254 1,210,306 11 24,842 -3,230 21,613 11 -127,415
12 1,210,306 -72,618 1,137,688 12 21,613 -2,810 18,803 12 -117,361
Item Machinery Item Centre Pivots Item Cowshed
Opening 500,000 Opening 350,000 Opening 720,000
DV rate 13% DV rate 20% DV rate 6%
Years Opening Dep. Closing Years Opening Dep. Closing Years Opening Dep. Closing
1 500,000 -65,000 435,000 1 350,000 -70,000 280,000 1 720,000 -43,200 676,800
2 435,000 -56,550 378,450 2 280,000 -56,000 224,000 2 676,800 -40,608 636,192
3 378,450 -49,199 329,252 3 224,000 -44,800 179,200 3 636,192 -38,172 598,020
4 329,252 -42,803 286,449 4 179,200 -35,840 143,360 4 598,020 -35,881 562,139
5 286,449 -37,238 249,210 5 143,360 -28,672 114,688 5 562,139 -33,728 528,411
6 249,210 -32,397 216,813 6 114,688 -22,938 91,750 6 528,411 -31,705 496,706
7 216,813 -28,186 188,627 7 91,750 -18,350 73,400 7 496,706 -29,802 466,904
8 188,627 -24,522 164,106 8 73,400 -14,680 58,720 8 466,904 -28,014 438,890
9 164,106 -21,334 142,772 9 58,720 -11,744 46,976 9 438,890 -26,333 412,556
10 142,772 -18,560 124,212 10 46,976 -9,395 37,581 10 412,556 -24,753 387,803
11 124,212 -16,148 108,064 11 37,581 -7,516 30,065 11 387,803 -23,268 364,535
12 108,064 -14,048 94,016 12 30,065 -6,013 24,052 12 364,535 -21,872 342,663
93
Item Roofless shed Item New machinery
Opening 1,529,500 Opening 100,000
DV rate 6% DV rate 13% Total
Dep.
Years Opening Dep. Closing Years Opening Dep. Closing Years
1 1,529,500 -91,770 1,437,730 1 100,000 -13,000 87,000 1 -282,970
2 1,437,730 -86,264 1,351,466 2 87,000 -11,310 75,690 2 -250,732
3 1,351,466 -81,088 1,270,378 3 75,690 -9,840 65,850 3 -223,098
4 1,270,378 -76,223 1,194,156 4 65,850 -8,561 57,290 4 -199,307
5 1,194,156 -71,649 1,122,506 5 57,290 -7,448 49,842 5 -178,736
6 1,122,506 -67,350 1,055,156 6 49,842 -6,479 43,363 6 -160,869
7 1,055,156 -63,309 991,846 7 43,363 -5,637 37,725 7 -145,285
8 991,846 -59,511 932,336 8 37,725 -4,904 32,821 8 -131,631
9 932,336 -55,940 876,396 9 32,821 -4,267 28,554 9 -119,618
10 876,396 -52,584 823,812 10 28,554 -3,712 24,842 10 -109,005
11 823,812 -49,429 774,383 11 24,842 -3,230 21,613 11 -99,590
12 774,383 -46,463 727,920 12 21,613 -2,810 18,803 12 -91,206

94
Appendix G
Loan Schedules
Proposed housing structure-incorporated system
Interest Only Loan -2,703,694
Years 12
Rate 6%
Pmt 162,222 Total Total
Principle Interest
Years Opening Principle Interest Closing Check Years
1 -2,703,694 0 162,222 -2,703,694 162,222 1 0 162,222
2 -2,703,694 0 162,222 -2,703,694 162,222 2 0 162,222
3 -2,703,694 0 162,222 -2,703,694 162,222 3 0 162,222
4 -2,703,694 0 162,222 -2,703,694 162,222 4 0 162,222
5 -2,703,694 0 162,222 -2,703,694 162,222 5 0 162,222
6 -2,703,694 0 162,222 -2,703,694 162,222 6 0 162,222
7 -2,703,694 0 162,222 -2,703,694 162,222 7 0 162,222
8 -2,703,694 0 162,222 -2,703,694 162,222 8 0 162,222
9 -2,703,694 0 162,222 -2,703,694 162,222 9 0 162,222
10 -2,703,694 0 162,222 -2,703,694 162,222 10 0 162,222
11 -2,703,694 0 162,222 -2,703,694 162,222 11 0 162,222
12 -2,703,694 0 162,222 -2,703,694 162,222 12 0 162,222
13 -2,703,694 0 162,222 -2,703,694 162,222 13 0 162,222
14 -2,703,694 0 162,222 -2,703,694 162,222 14 0 162,222
15 -2,703,694 0 162,222 -2,703,694 162,222 15 0 162,222
16 -2,703,694 0 162,222 -2,703,694 162,222 16 0 162,222
17 -2,703,694 0 162,222 -2,703,694 162,222 17 0 162,222
18 -2,703,694 0 162,222 -2,703,694 162,222 18 0 162,222
19 -2,703,694 0 162,222 -2,703,694 162,222 19 0 162,222
20 -2,703,694 0 162,222 -2,703,694 162,222 20 0 162,222
21 -2,703,694 0 162,222 -2,703,694 162,222 21 0 162,222
22 -2,703,694 0 162,222 -2,703,694 162,222 22 0 162,222
23 -2,703,694 0 162,222 -2,703,694 162,222 23 0 162,222
24 -2,703,694 0 162,222 -2,703,694 162,222 24 0 162,222
25 -2,703,694 0 162,222 -2,703,694 162,222 25 0 162,222
26 -2,703,694 0 162,222 -2,703,694 162,222 26 0 162,222
27 -2,703,694 0 162,222 -2,703,694 162,222 27 0 162,222
28 -2,703,694 0 162,222 -2,703,694 162,222 28 0 162,222
29 -2,703,694 0 162,222 -2,703,694 162,222 29 0 162,222
30 -2,703,694 0 162,222 -2,703,694 162,222 30 0 162,222

95
Proposed roofless structure-incorporated system
Interest Only Loan -1,802,500
Years 12
Rate 6%
Pmt 108,150 Total Total
Principle Interest
Years Opening Principle Interest Closing Check Years
1 -1,802,500 0 108,150 -1,802,500 108,150 1 0 108,150
2 -1,802,500 0 108,150 -1,802,500 108,150 2 0 108,150
3 -1,802,500 0 108,150 -1,802,500 108,150 3 0 108,150
4 -1,802,500 0 108,150 -1,802,500 108,150 4 0 108,150
5 -1,802,500 0 108,150 -1,802,500 108,150 5 0 108,150
6 -1,802,500 0 108,150 -1,802,500 108,150 6 0 108,150
7 -1,802,500 0 108,150 -1,802,500 108,150 7 0 108,150
8 -1,802,500 0 108,150 -1,802,500 108,150 8 0 108,150
9 -1,802,500 0 108,150 -1,802,500 108,150 9 0 108,150
10 -1,802,500 0 108,150 -1,802,500 108,150 10 0 108,150
11 -1,802,500 0 108,150 -1,802,500 108,150 11 0 108,150
12 -1,802,500 0 108,150 -1,802,500 108,150 12 0 108,150
13 -1,802,500 0 108,150 -1,802,500 108,150 13 0 108,150
14 -1,802,500 0 108,150 -1,802,500 108,150 14 0 108,150
15 -1,802,500 0 108,150 -1,802,500 108,150 15 0 108,150
16 -1,802,500 0 108,150 -1,802,500 108,150 16 0 108,150
17 -1,802,500 0 108,150 -1,802,500 108,150 17 0 108,150
18 -1,802,500 0 108,150 -1,802,500 108,150 18 0 108,150
19 -1,802,500 0 108,150 -1,802,500 108,150 19 0 108,150
20 -1,802,500 0 108,150 -1,802,500 108,150 20 0 108,150
21 -1,802,500 0 108,150 -1,802,500 108,150 21 0 108,150
22 -1,802,500 0 108,150 -1,802,500 108,150 22 0 108,150
23 -1,802,500 0 108,150 -1,802,500 108,150 23 0 108,150
24 -1,802,500 0 108,150 -1,802,500 108,150 24 0 108,150
25 -1,802,500 0 108,150 -1,802,500 108,150 25 0 108,150
26 -1,802,500 0 108,150 -1,802,500 108,150 26 0 108,150
27 -1,802,500 0 108,150 -1,802,500 108,150 27 0 108,150
28 -1,802,500 0 108,150 -1,802,500 108,150 28 0 108,150
29 -1,802,500 0 108,150 -1,802,500 108,150 29 0 108,150
30 -1,802,500 0 108,150 -1,802,500 108,150 30 0 108,150

96
Appendix H
Proposed system costs
Current and proposed system supplementary feed consolidation
Wintering barn feed
Feed cost: DM % $/kgDM Portion of ration
Fodderbeet ($/tonne,
lifted and delivered)$72 20% 0.36$ 60%
Pasture silage ($/tonne,
wet)$110 30% 0.37$ 40%
Feed
utilisation95%
Time in barn
Percentage
feeding in-
shed
Feeding level
(kgDM/day) Silage Beet Silage Beet Silage Beet
March 20% 17 1.4 2.0 28 42 93 210
April 20% 17 1.4 2.0 27 42 90 210
May 30% 15 1.8 2.7 37 56 123 278
June 100% 10 4.0 6.0 82 127 274 636
July 100% 10 4.0 6.0 85 127 283 636
August 30% 15 1.8 2.7 37 56 123 278
September - Feburary 0% - - - - 0
Total: 296 449 987 2247
kg per cow per day tonnes DM per monthwet tonnes per month
Roofless barn feed
Feed cost: DM % $/kgDM Portion of ration
Fodderbeet ($/tonne, lifted
and delivered)$72 20% 0.36$ 60%
Pasture silage ($/tonne, wet) $110 30% 0.37$ 40% Feed
utilisation
92%
Time in barn
Percentage
feeding in-shed
Feeding level
(kgDM/day) Silage Beet Silage Beet Silage Beet
March 20% 17 1.4 2.0 29 43 96 217
April 20% 17 1.4 2.0 28 42 93 210
May 30% 15 1.8 2.7 38 57 127 287
June 100% 10 4.0 6.0 82 127 274 636
July 100% 10 4.0 6.0 85 131 283 657
August 30% 15 1.8 2.7 38 57 127 287
September - Feburary - - - - - 0
Total: 300 458 1001 2292
kg per cow per daytonnes DM per monthwet tonnes per month

97
Repairs and maintenance of proposed housing structures
Other costs
Enclosed housing structure R&M Roofless structure R&M
Assume 0.5% of capital cost in year 2 Assume 0.5% of capital cost in year 2
increasing at 0.3% per year increasing at 0.5% per year
through to year 11, and flat thereafter through to year 11, and flat thereafter
R&M rate R&M rate
Year 2 0.5% = 11,953$ Year 2 0.5% = 7,648$
Year 3 0.8% = 19,124$ Year 3 1.0% = 15,295$
Year 4 1.1% = 26,296$ Year 4 1.5% = 22,943$
Year 5 1.4% = 33,467$ Year 5 2.0% = 30,590$
Year 6 1.7% = 40,639$ Year 6 2.5% = 38,238$
Year 7 2.0% = 47,810$ Year 7 3.0% = 45,885$
Year 8 2.3% = 54,982$ Year 8 3.5% = 53,533$
Year 9 2.6% = 62,153$ Year 9 4.0% = 61,180$
Year 10 2.9% = 69,325$ Year 10 4.5% = 68,828$
Year 11 3.2% = 76,496$ Year 11 5.0% = 76,475$
Extra labour unit 42,000$ 0.5 21,000$
New tractor purchase 100,000$
Extra tractor costs hrs/day hrs/month
March 0.5 15.5
April 0.5 15.0
May 1.0 31.0
June 2.0 60.0
July 2.0 62.0
August 1.0 31.0
TOTAL: 214.5 hours
Operating costs (fuel/R&M/insurance) 42$
Additional tractor cost: 9,009$

98
Appendix I
Proposed system benefits
Saved grazing fees Increased DM production
Due to all cows being wintered on farm, Caused by increased effluent application
there is no requirement for winter grazing and reduced pasture/soil damage
Assume 100% of the cows off farm for Increase from reduced pugging 4%
9.8 weeks (June/July). Increase from increased effluent 0%
Grazing fee: 22$ per week kgDM per kgMS 12
Year 1 137,904$ Year 1 58,276$
Year 2 137,904$ Year 2 58,276$
Year 3 137,904$ Year 3 58,276$
Year 4 137,904$ Year 4 58,276$
Year 5 137,904$ Year 5 58,276$
Year 6 137,904$ Year 6 58,276$
Year 7 137,904$ Year 7 58,276$
Year 8 137,904$ Year 8 58,276$
Year 9 137,904$ Year 9 58,276$
Year 10 137,904$ Year 10 58,276$
Year 11 137,904$ Year 11 58,276$
Year 12 137,904$ Year 12 58,276$
Improved cow condition Reduced dry/empty cows
Assume cows 0 BCS better at calving Assume replacement rate drops by 3%
1 BCS = 15 kgMS for the season Value of R1 heifer 1,234$
Year 1 -$ Year 1 24,063$
Year 2 -$ Year 2 24,063$
Year 3 -$ Year 3 24,063$
Year 4 -$ Year 4 24,063$
Year 5 -$ Year 5 24,063$
Year 6 -$ Year 6 24,063$
Year 7 -$ Year 7 24,063$
Year 8 -$ Year 8 24,063$
Year 9 -$ Year 9 24,063$
Year 10 -$ Year 10 24,063$
Year 11 -$ Year 11 24,063$
Year 12 -$ Year 12 24,063$

99
Increased milking period (May) Increased milking period (June)
Assume 90% of the herd Assume 40% of the herd
milked for 2 weeks extra milked for 2 weeks extra
6.05$ per day per cow 4.10$ per day per cow
Year 1 48,025$ Year 1 14,465$
Year 2 48,025$ Year 2 14,465$
Year 3 48,025$ Year 3 14,465$
Year 4 48,025$ Year 4 14,465$
Year 5 48,025$ Year 5 14,465$
Year 6 48,025$ Year 6 14,465$
Year 7 48,025$ Year 7 14,465$
Year 8 48,025$ Year 8 14,465$
Year 9 48,025$ Year 9 14,465$
Year 10 48,025$ Year 10 14,465$
Year 11 48,025$ Year 11 14,465$
Year 12 48,025$ Year 12 14,465$
Saved fertiliser
Effluent area expanded to distribute extra effluent
Nitrogen Phosphate
Saved fert: 200 kg N/ha Saved fert: 500 kg/super/ha
32,020 kg N 80,050 kg/super
N= 1.33$ /kg N Superphosphate= 316$ /tonne
Year 1 42,601$ 25,296$
Year 2 42,601$ 25,296$
Year 3 42,601$ 25,296$
Year 4 42,601$ 25,296$
Year 5 42,601$ 25,296$
Year 6 42,601$ 25,296$
Year 7 42,601$ 25,296$
Year 8 42,601$ 25,296$
Year 9 42,601$ 25,296$
Year 10 42,601$ 25,296$
Year 11 42,601$ 25,296$
Year 12 42,601$ 25,296$

100
Appendix J
Effluent system assumptions
Housed system
Reduced breeding expenses
Housed system Roofless system
Year 1 6,644$ Year 1 4,644$
Year 2 6,644$ Year 2 4,644$
Year 3 6,644$ Year 3 4,644$
Year 4 6,644$ Year 4 4,644$
Year 5 6,644$ Year 5 4,644$
Year 6 6,644$ Year 6 4,644$
Year 7 6,644$ Year 7 4,644$
Year 8 6,644$ Year 8 4,644$
Year 9 6,644$ Year 9 4,644$
Year 10 6,644$ Year 10 4,644$
Year 11 6,644$ Year 11 4,644$
Year 12 6,644$ Year 12 4,644$
Assume a reduction in breeding expenses due to better
condition cows and easier monitoring of mating
101
Roofless system

102
Appendix K
Statement of Assets and Liabilities
Current system
Proposed housing structure-incorporated system
Dairy land 186 ha 50,000$ 9,300,000$
9,300,000$
350,000$
Milking shed 720,000$
1,070,000$
Plant and machinery
500,000$
500,000$
Dairy cows 650 1,963$ 1,275,950$
Total livestock value 1,275,950$
Fonterra shares 300,484 6.38$ 1,917,088$
Total share value 1,917,088$
14,063,038$
-$
-$
Including 100HP tractor, feed out wagon,
pasture mower and milking equipment
Current system assets
Total current assets
Current Liabilities
Bank loan
Total current liabilities
Total land value
Total plant and machinery value
Irrigation equipment
Total infrastructure value
Dairy land 186 ha 50,000$ 9,300,000$
9,300,000$
350,000$
Cowshed 720,000$
Housing structure 2,390,500$
3,460,500$
Plant and machinery 600,000$
600,000$
Dairy cows 650 1,963$ 1,275,950$
Total livestock value 1,275,950$
Fonterra shares 333,900 6.38$ 2,130,282$
Total share value 2,130,282$
16,766,732$
2,703,694$
2,703,694$
Current Liabilities
Total current assets
Housed system assets
Total land value
Total infrastructure value
Irrigation equipment
Total plant and machinery value
Bank loan
Total current liabilities

103
Proposed roofless structure-incorporated system
Dairy land 186 ha 50,000$ 9,300,000$
9,300,000$
350,000$
Cowshed 720,000$
Housing structure 1,529,500$
2,599,500$
Plant and machinery 600,000$
600,000$
Dairy cows 650 1,963$ 1,275,950$
Total livestock value 1,275,950$
Fonterra shares 327,600 6.38$ 2,090,088$
Total share value 2,090,088$
15,865,538$
1,802,500$
1,802,500$
Roofless system assets
Total land value
Irrigation equipment
Total current liabilities
Total infrastructure value
Total plant and machinery value
Total current assets
Current Liabilities
Bank loan