Benthic and fish aggregation inside an offshore wind farm ...
38
HAL Id: hal-01398550 https://hal.archives-ouvertes.fr/hal-01398550 Submitted on 19 May 2020 HAL is a multi-disciplinary open access archive for the deposit and dissemination of sci- entific research documents, whether they are pub- lished or not. The documents may come from teaching and research institutions in France or abroad, or from public or private research centers. L’archive ouverte pluridisciplinaire HAL, est destinée au dépôt et à la diffusion de documents scientifiques de niveau recherche, publiés ou non, émanant des établissements d’enseignement et de recherche français ou étrangers, des laboratoires publics ou privés. Benthic and fish aggregation inside an offshore wind farm: Which effects on the trophic web functioning? Aurore Raoux, Samuele Tecchio, Jean-Philippe Pezy, Géraldine Lassalle, Steven Degraer, Dan Wilhelmsson, Marie Cachera, Bruno Ernande, Camille Le Guen, Matilda Haraldsson, et al. To cite this version: Aurore Raoux, Samuele Tecchio, Jean-Philippe Pezy, Géraldine Lassalle, Steven Degraer, et al.. Ben- thic and fish aggregation inside an offshore wind farm: Which effects on the trophic web functioning?. Ecological Indicators, Elsevier, 2017, 72, pp.33 - 46. 10.1016/j.ecolind.2016.07.037. hal-01398550
Transcript of Benthic and fish aggregation inside an offshore wind farm ...

HAL Id: hal-01398550https://hal.archives-ouvertes.fr/hal-01398550
Submitted on 19 May 2020
HAL is a multi-disciplinary open accessarchive for the deposit and dissemination of sci-entific research documents, whether they are pub-lished or not. The documents may come fromteaching and research institutions in France orabroad, or from public or private research centers.
L’archive ouverte pluridisciplinaire HAL, estdestinée au dépôt et à la diffusion de documentsscientifiques de niveau recherche, publiés ou non,émanant des établissements d’enseignement et derecherche français ou étrangers, des laboratoirespublics ou privés.
Benthic and fish aggregation inside an offshore windfarm: Which effects on the trophic web functioning?Aurore Raoux, Samuele Tecchio, Jean-Philippe Pezy, Géraldine Lassalle,
Steven Degraer, Dan Wilhelmsson, Marie Cachera, Bruno Ernande, CamilleLe Guen, Matilda Haraldsson, et al.
To cite this version:Aurore Raoux, Samuele Tecchio, Jean-Philippe Pezy, Géraldine Lassalle, Steven Degraer, et al.. Ben-thic and fish aggregation inside an offshore wind farm: Which effects on the trophic web functioning?.Ecological Indicators, Elsevier, 2017, 72, pp.33 - 46. �10.1016/j.ecolind.2016.07.037�. �hal-01398550�

1
Please note that this is an author-produced PDF of an article accepted for publication following peer review. The definitive publisher-authenticated version is available on the publisher Web site.
Ecological Indicators January 2017, Volume 72 Pages 33-46 http://dx.doi.org/10.1016/j.ecolind.2016.07.037 http://archimer.ifremer.fr/doc/00347/45843/
Achimer http://archimer.ifremer.fr
Benthic and fish aggregation inside an offshore wind farm: Which effects on the trophic web functioning?
Raoux Aurore 1, 2, * , Tecchio Samuele 1, Pezy Jean-Philippe 2, Lassalle Géraldine 3, Degraer Steven 4, Wilhelmsson Dan 5, Cachera Marie 7, Ernande Bruno 6, Le Guen Camille 1, Haraldsson Matilda 1,
Grangeré Karine 1, Le Loc’h François 7, Dauvin Jean-Claude 2, Niquil Nathalie 1
1 Normandie Université UNICAEN, UMR BOREA (MNHN, UPMC, UCN, CNRS-7208, IRD-207) CS 14032, 14000 Caen, France 2 Normandie Université UNICAEN, UMR M2C (UCN, UR, CNRS-6143), 24 rue des Tilleuls, 14000 Caen Cedex, France 3 IRSTEA, UR EABX (Aquatic Ecosystems and Global Changes), 50 avenue de Verdun, 33612 Cestas Cedex, France 4 Royal Belgian Institute of Natural Sciences (RBINS), Operational Directorate Natural Environment (OD Nature), Marine Ecology and Management (MARECO) Gulledelle 100, 1200 Brussels, Belgium 5 The Royal Swedish Academy of Sciences Box 50005, SE-104 05 Stockholm, Sweden 6 IFREMER, Laboratoire Ressources Halieutiques, 150 quai Gambetta, BP 699, 62321 Boulogne sur Mer, France 7 Laboratoire des Sciences de l'Environnement Marin, UMR 6539 LEMAR (CNRS/UBO/IRD/Ifremer), Institut Universitaire Européen de la Mer (IUEM), Technopôle Brest-Iroise, Rue Dumont d'Urville, 29280 Plouzané, France
* Corresponding author : Aurore Raoux, email address : [email protected]
Abstract : As part of the energy transition, the French government is planning the construction of three offshore wind farms in Normandy (Bay of Seine and eastern part of the English Channel, north-western France) in the next years. These offshore wind farms will be integrated into an ecosystem already facing multiple anthropogenic disturbances such as maritime transport, fisheries, oyster and mussel farming, and sediment dredging. Currently no integrated, ecosystem-based study on the effects of the construction and exploitation of offshore wind farms exists, where biological approaches generally focused on the conservation of some valuable species or groups of species. Complementary trophic web modelling tools were applied to the Bay of Seine ecosystem (to the 50 km2 area covered by the wind farm) to analyse the potential impacts of benthos and fish aggregation caused by the introduction of additional hard substrates from the piles and the turbine scour protections. An Ecopath ecosystem model composed of 37 compartments, from phytoplankton to seabirds, was built to describe the situation “before” the construction of the wind farm. Then, an Ecosim projection over 30 years was performed after increasing the biomass of targeted benthic and fish compartments. Ecological Network Analysis (ENA) indices were calculated for the two periods, “before” and “after”, to compare network functioning and the overall structural properties of the food web. Our main results showed (1) that the total ecosystem activity, the overall system omnivory (proportion of generalist feeders), and the recycling increased after the construction of the wind farm; (2) that higher trophic levels such as piscivorous fish

2
Please note that this is an author-produced PDF of an article accepted for publication following peer review. The definitive publisher-authenticated version is available on the publisher Web site.
species, marine mammals, and seabirds responded positively to the aggregation of biomass on piles and turbine scour protections; and (3) a change in keystone groups after the construction towards more structuring and dominant compartments. Nonetheless, these changes could be considered as limited impacts of the wind farm installation on this coastal trophic web structure and functioning.
Highlights
► Ecopath models before/after an offshore wind farm were built. ► Possible reef effect would increase total system biomass by 55%. ► Bivalves build-up would lead to a food web dominated by detritivory. ► Benthos and keystone fish biomass increases attracted apex predators.
Keywords : Marine renewable energies, Reef effect, Wind farm, Ecopath with Ecosim, Ecosystem-based approach

3
1. INTRODUCTION 47
Humanity’s ever growing energy demands have translated into an increase in fossil fuel combustion and 48
greenhouse gases emissions and, consequently, into global climate changes (OSPAR, 2008; IPCC, 2014). A 49
new focus on renewable energy source research and development arose during the last decades to counter 50
this trend. The European Union (EU) has set a target of 20% of energetic consumption derived from 51
renewable energy sources by 2020 (Directive 2009/28/EC). With more than 11 million km2 of waters under 52
its jurisdiction, France holds a huge natural potential for marine renewable energy (MEDDE 2011). Currently, 53
the construction of six offshore wind farms is planned in metropolitan France. Among them, three should be 54
built in the central-eastern part of the English Channel: the Courseulles-sur-mer (~50 km², 75 wind turbines), 55
the Fécamp (~65 km², 83 wind turbines) and the Tréport (~67 km², 62 wind turbines) offshore wind farms. 56
The implementation of this type of infrastructure is a challenge for developers from technical, legal, social, 57
and environmental points of view. Indeed, these offshore wind farms will be integrated into ecosystems 58
already subjected to a growing number of anthropogenic disturbances such as pollution, transport, fishing, 59
aquaculture, aggregate extraction, or sediment dredging and deposit. 60
Concern about the potential environmental impacts generated by these new structures on marine 61
ecosystems arose from this development (Lindeboom et al., 2011; Bailey et al., 2014). The exploration, 62
construction, operation, and decommissioning of offshore wind farms can indeed be responsible for 63
temporary and/or permanent impacts on marine ecosystems such as the destruction of seabed or the 64
disturbance of fish and marine mammal populations (Shields et al., 2014; OSPAR, 2008; Mueller-Blenkle et 65
al., 2010). During the construction phase, if special care is taken to protect rare habitats and spatial and 66
temporal habitat use by sensitive species, effects can be kept relatively small or negligible (e.g. Wilhelmsson 67
et al. 2010). During the operational phase, the anticipated and recorded disturbances caused by noise, 68
vibrations and the electromagnetic fields are also in most cases considered to be of minor importance to the 69
marine environment, at least to date (Westerberg et al., 2008; Petersen and Malm, 2006, Wilhelmsson et al. 70
2010). However, a noteworthy effect of the introduction of turbines with their associated scour protection is 71
the creation of new habitats and shelters that will be immediately colonized by several marine species 72
resulting in an additional source of food for higher trophic levels (Bergström et al., 2013). This effect, 73
generally known as the “reef effect”, is considered as one of the most important effect on the marine 74
environment generated by the construction of offshore wind farms (Peterson and Malm, 2006; Langhamer, 75
2012; De Mesel et al., 2015). The reef effect has been described for epibenthic and demersal fauna as well 76
as on bentho-pelagic fish (including commercial species) in the direct proximity of wind farm foundations 77
(Wilhelmsson et al., 2006; Tougard et al., 2006; Wilhelmsson and Malm, 2008; Maar et al., 2009; Reubens et 78
al., 2011; Leonhard et al., 2011; Lindeboom et al., 2011; Bergström et al., 2013; Reubens et al., 2013; Reubens 79
et al., 2014; Degraer et al., 2014). The reef effect has also been demonstrated for other anthropogenic 80

4
structures such as shipwrecks and oil platforms (Wolfson et al., 1979; Love et al., 1994, 1999; Wilhelmsson 81
et al., 2006). The choice of material and the shape of the structures introduced in the marine environment 82
both play an important role during the colonization process (e.g. Andersson et al., 2010). All these previous 83
studies provide a vast amount of data on environmental effects at the species or community scales. However, 84
the propagation of the reef effect at the ecosystem scale, impacting the structure and functioning of food 85
webs remains unclear (Boehlert and Gill, 2010). 86
Until now, there is no holistic study on the effects of the construction and operation of offshore wind farms 87
on an ecosystem taken as a whole. Here, we propose to develop a holistic view of offshore wind farm impacts 88
on ecosystems functioning through the use of trophic web modelling tools. Our work will provide information 89
on the food web change in response to the construction and operation of marine energy infrastructures, 90
information which is essential to the sustainable development and management of renewable energy 91
sources. The main feature of this work will be to propose a methodology that is complementary to what it is 92
currently applied in Environmental Impact Assessments by using: (1) a holistic approach in which the 93
ecosystem represents the management unit, (2) a functional perspective based on flows of energy circulating 94
between ecosystem components, and (3) a high level of functional diversity to describe the food web. 95
Among the different existing modelling approaches, Ecopath with Ecosim (EwE) has been intensively 96
developed and used over the last three decades and was applied on hundreds of aquatic ecosystems 97
throughout the world (Polovina, 1984; Christensen and Walters, 2004; Christensen et al., 2008). This 98
approach, in which all biotic components of the system are considered at the same time, provides measures 99
of the ecosystem emergent properties through the calculation of Ecological Network Analysis (ENA) indices 100
(Ulanowicz, 1986). These joint analyses have been frequently applied to coastal and marine systems to assess 101
changes in their functioning in response to environmental perturbations (Ortiz and Wolff 2002, Rybarczyk et 102
al., 2003; Patricio et al., 2006; Niquil et al., 2012; Tecchio et al., 2013, 2015). Some ENA indices, such as the 103
redundancy, have also been linked to notions of stability (Christensen et al., 2005) such as the resilience of 104
trophic webs to perturbations (Heymans et al., 2007). Finally, ENA indices have also been proposed as trophic 105
descriptors of ecosystem health for the EU Marine Strategy Framework Directive (Dame and Christian 2007; 106
Niquil et al., 2012; Rombouts et al., 2013; Niquil et al., 2014). 107
The objective of the present study was to model the potential impacts of the construction and operation of 108
the Courseulles-sur-mer (southern part of the Bay of Seine along the Calvados coast) offshore wind farm on 109
the local trophic-web functioning. Special attention was paid on how benthos and fish aggregation caused by 110
the introduction of additional hard substrates from the piles and the scour protections might lead to the 111
development of an artificial reef system, and also what the consequences on the food-web functioning could 112

5
be. To analyse the impact of additionally available hard substrates, an Ecopath model was first built to 113
describe the food web before the construction of the Courseulles-sur-mer offshore wind farm and then an 114
Ecosim model was derived to project over the next 30 years the ecosystem evolution after the forced increase 115
in biomass of some targeted benthic and fish compartments in relation to the wind farm construction. For 116
this, observations of species changes in wind farm areas obtained through extensive literature searches were 117
adapted to the Courseulles-sur-mer site based on expert knowledge. Two hypotheses regarding the food-118
web functioning were particularly investigated with Ecosim simulations: (i) a system dominated by mussels 119
leads to a more detritivorous food web (Norling and Kautsky, 2008), and (ii) the increased biomass of benthic 120
invertebrates and fish, as generated by the reef effect, would attract apex predators (Lindeboom et al., 2011; 121
Henkel et al., 2014).This is, to our knowledge, the first attempt to study the potential impacts of the 122
construction and operation of an offshore wind farm on the local trophic web structure and functioning using 123
an integrated ecosystem modelling approach. 124
2. MATERIAL AND METHODS 125
2.1 Study area 126
The Bay of Seine, where the offshore wind farm will be built in the next years (from 2018) is located on the 127
north-western French coast and opens onto the eastern English Channel (Fig. 1). The Bay of Seine forms an 128
approximate quadrilateral of 5000 km², with a mean depth of about 20 m. The water depth never exceeds 129
35 m. The maximum tidal range is 7.5 m in the eastern part of the Bay near the mouth of the Seine estuary. 130
Tidal currents average between 1 and 2 knots in the southern sector of the Bay, and their intensity gradually 131
diminishes toward the eastern Bay of Seine (Salomon and Breton, 1991, 1993). The distribution of superficial 132
sediments and benthic communities is strongly correlated to these currents (Gentil and Cabioch, 1997; 133
Dauvin, 2015). There is an offshore-inshore gradient in the Bay, with the dominant sediment offshore 134
generally consisting in pebbles, gravel and coarse sands and the sediment inshore in the coastal zones 135
consisting mostly of fine sands and muddy fine sands (Dauvin et al., 2007, 2015). Benthic communities of the 136
Bay of Seine are well described in terms of composition and spatial distribution (Dauvin and Ruellet, 2008) 137
and were demonstrated to be good indicators of ecosystem health (Garcia, 2011). Coastal marine, estuarine 138
and mixed systems along the French coasts are predicted to be high sensitive to climatic variations (Goberville 139
et al., 2010). The Bay of Seine ecosystem is already submitted to multiple anthropogenic disturbances such 140
as maritime traffic, fishing, and sediment dredging (Dauvin et al., 2004). All these features make it a system 141
at the crossroad of various influences, central for studying cumulative impacts on the functioning of marine 142
ecosystems. 143

6
2.2 Courseulles-sur-mer offshore wind farm project 144
The project is owned by “Eoliennes Offshore du Calvados”, a subsidiary of Éolien Maritime France and wpd 145
Offshore. EMF was allowed to operate the offshore wind farm off from Courseulles-sur-mer by the Ministerial 146
Order of April 18th 2012. The proposed wind farm will be located 10 to 16km offshore from the coast of 147
Calvados – Normandy. The depth range is 22-31 m at Lowest Astronomical Tide (LAT to be checked). The 148
wind farm will have a total area of approximately 50 km2 (Fig. 1). The wind farm will comprise 75 6MW 149
turbines giving a combinated nameplate capacity of 450MW. The wind farm turbines will be connected via 150
an interarray network of 33 kV AC cables which will link at one offshore transformer substation located within 151
the wind farm. From this station power will be exported via two 225 kV AC marine cables. The turbines are 152
supported by 7 m of diameter monopiles driven into the sea bed. The foot print of the 75 turbines foundation 153
and of the converter station will be 0.158 km2 or 0.03% of the overall wind farm area. Our work hypothesis 154
was that scour protections will be installed around the 75 turbines and the converter station and 33% of the 155
cables will be rock-dumped, thus the total additional surface would amount to 0.342 km², or 0.72% of the 156
offshore wind farm area when considered in two dimensions. In calculating the biomasses changes we took 157
into account the actual “foot print” of the new structure: while in terms of surface it will be low, the 158
colonization of the structure will happen in three dimensions including the whole pillar. The production 159
generated by the wind park would cover the average annual electricity consumption of approximately 160
630,000 people, i.e. around 40% of the inhabitants of the surrounding region of Normandy. 161
<Figure 1> 162
2.3 Presentation of the trophic modelling approach 163
The Ecopath with Ecosim (EwE) software (Polovina, 1984; Christensen and Walters, 2004; Christensen et al., 164
2008) was used to model the food web at the site of the construction of the future Courseulles-sur-mer 165
offshore wind farm. Among the different EwE modules, Ecopath is designed to build a snapshot of the 166
ecosystem functioning while Ecosim allows simulating its dynamic evolution through time. Ecopath is a mass-167
balance (i.e. neglecting year-to-year changes in biomass compared to flows), single-solution model (i.e. 168
returning only one value per flow), that estimates fluxes between a set of established trophic compartments. 169
Each compartment corresponds to a single species or a group of species similar in terms of predators, preys 170
and of metabolic rates (i.e. trophic group). It is parameterised with biomasses (B, gC.m-2), production over 171
biomass ratios (P/B, year-1), consumption over biomass ratios (Q/B, year-1) and a diet matrix (DC= diet 172
composition) which establishes the interactions between predators and preys in the ecosystem. 173
The parameterization of an Ecopath model is based on satisfying two equations. The first one (Eq. 1) describes 174
the production for each compartment in the system as a function of the consumption ratio (Q/B) of its 175
7
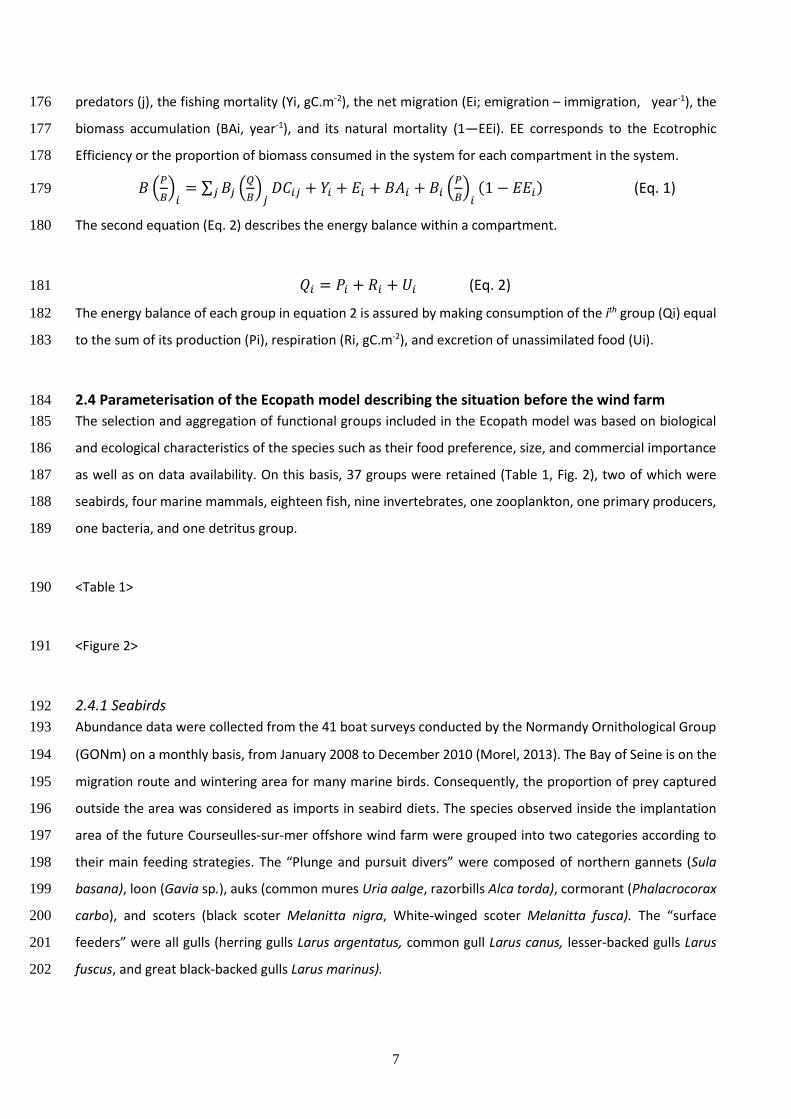
predators (j), the fishing mortality (Yi, gC.m-2), the net migration (Ei; emigration – immigration, year-1), the 176
biomass accumulation (BAi, year-1), and its natural mortality (1—EEi). EE corresponds to the Ecotrophic 177
Efficiency or the proportion of biomass consumed in the system for each compartment in the system. 178
𝐵 (𝑃
𝐵)
𝑖= ∑ 𝐵𝑗𝑗 (
𝑄
𝐵)
𝑗𝐷𝐶𝑖𝑗 + 𝑌𝑖 + 𝐸𝑖 + 𝐵𝐴𝑖 + 𝐵𝑖 (
𝑃
𝐵)
𝑖(1 − 𝐸𝐸𝑖) (Eq. 1) 179
The second equation (Eq. 2) describes the energy balance within a compartment. 180
𝑄𝑖 = 𝑃𝑖 + 𝑅𝑖 + 𝑈𝑖 (Eq. 2) 181
The energy balance of each group in equation 2 is assured by making consumption of the ith group (Qi) equal 182
to the sum of its production (Pi), respiration (Ri, gC.m-2), and excretion of unassimilated food (Ui). 183
2.4 Parameterisation of the Ecopath model describing the situation before the wind farm 184
The selection and aggregation of functional groups included in the Ecopath model was based on biological 185
and ecological characteristics of the species such as their food preference, size, and commercial importance 186
as well as on data availability. On this basis, 37 groups were retained (Table 1, Fig. 2), two of which were 187
seabirds, four marine mammals, eighteen fish, nine invertebrates, one zooplankton, one primary producers, 188
one bacteria, and one detritus group. 189
<Table 1> 190
<Figure 2> 191
2.4.1 Seabirds 192
Abundance data were collected from the 41 boat surveys conducted by the Normandy Ornithological Group 193
(GONm) on a monthly basis, from January 2008 to December 2010 (Morel, 2013). The Bay of Seine is on the 194
migration route and wintering area for many marine birds. Consequently, the proportion of prey captured 195
outside the area was considered as imports in seabird diets. The species observed inside the implantation 196
area of the future Courseulles-sur-mer offshore wind farm were grouped into two categories according to 197
their main feeding strategies. The “Plunge and pursuit divers” were composed of northern gannets (Sula 198
basana), loon (Gavia sp.), auks (common mures Uria aalge, razorbills Alca torda), cormorant (Phalacrocorax 199
carbo), and scoters (black scoter Melanitta nigra, White-winged scoter Melanitta fusca). The “surface 200
feeders” were all gulls (herring gulls Larus argentatus, common gull Larus canus, lesser-backed gulls Larus 201
fuscus, and great black-backed gulls Larus marinus). 202

8
The mean body mass of these species were derived from Hunt et al. (2005). Conversion factors of 0.3 and 0.4 203
were used to convert wet weights into dry weights and then into carbon contents, respectively (Lassalle et 204
al., 2011). 205
Daily consumption ratios were calculated according to the following empirical equation (Nilsson and Nilsson, 206
1976): 207
Log (Rc) =-0.293 + 0.85 * log10 (body mass) (Eq. 3) 208
This value was then multiplied by 365 days and divided by the mean weight of the taxon to provide annual 209
Q/B ratio in year-1. The P/B ratio for the two functional groups was based on estimates published in Nelson 210
(1979). For these two groups, the diet compositions were retrieved from literature (Hunt et al., 2005). The 211
proportion of prey captured outside the area was considered as imports in their diet (see Table 2 in Appendix 212
A). 213
2.4.2 Marine mammals 214
Abundance data for bottlenose dolphins (Tursiops truncatus) and harbour porpoises (Phocoena phocoena) 215
were collected from aerial surveys from November 2011 to August 2012 (Martinez et al., 2014). Abundance 216
for harbour seals (Phoca vitulina) and grey seals (Halichoerus grypus) were derived from telemetric surveys 217
from 2007 to 2013 (Martinez et al., 2014). 218
For each species, the mean body weight was calculated according to its maximum body length (Trites and 219
Pauly, 1998). To convert wet weights into carbon contents, a conversion factor of 0.1 was used (Bradford 220
Grieve et al., 2003). To estimate the Q/B ratio, we used the metabolic rates and the daily consumption 221
according to the empirical equations of Boyd (2002) and Spitz et al. (2010). The P/B ratios for these four 222
species were taken from Christensen et al. (2009). Their diet compositions were defined according to Spitz 223
et al. (2006). Based on the aerial surveys, marine mammal distributions cover large spatial scales far beyond 224
the Bay of Seine limits. Consequently, the proportion of prey captured outside the area was considered as 225
imports in their diet (see Table 2 in Appendix A). 226
2.4.3 Fish compartments 227
Abundance data for fish were collected from the GOV (“Grande Ouverture Verticale”= high opening) bottom-228
trawl survey conducted annually in October by IFREMER in the eastern English Channel and the south of the 229
North Sea since 1988 (Channel Ground Fish Survey, CGFS). Data were averaged over 3 years (from 2010 to 230
2013). Fish were grouped into 6 functional groups: sharks and rays, gurnards, piscivorous, planktivorous, 231

9
benthos feeders, and other flatfish. Moreover, mackerel (Scomber scombrus), European sea bass 232
(Dicentrarchus labrax), Atlantic cod (Gadus morhua), whiting (Merlangius merlangus), Atlantic horse 233
mackerel (Trachurus trachurus), pouting (Trisopterus luscus), poor cod (Trisopterus minutus), European 234
pilchard (Sardina pilchardus), European sprat (Sprattus sprattus) sea bream (Spondyliosoma cantharus), 235
common sole (Solea solea), and European plaice (Pleuronectes platessa) formed 12 single-species 236
compartments. These 12 species are either commercial species or species known to be attracted by the reef 237
effect. Therefore, they were not aggregated with the other compartments in order to see more in details the 238
potential impact of the MRE. 239
Fish wet body weights (originally in kg km-2) were converted to carbon contents using a conversion factor of 240
0.11 (Oguz et al., 2008). Q/B and P/B ratios were taken from Mackinson and Daskalov (2007). The diet 241
compositions were retrieved from the literature (Cachera 2013). Landings data were obtained from the 242
Fisheries Information System of IFREMER (http://sih.ifremer.fr/). 243
2.4.5 Invertebrate compartments 244
Cephalopods 245
Abundance data (in kg.km-2) for cephalopods were also collected from the GOV bottom-trawl survey CGFS 246
and averaged over 3 years (from 2010 to 2013). Cephalopods were divided into 2 groups: “Bentho-pelagic 247
cephalopods” composed of Loligo sp. and Allotheuthis sp., and “Benthic cephalopods” composed of Sepia 248
officinalis., Conversion factors of 0.192 and 0.402 were used to convert wet weights into dry weights and 249
then into carbon contents, respectively (Brey et al., 2010). Q/B and P/B ratios were taken from Sanchez and 250
Olaso (2004). Landings data were taken from the Fisheries Information System of IFREMER 251
(http://sih.ifremer.fr/). Diet compositions were retrieved from the literature (De Pierrepont et al., 2005; Daly 252
et al., 2001). 253
254
Benthic invertebrates 255
Benthic invertebrates were sampled with a 0.1 m² Day grab in June 2009. Species were grouped into 4 256
compartments: “predators”, “filter feeders”, “bivalves” and “deposit feeders”. Bivalves were not aggregated 257
with the filter feeders to investigate in more details their importance in the functioning of the trophic web 258
as well as to test the hypothesis of Norling and Kaustky (2008). In addition the above 4 groups, king scallop 259
(Pecten maximus) was included as a single-species compartment given its economic value. Ash-free dry 260
weights were converted to carbon contents using a conversion factor of 0.518 (Salonen et al., 1976 in Brey, 261
2001). P/B and Q/B were taken from Le Loc’h (2004) and Brey (2001), and diet compositions were taken from 262
Rybarczyk and Elkaim (2003). 263

10
Suprabenthos 264
The suprabenthos is defined as living organisms in the water layer immediately adjacent to the bottom that 265
make daily vertical migrations and / or seasonal movements at varying distances from the bottom (Brunel et 266
al., 1978) (e.g. gammarids, corophium). Abundance data were collected from Vallet (1997) that studied 267
suprabenthos all across the English Channel. P/B and Q/B ratios were taken from Brey (2001) and Le Loc’h 268
(2004), and the diet composition was obtained from Lobry et al. (2008). Ash-free dry weights were converted 269
to carbon contents using a conversion factor of 0.518 (Salonen et al., 1976 in Brey 2001). 270
Meiofauna 271
The values of mean annual biomass of meiofauna, the P/B ratio and Q/B were obtained from the literature 272
(Ratsimbazafy, 1998; Chardy and Dauvin, 1992; Le Loc’h, 2004). 273
2.4.6 Zooplankton 274
Mean annual biomasses of zooplankton were collected from the Seine Aval I programme. P/B and P/C ratios 275
were obtained from another study focused on the Eastern part of the Bay of Seine (Rybarczyk and Elkaim, 276
2003). 277
278
2.4.7 Bacteria 279
The benthic bacterial biomass, P/B, and Q/B ratios were taken from Chardy (1987), McIntyre (1978), and 280
Mackinson and Daskalov (2007), respectively. 281
2.4.8 Phytoplankton 282
The phytoplankton biomass and P/B ratio were taken from data collected in the Bay of Seine by Baehr et al. 283
(2014) and Souissi (2007). 284
2.4.9 Detritus 285
The mean annual biomass of dead organic matter was obtained from a study focused on the Eastern part of 286
the Bay of Seine (Tecchio et al., 2015). 287
288
2.5 Balancing the Ecopath model 289
To obtain a mass-balanced model, inputs (i.e. B, P/B, Q/B, EE, and diets) were slightly and manually modified 290
to satisfy the constraint of Ecotrophic Efficiency lower than 1. We also checked that physiological rates were 291
within the known limits for each functional group: (i) P/Q of 0.1–0.3 for consumers, and (ii) 292
respiration/biomass (R/B) ratios of 1–10 for fish groups. Biomass accumulation and net migration were both 293
set to zero. The EwE pedigree routine was used to quantify the input parameter uncertainties (Christensen 294

11
and Walters, 2004). It helped to identify the least certain parameters that should be modified first to achieve 295
mass balance. The balancing approach that we used was top-down, starting with the top predator groups 296
and moving down the food web to balance inconsistencies. When modifications of the data had to be 297
performed, diet compositions (DC) were modified first, and then ratios of P/B and Q/B. Biomasses (B) were 298
considered as less uncertain, and thus were modified the last during the balancing process. 299
300
Biomasses of the small pelagic fish and flatfish were left to be estimated by the model after setting their 301
Ecotrophic Efficiency to 0.99 given their high exploitation rate. The estimated biomasses were higher than 302
the input data first entered during model construction for those two groups. This can be partly explained by 303
the fact that the GOV bottom-trawl deployed during the Channel Ground Fish Survey by IFREMER is not fully 304
adapted to capture these species, the abundance of which is thus likely to be underestimated. In the same 305
way, the deposit feeders and suprabenthos biomasses were also left to be estimated by the model assuming 306
an Ecotrophic Efficiency to 0.99. 307
2.6 Simulating the “reef effect” due to the wind farm implantation using Ecosim simulations 308
The Ecosim module was used to analyse the potential impacts of biomass accumulation on hard substrates 309
represented by the wind turbines and the scour protections on the structure and functioning of the local 310
trophic web during the operational phase. The dynamic routine of the EwE package, Ecosim allows to 311
describe temporal changes of the system variables (biomass, fishing, predation) starting from the initial 312
Ecopath model (Walters et al., 1997; Christensen and Walters, 2004). The Ecosim equation that models the 313
biomass growth rate for each group (i) is: 314
𝑑𝐵𝑖
𝑑𝑡= 𝑔𝑖 ∑ 𝑄𝑗𝑖𝑗 − ∑ 𝑄𝑖𝑗𝑗 + 𝐼𝑖 − (𝑀𝑖 + 𝐹𝑖 + 𝐸𝑖)𝐵𝑖 (Eq. 4) 315
Where Ii and Ei are the immigration and emigration rates, Mi is the natural mortality, and Fi is the fishing 316
mortality (Walters et al., 1997, Christensen and Walters 2004). Calculations of the consumption rates (Qij) 317
are based upon the ‘foraging arena’ theory, in which the biomass of i is divided between available prey 318
(vulnerable fraction, Vi) and unavailable prey (non-vulnerable fraction, Bi – Vi). A low value of vulnerability 319
will indicate a ‘bottom-up’ controlled interaction, while a high value of vulnerability will indicate that 320
mortality of the prey is controlled by the predator biomass, as in a ‘top-down’ control (Ahrens et al., 2012). 321
Ecosim was used to build another Ecopath solution, derived from the initial Ecopath model described above. 322
Biomasses of species that would presumably profit from the “reef effect” such as benthic invertebrates (filter 323
feeders, bivalves, and predators), benthos feeders fishes, whiting, pouting, Atlantic cod, other flatfish, sole 324

12
and surface feeders seabirds, were modelled based on data from the literature (Koller et al., 2006; Reubens 325
et al., 2011; Lindebon et al., 2011, Krone et al., 2013a; Krone et al., 2013b; Reubens et al., 2013). These 326
changes in biomass were the main variations taken into account to drive the evolution of the system through 327
time. Species biomasses on the turbine foundations and scour protections were calculated by multiplying the 328
average biomass per m² found in the literature by the surface area represented by the turbine foundations 329
and scour protections and divided by the total wind farm area at Courseulles-sur-mer. Then, the estimated 330
increase was added to the basal biomass for each functional group susceptible to profit from the implantation 331
of the wind farm in 2018. Forcing time series over a period of 30 years were as such established for the 332
biomass of the following groups: benthic invertebrates (filter feeders, bivalves, and predators), benthos 333
feeders fish, whiting, pouting, Atlantic cod, other flatfish, sole, surface feeders seabirds. These forcing time 334
series were responsible for a disruptive change in the biomass of the species cited above. Ecosim model were 335
run with the new biomass values for the targeted groups listed above and the original biomass values for the 336
other functional groups in the model. In this scenario, the biomass of groups that could presumably profit 337
from a reef effect were simultaneously increased and vulnerability was set to 2 for all groups. In this scenario, 338
we chose to take into account all the effects (direct and indirect), not only those directly propagating from 339
prey-predator interactions. The biomass and production of the phytoplankton was blocked at the initial 340
value. All other parameters and ratios remained unchanged. Then, a new Ecopath model was extracted at 341
the end of the 30 years simulation to compare the situation before (BOWF (Before Offshore Wind Farm) 342
model described above) and after the construction of the offshore wind farms (REEF scenario). 343
To test the robustness of our working hypotheses, four sensitivity analyses were also performed to analyse 344
effects of fish and benthic aggregation on the trophic web functioning, inside an OWF. The methods included: 345
(1) forcing biomass dynamics of only the bivalves and filters feeders compartments through time (forcing 346
biomass); (2) starting to increase the biomass of benthic organisms and then one year later increase the 347
biomass of fish that would presumably profit from the reef effect in order to take into account the different 348
species time span (time lag); (3) and (4) changes in the vulnerability of the bivalve group. Vulnerability 349
indicates the degree to which an increase in predator biomass will cause mortality for a prey (Christensen et 350
al., 2008). In these two additional scenarios, we increased the vulnerability of bivalves to 5 and 10 351
respectively. These sensitivity analyses are presented in the Supplementary Material Appendix B. 352
2.7 Analysing ecosystem organisation, major interactions and emergent properties 353
For the two Ecopath models (BOWF model and REEF scenario), the trophic level of each functional group was 354
calculated from its diet composition matrix. It is computed as the weighted average of the trophic levels of 355
its prey, when primary producers and non-living material are set at a trophic level of 1: 356

13
𝑇𝐿𝑗 = 1 + ∑ 𝐷𝐶𝑗𝑖𝑇𝐿𝑗𝑁𝑖=1 (Eq. 5) 357
where DCji is the fraction of the prey i in the diet of the predator j. 358
Ecological Network Analysis (ENA) indices were calculated using the network analysis plug-in included in EwE 359
(Christensen and Walters, 2004). The following ENA indices were retained: 360
Total System Throughflow (TST gC m-2 year-1) was calculated as the sum of the flow balance (inflow = 361
outflow) of all compartments (Latham, 2006). 362
The Total System Throughput (T.., gC m-2 year-1) was calculated as the sum of all the flows in the food web, 363
characterising its overall activity and size (Latham, 2006). 364
The Omnivory Index (OI) represents the trophic specialisation of the predator, assuming values close to 365
zero when the consumer is fully specialized, feeding on a single trophic level, and higher values when the 366
predator feeds on several trophic levels (Pauly et al., 1993). 367
The System Omnivory Index (SOI) was calculated as the average of the OIs of the individual group, 368
weighted by the logarithm of each consumer intake (Pauly et al., 1993; Christensen and Walters, 2004). It 369
is both a measure of the predators trophic specialisation in terms of trophic levels and an indicator of the 370
structure and complexity of a trophic network, assuming that high values of SOI correspond to a web-like 371
structure and low values of SOI to a chain-like structure (Libralato, 2008). For instance, marine ecosystems 372
of the northern Europe have a SOI ranging from 0.14 to 0.36 (Mackinson and Daskalov, 2007). 373
The Finn’s Cycling Index (FCI) gives the percentage of all flows generated by cycling (i.e. the percentage of 374
carbon flowing in circular pathways) (Finn, 1980). 375
The Ascendency (A) is a measure of the system activity (Total System Throughput) linked to its degree 376
of organization (Average Mutual Information; AMI) (Ortiz and Wolff, 2002). This index was related to 377
the developmental status or maturity of an ecosystem (Ulanowicz, 1986). 378
The Transfer Efficiency (TE) is the fraction of total flows of each discrete trophic level that 379
throughputs into the next one (Lindeman, 1942). The ‘‘Lindeman spine plot’’ is a representation of 380
trophic transfers into a linear food chain. It includes the fraction of the biomass directed to detritus 381
by each discrete trophic level (‘flow to detritus’) and the transfer efficiency from one level to the next 382
one (TE). 383
The Mixed Trophic Impact (MTI) routine was applied to evaluate the impacts of direct and indirect 384
interactions in the food web. This analysis shows the theoretical impact that a slight increase in the biomass 385
of one group would have on the biomasses of all the other groups in the system (Ulanowicz and Puccia, 1990). 386

14
Although this is a static analysis that does not account for temporal scale changes, the MTI can be used as a 387
sensitivity analysis to explore possible impacts of moderate biomass variations. The Keystoneness Index was 388
calculated for each functional group, to identify which groups possess a high overall effect on the other 389
groups compared to their relatively low biomass. Calculations were made according to the index defined by 390
Libralato et al. (2006). This analysis uses the MTI matrix to calculate an index summarising the impact that a 391
minimal variation of biomass of a particular group would have on the biomasses of the other groups in the 392
system. The Detritivory/Herbivory ratio (D/H) is the ratio between values of detritivory flows (from detritus 393
to trophic level II) and herbivory flows (from primary producers to trophic level II) (Ulanowicz, 1992). The 394
proportion between biomass of fish groups and biomass of invertebrate groups was also calculated. 395
3. RESULTS 396
An Ecopath model (BOWF model) of the area was constructed using data from local sampling surveys or from 397
similar ecosystems. Another Ecopath model (REEF scenario) was derived after simulating 30 years of dynamic 398
evolution of the area following the construction of an offshore wind farm and the increase in hard substrates 399
causing a reef effect (i.e. aggregation of biomass). 400
401
3.1 Compartments’ ecological roles before the installation of the offshore wind farm 402
The overall pedigree index value calculated for the BOWF model before the implantation of the offshore 403
wind farm was 0.523. 404
The functional group dominating biomass was “bivalves” (mostly composed of the clam Polititapes 405
rhomboides), which represented 42% of the total living biomass of the system (Table 1). The functional 406
groups contributing most to total throughflows were zooplankton, bacteria, and bivalves, with contributions 407
of 36%, 15%, and 8%, respectively. 408
The Trophic Level of functional groups ranged from TL=1 for primary producers and detritus, as imposed by 409
construction, to a maximum of 4.8 for grey seals in the BOWF model (see Table 1 in Appendix A). Other 410
marine mammals (i.e. bottlenose dolphins, harbour porpoises and harbour seals) ranked just below as top 411
predators in the trophic webs. The omnivory of the functional groups, estimated by the omnivory index (OI), 412
was low overall (0.001–0.474), except for Surface-feeding seabirds (OI=0.757) (see Table 1 in Appendix A). 413
These low values indicate a general dietary specialisation of the fauna, each functional group feeding on a 414
narrow range of trophic levels. 415
The MTI analysis highlighted that benthic invertebrate predators negatively affected benthic invertebrate 416
filter feeders, bivalves, deposit feeders, suprabenthos and meiofauna (Fig. 3). Other predators (such as sea 417

15
bream or flafish), also feeding on those benthic invertebrates and thus considered as competitors, responded 418
negatively to an increase of benthic invertebrate predators’ biomass. In fact, functional groups benefiting 419
from an increase in benthic organisms’ biomass (predators, filter feeders and bivalves) were some fish species 420
(i.e. flat fish and sea bream), marine mammals and seabirds. Pouting exerted a widespread influence over 421
the trophic web, due to its wide diversity of prey items (benthic invertebrate deposit feeders, filters feeders, 422
and predators, pilchard, sprat, and planktivorous fish). 423
<Figure 3> 424
The keystoneness index was highest for pouting (0.095) and for benthic invertebrate predators (0.059), which 425
also presented the maximum values of relative total impact (Fig. 4; see Table 1 in Appendix A). Another group 426
with relatively high keystoneness and low biomass was the harbor porpoise. 427
<Figure 4> 428
3.2 Ecosystem structural features after the installation of the wind farm 429
Based on the simulation of the wind farm presence, REEF scenario, Ecosim generated a variation in biomass 430
of the functional groups for which the biomass inputs were not set a priori. 431
An increase in substrates available for epibenthic sessile organisms and fish after the wind farm construction 432
implied an increase of the total system biomass by 40%. 433
First, for those functional groups for which we calculated an accumulation of biomass on new substrates, the 434
new biomass values increased by a factor of 6 for the surface feeders seabirds (dominated by Larus sp.), 3.5 435
for the Atlantic cod, 4 for whiting, 2 for pouting, 2 for fish benthos feeders (dominated by Callionymus sp.), 436
2 for sole, 4 for other flatfish (dominated by Limanda limanda), 1.5 for benthic invertebrate predators 437
(dominated by the omnivorous species Psammechinus miliaris), 1.5 for filter feeders (Balanus sp.), and 2 for 438
bivalves (dominated by Mytilus edulis) (Table 1). 439
For groups whose biomass was not forced, the construction of the wind farm induced an increase in the 440
biomass of top predators, except for “diving seabirds” (Table 1). The biomass of sea bream and plaice were 441
higher in the REEF scenario than in the BOWF model (approximately 3 times higher, respectively; Table 1). 442

16
In contrast, Atlantic horse mackerel, poor cod, and piscivorous fish declined strongly with a 55%, 81%, and 443
97% diminution, respectively (Table 1). The biomass of benthic invertebrates, deposit feeders and 444
suprabenthos also decreased in the REEF scenario (with a decrease of 17% and 15% respectively). The ratio 445
of fish biomass over invertebrate biomass was reduced by approximately 34% between the two periods 446
(BOWF model/REEF scenario). This was related to the strong increase in benthic invertebrate biomass that 447
was multiplied by approximately 2 in the REEF scenario, while fish biomass was multiplied by 1.1 only. These 448
The keystoneness index varied between the two periods as biomasses changed (Fig. 4; see Table 1 in 449
Appendix A). Pouting was the functional group with the highest keystoneness index in the two scenarios. In 450
the BOWF model, benthic invertebrate predators occupied the second place followed by harbor porpoise 451
whereas in the REEF scenario, zooplankton occupied the second place and was followed by benthic 452
invertebrate predators. 453
The total ecosystem activity (T..), representing the sum of all flows in the system, increased between the two 454
periods by approximately 13.96% (Table 2). The System Omnivory index (SOI) of the 2 trophic webs increased 455
by 15.03% (from 0.173 to 0.199) between the two periods. This increase should be related to the variations 456
of pouting omnivory (i.e. increased by a factor of 3). The Finn’s Cycling Index (FCI) increased by 40% between 457
the two scenarios (Table 2). This result is in line with the increase of detritivory (mainly due to benthic 458
invertebrate predators and filter feeders), which doubled. The ascendency (A) increased by 15% (Table 2). 459
The transfer efficiencies (TE) showed a similar pattern in between the two periods, decreasing with TL in the 460
2 models (Fig. 5). However, values were slightly lower in the REEF scenario. 461
<Figure 5> 462
The comparison of compartment throughflows before and after the construction of the offshore wind farm 463
showed that activity of top predators, except for “diving seabirds”, increased after the construction. The 464
compartments sharks and rays, Atlantic cod, whiting, pouting, European sprat and sea bream strongly 465
increased their activity after the construction as well (Fig.6 ). A similar pattern was observed with all flat fish 466
groups (i.e. sole, plaice, and other flatfish). Activity strongly increased after the construction in some benthic 467
groups, namely invertebrate predators, filter feeders and bivales. In contrast, other benthic groups such as 468
king scallop, deposit feeders and suprabenthos, reduced their overall activity once the offshore wind farm 469
was built. 470
<Figure 6> 471

17
The system overall EE (the percentage of production consumed by predators including fishing activities) 472
increased by 5% between the two periods. For instance, the phytoplankton biomass and P/B remained 473
unchanged in the REEF scenario but its EE increased by 32%. The biomasses and consumptions exerted by 474
bivalves and benthic invertebrates filter feeders were higher in the REEF scenario than in the BOWF model; 475
consuming/grazing more phytoplankton (e.g. until 4 times higher for filter feeders; Table 1). The EE of these 476
species were also higher in the REEF scenario due to the fact that they were more consumed by fish such as 477
cod, pouting and sea bream. The EE of these fish species were also higher as they were more consumed by 478
marine mammals. For instance, Atlantic cod was consumed approximately 5 and 3.5 times more by cetaceans 479
and seals, respectively, after the wind farm implantation. Again, after the construction, the consumption of 480
detritus in the system increased by 68.5%. 481
In terms of flow analysis, the detritivory/herbivory ratio (D/H) increased by 18.8% between the two periods. 482
The detritivory was multiplied by 1.5 and the herbivory was multiplied by 1.2 between the two situations. 483
3.3 Sensitivity analyses 484
The results of the four scenarios (presented in the Supplementary material, Appendix B) highlight that the 485
choices made in the “REEF” scenario were robust as they show that even considering a possible range of 486
variability, we obtained the same main results. 487
For instance, for groups without forced biomass at the start of the simulation, the construction of the wind 488
farm induced an increase in biomass, especially for top predators, in the four additional scenarios (Table 1, 489
in Supplementary Material, Appendix B). For instance, the biomass of sea bream after 30 years of simulations 490
were higher in the four scenarios than in the “BOWF” Ecopath model (approximately 3 times higher in the 491
“REEF Filter Feeders” and “time lag” scenarios and approximately 4 times higher in the “REEF Bivalve V5” and 492
“V10” (Table 1, in Supplementary material, Appendix B)). On the same line, the biomass of plaice was higher 493
in the four scenarios compared to the BOWF Ecopath model (approximately 3 times higher). This generalized 494
increase in apex predators was congruent with the one highlighted under the “REEF” scenario. However, in 495
the “REEF Filter feeders”, the biomass of predatory fish (cod, whiting) resulting from this simulation 496
increased, but this increase was inferior to the input that we originally entered for the “REEF scenario”. The 497
difference can be explained because EwE takes into account only prey-predator interactions and does not 498
take into account other indirect effects such as the reserve effect that exist in the park where biomass 499
sampling was performed. 500
In terms of flow analysis, we observed an increase in the Detritivory/Herbivory ratio (D/H) between the BOWF 501
model and the different scenarios (Table 2, in Supplementary Material, Appendix B). For instance, the D/H 502

18
increased by 11%, 17%, 20% in the “REEF filter feeders”, “REEF time lag”, “Reef mussel V5”, “Reef mussel 503
V10”, respectively (Table 2, in Supplementary Material, Appendix B). Other ENA indices remained mostly 504
unchanged under the different scenarios. Again, this change in D/H was in accordance with the conclusion 505
drawn from the “Standard REEF” scenario. 506
4. Discussion 507
4.1 Food web control before the installation of the offshore wind farm 508
From a methodological point of view, the high value of the pedigree index indicated that the input data used 509
in the reference Ecopath model (BOWF model) were of good quality when compared to the distribution of 510
pedigree values for pre-existing models (Morissette, 2007). In fact, the pedigree index (0.523) was in the 511
highest part of the range (0.164 to 0.676) reported in Morissette (2007). Indeed, biomass data were mainly 512
obtained from local, highly replicated, and detailed samplings and the diet compositions of the main fish 513
species came from stomach content studies performed in the eastern English Channel. 514
The Courseulles-sur-mer food web appeared to be mostly controlled by intermediate trophic levels. First, the 515
MTI analysis revealed that benthic invertebrate predators and pouting, which occupied an intermediate 516
trophic level (TL= 3 and TL=3.7 respectively), had a strong impact on numerous groups of both higher and 517
lower trophic levels in the system. For instance, pouting supported a high diversity of predators (i.e. marine 518
mammals, cephalopods, elasmobranch and teleosts) and fed mainly on benthic invertebrate predators (i.e. 519
crustaceans), filter feeders, and suprabenthos. This result concurred with the high ranking of pouting in the 520
keystoneness index (classification see Table 1 in Appendix A). A keystone group is defined as a group having 521
a high structuring impact on the other groups, despite a relatively low biomass (Power et al., 1996). Since 522
pouting biomass was high (i.e. 3.85 gC m-2 year-1), this group was likely to be a key structuring group in the 523
system rather than a keystone group sensu Power et al. (1996). These results suggest a possible “wasp-waist” 524
control of the system by intermediate trophic levels (Cury et al., 2000). In “wasp-waist” systems, the flow of 525
energy is controlled by the mid-trophic levels rather than the bottom or top organisms. The mid-trophic levels 526
exert top-down control on zooplankton and benthic groups, and bottom-up control on top predators (Cury 527
et al., 2000). This type of control has generally been demonstrated to be the norm for small plankton-feeding 528
pelagic species, such as anchovies and sardines, in upwelling pelagic ecosystems around the world (Cury et 529
al., 2000, 2004; Coll et al 2006; Bakun, 2006). The role played here by pouting, a demersal species, was hence 530
an original feature of the Courseulles-sur-mer food web. Pouting could then be considered as a benthic 531
equivalent of sardines but with a higher position in the food web compared to examples involving small 532
pelagics. However, these results are only based on the MTI and Keystoneness analysis that are interrelated 533
and must be taken with caution. 534

19
4.2 Potential impacts of the reef effect inside the offshore wind farm on the trophic web 535
functioning 536
As the results show that even considering a possible range of variability through the 4 variants of the “REEF” 537
scenario, we obtained the same main results, we choose to discuss only the results of the “REEF” scenario 538
(Supplementary Material, Appendix B). 539
The construction of the Courseulles-sur-mer offshore wind farm was suspected to increase detritivory in the 540
food web. As expected, the D/H ratio changed positively between the two periods, underlying the importance 541
of the trophic interactions involved in the detrital chain (Dame and Christian, 2007). This was related to the 542
higher consumption of detritus by benthic organisms and might confirm the hypothesis of Norling and 543
Kautsky (2007, 2008) by which blue mussels expansion could be responsible for a shift from primary 544
producers and grazers dominated food chains towards a more detritus-feeding community. Sessile 545
organisms, such as blue mussels colonizing the 75 turbines, are indeed expected to enhance the benthic 546
production of food for fish and benthic organisms through the deposition of organic matter such as feces and 547
dead organisms (Wilhemsson et al., 2006; Maar et al., 2009). Wind turbines and scour protections were 548
identified as offering particularly favorable substrates and feeding conditions for blue mussels in field studies 549
(Wilhelmsson, et al., 2006; Wilhelmsson and Malm, 2008; Maar et al., 2009; Krone et al., 2013). Bivalves can 550
form dense belts and, in some cases, account for almost 97% of the total epibenthic biomass on foundations 551
(Maar et al., 2009). According to Maar et al. (2009), wind turbines can support a mussel biomass ten times 552
higher per unit area than the one observed on bridge pillings in the same region, and the growth of blue 553
mussels on turbines can also double the biomass of filter feeders in a wind farm area as a whole compared 554
to the situation before its construction. Another potential effect suggested in the litterature is an input of 555
organic material from fish and crustaceans closely associated with the turbines as well as an entrapment of 556
organic material by the turbines themselves, contributing to an enrichment of the seabed and enhancing the 557
abundance of deposit-feeding organisms and their predators (Maar et al., 2009; Wilhelmsson et al., 2010). 558
This material provided an additional source of food but, more importantly, a different “food quality” (Koller 559
et al., 2006). In soft bottom communities, filters and detritus feeders feed on small particulate matter 560
deposited on the seabed (Koller et al., 2006). Koller et al. (2006) stated that this different quality of food 561
coming from the wind turbines was responsible for a “shortcut within the food web” because this resource 562
was consumed by larger predators and scavengers. Other effects suggested in the literature, but that could 563
not be demonstrated here as our flows were only in carbon currency, are that the increase in filter feeders 564
biomass, and more particularly in blue mussels, could imply an increased excretion of ammonium and thus a 565
clearer water (reduction of water turbidity), which in turn could lead to an increase in growth rates of 566
phytoplankton and filamentous algae (Kautsky and Evans, 1987; Prins and Smaal, 1994; Norling and Kautsky, 567
2008). 568
The introduction of turbines with their associated scour protections generated an additional source of food 569
in the ecosystem. Habitats created by the monopile foundations and the fauna they harbour were 570
20
responsible for an increase in the system total biomass. Possibly due to the biomass modifications, EE values 571
(the percentage of production consumed by predators) of the whole ecosystem showed an increase of 5%. 572
This result can be explained by the increase in predation exerted by the species attracted by the reef effect. 573
For instance, our model showed that the benthic invertebrates colonising the monopile foundations served 574
in turn as food resources for other species such as poutings and sea breams. The related increases in pouting, 575
cod and sea bream biomass was in fine beneficial to their predators, notably marine mammals. These results 576
confirm the hypothesis enounced in the introduction of this study that the benthic biomass increase acts as 577
an additional prey resource for higher trophic levels up to apex predators (Lindeboom et al., 2011; Scheidat 578
et al., 2011; Russell et al., 2014). This result was also in line with the stomach content analyses of Reubens et 579
al. (2011), who demonstrated that pouting fed on the macrobenthos produced on the Thornton bank wind 580
turbines in the Belgian part of the North Sea. For instance, the amphipode, Jassa herdmani, presented a 581
numerical abundance index of 84.6% and it was the most important prey species of the pouting dietary 582
composition (Reubens et al., 2011). Moreover, it could be assumed that seabirds strongly profit from 583
additional biomass of epifaunal bivalves on the 75 turbines as they would become easily available. These 584
basic parameters estimates analysis was to some point consistent with the relatively low values of SOI 585
indicating a chain-like structure both before and after the installation of the offshore wind farm. 586
According to our model, the “reef effect” generated by the construction of the Courseulles-sur-mer offshore 587
wind farm was predicted to have a relatively limited impact on the structure and flow pattern of the local 588
food web. The comparison of the ENA indices (total ecosystem activity (T..), system omnivory index (SOI), 589
ascendency (A) and keystoneness) between the BOWF model and the REEF scenario showed small variations 590
between the two periods. Furthermore, the transfer efficiencies (TE) decreased parallely with TL in the 2 591
models indicating that the compartments, although exposed to an increase in biomass of some specific 592
groups, behaved functionally in a similar way under the two scenarios. Ecopath is a single solution model and 593
so direct statistical comparisons were not possible. As network indices of Ascendency are scaled according 594
to log values of combinations of flows, small changes expressed in percentages could reflect much larger 595
disparities, and hence larger ecological changes (Ulanowicz 1986; Baird & Ulanowicz 1993). In addition, the 596
ENA results from the BOWF model and the REEF scenario can be compared with other ecosystems studied 597
with the same methodology (Ecopath) and located in the same biome such as the Bay of Somme (Rybarczyck 598
et al., 2003), the Dublin Bay (Wilson and Parkes, 1998), and the Seine Estuary (Tecchio et al., 2015). Values 599
of ENA indices in both situations for the Courseulles-sur-mer area remained in the range delimited by these 600
similar ecosystems, suggesting no major trophic structural and functional shift due to the installation of an 601
offshore wind farm (Table 2). 602
<Table 2> 603

21
4.3 Advantages and limitations of the EwE models 604
Conceptually, the main asset of this study was to lay the foundations defining an ecosystem-based approach 605
to marine renewable energy management, in line with what has been done during the last 20 years in the 606
Ecosystem Approach to Fisheries (Garcia et al., 2003). Previous studies have largely focused on the 607
conservation of some groups of valuable species and their habitats only. The proposed model considered the 608
full range of size classes of biota, from prokaryotes to apex predators, for a representative site of the eastern 609
Bay of Seine basin: the Courseulles-sur-mer offshore future wind farm. The approach for this specific site can 610
then be transposed to other wind farm projects in the English Channel and broadly to other shallow and 611
macrotidal seas of temperate latitudes. Applying this modelling method can enrich the field of environmental 612
impact studies on future offshore wind farms and, more generally, on marine renewable energy sites. 613
Models for offshore wind farms are by definition atypical due to their intrinsic small spatial scale (here, 50 614
km2) with one on the main drawbacks being the fact that the population dynamics and home range of mobile 615
species vastly exceed the limits of wind farm sites. Here, as a partial solution, we considered trophic transfers 616
outside the area of the Courseulles-sur-mer offshore wind farm for marine mammals and seabirds by setting 617
imports in the diet composition matrix. This limitation is common to all Ecopath small-scale models (e.g. 618
marine protected areas (Albouy et al., 2010; Colléter et al., 2012; Valls et al., 2012). Regarding community 619
changes, our choice here was to use estimates derived from the literature and expert knowledge and not 620
from complex models. This option was relevant here as a lot of information coming from the offshore wind 621
farms already in exploitation could be extracted and helped formulating meaningful hypotheses. Another 622
possibility would have been to use these data for calibrating a community model predicting the changes in 623
existing species and at the same time the arrival of new species around the turbines. Finally, the BOWF model 624
and REEF scenario could not simulate all possible impacts generated by the increased biomass of mussels on 625
biogeochemical process such as the excretion of ammonium as our model is based only on carbon flows. 626
5. Conclusions 627
This ecosystem-based approach of offshore wind farm impacts showed 1) an original control of the 628
Courseulles-sur-mer site food web by pouting at the intermediate trophic levels, indicating a potentially 629
“wasp-waist” controlled food web, 2) that the anticipated increase of mussel biomass after the offshore wind 630
farm construction is predicted to lead to a food web dominated by detritivory, as hypothesized by Norling 631
and Kautsky (2008), and (3) that the anticipated increase in benthic invertebrate and benthos feeding fish 632
biomass, in response to the reef effect, is predicted to attract and benefit to apex predators, as hypothesized 633
by Lindeboom et al. (2011) and Henkel et al. (2014). 634
By combining the data collected on various ecosystem components, we determine in this study how the local 635
food web structure and function may change 30 years after the installation of the offshore wind farm. The 636

22
Ecopath models built in this study can then be useful to interpret how other threats, such as climate change 637
or restrictions of fisheries activities within the offshore wind farm limits, can further affect the trophic web 638
structure and functioning. This study could be considered as a first step in using food web models to assess 639
offshore wind farm impacts on the whole ecosystem. 640
ACKNOWLEDGEMENTS 641
This work was co-funded by the Normandy Region and by the group “Eoliennes Offshore du Calvados” (EOC). 642
We also acknowledge, for their help in compiling the datasets and for giving expert advices: Georges Safi 643
and Jean-Paul Robin (UMR BOREA, Caen), Alexandrine Baffreau, Sandric Lesourd and Maxime Navon (UMR 644
M2C, Caen), Ludivine Martinez, Jérôme Spitz and Charlotte Lambert (Observatoire PELAGIS, La Rochelle), 645
Francis Gohin and Maria Ching Villanueva (IFREMER, Brest), Gregory Certain (Université de Suède des 646
Sciences de l’Agriculture, Uppsala), James Jean Baptiste (Groupe Ornithologique Normand, Caen) and Nicolas 647
Bacq (Groupement d’Intérêt Public “Seine-Aval”). This work was an introduction to the project Trophik 648
(ANR/FEM EMR-ITE 2015). 649
650

23
Reference 651
Ahrens, R.N.M., Walters, C.J., Christensen, V., 2012. Foraging arena theory. Fish Fish. 13, 41–59. 652
doi:10.1111/j.1467-2979.2011.00432.x 653
Albouy C., Mouillot D., Rocklin D., Culioli J.-M. & Le Loc'h F. 2010. Simulation of the combined effects of 654
artisanal and recreational fisheries on a Mediterranean MPA ecosystem using a trophic model. Mar. 655
Ecol. Prog. Ser. 412: 207–221 656
Andersson, M.H., Öhman, M.C., 2010. Fish and sessile assemblages associated with wind-turbine 657
constructions in the Baltic Sea. Mar. Freshw. Res. 61, 642–650. doi:10.1071/MF09117 658
Baehr, A., Menet-nedelec, F., Riou, P., Fontaine, B., Francoise, S., Gangnery, A., Jacqueline, F., Lamort, L., 659
Lesaulnier, N., Maheux, F., Picoche, C., Pierre-duplessix, O., Rabiller, E., Simon, B., 2014. Réseau 660
Hydrologique Littoral Normand (RHLN) – Suivi 2012. Ifremer. pp.212 661
Bailey, H., Brookes, K.L., Thompson, P.M., 2014. Assessing environmental impacts of offshore wind farms : 662
lessons learned and recommendations for the future. Aquat. Biosyst. 10, 1–13. doi:10.1186/2046-9063-663
10-8 664
Baird, D., Ulanowicz, R.E., 1993. Comparative study on the trophic structure, cycling and ecosystem 665
properties of four tidal estuaries. Mar. Ecol. Prog. Ser. 99, 221–237. 666
Baird, D., Christian, R.R., Peterson, C.H., Johnson, G. a., 2004. Consequences of hypoxia on estuarine 667
ecosystem function: Energy diversion from consumers to microbes. Ecol. Appl. 14, 805–822. 668
doi:10.1890/02-5094 669
Bakun, A., 2006. Wasp-waist populations and marine ecosystem dynamics: Navigating the “predator pit” 670
topographies. Prog. Oceanogr. 68, 271–288. doi:10.1016/j.pocean.2006.02.004 671
Bergström, L., Kautsky, L., Malm, T., Ohlsson, H., Wahlberg, M., Rosenberg, R., Capetillo, N.Å., 2012. The 672
effects of wind power on marine life on marine life - A synthesis. REPORT 6512 October 2012. 673
Bergström, L., Sundqvist, F., Bergström, U., 2013. Effects of an offshore wind farm on temporal and spatial 674
patterns in the demersal fish community. Mar. Ecol. Prog. Ser. 485, 199–210. doi:10.3354/meps10344 675
Boehlert, G.W., Gill, A.B., 2010. Environmental and ecological effects of ocean renewable energy 676
development: a current synthesis. Oceanography 23, 68–81. 677
oi:http://dx.doi.org/10.5670/oceanog.2010.46 678
Boyd, I.A., 2002. Energetics: consequences for fitness. In: Hoelzel, A.R. (Ed.), Marine Mammal Biology an 679
Evolutionary Approach. Blackwell Science, pp.247–278. 680
Bradford-Grieve, J.M., Probert, P.K., Nodder, S.D., Thompson, D., Hall, J., Hanchet, S., Boyd, P., Zeldis, J., 681
Baker, A.N., Best, H. a., Broekhuizen, N., Childerhouse, S., Clark, M., Hadfield, M., Safi, K., Wilkinson, I., 682
2003. Pilot trophic model for subantarctic water over the Southern Plateau, New Zealand: A low 683
biomass, high transfer efficiency system. J. Exp. Mar. Biol. Ecol. 289, 223–262. doi:10.1016/S0022-684
0981(03)00045-5 685
Brey, T., Müller-Wiegmann, C., Zittier, Z.M.C., Hagen, W., 2010. Body composition in aquatic organisms — A 686
global data bank of relationships between mass, elemental composition and energy content. J. Sea Res. 687
64, 334–340. doi:10.1016/j.seares.2010.05.002 688
Brey, T., 2001. Population Dynamics in Benthic Invertebrates. A Virtual Handbook. http://thomas-689
brey.de/science/virtualhandbook. 690
Brunel, P., Besner, M., Messier, D., Poirier, L., Granger, D., Weinstein, M., 1978. Le traîneau suprabenthique 691
MACER-GIROQ : appareil amélioré pour l'échantillonnage quantitatif étagé de la petite faune nageuse 692
au voisinage du fond. Int. Revue. Hydrobiol. 63, 815-829. 693
Cachera, M. 2013. mplications of morphological and functional traits for trophic relationships within fish 694
communities and marine trophic network architecture. Thèse de doctorat de l’Université Sciences et 695
Technologies de Lille, France. pp 247. 696
Chaalali, A., Saint-Béat, B., Lassalle, G., Le Loc’h, F., Tecchio, S., Safi, G., Savenkoff, C., Lobry, J., Niquil, N., 697
2015. A new modeling approach to define marine ecosystems food-web status with uncertainty 698
assessment. Prog. Oceanogr. 135, 37–47. doi:10.1016/j.pocean.2015.03.012 699
Chardy, P., 1987. Modèle de simulation du système benthique des sédiments grossiers du golfe normand-700
breton (Manche). Oceanol. Acta. 10, 421-434. 701
Chardy, P., Dauvin, J.C., 1992. Carbon flows in a subtidal fine sand community from the western English 702
Channel: a simulation analysis. Mar. Ecol. Prog. Ser. 81, 147-161. 703

24
Christensen, V., Walters, C.J., 2004. Ecopath with Ecosim: methods, capabilities and limitations. Ecol. Modell. 704
172, 109–139. doi:10.1016/j.ecolmodel.2003.09.003 705
Christensen, V., Walters, C.J., Pauly, D., 2005. Ecopath with Ecosim: A User’s Guide. Fisheries Centre. 706
University of British Columbia, Vancouver, Canada, pp. 154. 707
Christensen, V., Walters, C.J., Pauly, D., Forrest, R., 2008. Ecopath with Ecosim version 6 User Guide. Lensfest 708
Ocean Futures Project 2008 1–235. 709
Christensen, V., Walters, C.J., Ahrens, R., Alder, J., Buszowski, J., Christensen, L.B., Cheung, W.W.L., Dunne, 710
J., Froese, R., Karpouzi, V., Kaschner, K., Kearney, K., Lai, S., Lam, V., Palomares, M.L.D., Peters-Mason, 711
A., Piroddi, C., Sarmiento, J.L., Steenbeek, Sumaila, R., Watson, R., Zeller, D., Pauly, D., 2009. Database-712
driven models of the world’s large marine ecosystems. Ecol. Model. 220, 1984–1996. 713
Coll, M., Palomera, I., Tudela, S., Sardà, F., 2006. Trophic flows, ecosystem structure and fishing impacts in 714
the South Catalan Sea, Northwestern Mediterranean. J. Mar. Syst. 59, 63–96. 715
doi:10.1016/j.jmarsys.2005.09.001 716
Colléter, M.,Gascuel, D.,Ecoutin, J.-M.,Tito de Morais, L., 2012. Modelling trophic flows in ecosystems to 717
assess the efficiency of marine protected area (MPA), a case study on the coast of Sénégal. Ecol. Model. 718
232, 1–13 719
Cury, P., 2000. Small pelagics in upwelling systems: patterns of interaction and structural changes in “wasp-720
waist” ecosystems. ICES J. Mar. Sci. 57, 603–618. doi:10.1006/jmsc.2000.0712 721
Daly, H.I., Pierce, G.J., Santos, M.B., Royer, J., Cho, S.K., Stowasser, G., Robin, J.P., Henderson, S.M., 2001. 722
Cephalopod consumption by trawl caught fish in Scottish and English Channel waters. Fish. Res. 52, 51–723
64. doi:10.1016/S0165-7836(01)00230-2 724
Dame, J.K., Christian, R.R., 2007. A Statistical Test of Network Analysis: Can it Detect Differences in Food Web 725
Properties? Ecosystems 10, 906–923. doi:10.1007/s10021-007-9068-1 726
Dauvin, J.C., Lozachmeur, O., Capetc, Y., Dubrulle, J.B., Ghezalic, M., Mesnard, A.H., 2004. Legal tools for 727
preserving France's natural heritage through integrated coastal zone management. Ocean Coast. Mgmt. 728
47, 463-477. 729
Dauvin, J.C., Ruellet, T., Desroy, N., Janson, A.L., 2007. The ecological quality status of the Bay of Seine and 730
the Seine estuary: Use of biotic indices. Mar. Pollut. Bull. 55, 241–257. 731
doi:10.1016/j.marpolbul.2006.04.010 732
Dauvin, J.C., Ruellet, T., 2008. Macrozoobenthic biomass in the Bay of Seine (eastern English Channel). J. Sea. 733
Res. 59, 320–326. doi:10.1016/j.seares.2008.02.003 734
Dauvin, J.C., 2015. History of benthic research in the English Channel: from general patterns of communities 735
to habitat mosaic description. J. Sea. Res. 100, 32-45.Degraer, S., Brabant, R., Rumes, B., 2013. 736
Environmental impacts of offshore wind farms in the Belgian part of the North Sea: Learning from the 737
past to optimise future monitoring programmes. Royal Belgian Institute of Natural Sciences (RBINS), 738
Operational Directorate Natural Environment, Marine Ecology and Management Section: Brussels. ISBN 739
978-90-9027 pp. 928-2. 239. 740
De Mesel, I., Kerckhof, F., Norro, A., Rumes, B., Degraer, S., 2015. Succession and seasonal dynamics of the 741
epifauna community on offshore wind farm foundations and their role as stepping stones for non-742
indigenous species. Hydrobiologia 756, 37–50. doi:10.1007/s10750-014-2157-1 743
De Pierrepont, J.F., Dubois, B., Desormonts, S., Santos, M.B., Robin, J.P., 2005. Stomach contents of English 744
Channel cetaceans stranded on the coast of Normandy. J. Mar. Biol. Assoc. UK 85, 1539. 745
doi:10.1017/S0025315405012762 746
Fath, B.D., Patten, B.C., 1999. Quantifying resource homogenization using network flow analysis. Ecol. Model. 747
123, 193–205. 748
Finn, J.T. 1980. Flow analysis of models of the Hubbard Brook ecosystem. Ecology 61: 562-571. 749
Garcia, S.M.M., Zerbi, A., Aliaume, C., Do Chi, T., Lasserre, G., 2003. The ecosystem approach to fisheries. FAO 750
Fish.Tech. Pap. 443, 71. doi:10.1111/j.1467-2979.2010.00358.x 751
Garcia, C., Chardy, P., Dewarumez, J.M., Dauvin, J.C., 2011. Assessment of benthic ecosystem functioning 752
through trophic web modelling: the example of the eastern basin of the English Channel and the 753
Southern Bight of the North Sea. Mar Ecol 32 (Suppl. 1), 72-86 754
Gentil, F.,Cabioch, L., 1997. Carte des peuplements macrobenthiques de la Baie de Seine et Manche centrale 755
sud. Carte et notice explicative de la carte. Editions de la station Biologique de Roscoff. pp. 18. 756

25
Goberville, E., Beaugrand, G., Sautour, B., Treguer, P., Somlit team, 2010. Climate driven changes in coastal 757
marine systems of Western Europe. Mar. Ecol. Prog. Ser. 408, 129-147. 758
Henkel, S.K., Suryan, R.M., Lagerquist, B.A., 2014. Marine Renewable Energy and Environmental Interactions: 759
Baseline Assessments of Seabirds, Marine Mammals, Sea Turtles and Benthic Communities on the 760
Oregon Shelf. In Shields, M.A., Payne, A.I.L. Marine renewable energy technology and environmental 761
interactions, Humanity and the Sea. Springer Sciences. pp. 176. 762
Heymans, J.J., Guénette, S., Christensen, V., 2007. Evaluating network analysis indicators of ecosystem status 763
in the Gulf of Alaska. Ecosystems 10, 488–502. doi:10.1007/s10021-007-9034-y 764
Hunt, G.L., Drew, G.S., Jahncke, J., Piatt, J.F., 2003. Prey consumption and energy transfer by marine birds in 765
the Gulf of Alaska. Deep. Res. Part Ii-Topical Stud. Oceanogr. 52, 781–797. 766
doi:10.1016/j.dsr2.2004.12.024 767
IPCC, 2014. Climate Change 2014: Synthesis Report. Contribution of Working Groups I, II and III to the Fifth 768
Assessment Report of the Intergovernmental Panel on Climate Change [Core Writing Team, R.K. 769
Pachauri and L.A. Meyer (eds.)]. IPCC, Geneva, Switzerland, pp. 151. 770
Kautsky, N., Evans, S., 1987. circulation of matter and nutrients in a Baltic. Mar. Ecol. Prog. Ser. 38, 201–212. 771
Kerckhof, F., Rumes, B., Jacques, T.J., Degraer, S., Norro, S. 2010. Early development of the subtidal marine 772
biofouling on a concrete offshore windmill foundation on the Thornton Bank (Southern North Sea): first 773
monitoring results. J. Underw. Technol. 29: 137–149. doi:10.3723/ut.29.137 774
Köller, J., Köppel, J., Peters, W., 2006. Offshore Wind Energy Research on Environmental Impacts. Springer-775
Verlag Berlin Heidelberg. pp.371. 776
Krone, R., Gutow, L., Brey, T., Dannheim, J., Schröder, A., 2013a. Mobile demersal megafauna at artificial 777
structures in the German Bight - Likely effects of offshore wind farm development. Estuar. Coast. Shelf 778
Sci. 125, 1–9. doi:10.1016/j.ecss.2013.03.012 779
Krone, R., Gutow, L., Joschko, T.J., Schröder, A., 2013b. Epifauna dynamics at an offshore foundation - 780
Implications of future wind power farming in the North Sea. Mar. Environ. Res. 85, 1–12. 781
doi:10.1016/j.marenvres.2012.12.004 782
Langhamer, O., 2012. Artificial Reef Effect in relation to Offshore Renewable Energy Conversion: State of the 783
Art. Sci. World J. 2012, 8. doi:10.1100/2012/386713 784
Lassalle, G., Lobry, J., Le Loc’h, F., Bustamante, P., Certain, G., Delmas, D., Dupuy, C., Hily, C., Labry, C., Le 785
Pape, O., Marquis, E., Petitgas, P., Pusineri, C., Ridoux, V., Spitz, J., Niquil, N., 2011. Lower trophic levels 786
and detrital biomass control the Bay of Biscay continental shelf food web: Implications for ecosystem 787
management. Prog. Oceanogr. 91, 561–575. doi:10.1016/j.pocean.2011.09.002 788
Latham, L.G., 2006. Network flow analysis algorithms. Ecol. Model. 192, 586–600. 789
Leitão, F., 2013. Artificial Reefs : From Ecological Processes To Fishing Enhancement Tools. Brazilian J. 790
Oceanogr. 61, 77–81. doi:10.1590/S1679-87592013000100009 791
Le Loc’h, F., 2004. Structure, fonctionnement, évolution des communautés benthiques des fonds meubles 792
exploités du plateau continental Nord Gascogne. Thèse de Doctorat, Université de Bretagne 793
Occidentale, Océanographie Biologique, Brest, France. pp. 379. 794
Leonhard, S., Stenberg, C., Støttrup, J., 2011. Effect of the Horns Rev 1 Offshore Wind Farm on Fish 795
Communities Follow-up Seven Years after Construction. DTU Aqua Rep. pp. 99. 796
Libralato, S., 2008. System Omnivory Index. Ecol. Indic. 4, 3472–3477. 797
Libralato, S., Christensen, V., Pauly, D., 2006. A method for identifying keystone species in food web models. 798
Ecol. Modell. 195, 153–171. doi:10.1016/j.ecolmodel.2005.11.029 799
Lindeboom, H.J., Kouwenhoven, H.J., Bergman, M.J.N., Bouma, S., Brasseur, S., Daan, R., Fijn, R.C., de Haan, 800
D., Dirksen, S., van Hal, R., Hille Ris Lambers, R., ter Hofstede, R., Krijgsveld, K.L., Leopold, M., Scheidat, 801
M., 2011. Short-term ecological effects of an offshore wind farm in the Dutch coastal zone; a 802
compilation. Environ. Res. Lett. 6, 035101. doi:10.1088/1748-9326/6/3/035101 803
Lindeman, R.L., 1942. The trophic dynamics aspect of ecology. Ecology 23, 399–418. 804
doi:10.1017/CBO9781107415324.004 805
Lobry, J., David, V., Pasquaud, S., Lepage, M., Sautour, B., Rochard, E., 2008. Diversity and stability of an 806
estuarine trophic network. Mar. Ecol. Prog. Ser. 358, 13–25. doi:10.3354/meps07294 807
Love, M.S., Hyland, J., Ebeling, A., Herrlinger, T., Brooks, A., Imamura, E., 1994. A Pilot Study of the 808
Distribution and Abundances of Rockfishes in Relation to Natural Environmental Factors and an 809

26
Offshore Oil and Gas Production Platform off the Coast of Southern California. Bull. Mar. Sci. 55, 1062-810
1085. 811
Love, M.S., Caselle, J., Snook, L., 1999., Fish assemblages on mussel mounds surrounding seven oil platforms 812
in the Santa Barbara Channel and Santa Maria Basin. Bull. Mar. Sci. 65, 497-513. 813
Maar, M., Bolding, K., Petersen, J.K., Hansen, J.L.S., Timmermann, K., 2009. Local effects of blue mussels 814
around turbine foundations in an ecosystem model of Nysted off-shore wind farm, Denmark. J. Sea Res. 815
62, 159–174. doi:10.1016/j.seares.2009.01.008 816
McIntyre, A.D., 1978. The benthos of the western North Sea.Rapp. P.-v. Réun. Cons. Int. Explor. Mer 172, 817
405-417. 818
Mackinson, S., Daskalov, G., 2007. An ecosystem model of the North Sea to support an ecosystem approach 819
to fisheries management: description and parameterisation. Sci. Ser. Tech. Rep. CEFAS 142. 820
MEDDE. 2012. Energies Marines renouvelables, etudes méthodolologique des impacts environnementaux et 821
socio-économiques. pp. 357. 822
Martinez, L., Falchetto, H., Pettex, E., Vincent, C., Peltier, H., Ridoux, V., 2014. Etude des mammifères marins 823
dans le cadre du parc éolien en mer du Calvados : Analyse des données existantes , synthèse 824
bibliographique et préconisations de suivi 122. 825
Morel, 2013. Bilan et actualisation des études ornithologiques menées entre 2008 et 2010 par le Groupe 826
ornithologique normand. Projet de parc éolien en mer au large de Courseulles-sur-mer ( Calvados ). pp. 827
44. 828
Morissette, L., 2007. Complexity, Cost and Quality of Ecosystem Models and Their Impact on Resilience: A 829
Comparative Analysis, with Emphasis on Marine Mammals and the Gulf of St. Laurence Zoology. 830
University of British Columbia, Vancouver BC, Canada. 831
Mueller-Blenkle, C., McGregor, P.K., Gill, A.B., Andersson, M.H., Metcalfe, J., Bendall, V., Sigray, P., Wood, 832
D.T., Thomsen, F., 2010. Effects of Pile-driving Noise on the Behaviour of Marine Fish. COWRIE Ref: Fish 833
06-08. 834
Nelson, B., 1979. Seabirds: their Biology and Ecology. A&W Publishers Inc., NewYork USA. 835
Nilsson, S.G., Nilsson, I.., 1976. Numbers, food consumption, and fish predation by birds in Lake Möckeln, 836
Southern Sweden. Ornis Scand. 7, 61-70. 837
Niquil, N., Chaumillon, E., Johnson, G. a., Bertin, X., Grami, B., David, V., Bacher, C., Asmus, H., Baird, D., 838
Asmus, R., 2012. The effect of physical drivers on ecosystem indices derived from ecological network 839
analysis: Comparison across estuarine ecosystems. Estuar. Coast. Shelf Sci. 108, 132–143. 840
doi:10.1016/j.ecss.2011.12.031 841
Niquil, N., Baeta, A., Marques, J.C., Chaalali, A., Lobry, J., Patrício, J., 2014. Reaction of an estuarine food web 842
to disturbance: Lindeman’s perspective. Mar Ecol Prog Ser. 512, 141-154. 843
Norling, P., Kautsky, N., 2007. Structural and functional effects of Mytilus edulis on diversity of associated 844
species and ecosystem functioning. Mar. Ecol. Prog. Ser. 351, 163-175. 845
Norling, P., Kautsky, N., 2008. Patches of the mussel Mytilus sp. are islands of high biodiversity in subtidal 846
sediment habitats in the Baltic Sea. Aquat. Biol. 4, 75–87. doi:10.3354/ab00096 847
Oguz, T., Salihoglu, B., Fach, B., 2008. A coupled plankton–anchovy population dynamics model assessing 848
nonlinear controls of anchovy and gelatinous biomass in the Black Sea. Mar. Ecol. Prog. Ser. 369, 229–849
256. doi:10.3354/meps07540 850
Ortiz, M., Wolff, M., 2002. Trophic models of four benthic communities in Tongoy Bay (Chile): comparative 851
analysis and preliminary assessment of management strategies. J. Exp. Mar. Bio. Ecol. 268, 205–235. 852
doi:10.1016/S0022-0981(01)00385-9 853
OSPAR, 2008. Background document on potential problems associated with power cables other than those 854
for oil and gas activities. OSPAR commission. pp. 50. 855
Patrício, J., Ulanowicz, R., Pardal, M. a., Marques, J.C., 2006. Ascendency as ecological indicator for 856
environmental quality assessment at the ecosystem level: A case study. Hydrobiologia 555, 19–30. 857
doi:10.1007/s10750-005-1102-8 858
Pauly, D., Soriano-Bartz, M., Palomares, M.L., 1993. Improved construction, parameterization and 859
interpretation of steady-state ecosystem models. In: Christensen, V., Pauly, D. (Eds.), Trophic Models of 860
Aquatic Ecosystems. ICLARM Conf. Proc. 26, 1–13. 861
Pearce, B., Fariñas-Franco, J.M., Wilson, C., Pitts, J., De Burg Z., Somerfield, P.J., 2014. Repeated mapping of 862

27
reefs constructed by Sabellaria spinulosa Leuckart 1849 at an offshore wind farm site. Cont. Shelf Res. 863
83,3 13. 864
Petersen, J.K., Malm, T., 2006. Offshore windmill farms: threats to or possibilities for the marine 865
environment. Ambio. 35, 75–80. 866
Polovina, J.J., 1984. Model of a coral reef ecosystem. I . The ECOPATH model and its application to French 867
Frigate Shoals. Coral Reefs. 3, 1–11. 868
Power, Mary E., Tilman, David., Estes, James A., Menge, Bruce A., Bond, William J., Mills, Scott., Daily, 869
Gretchen., Castilla, Juan Carlos., Lubchenco, Jane., Paine, R.T., 1996. Challenges in the Quest For 870
Keystone. Bioscience 46, 609–620. 871
Prins, T.C., Smaal, A.C., 1994. The role of the blue mussel Mytilus edulis in the cycling of nutrients in the 872
Oosterschelde estuary (The Netherlands). Hydrobiologia 282, 413–429. 873
Ratsimbazafy, R. A. (1998). Spectres de taille des peuplements benthiques de sables grossiers de la Manche. 874
Thèse de doctorat, Sciences biologiques et fondamentales appliquées. Psychologies. Paris, Muséum 875
National d'Histoire Naturelle. pp 523. 876
Reubens, J.T., Braeckman, U., Vanaverbeke, J., Van Colen, C., Degraer, S., Vincx, M., 2013. Aggregation at 877
windmill artificial reefs: CPUE of Atlantic cod (Gadus morhua) and pouting (Trisopterus luscus) at 878
different habitats in the Belgian part of the North Sea. Fish. Res. 139, 28–34. 879
doi:10.1016/j.fishres.2012.10.011 880
Reubens, J.T., Degraer, S., Vincx, M., 2014. The ecology of benthopelagic fishes at offshore wind farms: a 881
synthesis of 4 years of research. Hydrobiologia 727, 121–136. doi:10.1007/s10750-013-1793-1 882
Reubens, J.T., Degraer, S., Vincx, M., 2011. Aggregation and feeding behaviour of pouting (Trisopterus luscus) 883
at wind turbines in the Belgian part of the North Sea. Fish. Res. 108, 223–227. 884
doi:10.1016/j.fishres.2010.11.025 885
Rombouts, I., Beaugrand, G., Fizzala, X., Gaill, F., Greenstreet, S.P.R., Lamare, S., Le Loc’h, F., McQuatters-886
Gollop, a., Mialet, B., Niquil, N., Percelay, J., Renaud, F., Rossberg, a. G., Féral, J.P., 2013. Food web 887
indicators under the Marine Strategy Framework Directive: From complexity to simplicity? Ecol. Indic. 888
29, 246–254. doi:10.1016/j.ecolind.2012.12.021 889
Rybarczyk, H., Elkaïm, B., 2003. An analysis of the trophic network of a macrotidal estuary: The Seine Estuary 890
(Eastern Channel, Normandy, France). Estuar. Coast. Shelf Sci. 58, 775–791. doi:10.1016/S0272-891
7714(03)00184-7 892
Rybarczyk, H., Ochs, L., Loquet, N., Elkaı¨m, B. 2003. Analysis of the trophic network of a macrotidal 893
ecosystem: the Bay of Somme (Eastern Channel). Estuar. Coast. Shelf Sci. doi:10.1016/S0272-894
7714(02)00294-9. 895
Salomon, J.C., Breton, M., 1991. Courants résiduels de marée dans la Manche. Oceanol. Acta. 11, 47-53. 896
Salomon, J.C., Breton, M., 1993. An atlas of long-term currents in the Channel. Oceanol. Acta. 16, 439–448. 897
Sanchez, F., Olaso, I., 2004. Effects of fisheries on the Cantabrian Sea shelf ecosystem. Ecol. Model. 172, 151–898
174. 899
Scheidat, M., Tougaard, J., Brasseur, S., Carstensen, J., van Polanen Petel, T., Teilmann, J., Reijnders, P., 2011. 900
Harbour porpoises ( Phocoena phocoena ) and wind farms: a case study in the Dutch North Sea. Environ. 901
Res. Lett. 6, 025102. doi:10.1088/1748-9326/6/2/025102 902
Shields, M.A., Payne, A.I.L., 2014. Marine renewable energy technology and environmental interactions, 903
Humanity and the Sea. Springer Sciences. pp. 176. 904
Souissi, S., 2007. Etude du comportement natatoire, de la reproduction et du développement d’Eurytemora 905
affinis: combinaison des approches expérimentale au laboratoire et in situ et modélisation. Seine-Aval 906
Scientific Report 3, France, pp. 63. 907
Spitz, J., Richard, E., Meynier, L., Pusineri, C., Ridoux, V., 2006. Dietary plasticity of the oceanic striped dolphin, 908
Stenella coeruleoalba, in the neritic waters of the Bay of Biscay. J. Sea Res. 55, 309–320. 909
doi:10.1016/j.seares.2006.02.001 910
Spitz, J., Mourocq, E., Schoen, V., Ridoux, V., 2010. Proximate composition and energy content of forage 911
species from the Bay of Biscay: high or lowquality food? ICES, J. Mar. Sci. 67, 909–915. 912
doi:10.1093/icesjms/fsq008 913
Tecchio, S., Coll, M., Christensen, V., Company, J.B., Ramírez-Llodra, E., Sardà, F., 2013. Food web structure 914
and vulnerability of a deep-sea ecosystem in the NW Mediterranean Sea. Deep Sea Res. Part I 75, 1–15. 915

28
doi:10.1016/j.dsr.2013.01.003 916
Tecchio, S., Tous Rius, A., Dauvin, J.-C., Lobry, J., Lassalle, G., Morin, J., Bacq, N., Cachera, M., Chaalali, A., 917
Villanueva, M.C., Niquil, N., 2015. The mosaic of habitats of the Seine estuary: Insights from food-web 918
modelling and network analysis. Ecol. Modell. 312, 91–101. doi:10.1016/j.ecolmodel.2015.05.026 919
Trites, A.W., Pauly, D., 1998. Estimating mean body masses of marine mammals from maximum body lengths. 920
Can. J. Zool. 76, 886–896. 921
Ulanowicz, R.E., 1986. Growth and Development: Ecosystems Phenomenology. Springer-Verlag, New York 922
Ulanowicz, R.E., 1992. Ecosystem health and trophic flow networks. In: Costanza R, Norton BG, Haskell BD 923
(eds) Ecosystem health: new goals for environmental manage-ment. Island Press, Washington, DC, pp 924
190−225. 925
Ulanowicz, R.E., Puccia, C.J., 1990. Mixed trophic impacts in ecosystems. Coenoses 5, 7–16. 926
Vallet, C., 1997. Le compartiment suprabenthique des fonds circalittoraux de la manche : composition 927
faunistique et quantitative, et role des transferts benthos/pelagos. Thèse de doctorat en Sciences 928
biologiques et fondamentales appliquées. Psychologie, Paris. pp. 422. 929
Valls, A., Gascuel, D., Guénette, S., Francour, P., 2012. Modeling trophic interactions to assess the effects of 930
a marine protected area: case study in the NW Mediterranean Sea. Mar. Ecol. Prog. Ser. 456, 201–214 931
Walters, C., Christensen, V., Pauly, D., 1997. Structuring dynamic models of exploited ecosystems from 932
trophic mass-balance assessments. Rev. Fish Biol. Fish. 7, 139–172. doi:Doi 10.1023/A:1018479526149 933
Westerberg, H., Lagenfelt, I., 2008. Sub-sea power cables and the migration behaviour of the European eel. 934
Fish. Manag. Ecol. 15, 369–375. doi:10.1111/j.1365-2400.2008.00630.x 935
Wilhelmsson, D., Malm, T., 2008. Fouling assemblages on offshore wind power plants and adjacent substrata. 936
Estuar. Coast. Shelf Sci. 79, 459–466. doi:10.1016/j.ecss.2008.04.020 937
Wilhelmsson, D., Malm, T., Öhman, M.C., 2006. The influence of offshore windpower on demersal fish. ICES 938
J. Mar. Sci. 63, 775–784. doi:10.1016/j.icesjms.2006.02.001 939
Wilhelmsson, D., Malm, T., Thompons, R., Tchou, J., Sarantakos, G., McCormick, N., Luitjens, S., Gullstrom, 940
M., Patterson Edwards, J., Amir, O., Dubi, a, 2010. Greening Blue Energy : Iden fying and managing the 941
biodiversity risks and opportuni es of o ff shore renewable energy Edited by Dan Wilhelmsson et al. 942
Wilson, J.G., Parkes, A., 1998. Network analysis of the energy flow through the Dublin Bay ecosystem. 943
Proceedings of the Royal Irish Academy 98B, 179. 944
Wolfson, a, Van Blaricom, G., Davis, N., Lewbel, G., 1979. The Marine Life of an Offshore Oil Platform. Mar. 945
Ecol. Prog. Ser. 1, 81–89. doi:10.3354/meps001081 946
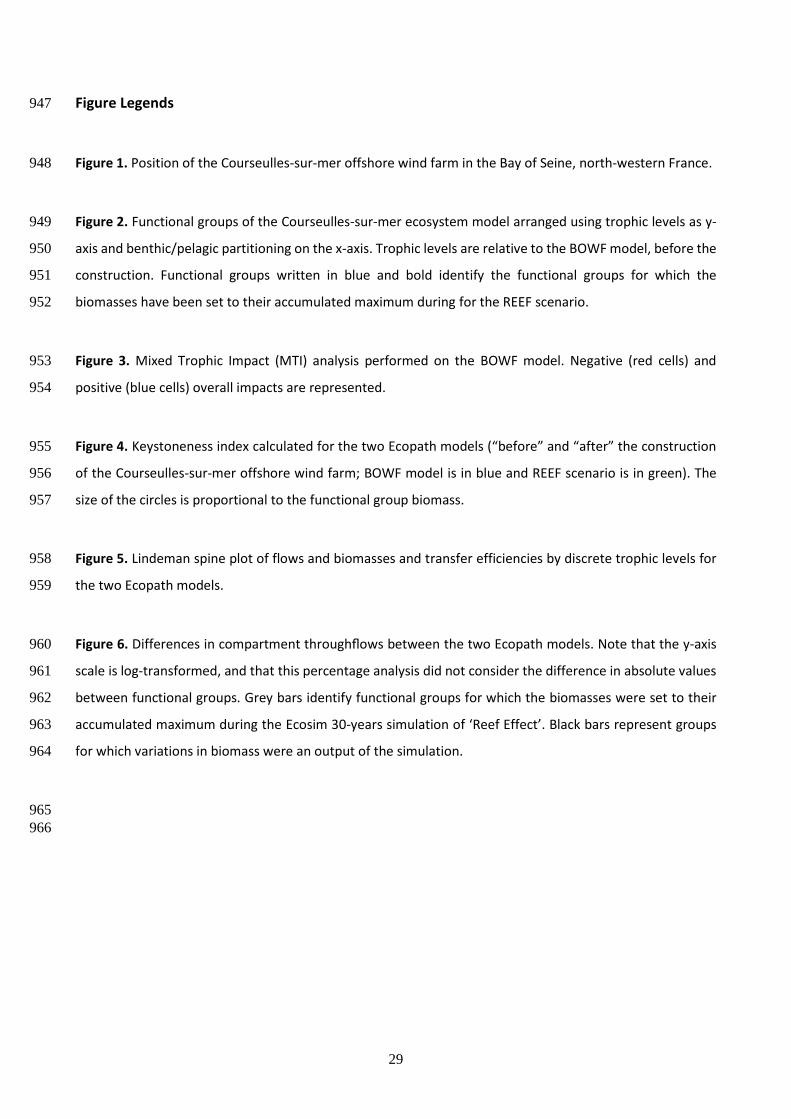
29
Figure Legends 947
Figure 1. Position of the Courseulles-sur-mer offshore wind farm in the Bay of Seine, north-western France. 948
Figure 2. Functional groups of the Courseulles-sur-mer ecosystem model arranged using trophic levels as y-949
axis and benthic/pelagic partitioning on the x-axis. Trophic levels are relative to the BOWF model, before the 950
construction. Functional groups written in blue and bold identify the functional groups for which the 951
biomasses have been set to their accumulated maximum during for the REEF scenario. 952
Figure 3. Mixed Trophic Impact (MTI) analysis performed on the BOWF model. Negative (red cells) and 953
positive (blue cells) overall impacts are represented. 954
Figure 4. Keystoneness index calculated for the two Ecopath models (“before” and “after” the construction 955
of the Courseulles-sur-mer offshore wind farm; BOWF model is in blue and REEF scenario is in green). The 956
size of the circles is proportional to the functional group biomass. 957
Figure 5. Lindeman spine plot of flows and biomasses and transfer efficiencies by discrete trophic levels for 958
the two Ecopath models. 959
Figure 6. Differences in compartment throughflows between the two Ecopath models. Note that the y-axis 960
scale is log-transformed, and that this percentage analysis did not consider the difference in absolute values 961
between functional groups. Grey bars identify functional groups for which the biomasses were set to their 962
accumulated maximum during the Ecosim 30-years simulation of ‘Reef Effect’. Black bars represent groups 963
for which variations in biomass were an output of the simulation. 964
965
966

30
Table 1. Biomass values, production over biomass (P/B) ratios, consumption over biomass (Q/B) ratios, and 967
Ecotrophic Efficiencies (EE) in the two Ecopath models (“before” and “after” the construction of the 968
Courseulles-sur-mer offshore wind farm in the Bay of Seine; BOWF model and REEF scenario, respectively). 969
Functional groups for which biomasses were set to their accumulated maximum in the REEF scenario are 970
marked in bold. Biomasses estimated in the BOWF model were indicated in grey and italic. 971
Biomass gC m-2 P/B (year-1) Q/B (year-1) EE
BOWF REEF BOWF REEF BOWF REEF BOWF REEF
1 Bottlenose dolphins 1.87E-05 8.44E-05 0.08 0.06 23.64 23.15 0 0
2 Harbour porpoises 4.10E-04 1.43E-03 0.08 0.06 40.70 39.59 0 0
3 Harbour seals 6.73E-04 1.89E-03 0.04 0.02 15.90 18.45 0 0
4 Grey seals 2.68E-04 8.73E-04 0.04 0.02 13.23 16.01 0 0
5 Diving seabirds 1.50E-02 9.80E-03 0.09 0.09 55.00 55.01 0 0
6 Surface feeders seabirds 2.08E-03 1.27E-02 0.09 0.18 65.00 30.45 0 0
7 Benthopelagic cephalopods 1.36E-02 1.70E-02 2.80 2.78 15.00 14.64 0.43 0.626
8 Benthic cephalopods 6.22E-03 7.65E-03 3.50 3.50 15.00 14.60 0.918 0.948
9 Fish, mackerel 2.39E-01 2.30E-01 0.83 0.83 4.40 4.40 0.99 0.997
10 Fish, European seabass 1.86E-02 1.63E-02 0.54 0.53 3.20 3.09 0.431 0.439
11 Fish, sharks and rays 1.20E-01 1.64E-01 0.30 0.29 2.44 2.28 0.128 0.132
12 Fish, Atlantic cod 1.97E-02 6.87E-02 1.20 1.20 4.50 4.50 0.445 0.582
13 Fish, whiting 6.80E-03 2.84E-02 1.07 2.40 4.71 10.58 0.987 0.998
14 Fish, Atlantic horse mackerel 1.41E-01 6.36E-02 0.55 0.56 2.44 2.46 0.99 0.999
15 Fish, gurnard 6.30E-03 8.69E-03 0.55 0.54 4.75 4.50 0.001 0.001
16 Fish, pouting 1.66E+00 3.85E+00 1.32 1.32 8.97 8.97 0.037 0.098
17 Fish, poor cod 8.60E-03 1.64E-03 1.50 1.67 8.97 9.69 0.962 0.998
18 Fish, European pilchard 4.76E+00 3.68E+00 0.99 1.04 7.20 7.45 0.99 0.997
19 Fish, European sprat 1.08E-01 1.28E-01 1.34 1.33 11.59 11.39 0.99 0.999
20 Fish, piscivorous 2.42E-01 4.86E-03 0.87 1.03 5.11 5.54 0.99 0.995
21 Fish, planktivorous 8.19E-01 7.22E-01 1.04 1.09 8.38 8.62 0.99 0.995
22 Fish, benthos feeders 1.21E+00 2.50E+00 0.92 0.91 2.99 2.63 0.99 0.997
23 Fish, sea bream 2.98E-02 8.33E-02 0.58 0.57 4.47 4.29 0.298 0.319
24 Fish, sole 5.07E-02 9.80E-02 0.70 0.70 3.20 3.20 0.99 0.999
25 Fish, European plaice 2.16E-02 5.33E-02 0.85 0.85 3.42 3.33 0.99 0.997
26 Fish, other flatfish 6.18E-03 2.70E-02 0.82 1.09 4.48 3.35 0.99 0.99
27 Benthic invertebrate, predators 2.94E+00 3.01E+00 2.24 2.89 11.20 14.44 0.978 0.993
28 Benthic invertebrate, filter feeders 3.12E+00 4.78E+00 2.40 3.27 12.00 16.34 0.99 0.999
29 Benthic invertebrate, bivalves 1.95E+01 4.29E+01 0.60 1.20 3.00 6.00 0.013 0.014
30 King scallops 7.70E-01 7.43E-01 0.90 0.89 4.50 4.45 0.58 0.588
31 Benthic invertebrate, deposit feeders 3.57E+00 2.98E+00 2.90 3.05 14.50 15.23 0.99 0.994
32 Suprabenthos 2.00E+00 1.71E+00 5.66 5.82 28.30 29.10 0.99 0.994
33 Meiofauna 9.70E-01 1.06E+00 15.00 15.06 42.86 43.02 0.99 0.991
34 Zooplankton 1.72E+00 1.79E+00 50.00 47.45 150.00 141.80 0.882 0.998

31
35 Bacteria 7.50E-01 7.70E-01 72.80 72.34 145.60 144.68 0.219 0.246
36 Phytoplankton 3.24E+00 3.24E+00 150.00 150.00 0.758 0.997
37 Detritus 1.90E+01 1.92E+01
972
973
Table 2. General system statistics and ENA indices for the BOWF model compared to values obtained for 974
similar Northern European systems. The Total System Throughput (T.., gC m-2 year-1) was calculated as the 975
sum of all the flows in the food web. The Finn’s Cycling Index (FCI) gives the percentage of all flows generated 976
by cycling. The Ascendency (A) is a measure of the system activity (Total System Throughput) linked to its 977
degree of organization (Average Mutual Information) and is given in gC m-2 year-1. 978
Ecosystems T.. A FCI Biomass/Throughput Total living
biomass Reference for Ecopath
models
Seine estuary 4584.92 - 1161.05
1442.6-6058.6 3.65 -20.65
0.07-0.022 10.23-40.40 Tecchio et al., 2015
Bay of Somme 2312.1 2401.6 12.2 0.01 27.44 Rybarczyck et al., 2003
BOWF model 1607.616 1869.1 9.16 0.030 48.12
REEF scenario 1831,933 2156,9 12,86 0.041 74.73
Dublin Bay 724.69 848.5 31.9 Wilson and Parkes, 1998
979
980

32
Figure 1 981
982 983
984
985

33
Figure 2 986
987 988
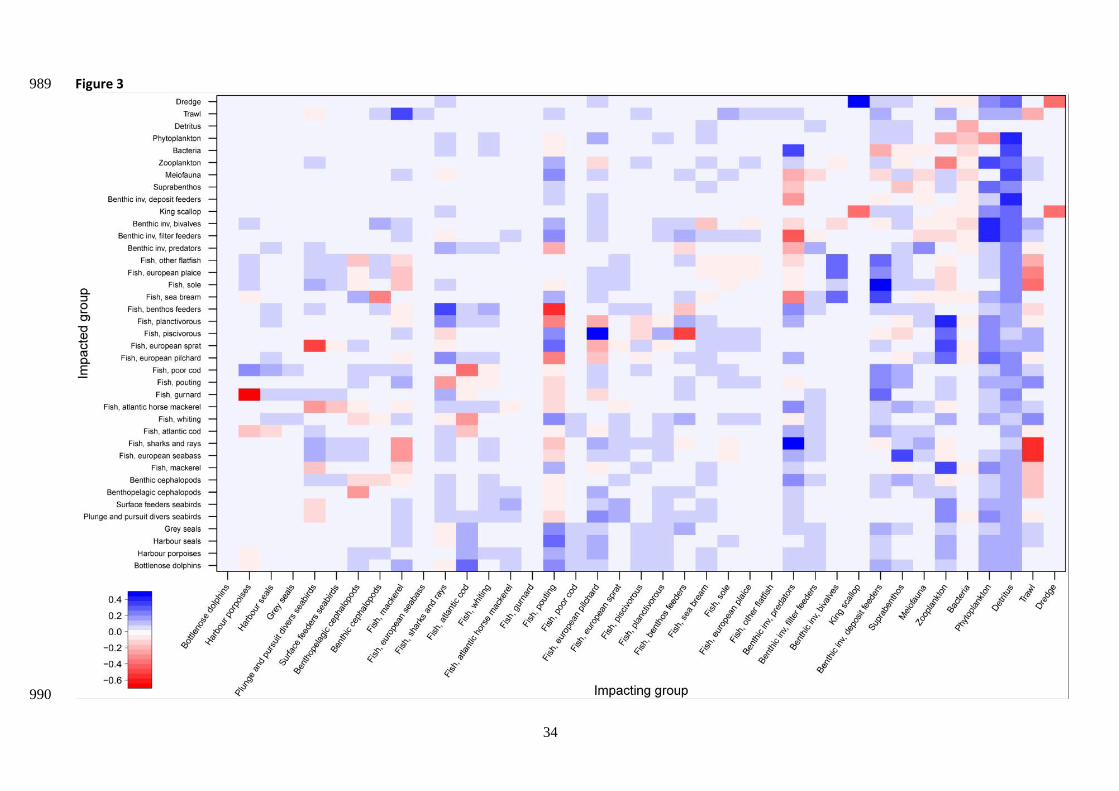
34
Figure 3 989
990

35
Figure 4 991
992
993

36
Figure 5 994
995
996
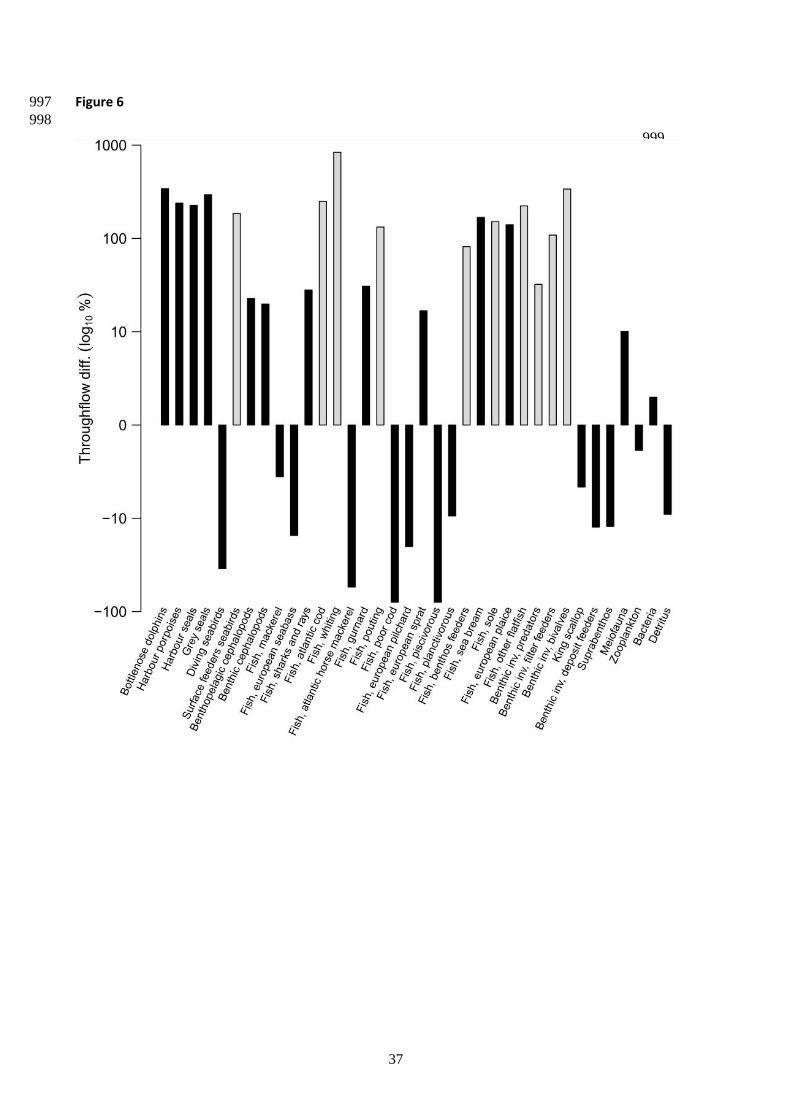
37
Figure 6 997
998
999