BENGKEL TEKNIK MENJAWAB SOALAN MATEMATIK SPM 2011
55
BENGKEL TEKNIK MENJAWAB SOALAN MATEMATIK SPM 2011 Wong Ling Jiong SMK SG Paoh Sarikei.
description
BENGKEL TEKNIK MENJAWAB SOALAN MATEMATIK SPM 2011. Wong Ling Jiong SMK SG Paoh Sarikei . Answer :. Section A. The Venn diagram in the answer space shows set P , set Q and set R such that the universal set ξ = P On the diagram in the answer space, - PowerPoint PPT Presentation
Transcript of BENGKEL TEKNIK MENJAWAB SOALAN MATEMATIK SPM 2011

BENGKELTEKNIK MENJAWAB SOALAN MATEMATIK SPM 2011 Wong Ling JiongSMK SG PaohSarikei.

Section A
1. The Venn diagram in the answer space shows set P, set Q and set R such that the universal set
ξ = P On the diagram in the answer space,
shade the set ( a )
RQ
QP
Answer :
Answer :√1m

(b) RQP '
√2m

2. Calculate the value of m and n that satisfy the following simultaneous linear equations.
m + 3n = 12 m + 3n = 12 - - - - - - - - - - - (1) - - -- - - - - - - - - - -(2)From (1)m = 12 – 3n - - - - - - - - - - - (3)Substitute (3) into (2)
232
nm
Answer :
232
nm
231232
nn
Substitution method
√1m

23663
228
231232
n
n
nnn
nn
Substitute n = 2 into (3) :m = 12 – 3(2)m =6
√1m
√1m
√1m
Equalise terms method :
m + 3n = 12 - - - - - - - - - - - (1)
232
nm - - -- - - - - - - - - - - (2)
From (1)
)3(8232
12323
32
nm
nm
)2(232
nm
(3) – (2) :3n = 6 n = 2
√1m
√1m√1m

Substitute n = 2 into (1) :m + 3n = 12m +3(2) =12 m = 12 - 6 = 6
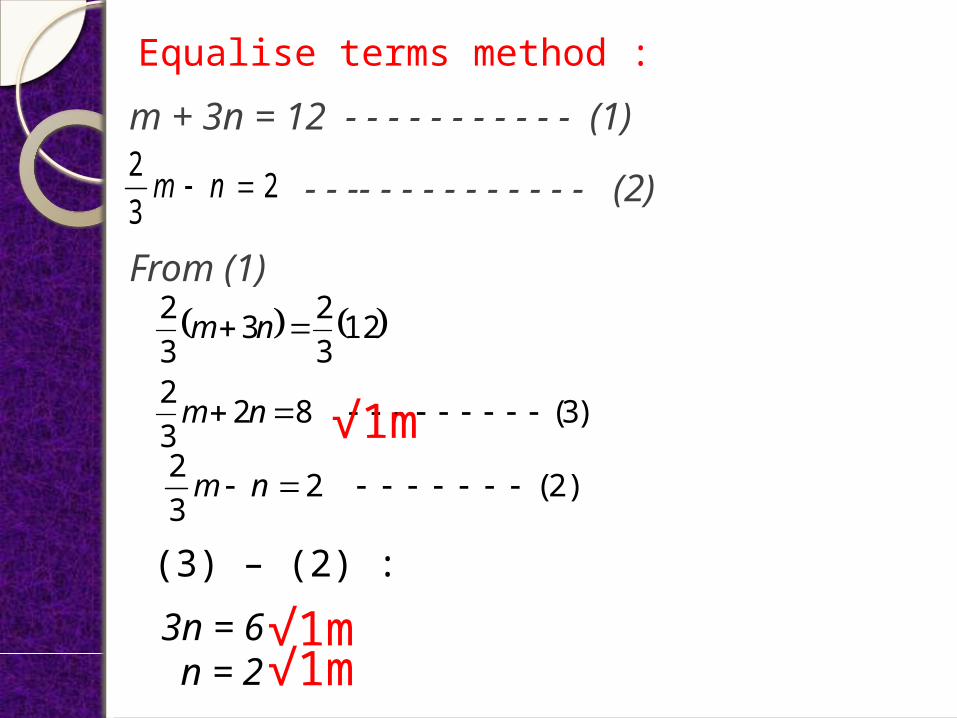
√1mMatrix method :
m + 3n = 122
32
nm
212
132
31
32311
1
212
132
31
nm
nm
√2m
2,626
618
31
211232
23121
31
nm
nm
√1m
√1m
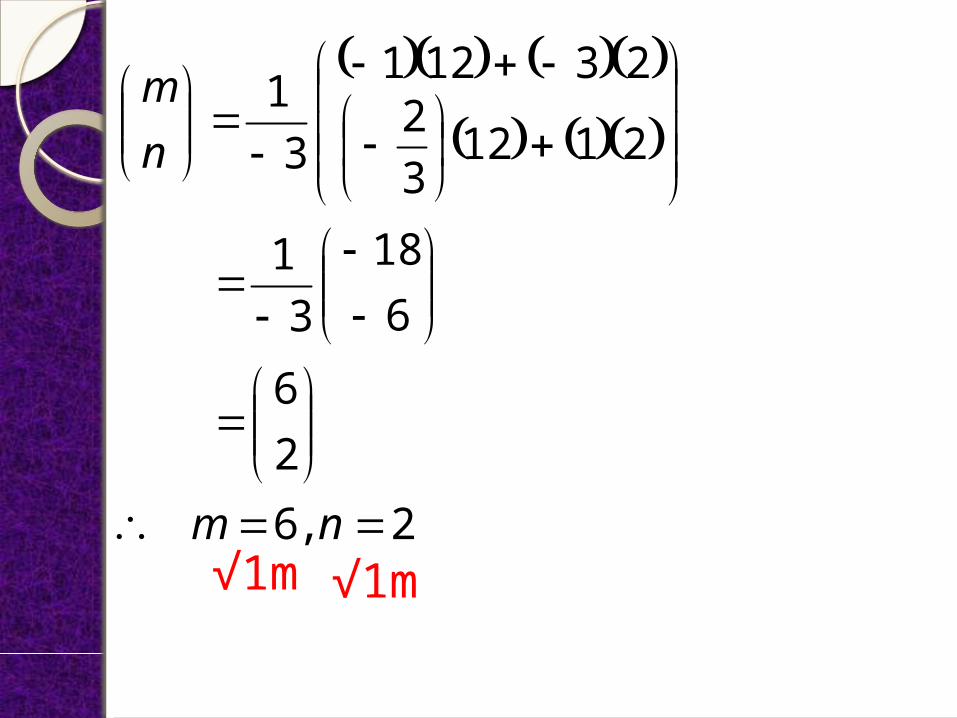
3. Solve the quadratic equation : 4(x + 4) = 9 + 16x Answer :
094
0916164
169164
16944
2
2
2
x
xxx
xxx
xxx
2x 3 6x
2x - 3 - 6x (+) 94 2 x 0
√1m

(2x – 3)(2x + 3 ) = 02x – 3 = 0 , 2x + 3 = 0 2x = 3 , 2x = - 3
23,
23
xx
√1m
√1m
√1m

4. Diagram 4 shows a right prism with a rectangular base EFGH on a horizontal plane. Trapezium FGML is the uniform cross section of the prism.
(a) Name the angle between the plane JEM and the plane JHGM.(b) Calculate the angle between the plane JEM and the plane JHGM.

Answer :( a )
(b)
HJEorEJH
3285
Tan
√1m
√1m√1m
5. (a) (i) Write a compound statement by combining the two statements given below using the word ‘or’.
39 is a multiple of 9.39 is an odd number.
(ii) State whether the compound statement written in 5 (a)(i) is true or false.
Answer :39 is a multiple of 9 or 39 is an odd number
Answer :True
√1m
√1m
(b) Write down premise 2 to complete the following argument:
Premise 1 : If is a quadratic expression, then x = 2. Premise 2 :
Conclusion : is not a quadratic expression.
4nx
4nx
2x √1m

(c) Write down two implications based on the following statement :
A number is a prime number if and only if it is only divisible by 1 and itself
Implication 1 : If a number is a prime number, then it is divisible by 1 and itself
Implication 2 : If a number is divisible by 1 and itself then it is a prime number.
√1m
√1m

6. In Diagram 6, PQRS is a trapezium drawn on a Cartesian plane. PQ is parallel to SR and O
is the origin. The equation of the straight line PQ is 3y = kx +5 and the equation of the straight line SR is . 1
21
xy
Find(a) the value of k(b) the x – intercept of the straight line PQ.Answer :(a)
(b)
2321
3
k
k
523
52303
5233
x
x
xy
310
325
x
√2m√1m
√1m
√1m
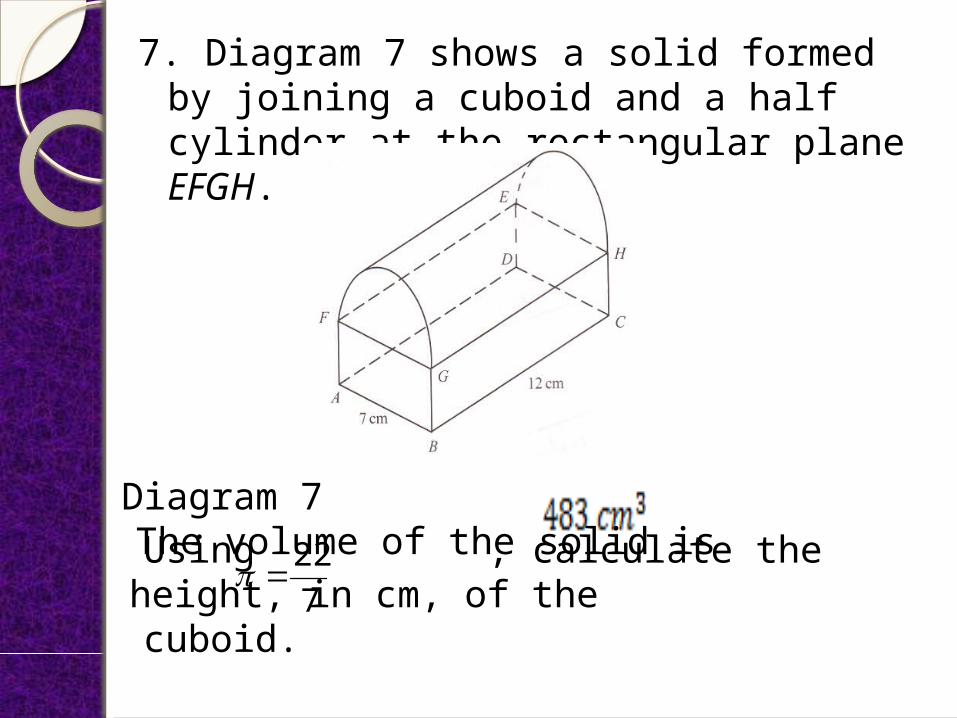
7. Diagram 7 shows a solid formed by joining a cuboid and a half cylinder at the rectangular plane EFGH.
Diagram 7The volume of the solid is Using , calculate the height, in cm, of the cuboid. 7
22

Answer :
Combined volume = Volume of half cylinder +
Volume of cuboid
483 =
483 = 462 + 84h84h = 483 - 231 84h = 252 h = 3 cm
h
12712
27
722
21 2
√1m
√1m
√1m
√1m

8. (a) It is given that , where M is a 2 x 2 matrix. Find M. (b) Write the following simultaneous linear equations as matrix equation :
Hence, by using matrix method, calculate the value of x and of y.
1001
5623
M
956323
yxyx

Answer :(a) M =
=
=
1232
35
3625
31
3625
62531
√2m

(b)
3,131
93
31
93369235
31
93
3625
31
93
5623
yx
yx
yx
yx √1
m√1m
√1m
√1m
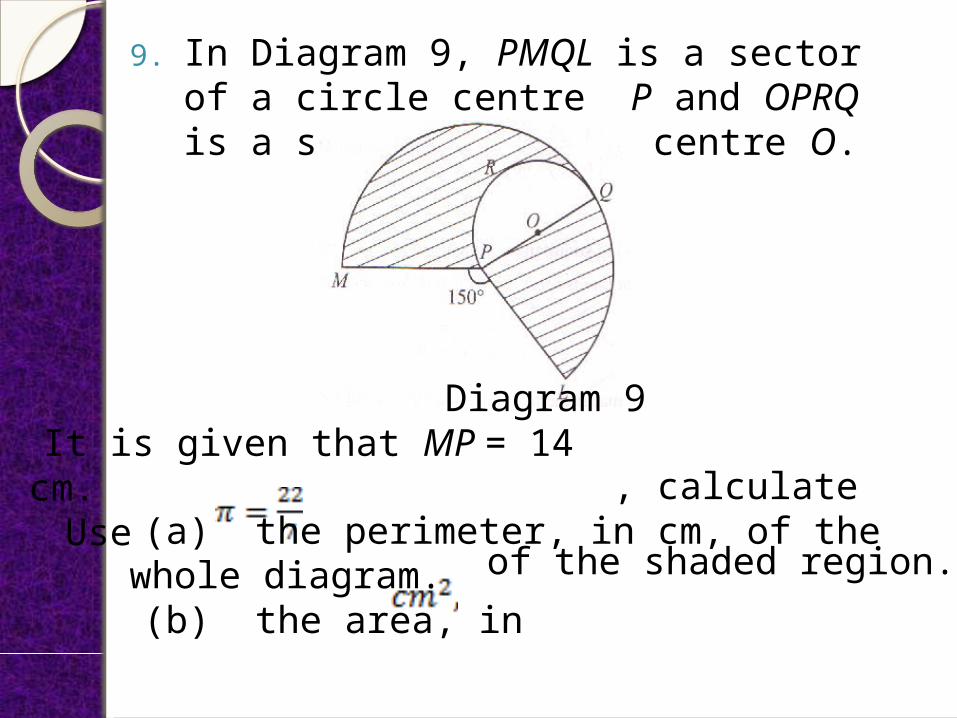
9. In Diagram 9, PMQL is a sector of a circle centre P and OPRQ is a semicircle with centre O.
Diagram 9It is given that MP = 14
cm. Use , calculate(a) the perimeter, in cm, of the whole diagram.(b) the area, in of the shaded region.
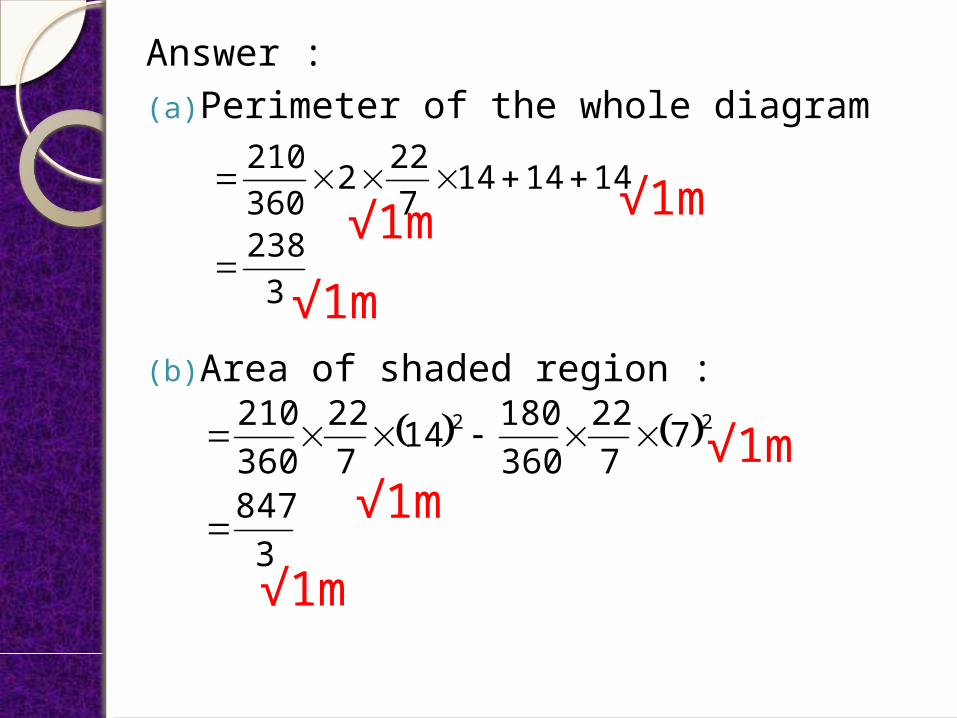
Answer :(a) Perimeter of the whole diagram
(b) Area of shaded region :
3238
1414147222
360210
√1m
√1m
√1m
3847
7722
36018014
722
360210 22
√1m
√1m
√1m

10. Table 10 shows the names of participants from the Science Society and Mathematics Society attending a camping programme.
Table 10
Boys GirlsScience Society
AliBob
Nora
Mathematics Society
Kumar RoseSuziLina

Two participants are required to give speeches at
the end of the programme.(a) A participant is chosen at random from
the Mathematics Society and then another from
participant is chosen at random also from Mathematics Society.(i) List all the possible outcomes of the event
is this sample space.(ii) Hence, find the probability that a boy and
a girl also chosen.
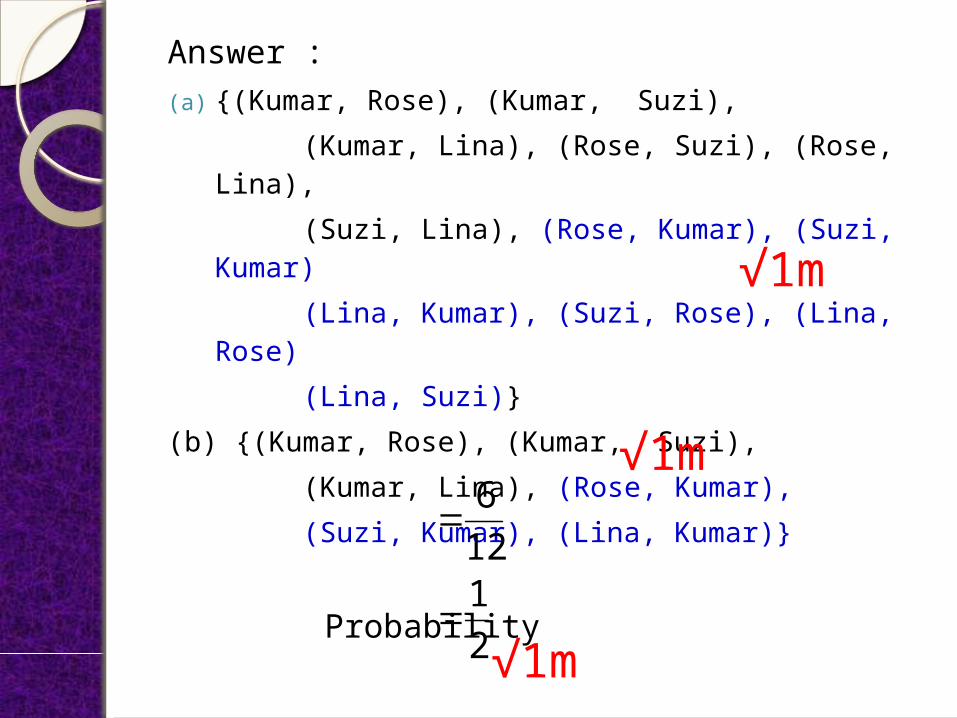
Answer :(a) {(Kumar, Rose), (Kumar, Suzi), (Kumar, Lina), (Rose, Suzi), (Rose, Lina), (Suzi, Lina), (Rose, Kumar), (Suzi, Kumar) (Lina, Kumar), (Suzi, Rose), (Lina, Rose) (Lina, Suzi)}(b) {(Kumar, Rose), (Kumar, Suzi), (Kumar, Lina), (Rose, Kumar), (Suzi, Kumar), (Lina, Kumar)}
Probability
21126
√1m
√1m
√1m

(b) A participant is chosen at random from the boys group and then another participant
is chosen at random from the girls group. (i) List all the possible outcomes of the event in this sample space.(ii) Hence, find the probability that both participants chosen are from Science Society.
Answer :(b)(i) {(Ali, Nora), (Ali, Rose), (Ali, Suzi), (Ali, Lina) Bob, Nora), (Bob, Rose), (Bob, Suzi), (Bob, Lina) Kumar, Nora), (Kumar, Rose), (Kumar, Suzi), (Kumar, Lina)} √1
m
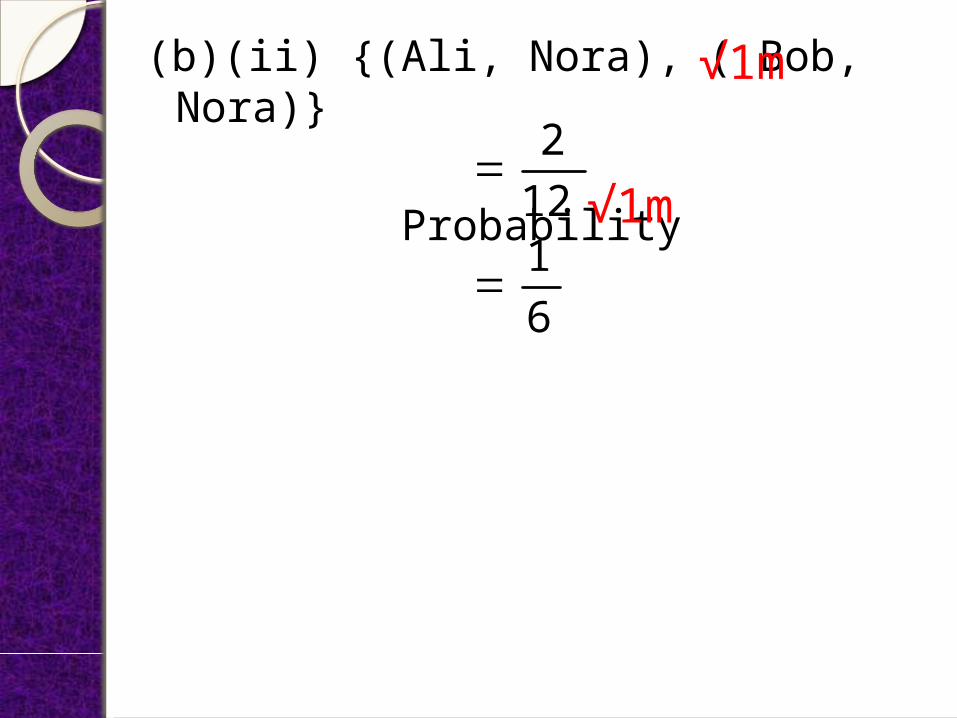
(b)(ii) {(Ali, Nora), ( Bob, Nora)}
Probability
61122
√1m
√1m

11. Diagram 11 shows the speed – time graphs of the movement of two particles, P and Q, for a
period of T seconds. The graph MA represents the movement of P and the graph MBCD represents the movement of Q. Both particles start at the same point and move along the same route.
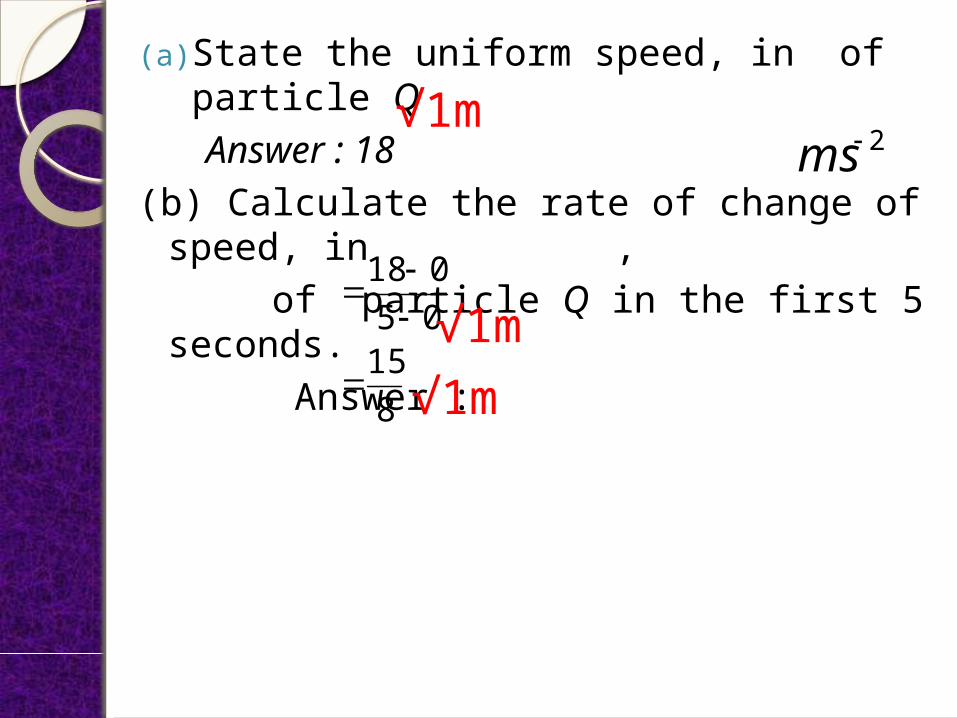
(a) State the uniform speed, in of particle Q Answer : 18 (b) Calculate the rate of change of speed, in , of particle Q in the first 5 seconds. Answer :
2ms
815
05018
√1m
√1m√1
m
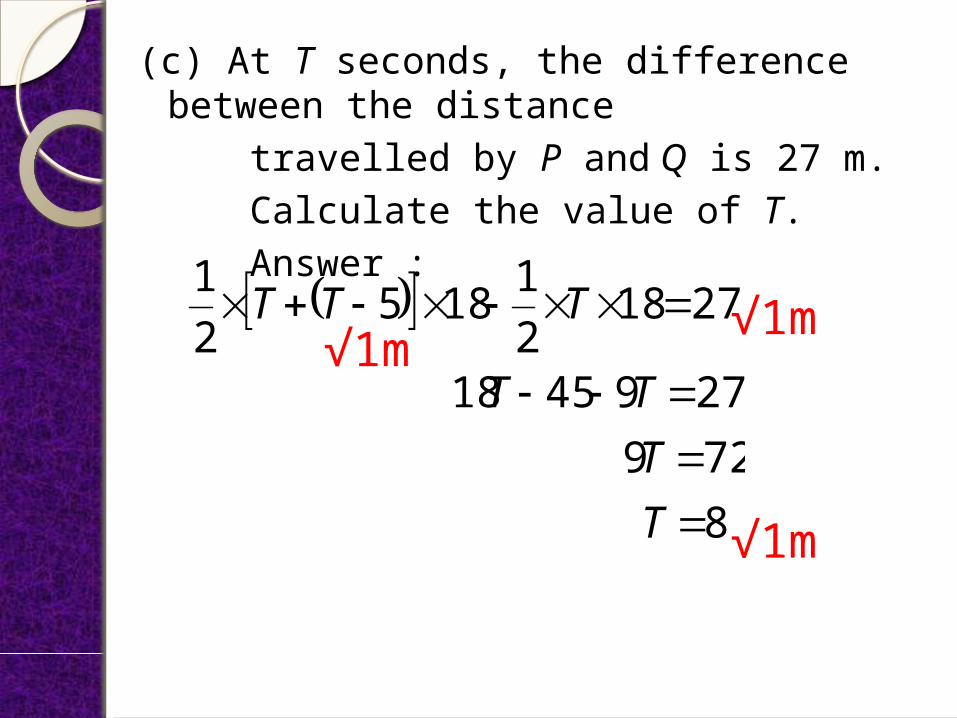
(c) At T seconds, the difference between the distance
travelled by P and Q is 27 m. Calculate the value of T. Answer :
87292794518
271821185
21
TTTT
TTT √1m
√1m
√1m

Section B [ 48 marks ]Answer any four questions from this section.12.(a) Complete Table 12 in the answer space, for the equation by writing down the values of y when x = and x = 0. Answer :
2
x 0 1 2 3 3.5 4y 19 3 1 3
3 211
171 4.31 51
133 xxy
133 xxy
√1m
√1m
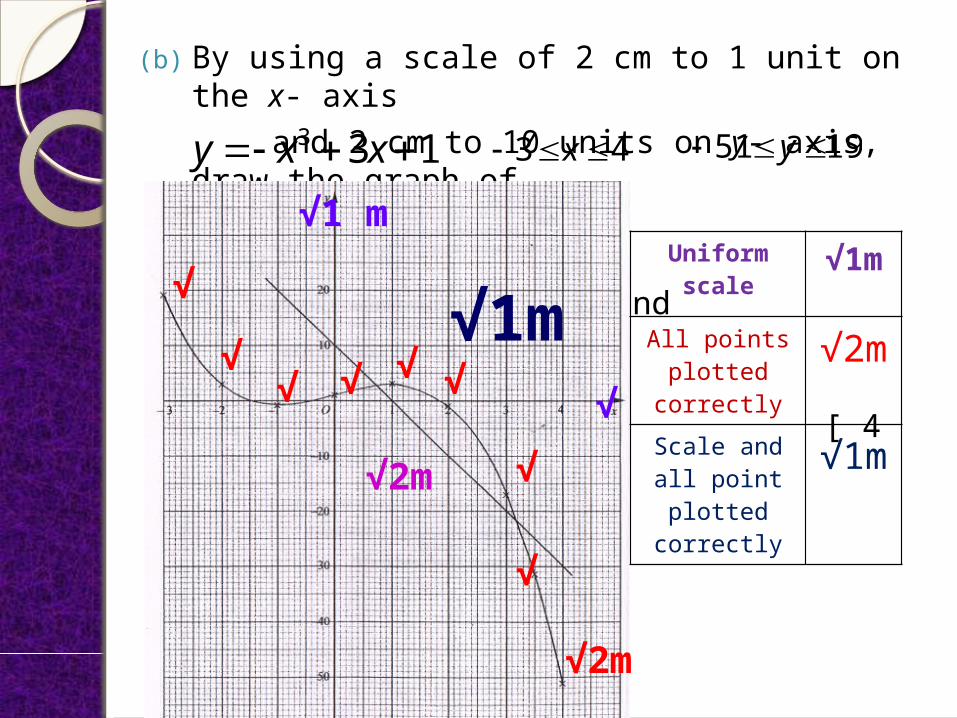
(b) By using a scale of 2 cm to 1 unit on the x- axis and 2 cm to 10 units on y- axis, draw the graph of
for and . [ 4 marks ]
133 xxy 43 x 1951 y
√
Uniform scale √1m
All points plotted
correctly√2m
Scale and all point plotted
correctly√1m
√1 m
√
√√ √ √ √
√
√
√2m
√1m
√2m

(c) From the graph, find (i) the value of y when x = (ii) the value of x when [ 2 marks ]
Answer : (i) y = 9 [ ] (ii) x = 2.7 [ ]
5.210y
108 y8.26.2 x
√1m√1
m
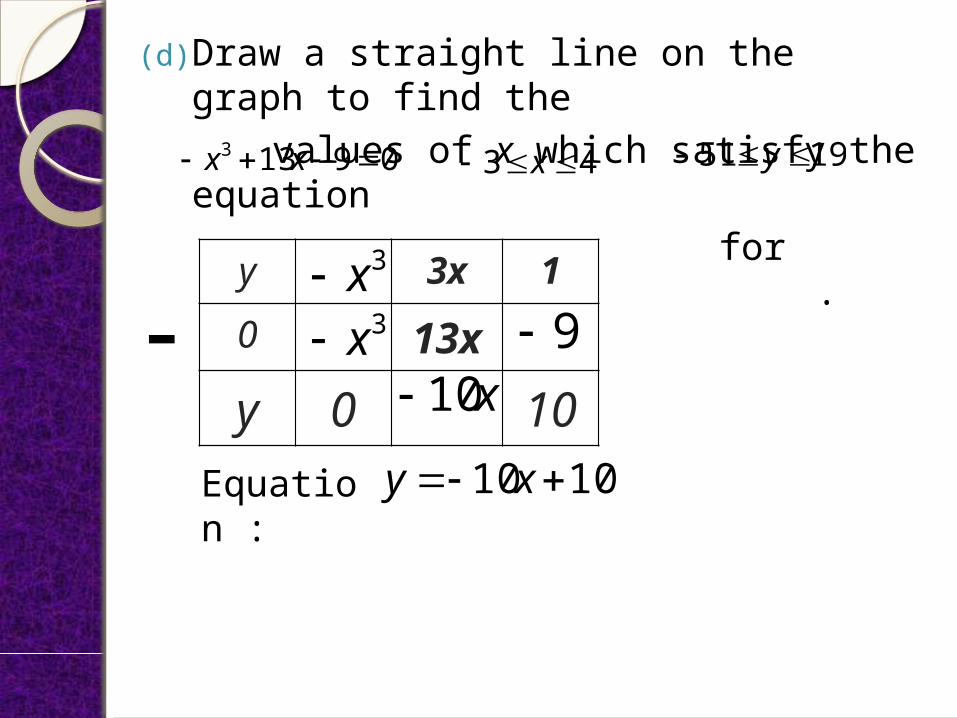
(d) Draw a straight line on the graph to find the
values of x which satisfy the equation for and
. Answer :
09133 xx 43 x 1951 y
y 3x 1
0 13xy 0 10
3x3x 9
x10
Equation : 1010 xy

√2m
x = 0.7 , x = 3.2
√1m√1m
]8.06.0[ x]3.31.3[ x

13.(a)Diagram 13.1 shows point B and a straight line drawn on a Cartesian plane.
Diagram 13.1 Transformation T is translation Transformation R is reflection at the line 5xy
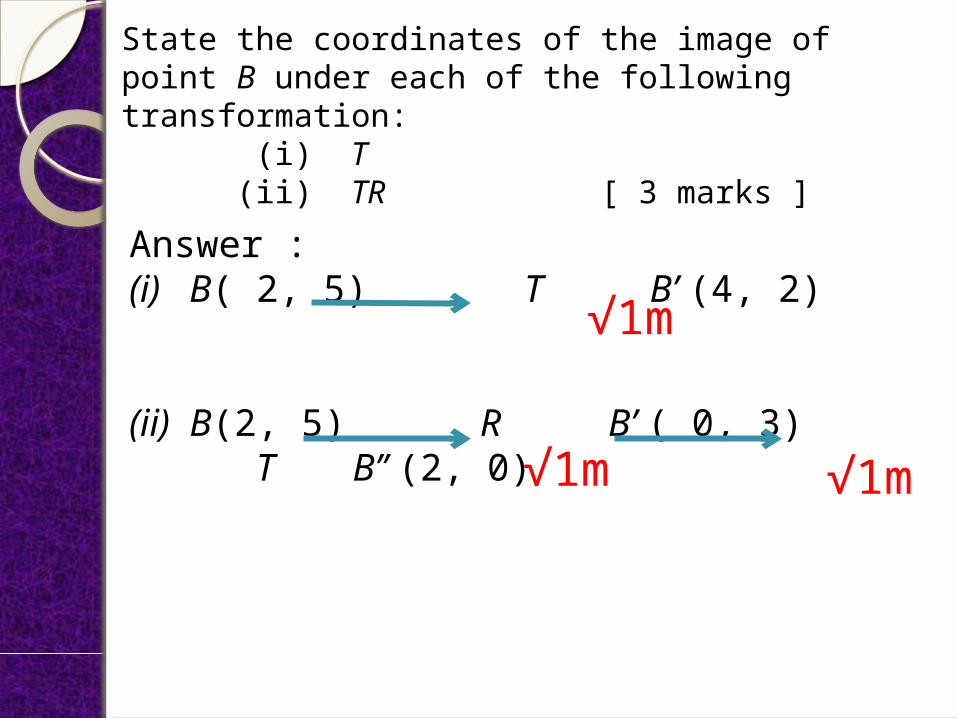
State the coordinates of the image of point B under each of the following transformation: (i) T (ii) TR [ 3 marks ]
Answer :(i) B( 2, 5) T B’ (4, 2)
(ii) B(2, 5) R B’ ( 0, 3) T B’’ (2, 0)
√1m
√1m
√1m

(b) Diagram 13.2 shows trapezium ABCD and trapezium, FCDE drawn on a Cartesian Plane.
Diagram 13.2 (i) FCDE is the image of ABCD under the combined transformation VU. Describe, in full the transformation : (a) U (b) V

Answer :U – Rotation 90º anticlockwise about the centre C(3, 1).
V – Enlargement at the centre ( , 1) with scale factor of 21
(ii) It is given that ABCD represent the region of area 60 .
Calculate the area, in , of the region represented by the shaded region. [ 9 marks ]
Answer :
2
2
180
60)260(
m
√1m
√1m
√1m√1
m√1m
√1m
√1m
√1m
√1m

14. Diagram 14 shows the number of books read by a group of 24 students in a reading programme in the year 2009.
35 41 50 26 27 2722 31 33 40 45
2324 35 30 38 39
3644 34 28 29 30
35
Diagram 14
(a) Based on the data on Diagram 14, complete Table 14 in the answer space. [ 4 marks ]
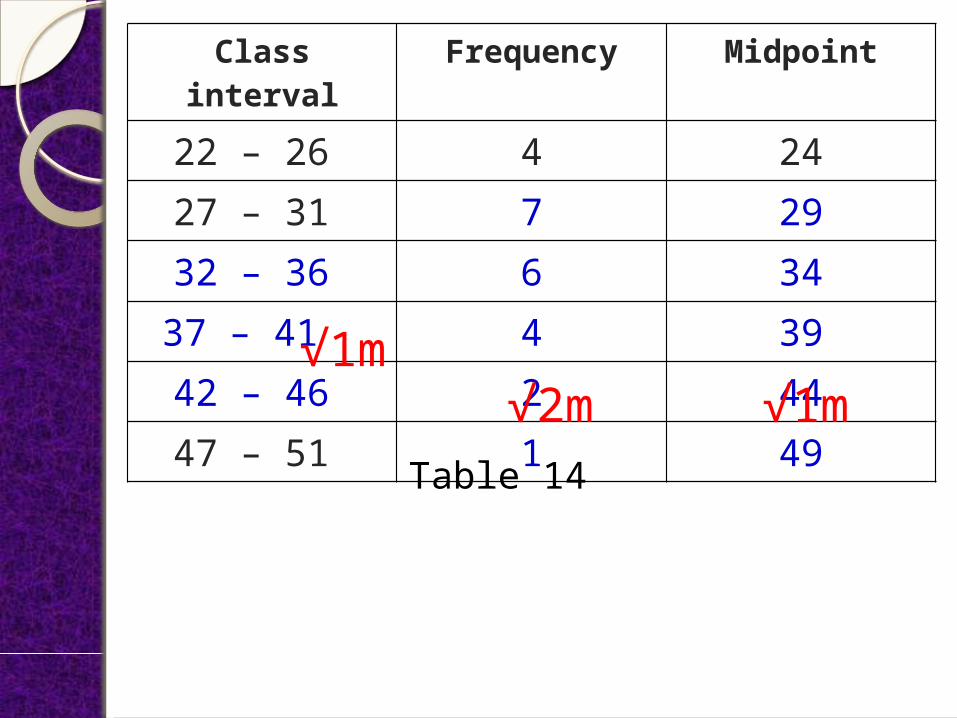
Class interval Frequency Midpoint22 – 26 4 2427 – 31 7 2932 – 36 6 3437 – 41 4 3942 – 46 2 4447 – 51 1 49
Table 14
√1m √2
m√1m

(b) State the modal class [ 1 mark ] Answer : 27 – 31 (c) Calculate the estimated mean for the number of
books read by a student. [ 3 marks ] Answer :
17.3324
491442394346297244
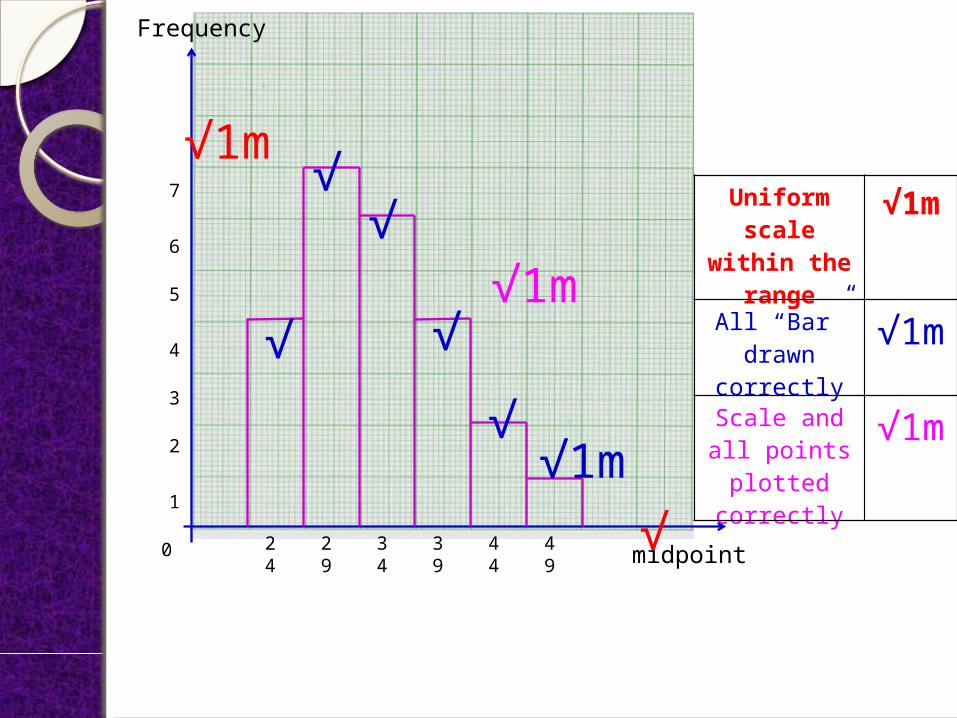
(d) By using a scale of 2 cm to 5 books on the horizontal axis and 2 cm to 1 student on the vertical axis, draw a histogram for the data. [ 4 marks ]
√1m
√2m√1
m
24
29
34
39
44
49
Frequency
midpoint 0
1
2
3
4
5
6
7 Uniform scale
within the range
√1m
All “Bar” drawn
correctly√1m
Scale and all points plotted
correctly
√1m
√
√1m
√
√√
√√ √1
m
√1m

(e) Based on the histogram drawn in 14(d), state the number of students who read less than 32 books in that programme. [ 1 mark ] Answer: = 4 + 7 = 11
√1m

15. (a) Diagram 15.1 shows a solid right prism with rectangular base ABKJ on a horizontal plane. The surface BCFGK is the uniform cross section of the prism. Rectangle CDEF is a horizontal plane and rectangular FEHG is an inclined plane. Edges BC and KG are vertical.
Diagram 15.1

Draw to full scale, the plan of the solid. Answer :
Solution/ mark scheme MarksCorrect Shape
CG > GH > HE = ED
Measurements correct to +/- 0.2 cmAngles at edges of rectangles = 90°+/-1
√1m√1m (dep. √1m) √1m (dep. √1m √1m )

(b) Another solid right prism with right angled triangle LMN as its uniform cross section is joined to the prism in Diagram 15.1 at the horizontal plane DLME. It is given that LM = 4 cm and MN = 3 cm. The combined solid is as shown in Diagram 15.2.
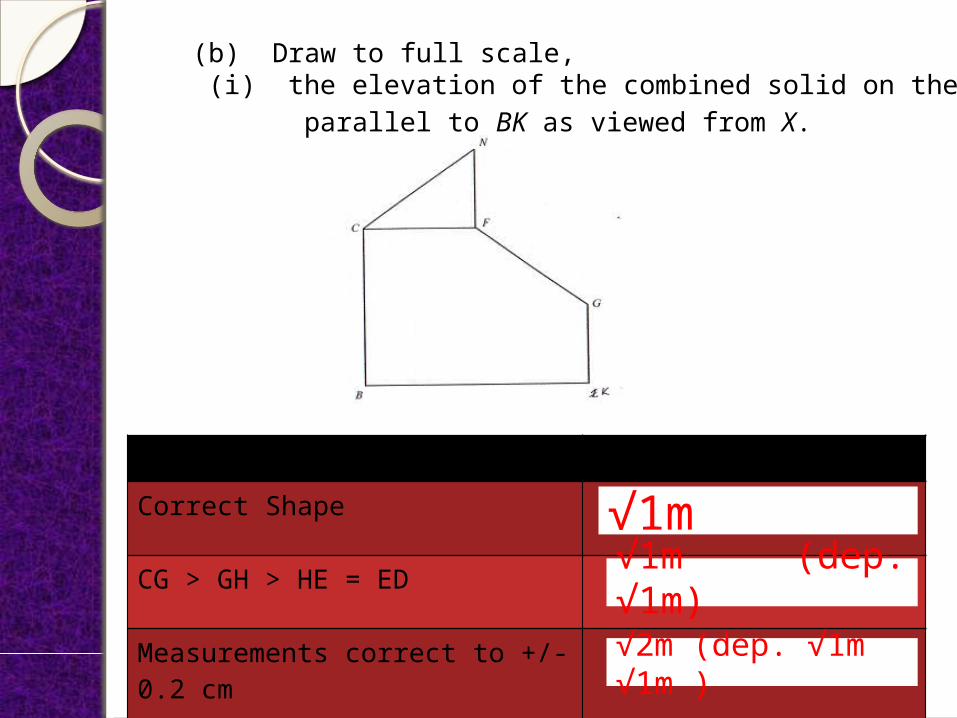
(b) Draw to full scale, (i) the elevation of the combined solid on the vertical plane parallel to BK as viewed from X.
Solution/ mark scheme MarksCorrect Shape
CG > GH > HE = ED
Measurements correct to +/- 0.2 cmAngles at edges of rectangles = 90°+/-1
√1m√1m (dep. √1m) √2m (dep. √1m √1m )

(ii) the elevation of the combined solid on the vertical plane parallel to AB as viewed from Y.
Answer:
Solution/ mark scheme MarksCorrect Shape
H----G is joined by dashed line/ dotted lineAB=AD > DL > LN = CG = GB
Measurements correct to +/- 0.2 cmAngles at edges of rectangles = 90°+/- 1
√1m√1m (dep. √1m) √1m (dep. √1m √1m)
√2m (dep. √1m √1m √1m )

16. , , J and K are four points on the surface of the earth. JG is the diameter of the earth.
(a) State the location of point J. Answer :
(b) Calculate the shortest distance, in nautical miles, from G to the South pole measured along the surface of the earth. Answer : = =
)70,40( ESG ESH 100,40
,40( NJ
3000
604090
110 )W√1m
√1m
√1m
√1m√1
m
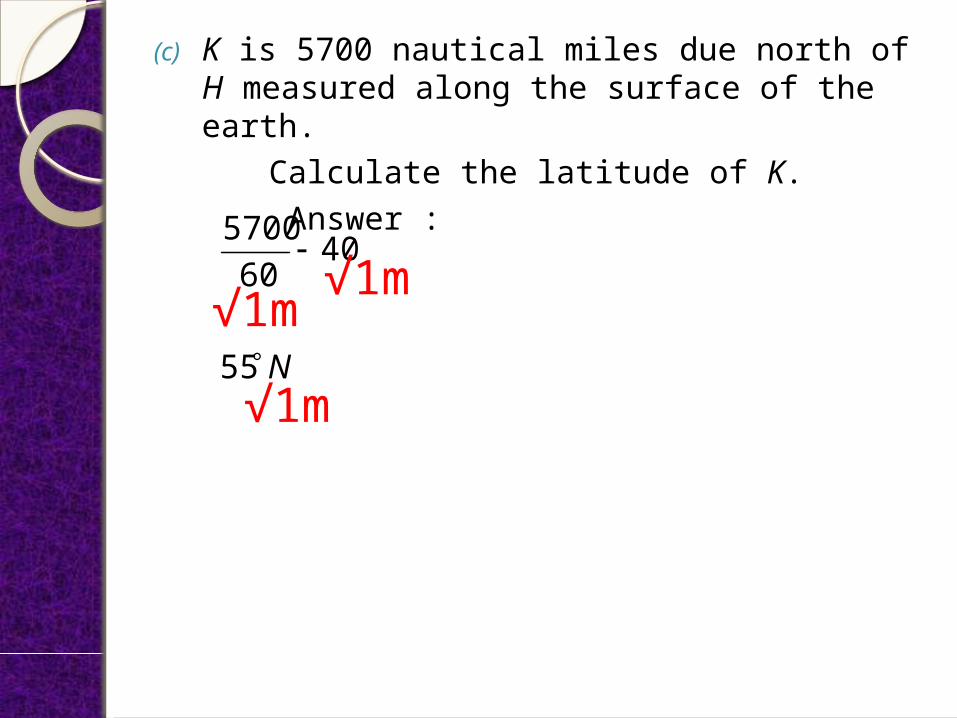
(c) K is 5700 nautical miles due north of H measured along the surface of the earth.
Calculate the latitude of K. Answer :
N
55
4060
5700
√1m
√1m
√1m

(d) An aeroplane took off from G and flew due east to H. The average speed of the aeroplane for the whole flight
was 400 knot. Calculate the total time, in hours, taken for the whole flight.
Answer :
45.3400
40cos6070100
√1m √1
m√1m
√1m