Benetton Group 2001 Annual Report -...
79
Benetton Group 2001 Annual Report
Transcript of Benetton Group 2001 Annual Report -...

Benetton Group2001 Annual Report

Benetton Group2001 Annual Report
Benetton Group S.p.A.Villa MinelliPonzano Veneto (Treviso) - ItalyShare Capital: Euro 236,026,454.30 fully paid-inTax ID/Treviso Company register: 00193320264

4
Table of contents The Benetton Group
7 Directors and other officers
10 Letter to our Shareholders
13 Financial highlights
14 Directors’ report
Distribution networkBrandsLogisticsProductionReorganization of the sport segment
16 Capital expendituresTechnology and qualityCommunicationSupplementary informationConversion of the share capital and reverse split of the shares Financial management Treasury shares
18 Performance of Benetton sharesOwnership of the Parent Company
19 Relation with the Parent Company and its subsidiariesCorporate Governance
24 DirectorsShares held in the Parent Company by directors and statutory auditors
25 Principal organizational and corporate changes Significant events since year-endOutlook for 2002
26 Group resultsConsolidated statement of income
29 Financial situation - highlights

5
33 Consolidated financial statements
Balance sheets reclassified according to financial criteria
37 Statements of income reclassified to cost of sales
38 Balance sheet - Assets
40 Balance sheet - Liabilities, Shareholders’ equity and Memorandum accounts
42 Statements of income
44 Statements of changes in Shareholders’ equity
45 Statements of changes in minority interests
46 Statements of cash flow
48 Companies and groups included within the consolidation area as of December 31, 2001
50 Notes to the consolidated financial statements
Activities of the GroupForm and content of the consolidated financial statements
51 Principles of consolidation
52 Accounting policies
55 Comments on the principal asset items
63 Comments on the principal liability and equity items
70 Memorandum accounts
71 Comments on the principal statement of income items
79 Independent Auditors’ report
6
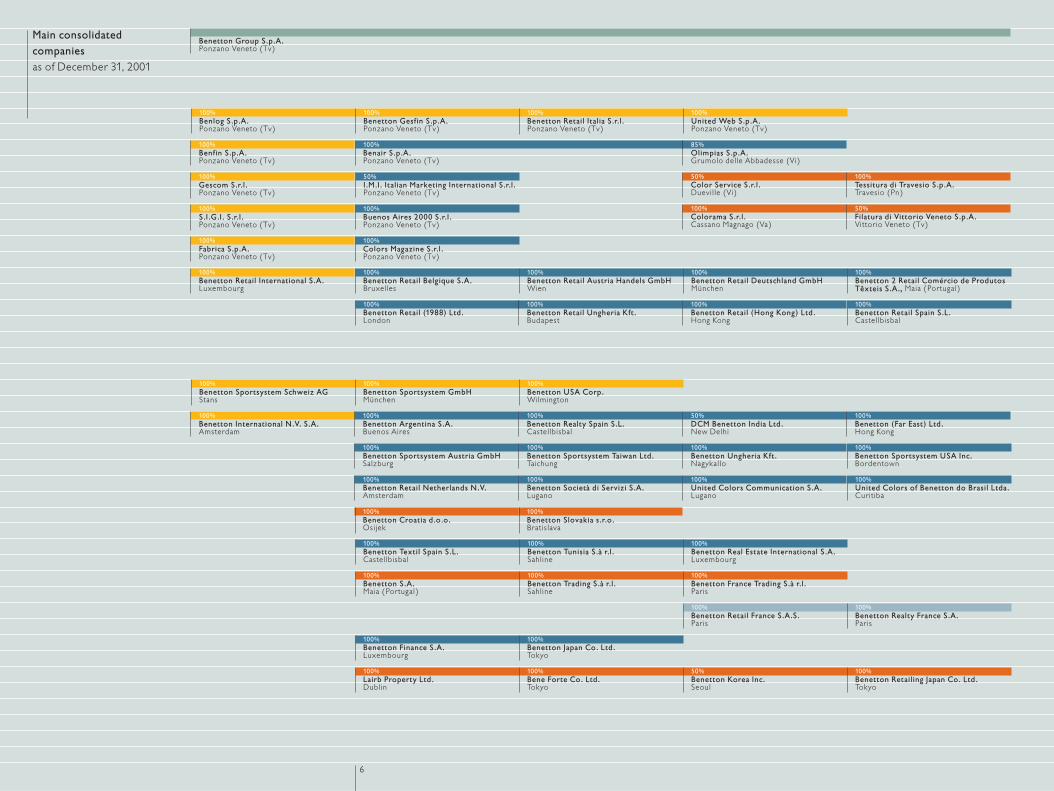
Main consolidated companiesas of December 31, 2001
Benetton Group S.p.A.Ponzano Veneto (Tv)
100%Benlog S.p.A.Ponzano Veneto (Tv)
100%Buenos Aires 2000 S.r.l .Ponzano Veneto (Tv)
100%Colors Magazine S.r.l .Ponzano Veneto (Tv)
100%Benetton Retail Belgique S.A.Bruxelles
100%Benetton Sportsystem Schweiz AG Stans
100%Benetton Realty Spain S.L.Castellbisbal
100%Benetton Sportsystem Taiwan Ltd.Taichung
100% Benetton Croatia d.o.o.Osijek
100%Benetton Società di Servizi S.A. Lugano
100%United Colors of Benetton do Brasil Ltda. Curitiba
100%Benetton Realty France S.A.Paris
50% Benetton Korea Inc.Seoul
100%Benetton Sportsystem GmbHMünchen
50%DCM Benetton India Ltd.New Delhi
100%Benetton Ungheria Kft .Nagykallo
100%United Colors Communication S.A. Lugano
100%Benetton Sportsystem USA Inc.Bordentown
100%Benetton Textil Spain S.L.Castellbisbal
100% Benetton S.A.Maia (Portugal)
100%Benetton (Far East ) Ltd.Hong Kong
100% Benetton Retail (1988) Ltd.London
100%Benetton Retail Austria Handels GmbHWien
100%Benetton Tunisia S.à r.l .Sahline
100%Benetton Trading S.à r.l .Sahline
100% Benetton Finance S.A.Luxembourg
100%Lairb Property Ltd.Dublin
100%Benetton Retailing Japan Co. Ltd.Tokyo
100%Benetton USA Corp.Wilmington
100%Benetton Argentina S.A.Buenos Aires
100% Benetton Sportsystem Austria GmbH Salzburg
100% Benetton Retail Deutschland GmbHMünchen
100%Benetton Retail Netherlands N.V.Amsterdam
100%Benetton Real Estate International S.A.Luxembourg
100%Benetton France Trading S.à r.l .Paris
100%Benetton Retail France S.A.S.Paris
100% Benetton Japan Co. Ltd.Tokyo
100%Bene Forte Co. Ltd.Tokyo
100%Benair S.p.A.Ponzano Veneto (Tv)
100%Benetton Gesfin S.p.A.Ponzano Veneto (Tv)
100%Benetton Retail Italia S.r.l .Ponzano Veneto (Tv)
85%Olimpias S.p.A.Grumolo delle Abbadesse (Vi)
50%Color Service S.r.l .Dueville (Vi)
100%Colorama S.r.l .Cassano Magnago (Va)
100%United Web S.p.A.Ponzano Veneto (Tv)
100%Tessitura di Travesio S.p.A.Travesio (Pn)
50%Filatura di Vittorio Veneto S.p.A.Vittorio Veneto (Tv)
100%Benfin S.p.A.Ponzano Veneto (Tv)
100%S.I .G.I . S.r.l .Ponzano Veneto (Tv)
100%Fabrica S.p.A.Ponzano Veneto (Tv)
100%Benetton Retail International S.A.Luxembourg
100%Benetton International N.V. S.A.Amsterdam
100% Benetton Slovakia s.r.o.Bratislava
100%Gescom S.r.l .Ponzano Veneto (Tv)
50%I.M.I . Italian Marketing International S.r.l .Ponzano Veneto (Tv)
100% Benetton Retail Ungheria Kft .Budapest
100% Benetton Retail (Hong Kong) Ltd.Hong Kong
100% Benetton Retail Spain S.L.Castellbisbal
100% Benetton 2 Retail Comércio de Produtos Têxteis S.A., Maia (Portugal)
7
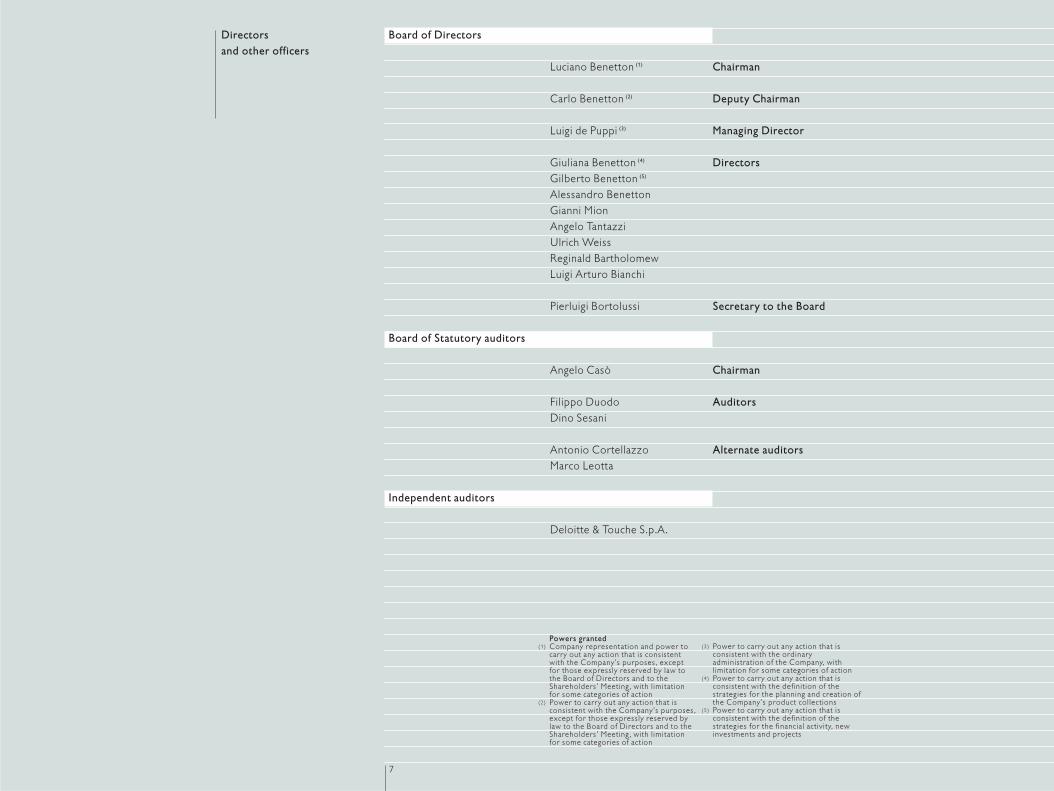
Board of Directors
Luciano Benetton (1) Chairman
Carlo Benetton (2) Deputy Chairman
Luigi de Puppi (3) Managing Director
Giuliana Benetton (4) DirectorsGilberto Benetton (5)
Alessandro BenettonGianni MionAngelo TantazziUlrich WeissReginald BartholomewLuigi Arturo Bianchi
Pierluigi Bortolussi Secretary to the Board
Board of Statutory auditors
Angelo Casò Chairman
Filippo Duodo AuditorsDino Sesani
Antonio Cortellazzo Alternate auditorsMarco Leotta
Independent auditors
Deloitte & Touche S.p.A.
Directors and other officers
Powers granted(1) Company representation and power to
carry out any action that is consistentwith the Company’s purposes, exceptfor those expressly reserved by law tothe Board of Directors and to theShareholders’ Meeting, with limitationfor some categories of action
(2) Power to carry out any action that isconsistent with the Company’s purposes,except for those expressly reserved bylaw to the Board of Directors and to theShareholders’ Meeting, with limitationfor some categories of action
(3) Power to carry out any action that isconsistent with the ordinaryadministration of the Company, withlimitation for some categories of action
(4) Power to carry out any action that isconsistent with the definition of thestrategies for the planning and creation ofthe Company’s product collections
(5) Power to carry out any action that isconsistent with the definition of thestrategies for the financial activity, newinvestments and projects

10
In the latter part of 2001, I always gave the same response to anyone asking me what I thought of the situation post-September 11 and the slowdown in world economic growth: I am optimistic because I believe that it is the confidence of markets, businessmen and politicians alone that can help produce a recovery. At the present date, I am still able to make the same statement with the support of actual facts. In the United States over 20 new Benetton stores were opened in the latter part of 2001, with nearly the same number planned for 2002. This means that confidence was not lacking even in this darkest of crises and that our US partners consider that our Group is worthy of backing since it is prepared to fight back and invest.With net sales of around 2.1 billion euro in 2001 and normalized net income of 163 million euro, we are a global Group, both in size, resources and repute. But we are also a flexible Group, used to dealing with change and contradictory situations: an example of the Italian temperament and handiwork, capable of giving added value to a product in terms ofstyle and quality.In 2001 our efforts mainly focused on the growth potential of the casual wear sector, particularlythrough quantitative and qualitative enhancements to the sales network. The network of flagship megastores, including those under direct management, located in the historic centers and shopping districts of major cities, has grown much faster than expected: at year-end the megastores numbered over 100 worldwide, a threshold that we had expected to reach only in 2002.Investments in opening new megastores, which represent the best international showcase for Benetton’s style and image, will continue at a relentless pace also in the years to come. We continue to believe in the validity of our organizational model, with over 2,000entrepreneurs acting as our partners in the management of our stores. We shall also focus on expanding the dimensions of sales outlets under third-party management, to medium sizedstores which are better able to respond to the requirements of the presentation andcoordinated proposal of our collections.
Letter to our Shareholders
These innovations to the stores represent the Group’s main response to the changing market:to customers, who, rather than simply buying, need to find inspiration for their purchase. At the same time, we have improved our ability to react to demand, partly thanks to majorinvestments in information technology to link up the retail outlets in a genuine network. For example, we are now capable of delivering new collections every 15 days. The product range was completed in 2001 with the addition of the new label The hip site. This is aimed at teenagers in the 11 to 16 age bracket, who want to be noticed for their fresh,fashionable clothing. We have also revitalized our menswear collections, which now boastmuch wider choice, personality and style than in the past.The sport sector is a great challenge for the Benetton Group. To respond to trends in theequipment sector, notably the downturn in the market for in-line skates, incisive measures forreorganization were implemented during the year involving the entire organization. The Playlife sportswear line reported positive results, with good prospects for future growth. We are operating a twin-track policy in the area of distribution. On the one hand, we areexpanding and consolidating the network of Playlife stores. On the other, we are rationalizingour relations with traditional sports stores, partly by proposing more technical, focusedcollections. Aware that the future begins with every new day, we shall continue to work in 2002 with the optimism of determination, to improve ourselves along the way. In this way we shall be prepared to meet the economic recovery which, in my view, is not far away.
The ChairmanLuciano Benetton
12
2001
2000
1999
1998
1997
2,098
2,018
1,982
1,980
1,878
2001
2000
1999
1998
1997
311
374312
191
266
230
311
375
332
415
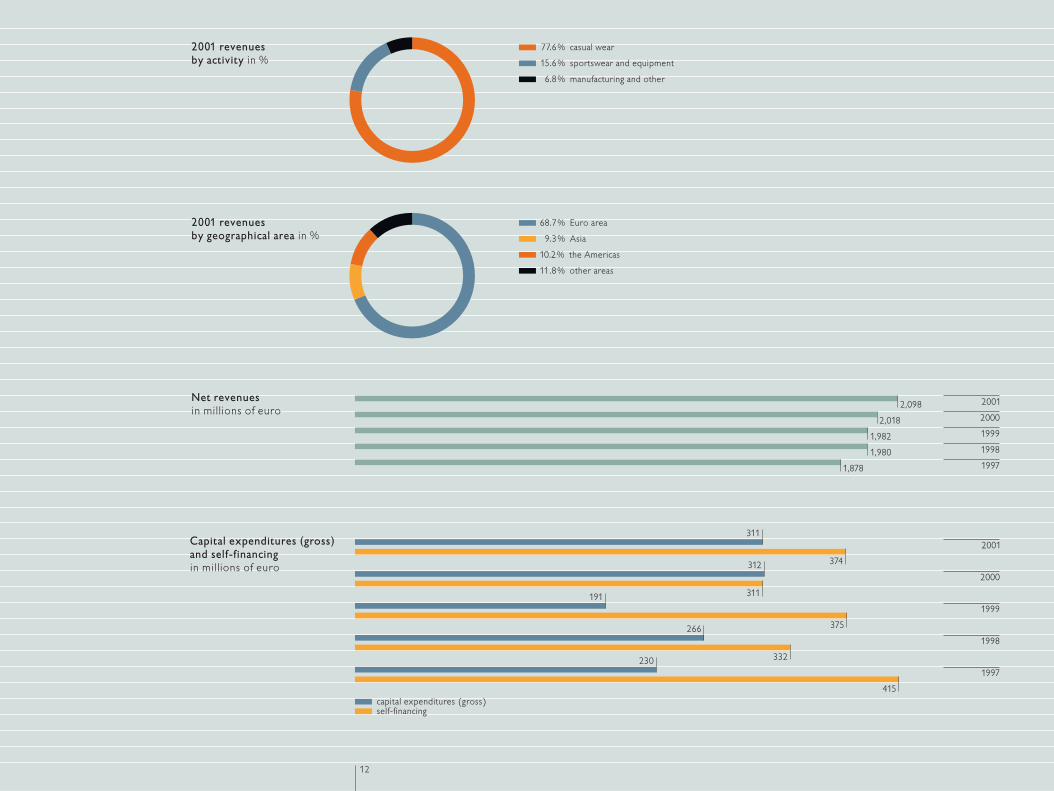
77.6% casual wear
15.6% sportswear and equipment
6.8% manufacturing and other
68.7% Euro area
9.3% Asia
10.2% the Americas
11.8% other areas
capital expenditures (gross)self-financing
Capital expenditures (gross)and self-financingin millions of euro
2001 revenues by activity in %
2001 revenues by geographical area in %
Net revenues in millions of euro
13
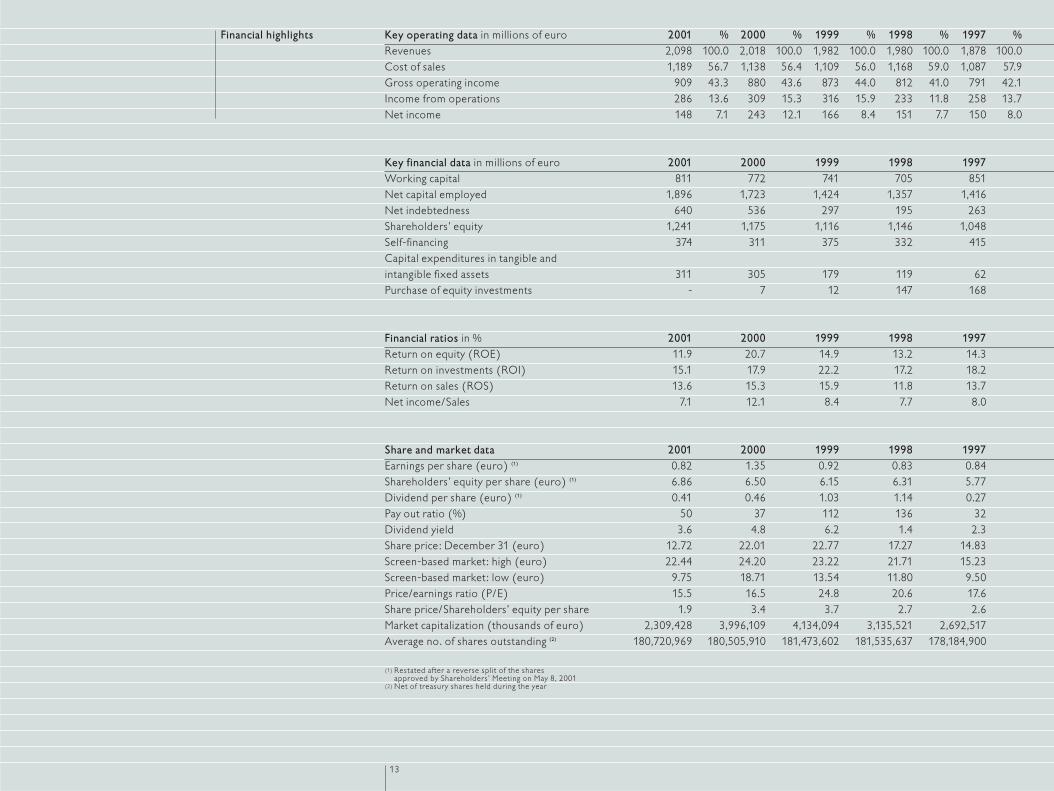
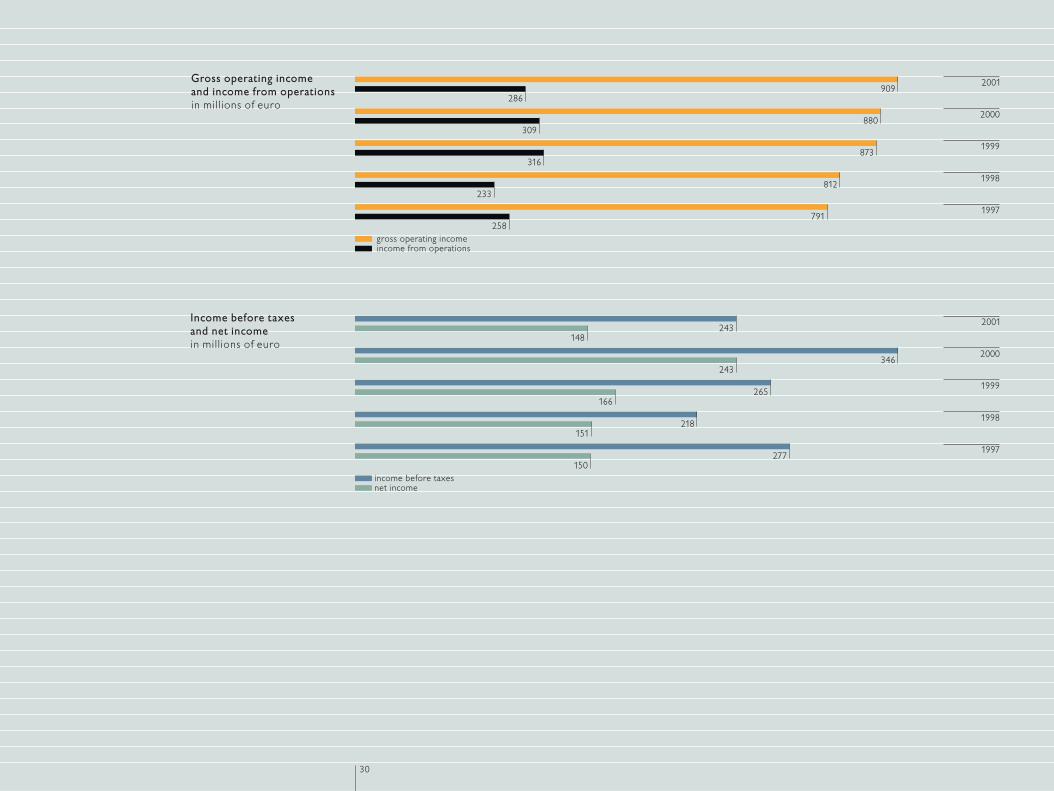
Key operating data in millions of euro 2001 % 2000 % 1999 % 1998 % 1997 %Revenues 2,098 100.0 2,018 100.0 1,982 100.0 1,980 100.0 1,878 100.0Cost of sales 1,189 56.7 1,138 56.4 1,109 56.0 1,168 59.0 1,087 57.9Gross operating income 909 43.3 880 43.6 873 44.0 812 41.0 791 42.1Income from operations 286 13.6 309 15.3 316 15.9 233 11.8 258 13.7Net income 148 7.1 243 12.1 166 8.4 151 7.7 150 8.0
Key financial data in millions of euro 2001 2000 1999 1998 1997Working capital 811 772 741 705 851Net capital employed 1,896 1,723 1,424 1,357 1,416Net indebtedness 640 536 297 195 263Shareholders’ equity 1,241 1,175 1,116 1,146 1,048Self-financing 374 311 375 332 415Capital expenditures in tangible and intangible fixed assets 311 305 179 119 62Purchase of equity investments - 7 12 147 168
Financial ratios in % 2001 2000 1999 1998 1997Return on equity (ROE) 11.9 20.7 14.9 13.2 14.3Return on investments (ROI) 15.1 17.9 22.2 17.2 18.2Return on sales (ROS) 13.6 15.3 15.9 11.8 13.7Net income/Sales 7.1 12.1 8.4 7.7 8.0
Share and market data 2001 2000 1999 1998 1997Earnings per share (euro) (1) 0.82 1.35 0.92 0.83 0.84Shareholders’ equity per share (euro) (1) 6.86 6.50 6.15 6.31 5.77Dividend per share (euro) (1) 0.41 0.46 1.03 1.14 0.27Pay out ratio (%) 50 37 112 136 32Dividend yield 3.6 4.8 6.2 1.4 2.3Share price: December 31 (euro) 12.72 22.01 22.77 17.27 14.83Screen-based market: high (euro) 22.44 24.20 23.22 21.71 15.23Screen-based market: low (euro) 9.75 18.71 13.54 11.80 9.50Price/earnings ratio (P/E) 15.5 16.5 24.8 20.6 17.6Share price/Shareholders’ equity per share 1.9 3.4 3.7 2.7 2.6Market capitalization (thousands of euro) 2,309,428 3,996,109 4,134,094 3,135,521 2,692,517Average no. of shares outstanding (2) 180,720,969 180,505,910 181,473,602 181,535,637 178,184,900
(1) Restated after a reverse split of the shares approved by Shareholders’ Meeting on May 8, 2001
(2) Net of treasury shares held during the year
Financial highlights

14
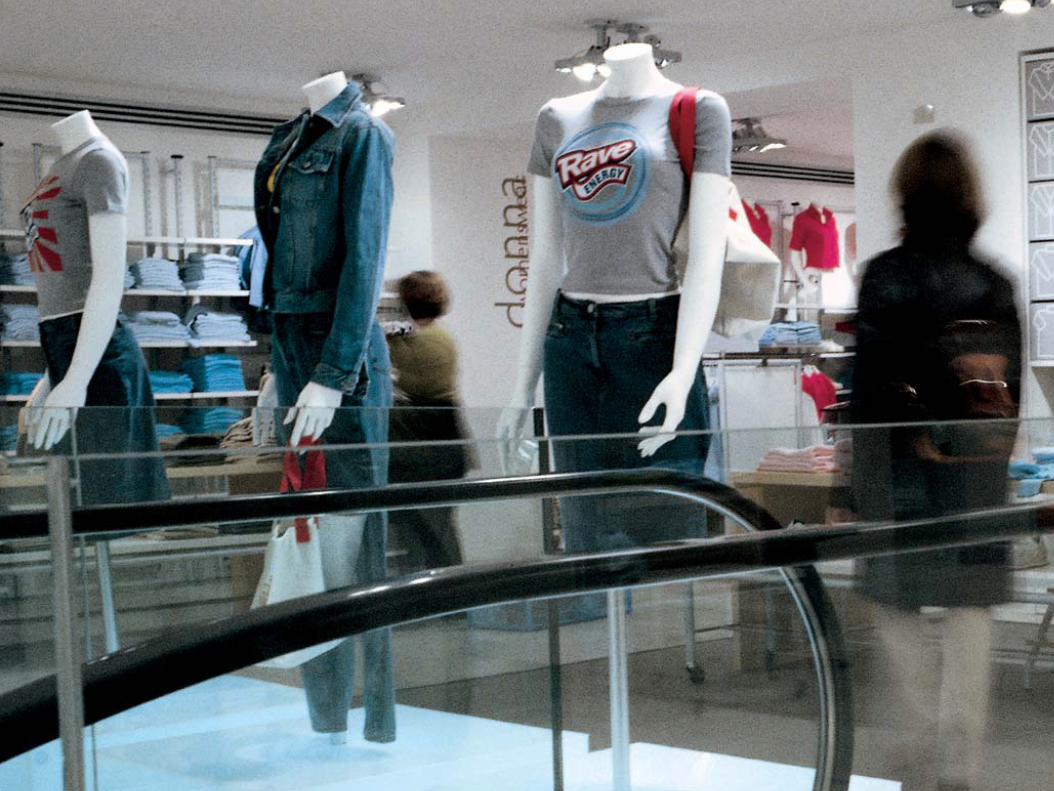
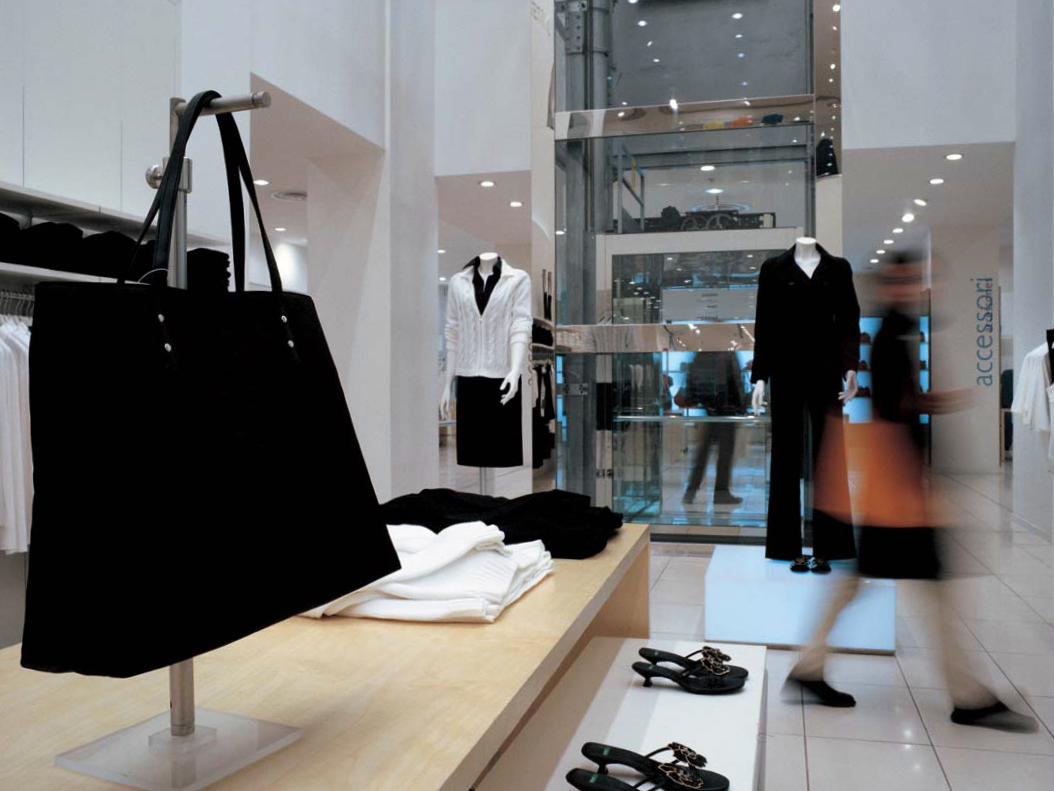
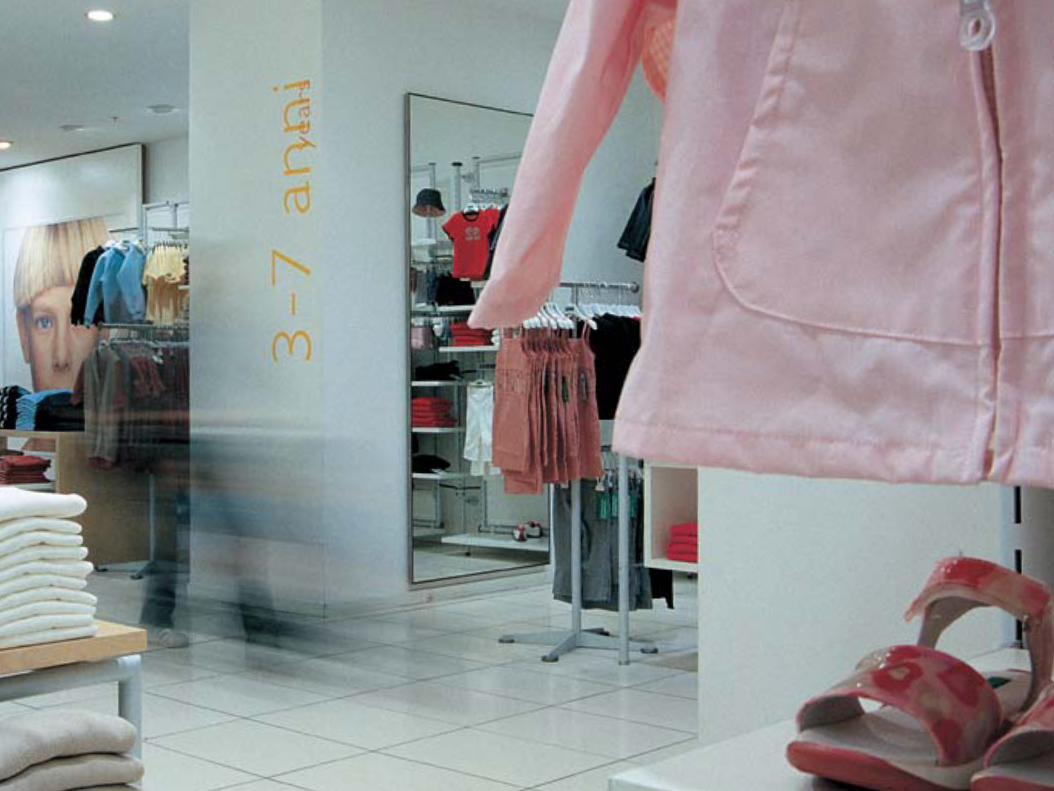
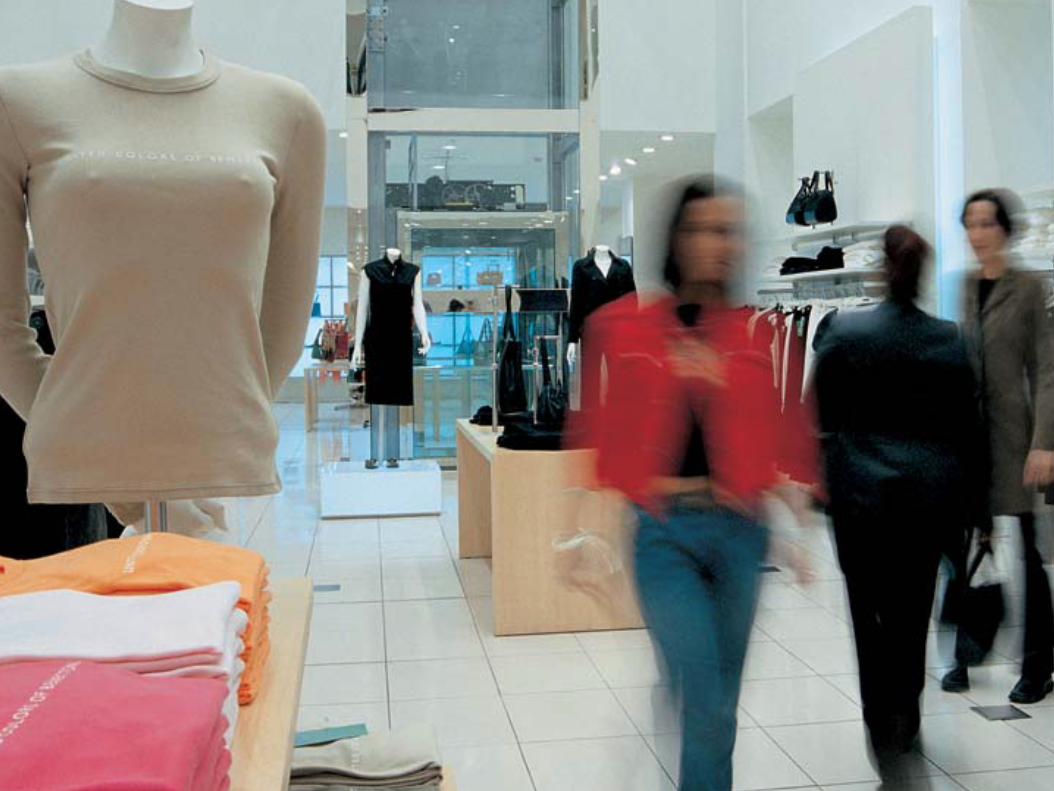
Distribution network The Group’s megastores, opened in historic and commercial centersof the world’s major cities, represent the best internationalshowcase for Benetton’s style and image. The network of thesemegastores grew much faster than expected during 2001,numbering over 100 at year-end. Directly-managed stores grew in a similar fashion. These, together with the network of 2,000entrepreneur-partners, are behind the enhancement in quality, in terms of completeness of the range, quality of service, designand atmosphere of the Benetton retail outlet. As regards our ability to respond to the ever faster changes in fashion, wehave been able, partly thanks to the rapid establishment of data exchange via the internet, to improve integration betweenthe areas of design, production, distribution and logistics. This has enabled us to achieve the goal of being able to delivernew proposals every two weeks to the worldwide network of stores.Retail growth in the sport sector saw a steady rise in the number of Playlife stores.
BrandsIn 2001 the habitually good results of United Colors of Benettonand Sisley were consolidated thanks to greater focus on themenswear collections, which now offer greater choice, style andidentity. Children’s wear, split by age group and presented in specific, larger selling areas, confirmed its growth potential. The product range was expanded with the launch of the new label The Hip Site. This is aimed at young people aged between 11 and 16, who want to stand out in the teenage world for their determination and personality. The range offers a completecollection of fashion clothing, accessories and cosmetics.In the sport business, the results of the Playlife brand werebroadly satisfactory. It improved the presence of its sportswearand accessories in specialized chain and department stores, partly thanks to the offer of more technical collections. The Nordica brand developed its collections by focusing on theoffer of co-ordinated solutions for boots, skis and bindings. Its products particularly benefited from the positive impact of results achieved in world-level events, crowned by six Olympicmedals at Salt Lake City. Prince continued to develop its Triple Threat technology (TTT-Triple Threat Tungsten), with itssales staying in line with the market. Rollerblade continued its strategy of focusing on the top-end of the market, against a background of sharply declining demand. It confirmed itself as the sector’s leading brand in terms of product quality
and innovation. As regards the Killer Loop brand, the decision was taken in 2001 to start selling snowboards under license.
LogisticsThe upgrade to the logistics center in Castrette brought dailycapacity to 40,000 cartons, with a capability to handle peak loadsof up to 50,000 cartons. The upward trend in the Group’smanufacturing output and the necessity of achieving greaterintegration, flexibility and speed, determined by the evolution of the commercial organization, notably the rapid development of the megastore and retail distribution network, have beensustained by the gradual introduction of state-of-the-arttechnology, with no interruption to the center’s operations.Having completed conversion of the first module, work started in2001 on reorganizing a second area, due to enter service by the summer of 2002 and involving a trebling of its total capacity.
ProductionThe production of casual clothing and accessories and sportswearexceeded 110 million units in 2001. The production system was improved during the year. Based on the Castrette model, itcan now count on a series of industrial clusters operating out ofHungary, Croatia, Tunisia and Spain, consisting of facilities directlyunder the Group’s control and a network of select, externalsuppliers. This system, which also benefits related businesses andthe local economy, will be extended to Slovakia in 2002, followingthe analysis and planning of operations during the course of 2001.The most significant investments in 2001, totaling some 19 millioneuro, involved the building of a new dyeing center in Croatia,which is now up and running, and the installation of innovativeplant and systems in Hungary. The latter is also capable ofproducing sports equipment, notably ski-boots, with productionlines entering service in 2001.
Reorganization of the sport segmentThe unsatisfactory performance of the sport segment in 2001 wasa further occasion for reflection and commitment by the BenettonGroup. The overall positive results for the sportswear sectorwere not matched by those in the equipment sector, which hasbeen particularly hard hit by the downturn on the in-line skatesmarket. As a result it was necessary to implement a targetedprogram of reorganization, which already started to take effectfrom the second half of 2001. With a general attention tocontrolling costs and evaluating investments, this program calls forthe reorganization of the sales force, including in the United
Directors’ report
15
2001
2000
2001
2000
1999
111
102
91
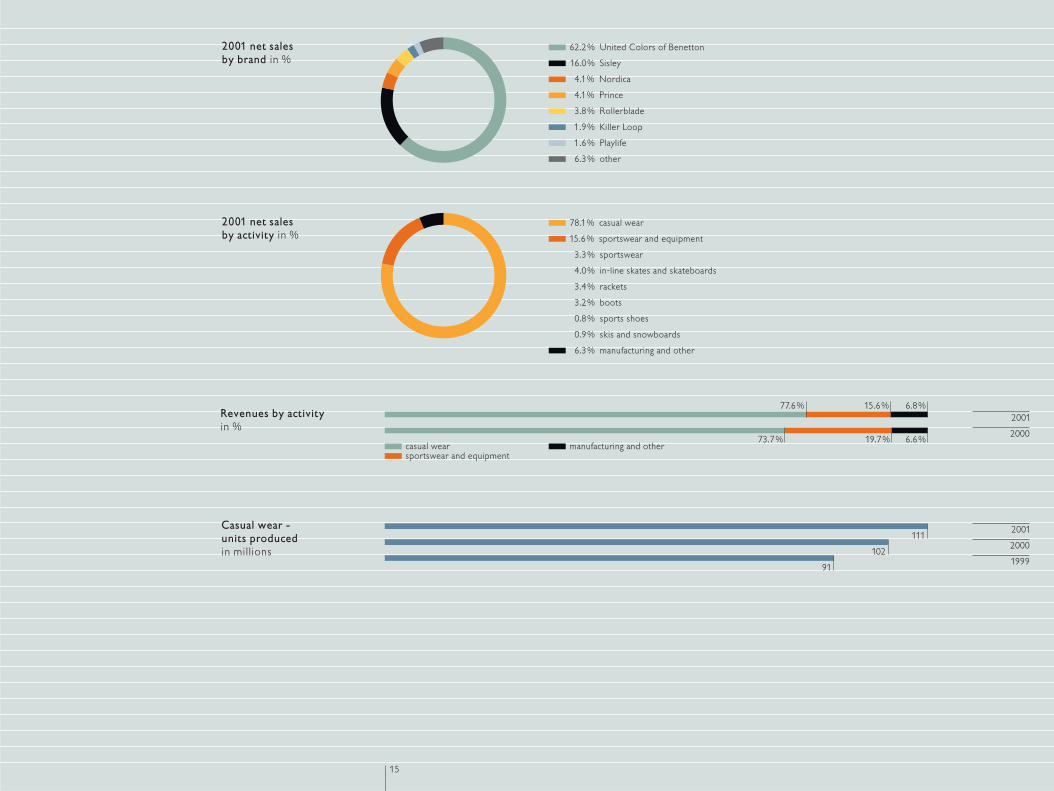
62.2% United Colors of Benetton
16.0% Sisley
4.1% Nordica
4.1% Prince
3.8% Rollerblade
1.9% Killer Loop
1.6% Playlife
6.3% other
78.1% casual wear
15.6% sportswear and equipment
3.3% sportswear
4.0% in-line skates and skateboards
3.4% rackets
3.2% boots
0.8% sports shoes
0.9% skis and snowboards
6.3% manufacturing and other
casual wearsportswear and equipment
manufacturing and other
6.8%
6.6%73.7% 19.7%
77.6% 15.6%
2001 net sales by brand in %
Revenues by activity in %
Casual wear - units producedin millions
2001 net sales by activity in %
16
States where we appointed a new Managing Director and aworldwide brand manager for Prince. It involves an increase inoutsourcing arrangements, optimization of the logistics system and consolidation of the brands’ image as quality leader,notably for Nordica and Prince.
Capital expendituresThe Group invested around 220 million euro on the acquisition of commercial activities and buildings, as well as upgrades andimprovements to sales space. This was in addition to the some390 million euro invested in previous years. Investments of some 67 million euro were made to improveoperations and production by the manufacturing facilities in Italyand abroad. Total investments made during the year came to 311 million euro,including for miscellaneous purchases (mainly of software andelectronic machinery).
Technology and qualityBenetton began a sweeping reorganization of its informationsystems in 2001. All areas of operation were upgraded to latest-generation systems, unified in an architecture based on Unix and Java in a web environment. More specifically, work started on developing new systems for the retail sector and storemanagement, based on the latest, available technology.Research and development of new products, materials anddesigns resulted in the registration of over 40 patents. Advancesin the clothing area saw the development of a new generation of the 206 fabric. This still features easy-care maintenance, while offering a degree of softness, comfort and elegancecomparable to that found in natural fibres.During 2001, the ISO 9001 and ISO 14001 quality systems wereextended to the accessories segment.
CommunicationThe start of the year saw Fabrica established as a cultural center of international standing, thanks to the Fabrica London Festival,which, for the whole of February, took Britain’s capital by stormwith a plethora of exhibitions, concerts, installations and films. In September the United Colors of Benetton fall 2001 advertisingcampaign was launched. It was created and developed by Fabrica in collaboration with the United Nations to celebrateInternational Year of Volunteers. Fabrica’s activities included the co-production of the film No Man’s Land, which won a series
of major international awards: Prize for the best screenplay atCannes 2001, Golden Globe and Oscar 2002 for best foreign film.
Supplementary information
Conversion of the Share Capital and reverse split of the shares.On May 8, 2001, the Shareholders voted at an extraordinaryMeeting to convert the Parent Company’s share capital into euroand to do a reverse split of the shares on the basis of one newshare of par value 1.30 euro for every ten shares of par value 0.13euro. Therefore, as at December 31, 2001 the share capitalamounts to 236,026,454.30 euro consisting of 181,558,811 shares.
Financial management. The Group’s considerable self-financingcapacity (374 million euro in 2001) has enabled it to pursue itsstrategy of expanding the sales network and rewarding theShareholders without causing any significant deterioration to theoverall financial position. This meant that no extraordinaryfinancing arrangements were required during 2001, except for the partial disposal of securities held in the portfolio.
Treasury shares. In compliance with the Shareholder’s Meetingresolutions of April 28, 2000 and May 8, 2001, during the year theParent Company acquired 1,594,650 treasury shares of par value1.30 euro each, corresponding to around 0.88% of the sharecapital, for a total figure of 22.8 million euro, at an average price of 14.30 euro per share. After the balance sheet date, in the early part of 2002, the Parent Company sold its entire holding of shares at an averageprice of 13.89 euro per share, realizing an overall loss of around 0.7 million euro.In the course of the year, Benetton Group S.p.A. did not purchase or sell shares or quotas in parent companies, directly or through subsidiaries, nominee companies or third parties.

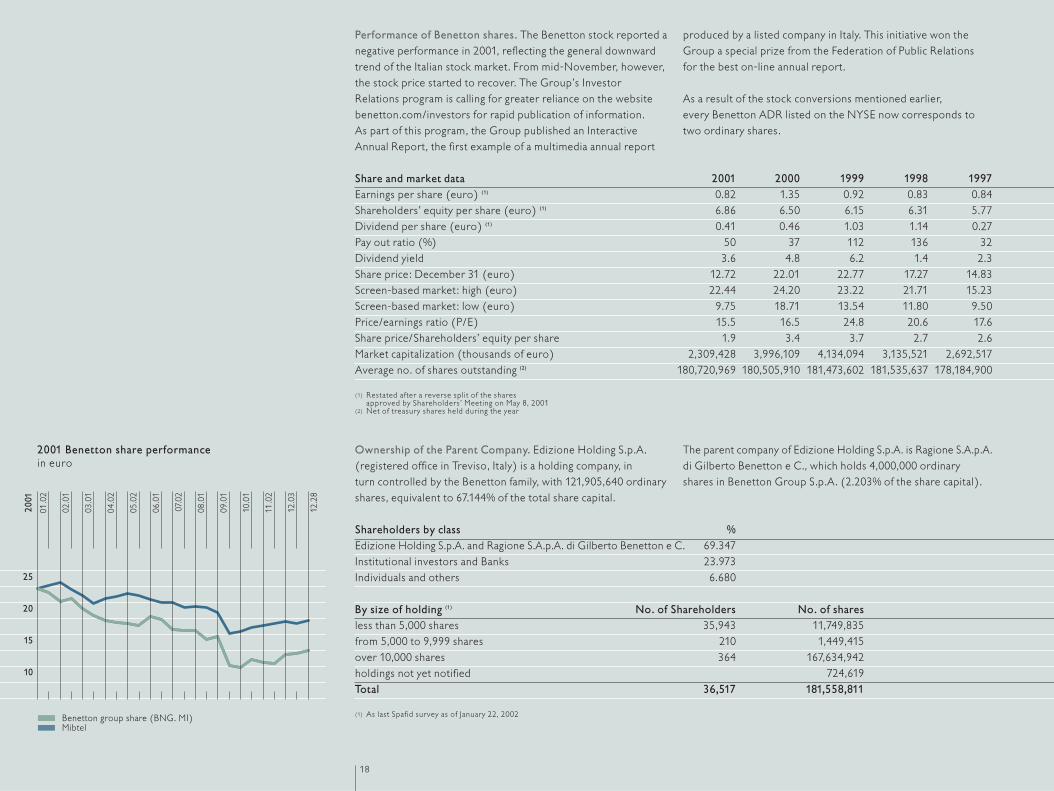
Performance of Benetton shares. The Benetton stock reported anegative performance in 2001, reflecting the general downwardtrend of the Italian stock market. From mid-November, however,the stock price started to recover. The Group’s Investor Relations program is calling for greater reliance on the websitebenetton.com/investors for rapid publication of information. As part of this program, the Group published an InteractiveAnnual Report, the first example of a multimedia annual report
produced by a listed company in Italy. This initiative won theGroup a special prize from the Federation of Public Relations for the best on-line annual report.
As a result of the stock conversions mentioned earlier, every Benetton ADR listed on the NYSE now corresponds to two ordinary shares.
18
Share and market data 2001 2000 1999 1998 1997Earnings per share (euro) (1) 0.82 1.35 0.92 0.83 0.84Shareholders’ equity per share (euro) (1) 6.86 6.50 6.15 6.31 5.77Dividend per share (euro) (1) 0.41 0.46 1.03 1.14 0.27Pay out ratio (%) 50 37 112 136 32Dividend yield 3.6 4.8 6.2 1.4 2.3Share price: December 31 (euro) 12.72 22.01 22.77 17.27 14.83Screen-based market: high (euro) 22.44 24.20 23.22 21.71 15.23Screen-based market: low (euro) 9.75 18.71 13.54 11.80 9.50Price/earnings ratio (P/E) 15.5 16.5 24.8 20.6 17.6Share price/Shareholders’ equity per share 1.9 3.4 3.7 2.7 2.6Market capitalization (thousands of euro) 2,309,428 3,996,109 4,134,094 3,135,521 2,692,517Average no. of shares outstanding (2) 180,720,969 180,505,910 181,473,602 181,535,637 178,184,900
(1) Restated after a reverse split of the shares approved by Shareholders’ Meeting on May 8, 2001
(2) Net of treasury shares held during the year
Ownership of the Parent Company. Edizione Holding S.p.A.(registered office in Treviso, Italy) is a holding company, in turn controlled by the Benetton family, with 121,905,640 ordinaryshares, equivalent to 67.144% of the total share capital.
The parent company of Edizione Holding S.p.A. is Ragione S.A.p.A.di Gilberto Benetton e C., which holds 4,000,000 ordinary shares in Benetton Group S.p.A. (2.203% of the share capital).
Shareholders by class %Edizione Holding S.p.A. and Ragione S.A.p.A. di Gilberto Benetton e C. 69.347Institutional investors and Banks 23.973Individuals and others 6.680
By size of holding (1) No. of Shareholders No. of sharesless than 5,000 shares 35,943 11,749,835from 5,000 to 9,999 shares 210 1,449,415over 10,000 shares 364 167,634,942holdings not yet notified 724,619Total 36,517 181,558,811
(1) As last Spafid survey as of January 22, 2002
25
20
15
10
01.0
2
2001
12.2
8
02.0
1
03.0
1
04.0
2
05.0
2
06.0
1
07.0
2
08.0
1
09.0
1
10.0
1
11.0
2
12.0
3
Benetton group share (BNG. MI)Mibtel
2001 Benetton share performance in euro

It should be remembered that in July 1998, via its Luxembourg-based subsidiary Edizione Participations S.A. (formerly EdizioneFinance S.A.) Edizione Holding S.p.A. issued a five-year bondworth 600 billion lire (around 310 million euro). It is convertible(between July 2000 and July 2003) into Benetton shares viaEdizione Participations S.A. A total of 11,214,953 shares,equivalent to approximately 6.177% shares in Benetton GroupS.p.A.’s share capital, have been made available to service this bond. Conversion from bonds to shares, which could beexercised should the stock price exceed 27.18 euro, would increasethe number of shares in circulation from 30.653% to 36.83%.
Relations with the parent company and its subsidiaries.The Benetton Group had trading and financial dealings with othersubsidiaries of Edizione Holding S.p.A. (the parent company) and with other parties which, directly or indirectly, are linked bycommon interests with the majority Shareholder. Trading relationswith such parties are conducted on an arm’s-length basis and using the utmost transparency. These transactions relate primarily to services and indemnities.
The relevant totals appear below:
19
Corporate Governance. In fiscal year 2001 the Benetton Groupagain focused on its corporate governance rules. It adopted themain principles and the most significant provisions of the Code ofConduct for Listed Companies and adapted its managerial anddecision-making procedures accordingly.The corporate governance system, as described below, followssound management and information principles, implementedthrough periodic reviews of the efficiency and effectiveness of thecorporate governance rules.
Ownership of the Parent Company. As described more specificallyunder the section of the Directors’ report for the fiscal year 2001 entitled “Ownership of the Parent Company” and based on the last available survey, Edizione Holding S.p.A. and its parentcompany Ragione S.A.p.A. di Gilberto Benetton e C. hold,respectively, stakes of 67.144% and 2.203% in the Company.
Board of Directors. Directors. Offices and delegation of powers.During fiscal year 2001, the Board of Directors held sevenmeetings, during which it discussed and approved industrial andfinancial strategic plans, organizational proposals and generalpolicies regarding the management of human resources, thecorporate structure of the Benetton Group, the business trend,the quarterly and half-year results and the grant and revocation
of powers to individual directors. At these meetings, theexecutive directors fully informed the Board of Directors and thestatutory auditors with respect to any transactions that wereatypical, unusual or with related parties.The current Board of Directors consists of eleven directors, eachof whose term of office will expire at the Shareholders’ Meetingheld to resolve on the financial statements for the 2001 fiscal year.Five directors have executive and representative powers: the Chairman (Luciano Benetton), the Deputy Chairman (CarloBenetton), Giuliana Benetton, Gilberto Benetton and the Managing Director (Luigi de Puppi). In particular, theChairman, the Deputy Chairman and the Managing Director havebeen granted with wide executive and managerial powers.There are six non-executive directors in office (ReginaldBartholomew, Alessandro Benetton, Luigi Arturo Bianchi, Gianni Mion, Angelo Tantazzi and Ulrich Weiss). Four of them(Reginald Bartholomew, Luigi Arturo Bianchi, Angelo Tantazzi andUlrich Weiss) are “independent” with regard to property andmanagement of the Parent Company, in accordance with the Codeof Conduct for Listed Companies. All directors actively andregularly participate in the activities of the Board of Directors.
thousands of euro 2001 2000Accounts receivable 5,248 2,893Accounts payable 199 1,469Purchases of raw materials 3,599 3,660Other costs and services 14,261 13,295Sales of products 1,713 3,229Revenue from services and other income 19,851 1,097
21
Compensation Committee and Committee for the proposal ofdirectors’ appointment. For fiscal year 2001, compensation forindividual directors has been set by the Board of Directors, as indicated in the Note to the consolidated financial statementof the Benetton Group, following the determination of the aggregate compensation for the Board of Directors by theShareholders at the General Meeting in accordance with the By-Laws.
The Board of Directors, in compliance with the Code of Conductfor Listed Companies, set up a Compensation Committee with the powers provided by the Code. The members of theCompensation Committee are Reginald Bartholomew, Ulrich Weiss and Gianni Mion, all of whom are non-executive directors.Directors are appointed from a list held at the Parent Company’soffices prior to the Shareholders’ Meeting, which is accompanied by a comprehensive outline of the personal andprofessional qualifications of the persons on the list.The Board of Directors has not deemed it appropriate toestablish a Committee for the proposal of directors’appointment, due to the current shareholding of the ParentCompany.
Internal audit. Internal audit Committee. The Board of Directorshas established the internal audit committee, whose membersare non-executive directors: Ulrich Weiss, Angelo Tantazzi andLuigi Arturo Bianchi, all independent with regards to propertyand management of the Parent Company.
The internal audit Committee has been assigned the followingresponsibilities:
• to make proposals for the establishment of an internal auditdepartment responsible for the internal audit and to determinethe duties of this department;
• to verify the adequacy of the administration and accountingsystem and the internal audit system;
• to review periodic reports from, and the executive plan of, thepersons responsible for the internal audit, as well as to promoteactions for the improvement of the internal audit system;
• to report to the Board of Directors, at least every 6 months, in connection with its approval of the financial statements and the half-year report, on the activities carried out and on theadequacy of the internal audit;
• to monitor compliance with, and the periodic revision of thecorporate governance rules.
The internal audit Committee has begun by appointing Ulrich Weiss as the Chairman and by adopting operating rules. In particular, it has adopted lines of action for establishing theinternal audit department.
Although the Parent Company has not yet established the internalaudit department, which will be set up and will begin performingits duties shortly, its organizational and information systemsensure, including with respect to subsidiary companies, themonitoring of the administrative and accounting system as well asthe central and peripheral organizational structure. Within this framework, the independent directors, the Board of statutoryauditors and the external auditors receive a regular flow ofinformation.
Until the process of establishing the internal audit department has been completed, the efficiency and adequacy of the internalaudit will be monitored by the Managing Director. Within thisframework, there has been an increase in the number and scopeof risk assessment activities with respect to all of the BenettonGroup companies, management controls on single businesses andreviews of the internal audit by the external auditors.
22
Handling of confidential information. All confidential information ismanaged by the Managing Director, upon consultation with theChairman. Together, the Managing Director and the Chairman alsoensure that controls are carried out with regard to theclassification of confidential information in accordance withcurrent legislation. The Managing Director supervises legal compliance with respectto proper disclosure of information relating to the ParentCompany and, to this end, co-ordinates all suitable interventionby the various internal structures.The Board of Directors approves all press releases relating toresolutions on the year’s financial statements, the half-year report, the quarterly report as well as extraordinary decisions oroperations that are subject to the approval of the Board ofDirectors. All communications to and relations with the press, institutionalinvestors and individual Shareholders are conducted by the Mediaand Communication Department and the Investor RelationsDepartment, respectively.
Relations with institutional investors and with the otherShareholders. The Investor Relations Department ensures correctmanagement of relations with financial analysts, institutionalinvestors and individual Italian and foreign Shareholders.
Among other activities, this Department co-ordinates activitieswith financial experts.
This document will also be available on the site www.benetton.comunder the heading Investor Relations.
24
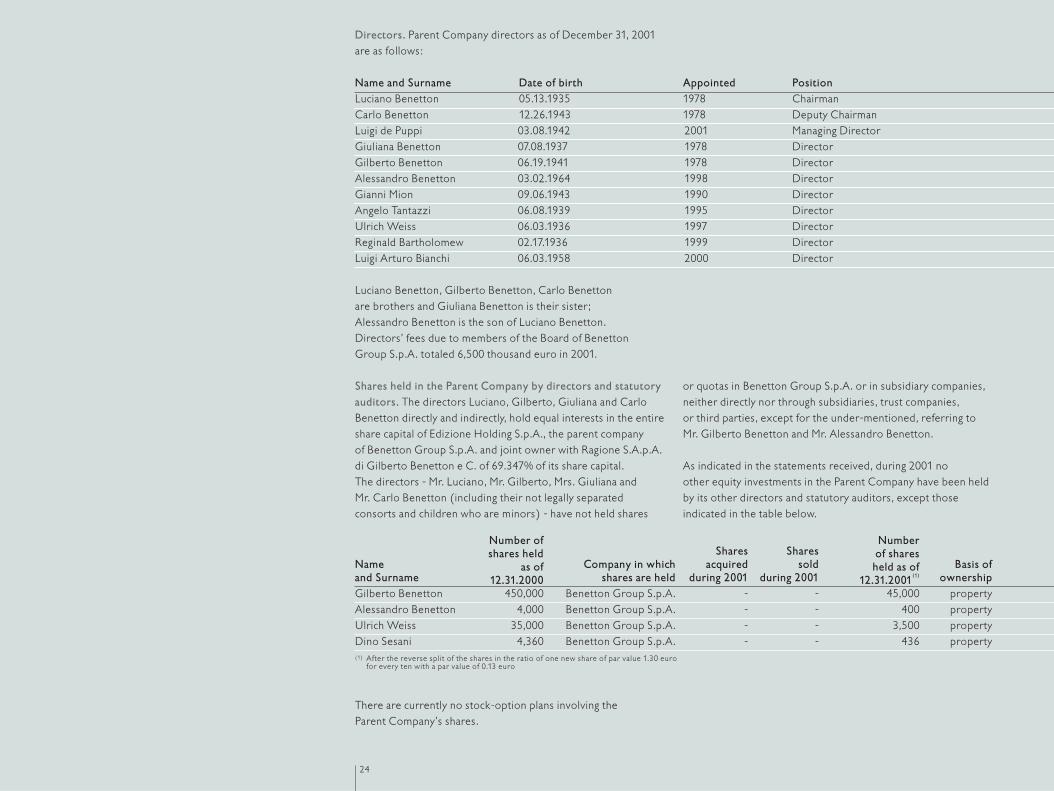
Directors. Parent Company directors as of December 31, 2001 are as follows:
Name and Surname Date of birth Appointed PositionLuciano Benetton 05.13.1935 1978 ChairmanCarlo Benetton 12.26.1943 1978 Deputy ChairmanLuigi de Puppi 03.08.1942 2001 Managing DirectorGiuliana Benetton 07.08.1937 1978 DirectorGilberto Benetton 06.19.1941 1978 Director Alessandro Benetton 03.02.1964 1998 DirectorGianni Mion 09.06.1943 1990 DirectorAngelo Tantazzi 06.08.1939 1995 DirectorUlrich Weiss 06.03.1936 1997 DirectorReginald Bartholomew 02.17.1936 1999 DirectorLuigi Arturo Bianchi 06.03.1958 2000 Director
Luciano Benetton, Gilberto Benetton, Carlo Benetton are brothers and Giuliana Benetton is their sister; Alessandro Benetton is the son of Luciano Benetton.Directors’ fees due to members of the Board of Benetton Group S.p.A. totaled 6,500 thousand euro in 2001.
Shares held in the Parent Company by directors and statutoryauditors. The directors Luciano, Gilberto, Giuliana and CarloBenetton directly and indirectly, hold equal interests in the entireshare capital of Edizione Holding S.p.A., the parent company of Benetton Group S.p.A. and joint owner with Ragione S.A.p.A.di Gilberto Benetton e C. of 69.347% of its share capital. The directors - Mr. Luciano, Mr. Gilberto, Mrs. Giuliana andMr. Carlo Benetton (including their not legally separated consorts and children who are minors) - have not held shares
or quotas in Benetton Group S.p.A. or in subsidiary companies,neither directly nor through subsidiaries, trust companies, or third parties, except for the under-mentioned, referring toMr. Gilberto Benetton and Mr. Alessandro Benetton.
As indicated in the statements received, during 2001 no other equity investments in the Parent Company have been heldby its other directors and statutory auditors, except thoseindicated in the table below.
Number of Number shares held Shares Shares of shares
Name as of Company in which acquired sold held as of Basis ofand Surname 12.31.2000 shares are held during 2001 during 2001 12.31.2001(1) ownershipGilberto Benetton 450,000 Benetton Group S.p.A. - - 45,000 propertyAlessandro Benetton 4,000 Benetton Group S.p.A. - - 400 propertyUlrich Weiss 35,000 Benetton Group S.p.A. - - 3,500 propertyDino Sesani 4,360 Benetton Group S.p.A. - - 436 property(1) After the reverse split of the shares in the ratio of one new share of par value 1.30 euro
for every ten with a par value of 0.13 euro
There are currently no stock-option plans involving the Parent Company’s shares.
25
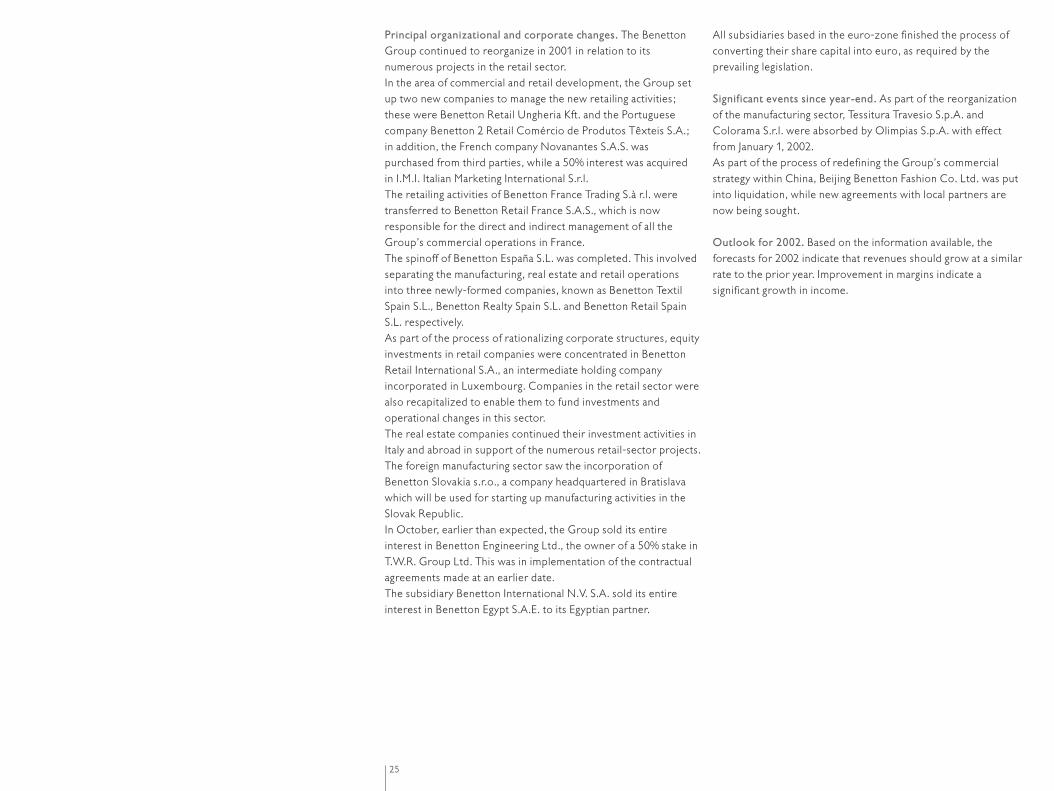
Principal organizational and corporate changes. The BenettonGroup continued to reorganize in 2001 in relation to itsnumerous projects in the retail sector. In the area of commercial and retail development, the Group setup two new companies to manage the new retailing activities;these were Benetton Retail Ungheria Kft. and the Portuguesecompany Benetton 2 Retail Comércio de Produtos Têxteis S.A.; in addition, the French company Novanantes S.A.S. was purchased from third parties, while a 50% interest was acquired in I.M.I. Italian Marketing International S.r.l.The retailing activities of Benetton France Trading S.à r.l. weretransferred to Benetton Retail France S.A.S., which is nowresponsible for the direct and indirect management of all theGroup’s commercial operations in France. The spinoff of Benetton España S.L. was completed. This involvedseparating the manufacturing, real estate and retail operations into three newly-formed companies, known as Benetton TextilSpain S.L., Benetton Realty Spain S.L. and Benetton Retail SpainS.L. respectively.As part of the process of rationalizing corporate structures, equityinvestments in retail companies were concentrated in BenettonRetail International S.A., an intermediate holding companyincorporated in Luxembourg. Companies in the retail sector werealso recapitalized to enable them to fund investments andoperational changes in this sector.The real estate companies continued their investment activities inItaly and abroad in support of the numerous retail-sector projects.The foreign manufacturing sector saw the incorporation ofBenetton Slovakia s.r.o., a company headquartered in Bratislavawhich will be used for starting up manufacturing activities in theSlovak Republic.In October, earlier than expected, the Group sold its entireinterest in Benetton Engineering Ltd., the owner of a 50% stake inT.W.R. Group Ltd. This was in implementation of the contractualagreements made at an earlier date.The subsidiary Benetton International N.V. S.A. sold its entireinterest in Benetton Egypt S.A.E. to its Egyptian partner.
All subsidiaries based in the euro-zone finished the process ofconverting their share capital into euro, as required by theprevailing legislation.
Significant events since year-end. As part of the reorganization of the manufacturing sector, Tessitura Travesio S.p.A. andColorama S.r.l. were absorbed by Olimpias S.p.A. with effect from January 1, 2002. As part of the process of redefining the Group’s commercialstrategy within China, Beijing Benetton Fashion Co. Ltd. was putinto liquidation, while new agreements with local partners arenow being sought.
Outlook for 2002. Based on the information available, theforecasts for 2002 indicate that revenues should grow at a similarrate to the prior year. Improvement in margins indicate asignificant growth in income.
26
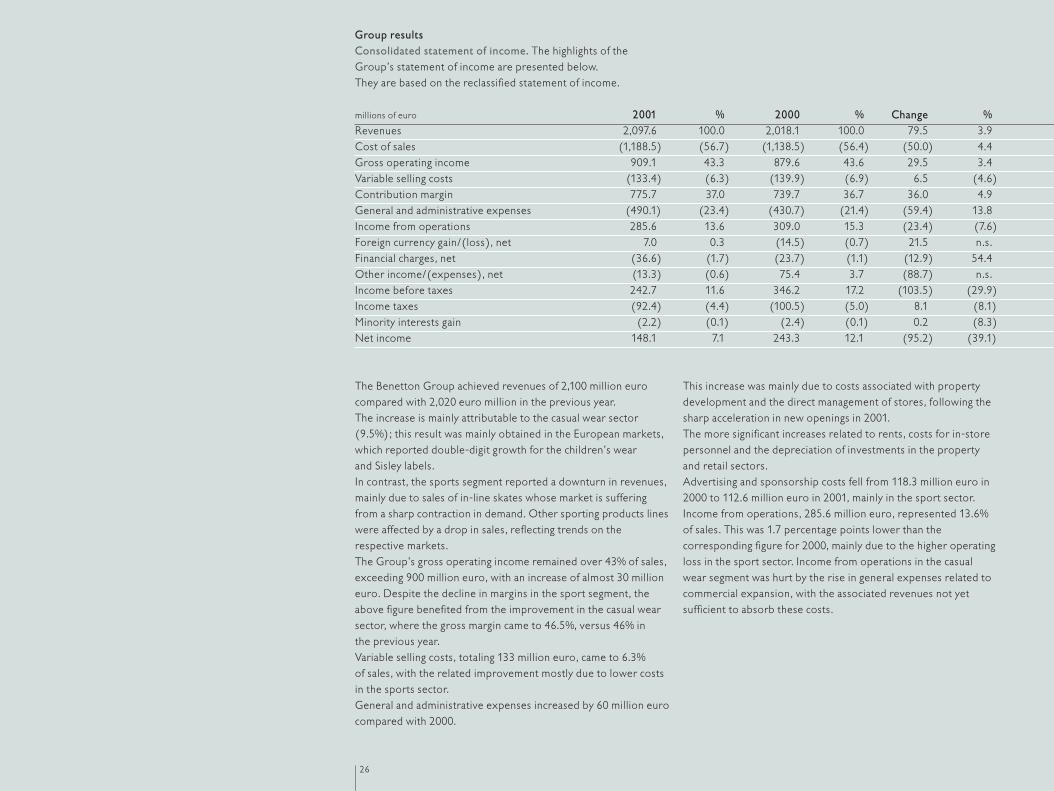
Group resultsConsolidated statement of income. The highlights of the Group’s statement of income are presented below. They are based on the reclassified statement of income.
millions of euro 2001 % 2000 % Change %Revenues 2,097.6 100.0 2,018.1 100.0 79.5 3.9Cost of sales (1,188.5) (56.7) (1,138.5) (56.4) (50.0) 4.4Gross operating income 909.1 43.3 879.6 43.6 29.5 3.4Variable selling costs (133.4) (6.3) (139.9) (6.9) 6.5 (4.6)Contribution margin 775.7 37.0 739.7 36.7 36.0 4.9General and administrative expenses (490.1) (23.4) (430.7) (21.4) (59.4) 13.8Income from operations 285.6 13.6 309.0 15.3 (23.4) (7.6)Foreign currency gain/(loss), net 7.0 0.3 (14.5) (0.7) 21.5 n.s.Financial charges, net (36.6) (1.7) (23.7) (1.1) (12.9) 54.4Other income/(expenses), net (13.3) (0.6) 75.4 3.7 (88.7) n.s.Income before taxes 242.7 11.6 346.2 17.2 (103.5) (29.9)Income taxes (92.4) (4.4) (100.5) (5.0) 8.1 (8.1)Minority interests gain (2.2) (0.1) (2.4) (0.1) 0.2 (8.3)Net income 148.1 7.1 243.3 12.1 (95.2) (39.1)
The Benetton Group achieved revenues of 2,100 million eurocompared with 2,020 euro million in the previous year. The increase is mainly attributable to the casual wear sector(9.5%); this result was mainly obtained in the European markets,which reported double-digit growth for the children’s wear and Sisley labels. In contrast, the sports segment reported a downturn in revenues,mainly due to sales of in-line skates whose market is sufferingfrom a sharp contraction in demand. Other sporting products lineswere affected by a drop in sales, reflecting trends on therespective markets. The Group’s gross operating income remained over 43% of sales,exceeding 900 million euro, with an increase of almost 30 millioneuro. Despite the decline in margins in the sport segment, theabove figure benefited from the improvement in the casual wearsector, where the gross margin came to 46.5%, versus 46% in the previous year. Variable selling costs, totaling 133 million euro, came to 6.3% of sales, with the related improvement mostly due to lower costsin the sports sector. General and administrative expenses increased by 60 million eurocompared with 2000.
This increase was mainly due to costs associated with propertydevelopment and the direct management of stores, following thesharp acceleration in new openings in 2001.The more significant increases related to rents, costs for in-storepersonnel and the depreciation of investments in the propertyand retail sectors. Advertising and sponsorship costs fell from 118.3 million euro in2000 to 112.6 million euro in 2001, mainly in the sport sector. Income from operations, 285.6 million euro, represented 13.6%of sales. This was 1.7 percentage points lower than thecorresponding figure for 2000, mainly due to the higher operatingloss in the sport sector. Income from operations in the casual wear segment was hurt by the rise in general expenses related tocommercial expansion, with the associated revenues not yetsufficient to absorb these costs.
27
The overall result of foreign exchange management was a net gainof 7 million euro; this reflected the policy of hedging exchangerisks and was principally influenced by fluctuations during the yearin the dollar and yen.The increase in net financial charges is due to the Group’s higheramount of average net indebtedness, resulting from the sizeableinvestments in support of its commercial operations.Other expenses include an extraordinary expense of 14.7 millioneuro resulting from certain legal settlements and re-organizationexpenses relating to some of the Group’s companies.
Performance by activity. The Group’s activities are traditionallydivided into three sectors to provide the basis for effectiveadministration and adequate decision-making by Companymanagement, and to supply accurate and relevant informationabout Company performance to external investors.
The business sectors are as follows:• the casual wear sector, representing the Benetton brands (United
Colors of Benetton, Undercolors and Sisley), which alsoincorporates complementary products, such as accessories andfootwear, as well as figures for the retail business;
• the sportswear and equipment sector, with the Playlife, Nordica,Prince, Rollerblade and Killer Loop brands;
• the manufacturing and other sectors, including sales of raw materials, semi-finished products, industrial services andrevenues and expenses from real estate activity.
Extraordinary income in 2000 was largely the net product of the capital gain on the disposal of Benetton Formula Ltd., andextraordinary expenses arising from the settlements with EcoSwiss China Time Ltd. and Bulova Corporation, from restructuringand the settlement of legal disputes. The Group’s net income, net of the above extraordinary items,amounted to 162.8 million euro, compared with 174.1 million euro in 2000.
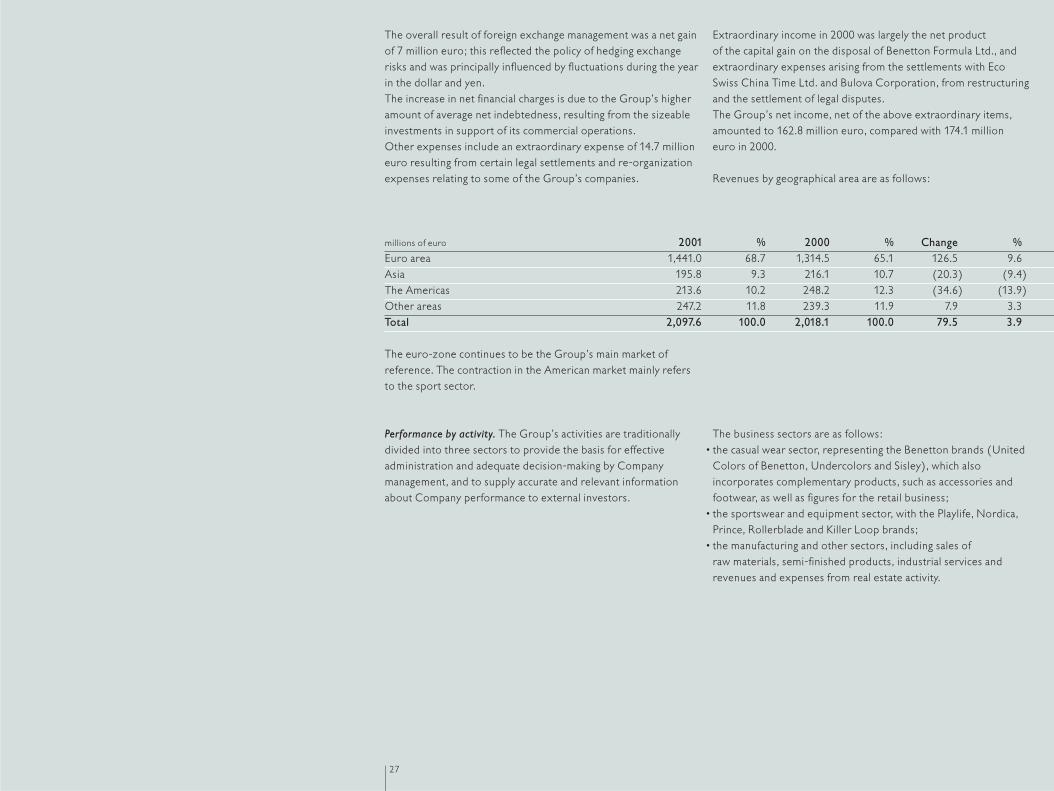
Revenues by geographical area are as follows:
millions of euro 2001 % 2000 % Change %Euro area 1,441.0 68.7 1,314.5 65.1 126.5 9.6Asia 195.8 9.3 216.1 10.7 (20.3) (9.4)The Americas 213.6 10.2 248.2 12.3 (34.6) (13.9)Other areas 247.2 11.8 239.3 11.9 7.9 3.3Total 2,097.6 100.0 2,018.1 100.0 79.5 3.9
The euro-zone continues to be the Group’s main market of reference. The contraction in the American market mainly refers to the sport sector.
28
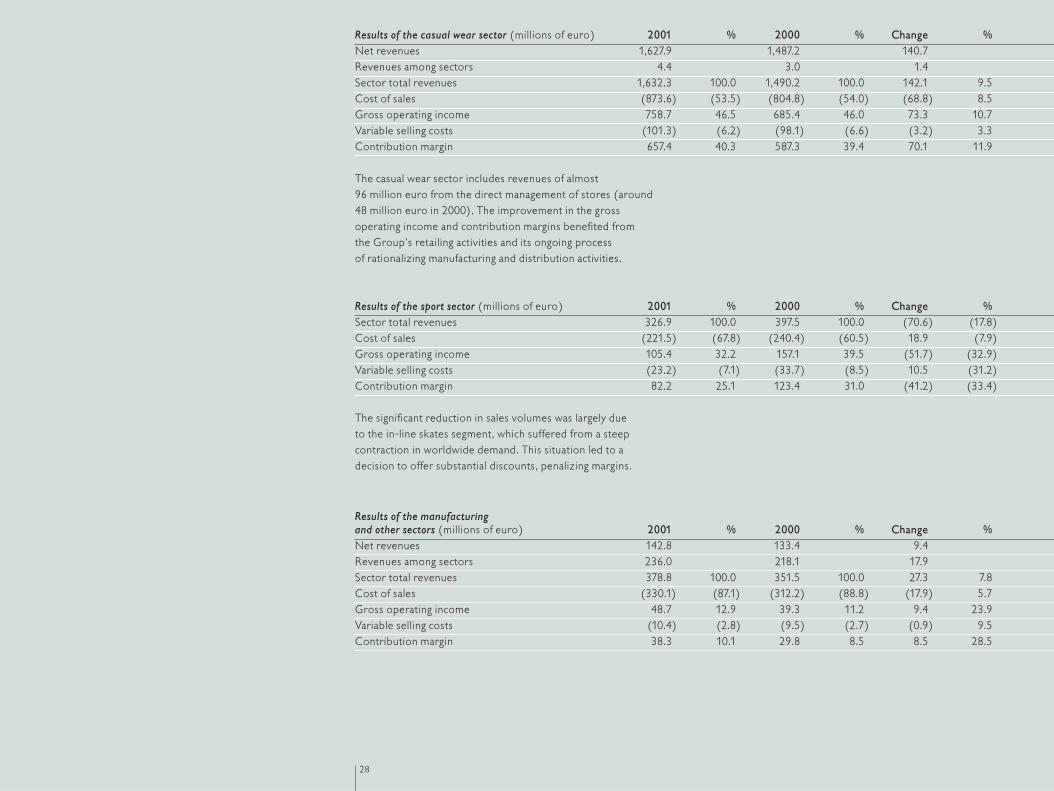
Results of the casual wear sector (millions of euro) 2001 % 2000 % Change %Net revenues 1,627.9 1,487.2 140.7Revenues among sectors 4.4 3.0 1.4Sector total revenues 1,632.3 100.0 1,490.2 100.0 142.1 9.5Cost of sales (873.6) (53.5) (804.8) (54.0) (68.8) 8.5Gross operating income 758.7 46.5 685.4 46.0 73.3 10.7Variable selling costs (101.3) (6.2) (98.1) (6.6) (3.2) 3.3Contribution margin 657.4 40.3 587.3 39.4 70.1 11.9
The casual wear sector includes revenues of almost 96 million euro from the direct management of stores (around 48 million euro in 2000). The improvement in the gross operating income and contribution margins benefited from the Group’s retailing activities and its ongoing process of rationalizing manufacturing and distribution activities.
Results of the sport sector (millions of euro) 2001 % 2000 % Change %Sector total revenues 326.9 100.0 397.5 100.0 (70.6) (17.8)Cost of sales (221.5) (67.8) (240.4) (60.5) 18.9 (7.9)Gross operating income 105.4 32.2 157.1 39.5 (51.7) (32.9)Variable selling costs (23.2) (7.1) (33.7) (8.5) 10.5 (31.2)Contribution margin 82.2 25.1 123.4 31.0 (41.2) (33.4)
The significant reduction in sales volumes was largely due to the in-line skates segment, which suffered from a steep contraction in worldwide demand. This situation led to a decision to offer substantial discounts, penalizing margins.
Results of the manufacturing and other sectors (millions of euro) 2001 % 2000 % Change %Net revenues 142.8 133.4 9.4Revenues among sectors 236.0 218.1 17.9Sector total revenues 378.8 100.0 351.5 100.0 27.3 7.8Cost of sales (330.1) (87.1) (312.2) (88.8) (17.9) 5.7Gross operating income 48.7 12.9 39.3 11.2 9.4 23.9Variable selling costs (10.4) (2.8) (9.5) (2.7) (0.9) 9.5Contribution margin 38.3 10.1 29.8 8.5 8.5 28.5
29
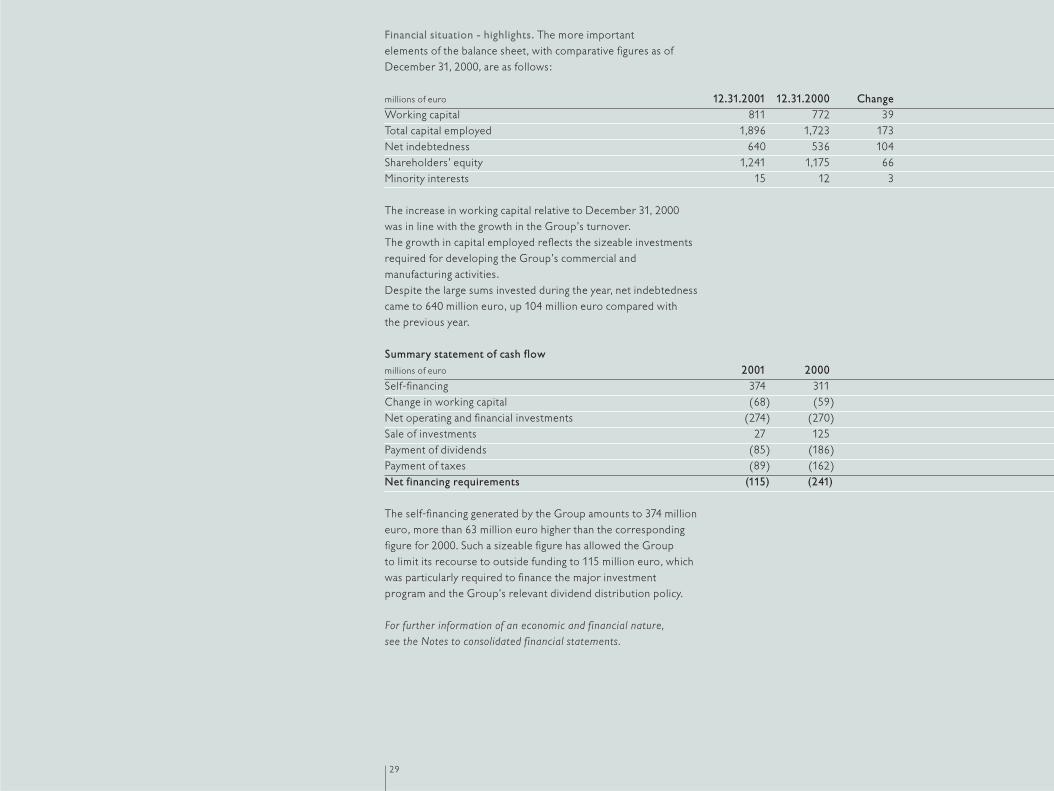
Financial situation - highlights. The more important elements of the balance sheet, with comparative figures as of December 31, 2000, are as follows:
millions of euro 12.31.2001 12.31.2000 ChangeWorking capital 811 772 39Total capital employed 1,896 1,723 173Net indebtedness 640 536 104Shareholders’ equity 1,241 1,175 66Minority interests 15 12 3
The increase in working capital relative to December 31, 2000 was in line with the growth in the Group’s turnover. The growth in capital employed reflects the sizeable investmentsrequired for developing the Group’s commercial andmanufacturing activities. Despite the large sums invested during the year, net indebtednesscame to 640 million euro, up 104 million euro compared with the previous year.
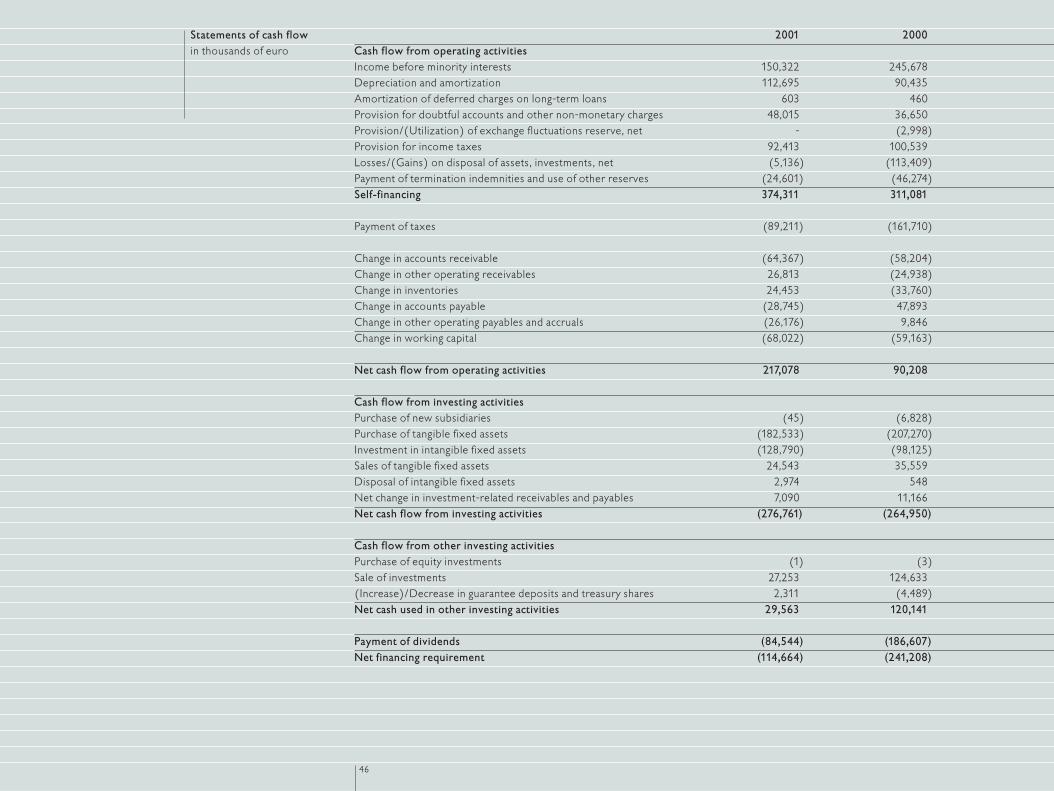
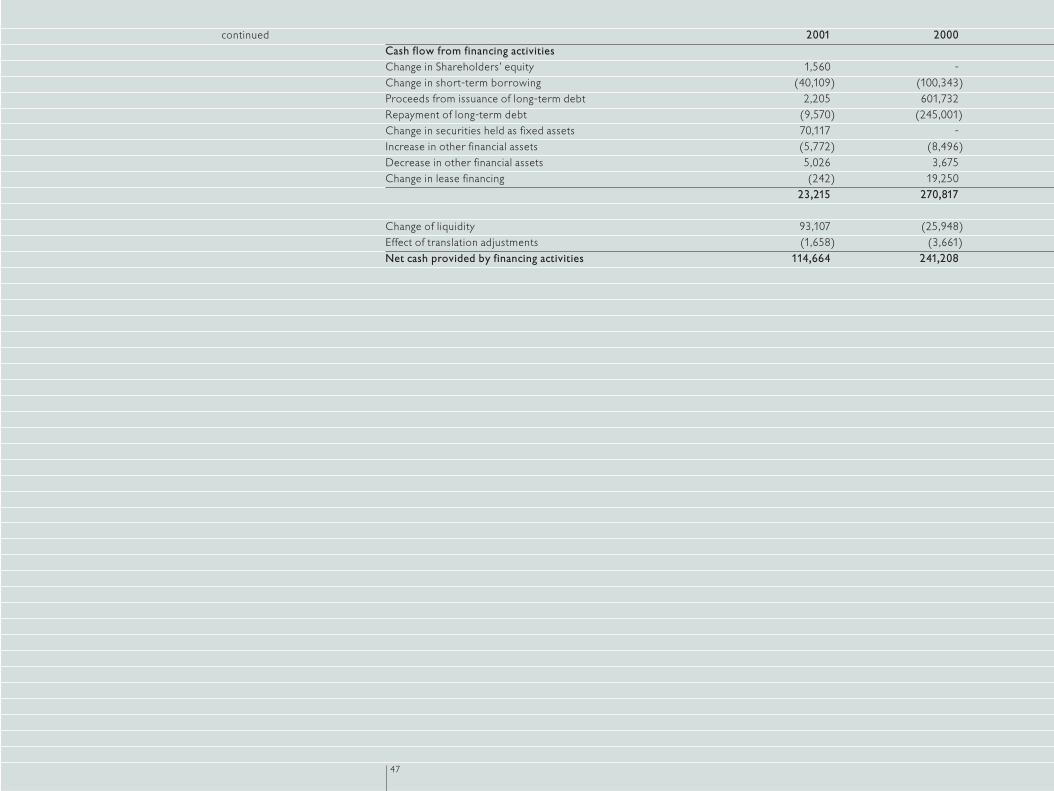
Summary statement of cash flow millions of euro 2001 2000Self-financing 374 311Change in working capital (68) (59)Net operating and financial investments (274) (270)Sale of investments 27 125Payment of dividends (85) (186)Payment of taxes (89) (162)Net financing requirements (115) (241)
The self-financing generated by the Group amounts to 374 millioneuro, more than 63 million euro higher than the correspondingfigure for 2000. Such a sizeable figure has allowed the Group to limit its recourse to outside funding to 115 million euro, whichwas particularly required to finance the major investment program and the Group’s relevant dividend distribution policy.
For further information of an economic and financial nature, see the Notes to consolidated financial statements.
30
2001
2000
1999
1998
1997
2001
2000
1999
1998
1997
243148
346243
265166
218
277
151
150
286
309
316
233
258
880
873
812
791
909
income before taxesnet income
gross operating incomeincome from operations
Income before taxes and net incomein millions of euro
Gross operating income and income from operationsin millions of euro

31
2001
2000
2001
2000
27
2748568 89
374
56.7 29.7 6.5 7.1
12.13.228.356.4
115
27018659 162
125311 241
cost of sales
gross operating income income from operations net income
SG&A costsother elements*net income
self-financingnet financing/(requirement) surplus
sales of equity investmentschange in working capital
payment of dividends net operating and financial requirementspayment of taxes
*other financial income/expenses + income taxes + income/loss attributable to minority interests
sa
sa
Source and application of funds in millions of euro
Reclassified income statement in %

Benetton GroupNotes to 2001 consolidatedfinancial statements
34
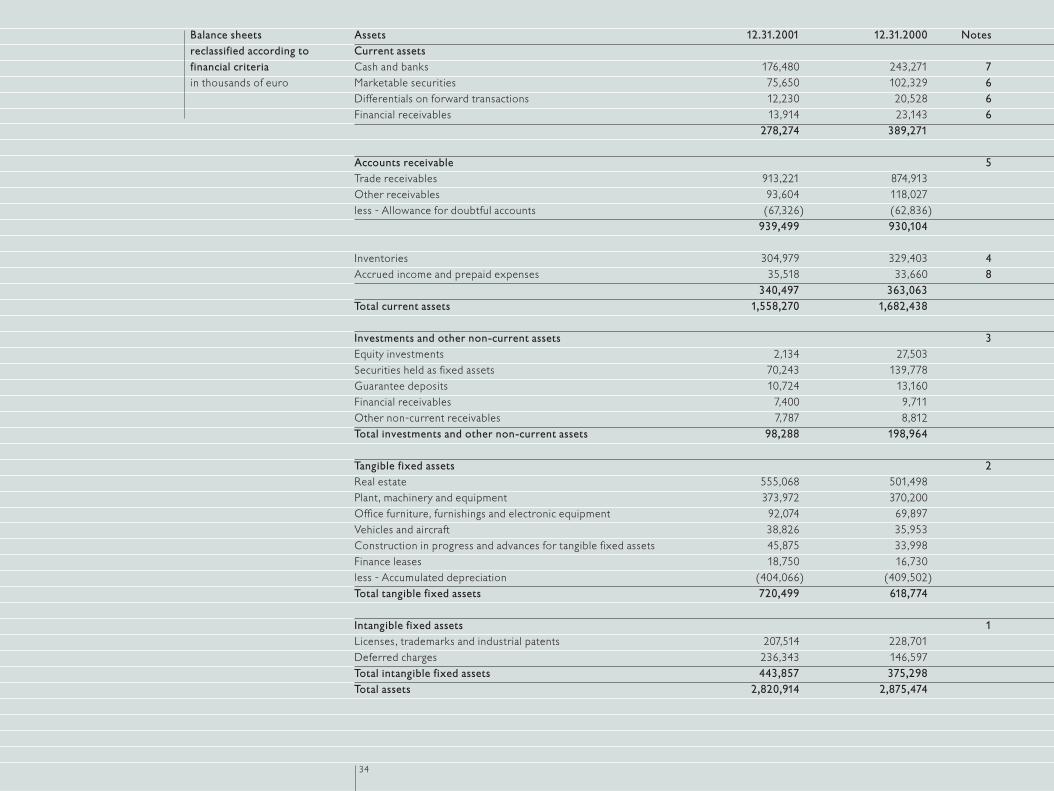
Assets 12.31.2001 12.31.2000 NotesCurrent assetsCash and banks 176,480 243,271 7Marketable securities 75,650 102,329 6Differentials on forward transactions 12,230 20,528 6Financial receivables 13,914 23,143 6
278,274 389,271
Accounts receivable 5Trade receivables 913,221 874,913Other receivables 93,604 118,027less - Allowance for doubtful accounts (67,326) (62,836)
939,499 930,104
Inventories 304,979 329,403 4Accrued income and prepaid expenses 35,518 33,660 8
340,497 363,063Total current assets 1,558,270 1,682,438
Investments and other non-current assets 3Equity investments 2,134 27,503Securities held as fixed assets 70,243 139,778Guarantee deposits 10,724 13,160Financial receivables 7,400 9,711Other non-current receivables 7,787 8,812Total investments and other non-current assets 98,288 198,964
Tangible fixed assets 2Real estate 555,068 501,498Plant, machinery and equipment 373,972 370,200Office furniture, furnishings and electronic equipment 92,074 69,897Vehicles and aircraft 38,826 35,953Construction in progress and advances for tangible fixed assets 45,875 33,998Finance leases 18,750 16,730less - Accumulated depreciation (404,066) (409,502)Total tangible fixed assets 720,499 618,774
Intangible fixed assets 1Licenses, trademarks and industrial patents 207,514 228,701Deferred charges 236,343 146,597Total intangible fixed assets 443,857 375,298Total assets 2,820,914 2,875,474
Balance sheets reclassified according tofinancial criteriain thousands of euro
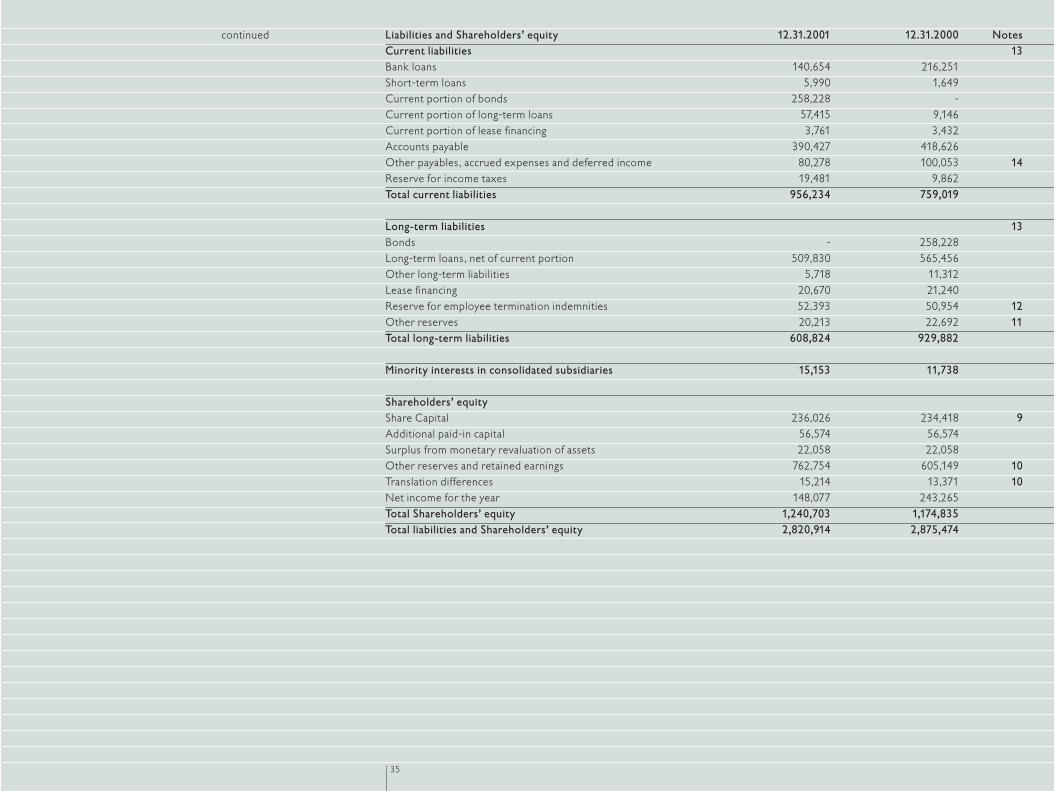
Liabilities and Shareholders’ equity 12.31.2001 12.31.2000 NotesCurrent liabilities 13Bank loans 140,654 216,251Short-term loans 5,990 1,649Current portion of bonds 258,228 -Current portion of long-term loans 57,415 9,146Current portion of lease financing 3,761 3,432Accounts payable 390,427 418,626Other payables, accrued expenses and deferred income 80,278 100,053 14Reserve for income taxes 19,481 9,862Total current liabilities 956,234 759,019
Long-term liabilities 13Bonds - 258,228Long-term loans, net of current portion 509,830 565,456Other long-term liabilities 5,718 11,312Lease financing 20,670 21,240Reserve for employee termination indemnities 52,393 50,954 12Other reserves 20,213 22,692 11Total long-term liabilities 608,824 929,882
Minority interests in consolidated subsidiaries 15,153 11,738
Shareholders’ equityShare Capital 236,026 234,418 9Additional paid-in capital 56,574 56,574Surplus from monetary revaluation of assets 22,058 22,058Other reserves and retained earnings 762,754 605,149 10Translation differences 15,214 13,371 10Net income for the year 148,077 243,265Total Shareholders’ equity 1,240,703 1,174,835Total liabilities and Shareholders’ equity 2,820,914 2,875,474
35
continued
37
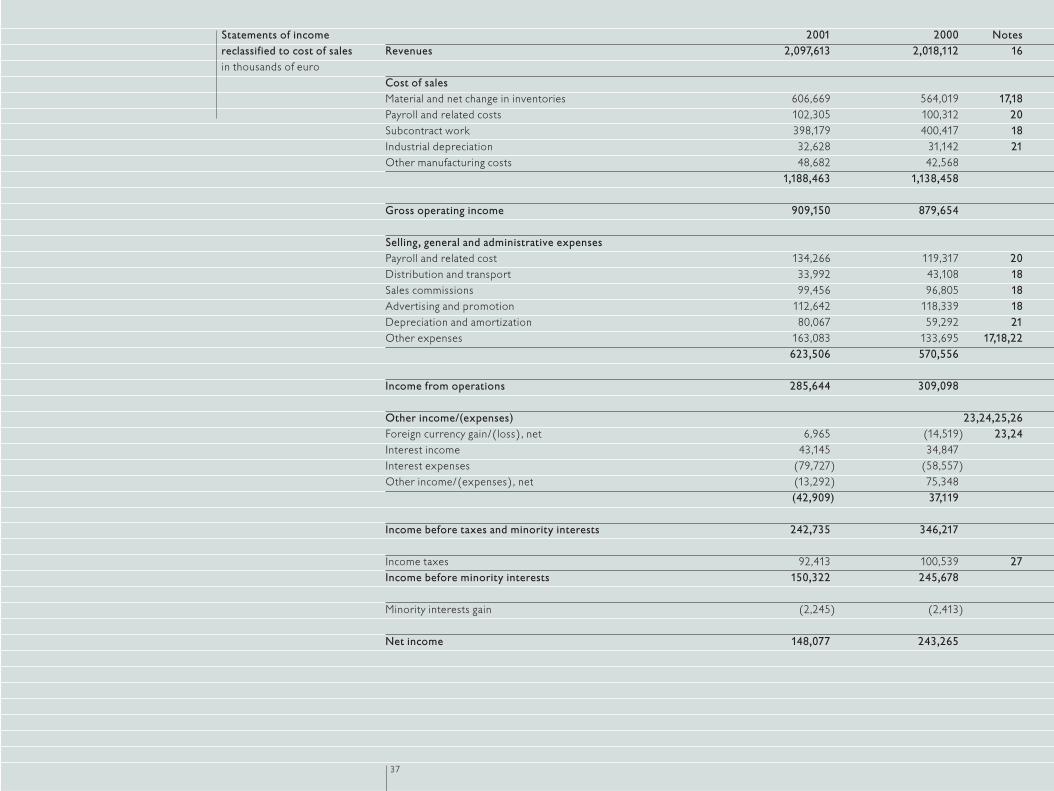
2001 2000 NotesRevenues 2,097,613 2,018,112 16
Cost of salesMaterial and net change in inventories 606,669 564,019 17,18Payroll and related costs 102,305 100,312 20Subcontract work 398,179 400,417 18Industrial depreciation 32,628 31,142 21Other manufacturing costs 48,682 42,568
1,188,463 1,138,458
Gross operating income 909,150 879,654
Selling, general and administrative expensesPayroll and related cost 134,266 119,317 20Distribution and transport 33,992 43,108 18Sales commissions 99,456 96,805 18Advertising and promotion 112,642 118,339 18Depreciation and amortization 80,067 59,292 21Other expenses 163,083 133,695 17,18,22
623,506 570,556
Income from operations 285,644 309,098
Other income/(expenses) 23,24,25,26Foreign currency gain/(loss), net 6,965 (14,519) 23,24Interest income 43,145 34,847Interest expenses (79,727) (58,557)Other income/(expenses), net (13,292) 75,348
(42,909) 37,119
Income before taxes and minority interests 242,735 346,217
Income taxes 92,413 100,539 27Income before minority interests 150,322 245,678
Minority interests gain (2,245) (2,413)
Net income 148,077 243,265
Statements of incomereclassified to cost of salesin thousands of euro
38
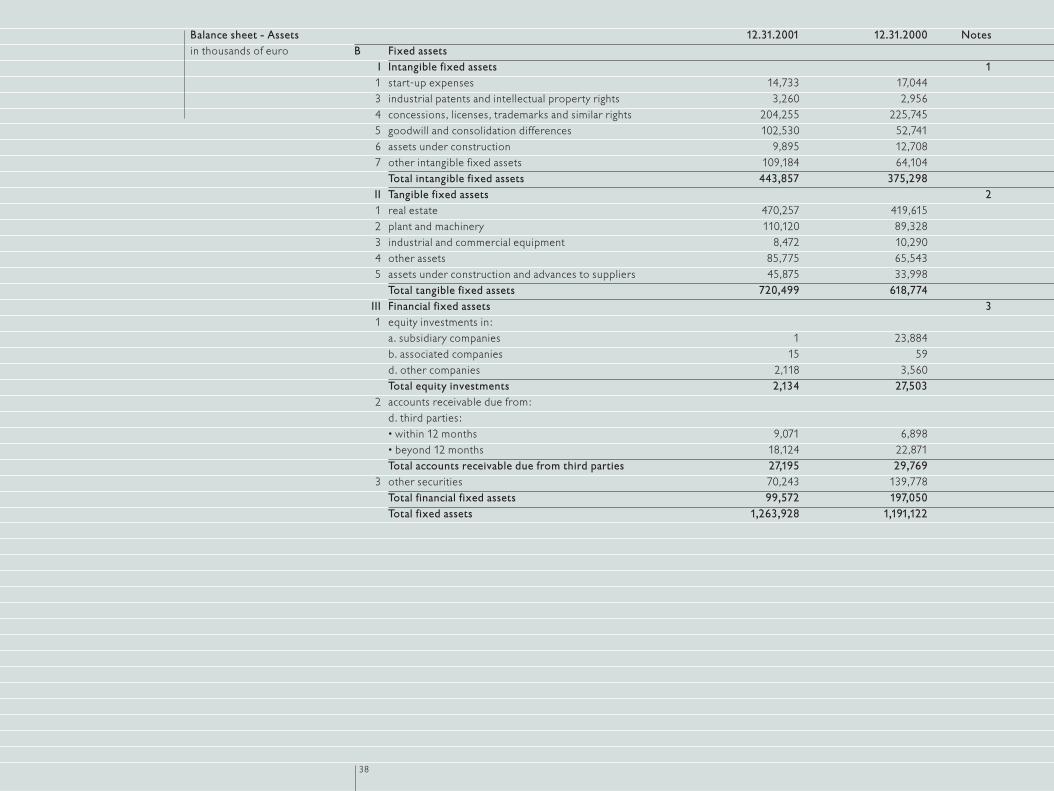
12.31.2001 12.31.2000 NotesB Fixed assets
I Intangible fixed assets 11 start-up expenses 14,733 17,0443 industrial patents and intellectual property rights 3,260 2,9564 concessions, licenses, trademarks and similar rights 204,255 225,7455 goodwill and consolidation differences 102,530 52,7416 assets under construction 9,895 12,7087 other intangible fixed assets 109,184 64,104
Total intangible fixed assets 443,857 375,298II Tangible fixed assets 21 real estate 470,257 419,6152 plant and machinery 110,120 89,3283 industrial and commercial equipment 8,472 10,2904 other assets 85,775 65,5435 assets under construction and advances to suppliers 45,875 33,998
Total tangible fixed assets 720,499 618,774III Financial fixed assets 31 equity investments in:
a. subsidiary companies 1 23,884b. associated companies 15 59d. other companies 2,118 3,560Total equity investments 2,134 27,503
2 accounts receivable due from:d. third parties:• within 12 months 9,071 6,898• beyond 12 months 18,124 22,871Total accounts receivable due from third parties 27,195 29,769
3 other securities 70,243 139,778Total financial fixed assets 99,572 197,050Total fixed assets 1,263,928 1,191,122
Balance sheet - Assetsin thousands of euro
39
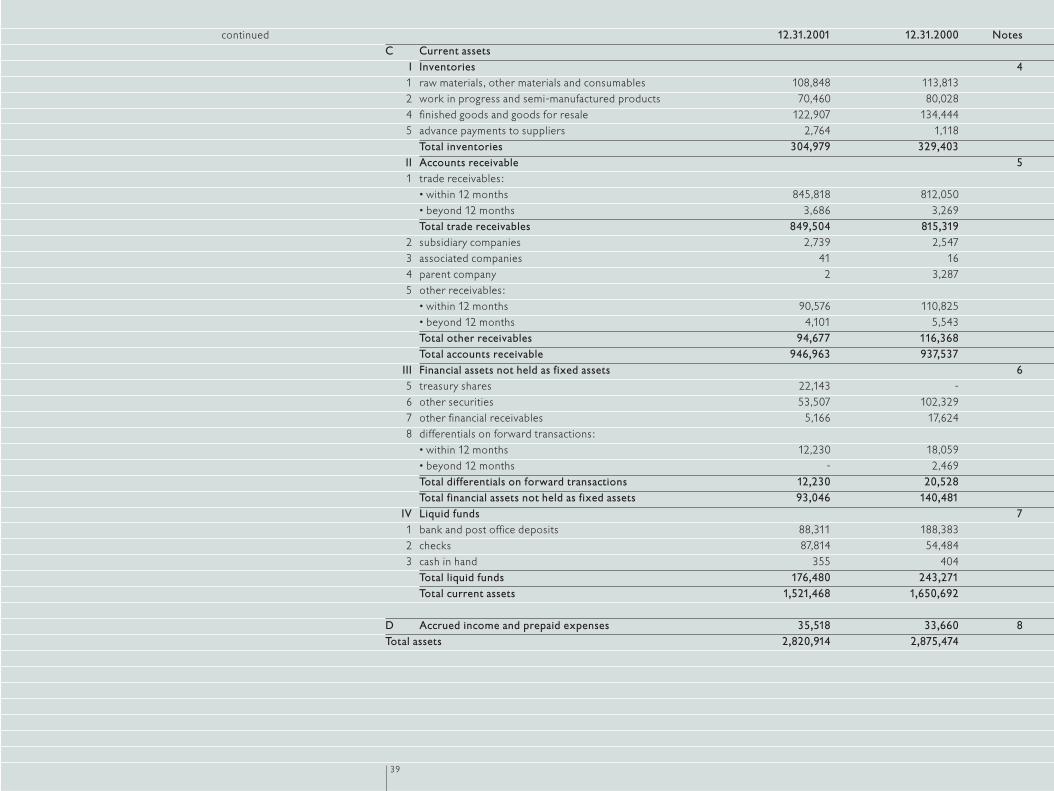
12.31.2001 12.31.2000 NotesC Current assets
I Inventories 41 raw materials, other materials and consumables 108,848 113,8132 work in progress and semi-manufactured products 70,460 80,0284 finished goods and goods for resale 122,907 134,4445 advance payments to suppliers 2,764 1,118
Total inventories 304,979 329,403II Accounts receivable 51 trade receivables:
• within 12 months 845,818 812,050• beyond 12 months 3,686 3,269Total trade receivables 849,504 815,319
2 subsidiary companies 2,739 2,5473 associated companies 41 164 parent company 2 3,2875 other receivables:
• within 12 months 90,576 110,825• beyond 12 months 4,101 5,543Total other receivables 94,677 116,368Total accounts receivable 946,963 937,537
III Financial assets not held as fixed assets 65 treasury shares 22,143 -6 other securities 53,507 102,3297 other financial receivables 5,166 17,6248 differentials on forward transactions:
• within 12 months 12,230 18,059• beyond 12 months - 2,469Total differentials on forward transactions 12,230 20,528Total financial assets not held as fixed assets 93,046 140,481
IV Liquid funds 71 bank and post office deposits 88,311 188,3832 checks 87,814 54,4843 cash in hand 355 404
Total liquid funds 176,480 243,271Total current assets 1,521,468 1,650,692
D Accrued income and prepaid expenses 35,518 33,660 8Total assets 2,820,914 2,875,474
continued
40
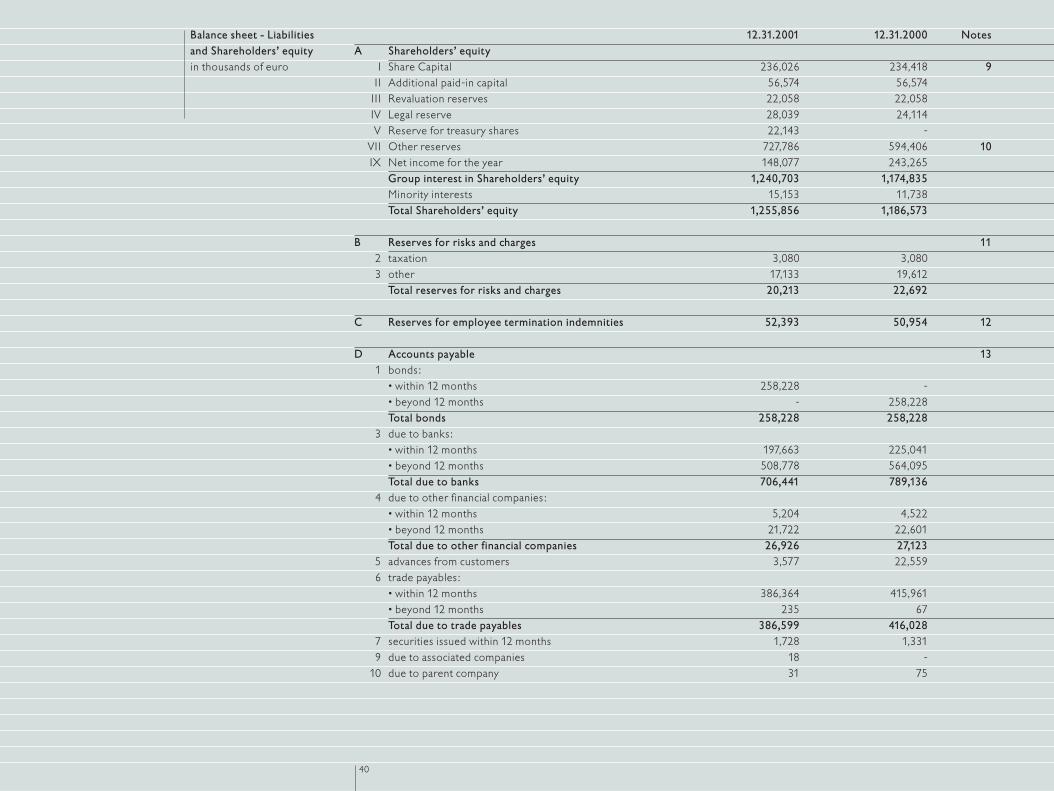
12.31.2001 12.31.2000 NotesA Shareholders’ equity
I Share Capital 236,026 234,418 9I I Additional paid-in capital 56,574 56,574
III Revaluation reserves 22,058 22,058IV Legal reserve 28,039 24,114V Reserve for treasury shares 22,143 -
VII Other reserves 727,786 594,406 10IX Net income for the year 148,077 243,265
Group interest in Shareholders’ equity 1,240,703 1,174,835Minority interests 15,153 11,738Total Shareholders’ equity 1,255,856 1,186,573
B Reserves for risks and charges 112 taxation 3,080 3,0803 other 17,133 19,612
Total reserves for risks and charges 20,213 22,692
C Reserves for employee termination indemnities 52,393 50,954 12
D Accounts payable 131 bonds:
• within 12 months 258,228 -• beyond 12 months - 258,228Total bonds 258,228 258,228
3 due to banks:• within 12 months 197,663 225,041• beyond 12 months 508,778 564,095Total due to banks 706,441 789,136
4 due to other financial companies:• within 12 months 5,204 4,522• beyond 12 months 21,722 22,601Total due to other financial companies 26,926 27,123
5 advances from customers 3,577 22,5596 trade payables:
• within 12 months 386,364 415,961• beyond 12 months 235 67Total due to trade payables 386,599 416,028
7 securities issued within 12 months 1,728 1,3319 due to associated companies 18 -
10 due to parent company 31 75
Balance sheet - Liabilities and Shareholders’ equity in thousands of euro
41
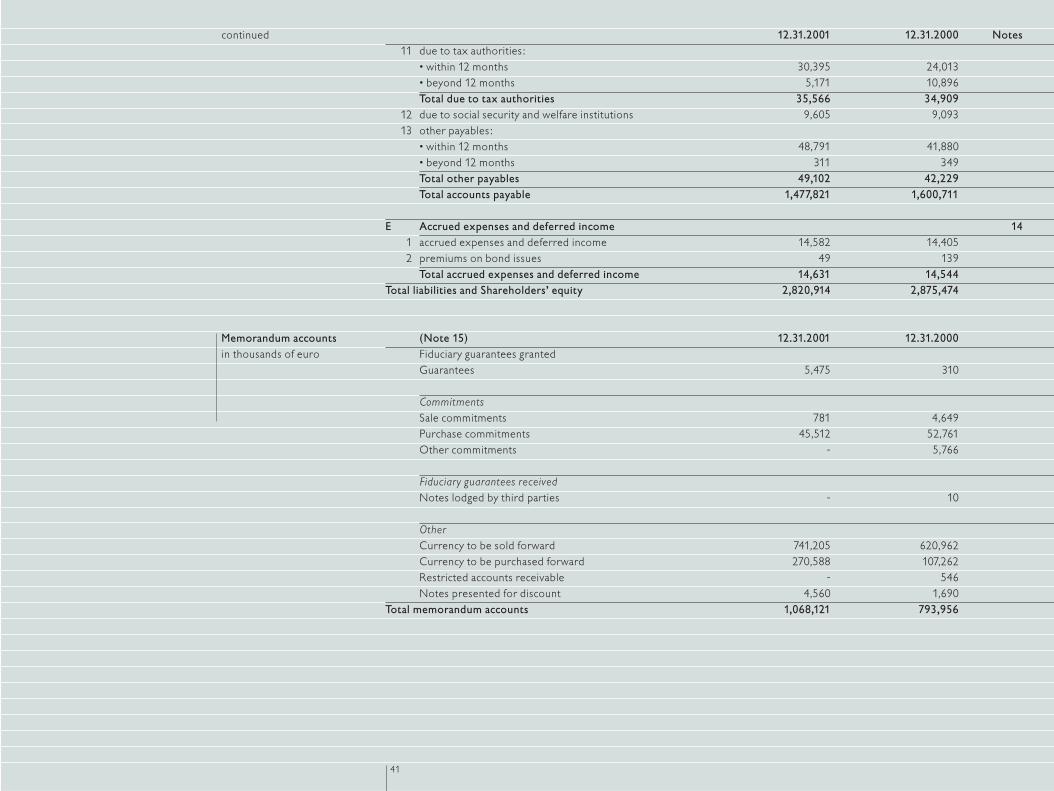
12.31.2001 12.31.2000 Notes11 due to tax authorities:
• within 12 months 30,395 24,013• beyond 12 months 5,171 10,896Total due to tax authorities 35,566 34,909
12 due to social security and welfare institutions 9,605 9,09313 other payables:
• within 12 months 48,791 41,880• beyond 12 months 311 349Total other payables 49,102 42,229Total accounts payable 1,477,821 1,600,711
E Accrued expenses and deferred income 141 accrued expenses and deferred income 14,582 14,4052 premiums on bond issues 49 139
Total accrued expenses and deferred income 14,631 14,544Total liabilities and Shareholders’ equity 2,820,914 2,875,474
(Note 15) 12.31.2001 12.31.2000Fiduciary guarantees grantedGuarantees 5,475 310
CommitmentsSale commitments 781 4,649Purchase commitments 45,512 52,761Other commitments - 5,766
Fiduciary guarantees receivedNotes lodged by third parties - 10
OtherCurrency to be sold forward 741,205 620,962Currency to be purchased forward 270,588 107,262Restricted accounts receivable - 546Notes presented for discount 4,560 1,690
Total memorandum accounts 1,068,121 793,956
continued
Memorandum accounts in thousands of euro
42
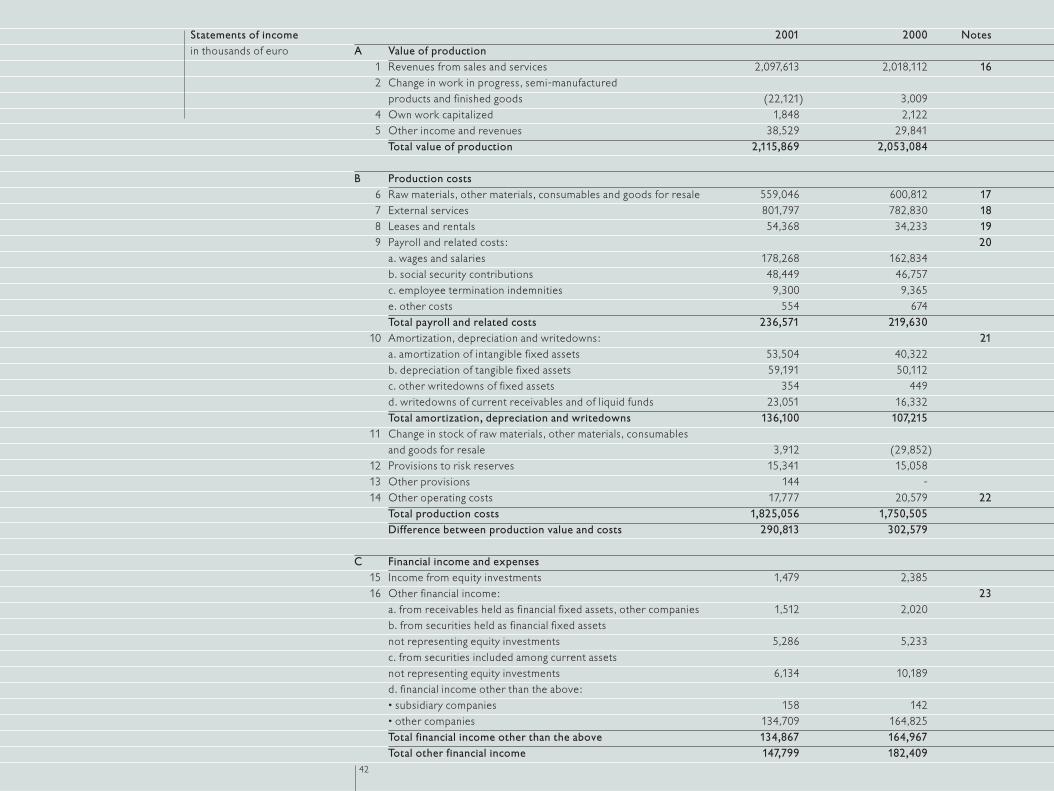
2001 2000 NotesA Value of production
1 Revenues from sales and services 2,097,613 2,018,112 162 Change in work in progress, semi-manufactured
products and finished goods (22,121) 3,0094 Own work capitalized 1,848 2,1225 Other income and revenues 38,529 29,841
Total value of production 2,115,869 2,053,084
B Production costs6 Raw materials, other materials, consumables and goods for resale 559,046 600,812 177 External services 801,797 782,830 188 Leases and rentals 54,368 34,233 199 Payroll and related costs: 20
a. wages and salaries 178,268 162,834b. social security contributions 48,449 46,757c. employee termination indemnities 9,300 9,365e. other costs 554 674Total payroll and related costs 236,571 219,630
10 Amortization, depreciation and writedowns: 21a. amortization of intangible fixed assets 53,504 40,322b. depreciation of tangible fixed assets 59,191 50,112c. other writedowns of fixed assets 354 449d. writedowns of current receivables and of liquid funds 23,051 16,332Total amortization, depreciation and writedowns 136,100 107,215
11 Change in stock of raw materials, other materials, consumables and goods for resale 3,912 (29,852)
12 Provisions to risk reserves 15,341 15,05813 Other provisions 144 -14 Other operating costs 17,777 20,579 22
Total production costs 1,825,056 1,750,505Difference between production value and costs 290,813 302,579
C Financial income and expenses15 Income from equity investments 1,479 2,38516 Other financial income: 23
a. from receivables held as financial fixed assets, other companies 1,512 2,020b. from securities held as financial fixed assets not representing equity investments 5,286 5,233c. from securities included among current assets not representing equity investments 6,134 10,189d. financial income other than the above:• subsidiary companies 158 142• other companies 134,709 164,825Total financial income other than the above 134,867 164,967Total other financial income 147,799 182,409
Statements of income in thousands of euro

43
2001 2000 Notes17 Interest and other financial expenses: 24
• parent company - 397• other companies 180,759 224,215Total interest and other financial expenses 180,759 224,612Total financial income and expenses (31,481) (39,818)
D Changes in value of financial assets18 Revaluations:
a. of equity investments - 15c. of securities included among current assets not representing equity investments 65 277Total revaluations 65 292
19 Writedowns:a. of equity investments 260 69b. of financial fixed assets not representing equity investments 1 276c. of securities included among current assets not representing equity investments 1,684 2,602Total writedowns 1,945 2,947Total changes in value of financial assets (1,880) (2,655)
E Extraordinary income and expenses20 Income: 25
• gains on disposals 3,648 122,427• other 22,273 14,182Total income 25,921 136,609
21 Expenses: 26• losses on disposals 1,856 2,454• taxes relating to prior years 192 1,054• other 38,590 46,990Total expenses 40,638 50,498Total extraordinary income and expenses (14,717) 86,111
Results before income taxes 242,735 346,217
22 Income taxes 92,413 100,539 27Income before minority interests 150,322 245,678
Income attributable to minority interests (2,245) (2,413)26 Net income for the year 148,077 243,265
continued
44
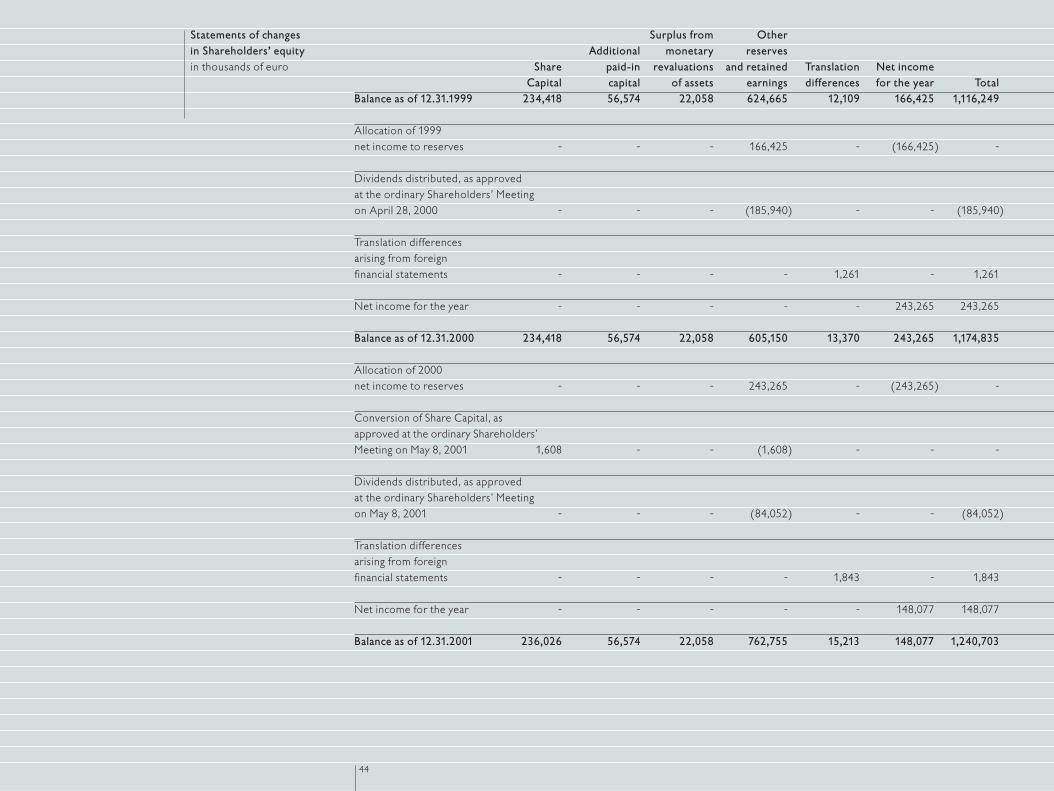
Surplus from OtherAdditional monetary reserves
Share paid-in revaluations and retained Translation Net incomeCapital capital of assets earnings differences for the year Total
Balance as of 12.31.1999 234,418 56,574 22,058 624,665 12,109 166,425 1,116,249
Allocation of 1999net income to reserves - - - 166,425 - (166,425) -
Dividends distributed, as approved at the ordinary Shareholders’ Meeting on April 28, 2000 - - - (185,940) - - (185,940)
Translation differences arising from foreign financial statements - - - - 1,261 - 1,261
Net income for the year - - - - - 243,265 243,265
Balance as of 12.31.2000 234,418 56,574 22,058 605,150 13,370 243,265 1,174,835
Allocation of 2000net income to reserves - - - 243,265 - (243,265) -
Conversion of Share Capital, asapproved at the ordinary Shareholders’Meeting on May 8, 2001 1,608 - - (1,608) - - -
Dividends distributed, as approved at the ordinary Shareholders’ Meeting on May 8, 2001 - - - (84,052) - - (84,052)
Translation differences arising from foreign financial statements - - - - 1,843 - 1,843
Net income for the year - - - - - 148,077 148,077
Balance as of 12.31.2001 236,026 56,574 22,058 762,755 15,213 148,077 1,240,703
Statements of changes in Shareholders’ equity in thousands of euro
45
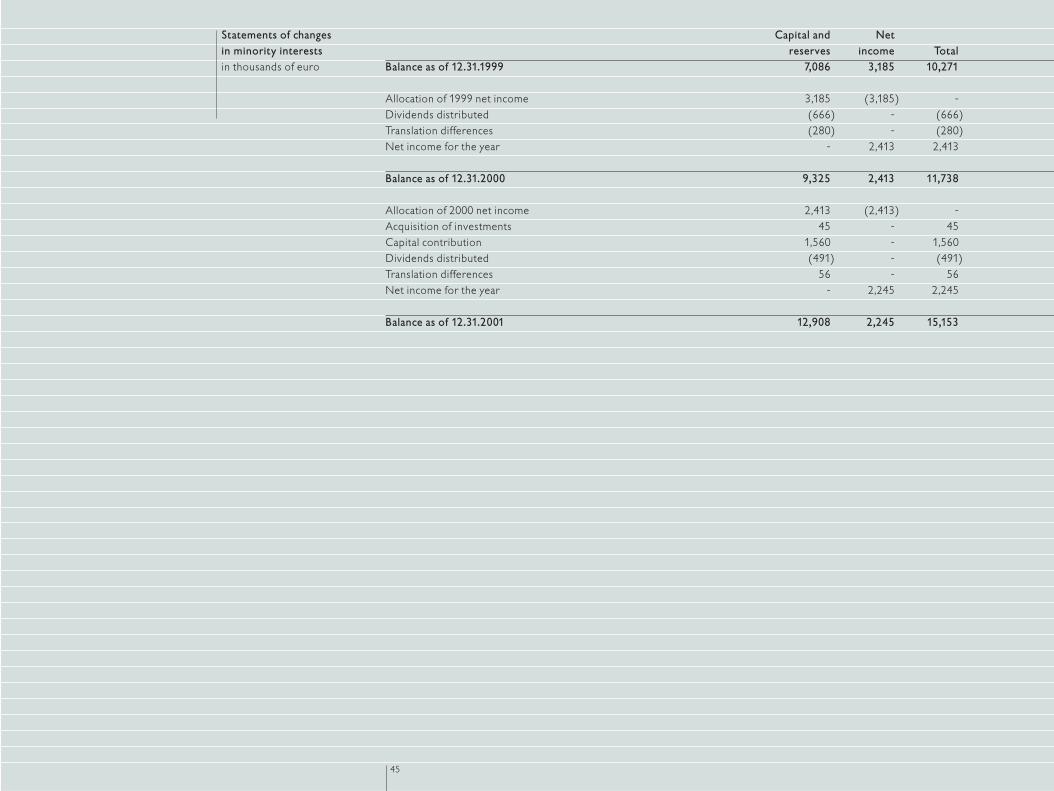
Capital and Netreserves income Total
Balance as of 12.31.1999 7,086 3,185 10,271
Allocation of 1999 net income 3,185 (3,185) -Dividends distributed (666) - (666)Translation differences (280) - (280)Net income for the year - 2,413 2,413
Balance as of 12.31.2000 9,325 2,413 11,738
Allocation of 2000 net income 2,413 (2,413) -Acquisition of investments 45 - 45Capital contribution 1,560 - 1,560Dividends distributed (491) - (491)Translation differences 56 - 56Net income for the year - 2,245 2,245
Balance as of 12.31.2001 12,908 2,245 15,153
Statements of changes in minority interests in thousands of euro
46
2001 2000Cash flow from operating activitiesIncome before minority interests 150,322 245,678Depreciation and amortization 112,695 90,435Amortization of deferred charges on long-term loans 603 460Provision for doubtful accounts and other non-monetary charges 48,015 36,650Provision/(Utilization) of exchange fluctuations reserve, net - (2,998)Provision for income taxes 92,413 100,539Losses/(Gains) on disposal of assets, investments, net (5,136) (113,409)Payment of termination indemnities and use of other reserves (24,601) (46,274)Self-financing 374,311 311,081
Payment of taxes (89,211) (161,710)
Change in accounts receivable (64,367) (58,204)Change in other operating receivables 26,813 (24,938)Change in inventories 24,453 (33,760)Change in accounts payable (28,745) 47,893Change in other operating payables and accruals (26,176) 9,846Change in working capital (68,022) (59,163)
Net cash flow from operating activities 217,078 90,208
Cash flow from investing activitiesPurchase of new subsidiaries (45) (6,828)Purchase of tangible fixed assets (182,533) (207,270)Investment in intangible fixed assets (128,790) (98,125)Sales of tangible fixed assets 24,543 35,559Disposal of intangible fixed assets 2,974 548Net change in investment-related receivables and payables 7,090 11,166Net cash flow from investing activities (276,761) (264,950)
Cash flow from other investing activitiesPurchase of equity investments (1) (3)Sale of investments 27,253 124,633(Increase)/Decrease in guarantee deposits and treasury shares 2,311 (4,489)Net cash used in other investing activities 29,563 120,141
Payment of dividends (84,544) (186,607)Net financing requirement (114,664) (241,208)
Statements of cash flowin thousands of euro
47
2001 2000Cash flow from financing activitiesChange in Shareholders’ equity 1,560 -Change in short-term borrowing (40,109) (100,343)Proceeds from issuance of long-term debt 2,205 601,732Repayment of long-term debt (9,570) (245,001)Change in securities held as fixed assets 70,117 -Increase in other financial assets (5,772) (8,496)Decrease in other financial assets 5,026 3,675Change in lease financing (242) 19,250
23,215 270,817
Change of liquidity 93,107 (25,948)Effect of translation adjustments (1,658) (3,661)Net cash provided by financing activities 114,664 241,208
continued
48
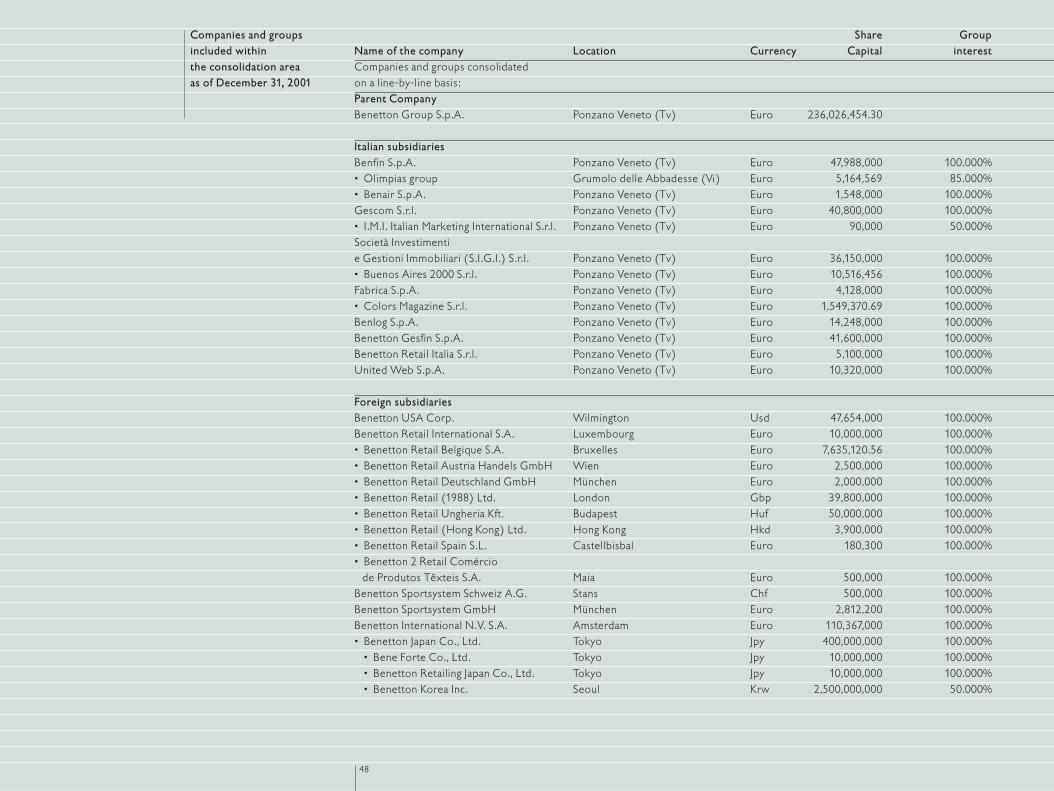
Share GroupName of the company Location Currency Capital interestCompanies and groups consolidated on a line-by-line basis:Parent CompanyBenetton Group S.p.A. Ponzano Veneto (Tv) Euro 236,026,454.30
Italian subsidiariesBenfin S.p.A. Ponzano Veneto (Tv) Euro 47,988,000 100.000%• Olimpias group Grumolo delle Abbadesse (Vi) Euro 5,164,569 85.000%• Benair S.p.A. Ponzano Veneto (Tv) Euro 1,548,000 100.000%Gescom S.r.l. Ponzano Veneto (Tv) Euro 40,800,000 100.000%• I.M.I. Italian Marketing International S.r.l. Ponzano Veneto (Tv) Euro 90,000 50.000%Società Investimenti e Gestioni Immobiliari (S.I.G.I.) S.r.l. Ponzano Veneto (Tv) Euro 36,150,000 100.000%• Buenos Aires 2000 S.r.l. Ponzano Veneto (Tv) Euro 10,516,456 100.000%Fabrica S.p.A. Ponzano Veneto (Tv) Euro 4,128,000 100.000%• Colors Magazine S.r.l. Ponzano Veneto (Tv) Euro 1,549,370.69 100.000%Benlog S.p.A. Ponzano Veneto (Tv) Euro 14,248,000 100.000%Benetton Gesfin S.p.A. Ponzano Veneto (Tv) Euro 41,600,000 100.000%Benetton Retail Italia S.r.l. Ponzano Veneto (Tv) Euro 5,100,000 100.000%United Web S.p.A. Ponzano Veneto (Tv) Euro 10,320,000 100.000%
Foreign subsidiariesBenetton USA Corp. Wilmington Usd 47,654,000 100.000%Benetton Retail International S.A. Luxembourg Euro 10,000,000 100.000%• Benetton Retail Belgique S.A. Bruxelles Euro 7,635,120.56 100.000%• Benetton Retail Austria Handels GmbH Wien Euro 2,500,000 100.000%• Benetton Retail Deutschland GmbH München Euro 2,000,000 100.000%• Benetton Retail (1988) Ltd. London Gbp 39,800,000 100.000%• Benetton Retail Ungheria Kft. Budapest Huf 50,000,000 100.000%• Benetton Retail (Hong Kong) Ltd. Hong Kong Hkd 3,900,000 100.000%• Benetton Retail Spain S.L. Castellbisbal Euro 180,300 100.000%• Benetton 2 Retail Comércio
de Produtos Têxteis S.A. Maia Euro 500,000 100.000%Benetton Sportsystem Schweiz A.G. Stans Chf 500,000 100.000%Benetton Sportsystem GmbH München Euro 2,812,200 100.000%Benetton International N.V. S.A. Amsterdam Euro 110,367,000 100.000%• Benetton Japan Co., Ltd. Tokyo Jpy 400,000,000 100.000%
• Bene Forte Co., Ltd. Tokyo Jpy 10,000,000 100.000%• Benetton Retailing Japan Co., Ltd. Tokyo Jpy 10,000,000 100.000%• Benetton Korea Inc. Seoul Krw 2,500,000,000 50.000%
Companies and groupsincluded within the consolidation area as of December 31, 2001
49
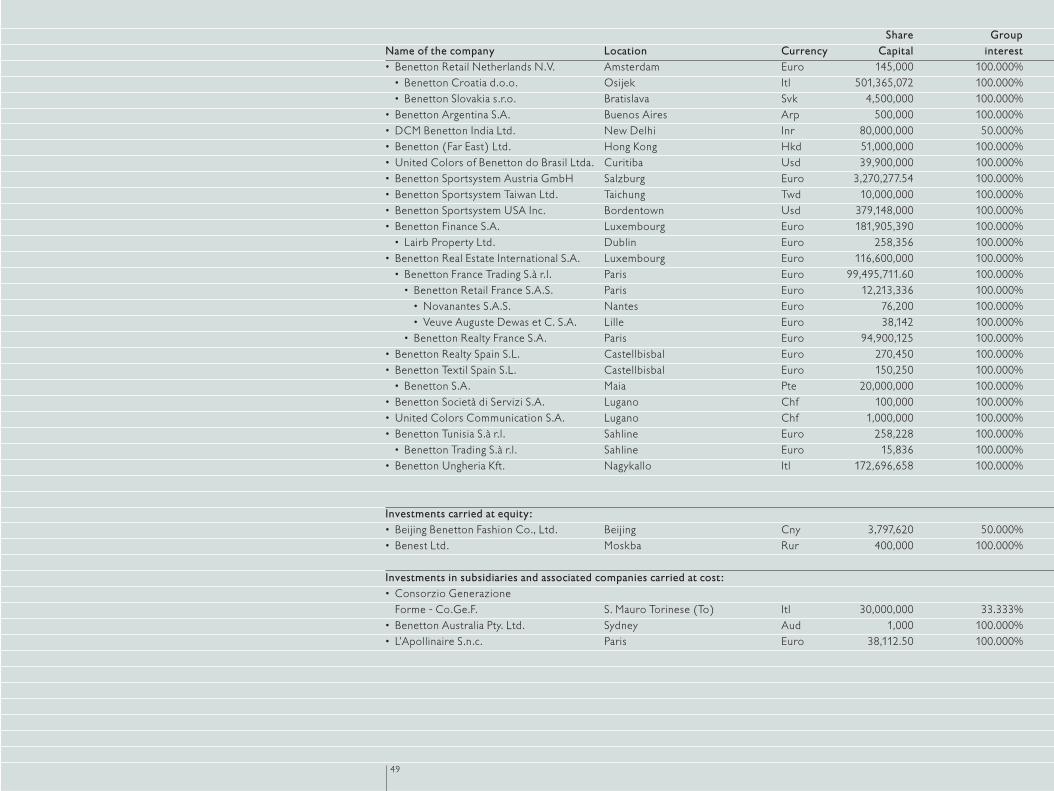
Share GroupName of the company Location Currency Capital interest• Benetton Retail Netherlands N.V. Amsterdam Euro 145,000 100.000%
• Benetton Croatia d.o.o. Osijek Itl 501,365,072 100.000%• Benetton Slovakia s.r.o. Bratislava Svk 4,500,000 100.000%
• Benetton Argentina S.A. Buenos Aires Arp 500,000 100.000%• DCM Benetton India Ltd. New Delhi Inr 80,000,000 50.000%• Benetton (Far East) Ltd. Hong Kong Hkd 51,000,000 100.000%• United Colors of Benetton do Brasil Ltda. Curitiba Usd 39,900,000 100.000%• Benetton Sportsystem Austria GmbH Salzburg Euro 3,270,277.54 100.000%• Benetton Sportsystem Taiwan Ltd. Taichung Twd 10,000,000 100.000%• Benetton Sportsystem USA Inc. Bordentown Usd 379,148,000 100.000%• Benetton Finance S.A. Luxembourg Euro 181,905,390 100.000%
• Lairb Property Ltd. Dublin Euro 258,356 100.000%• Benetton Real Estate International S.A. Luxembourg Euro 116,600,000 100.000%
• Benetton France Trading S.à r.l. Paris Euro 99,495,711.60 100.000%• Benetton Retail France S.A.S. Paris Euro 12,213,336 100.000%
• Novanantes S.A.S. Nantes Euro 76,200 100.000%• Veuve Auguste Dewas et C. S.A. Lille Euro 38,142 100.000%
• Benetton Realty France S.A. Paris Euro 94,900,125 100.000%• Benetton Realty Spain S.L. Castellbisbal Euro 270,450 100.000%• Benetton Textil Spain S.L. Castellbisbal Euro 150,250 100.000%
• Benetton S.A. Maia Pte 20,000,000 100.000%• Benetton Società di Servizi S.A. Lugano Chf 100,000 100.000%• United Colors Communication S.A. Lugano Chf 1,000,000 100.000%• Benetton Tunisia S.à r.l. Sahline Euro 258,228 100.000%
• Benetton Trading S.à r.l. Sahline Euro 15,836 100.000%• Benetton Ungheria Kft. Nagykallo Itl 172,696,658 100.000%
Investments carried at equity:• Beijing Benetton Fashion Co., Ltd. Beijing Cny 3,797,620 50.000%• Benest Ltd. Moskba Rur 400,000 100.000%
Investments in subsidiaries and associated companies carried at cost:• Consorzio Generazione
Forme - Co.Ge.F. S. Mauro Torinese (To) Itl 30,000,000 33.333%• Benetton Australia Pty. Ltd. Sydney Aud 1,000 100.000%• L’Apollinaire S.n.c. Paris Euro 38,112.50 100.000%
50
The consolidated financial statements have been prepared in conformity with chapter I I I of Legislative Decree no. 127 of April 9, 1991,which implements the EC VII Directive in Italy.
The notes to the consolidated financial statements explain, analyze and, in some cases, supplement the data reported on the face of the financial statements and include information required by article 38 and other provisions of Decree no. 127/1991. Additional information is also provided in order to present a true and fair view of the financial and operating position of the Group,even where this is not required by specific legislation.
Unless otherwise specified, amounts indicated in these notes are expressed in thousands of euro.
Activities of the GroupBenetton Group S.p.A., the Parent Company, and its subsidiary companies (collectively the “Group”) primarily manufacture andmarket fashion apparel in wool, cotton and woven fabrics, as well as sports equipment, sportswear and casual wear. The manufacture offinished articles from raw materials is primarily undertaken in Italy, partly within the Group and partly using subcontractors, whereasmarketing is carried out through an extensive sales network both in Italy and abroad. This network consists of sales representatives andspecialty stores that are almost exclusively independently owned.
Form and content of the consolidated financial statementsThe consolidated financial statements of the Group include the financial statements as of December 31, 2001 of Benetton Group S.p.A.,the Parent Company, and all the Italian and foreign companies in which the Parent Company holds, directly or indirectly, the majority of the voting rights. They also include the accounts of some 50%-owned companies over which the Group exercises adominant influence.
The companies included within the scope of consolidation are listed in an appendix.Financial statements utilized for the consolidation are those prepared for approval at the Shareholders’ meetings.
Financial statements of foreign subsidiaries have been reclassified, where necessary, for consistency with the format adopted by theParent Company. Such financial statements have been adjusted so that they are consistent with the accounting policies referred to below.
A reconciliation between Shareholders’ equity and net income as reported in the statutory financial statements of the Parent Company, Benetton Group S.p.A., and the consolidated Shareholders’ equity and net income of the Group is presented in the note on Shareholders’ equity.
Notes to the consolidatedfinancial statements
51
Principles of consolidationThe most significant consolidation principles adopted for the preparation of the consolidated financial statements are as follows:
a. The assets and liabilities of subsidiary companies are consolidated on a line-by-line basis and the carrying value of investments held by the Parent Company and other consolidated subsidiaries is eliminated against the related Shareholders’ equity accounts.
b. When a company is consolidated for the first time, any positive difference emerging from the elimination of its carrying value on thebasis indicated in a) above, is allocated, where applicable, to the assets of the subsidiary. Any excess arising upon consolidation isaccounted for as a consolidation adjustment and is classified as “Goodwill and consolidation differences.”Negative differences are classified within the “Reserve for risks and charges arising on consolidation” if they reflect estimated futurelosses; otherwise, they are classified as part of the “Consolidation reserve” within Shareholders’ equity.Goodwill is amortized over its estimated useful life.
c. Intercompany receivables and payables, costs and revenues, and all significant transactions between consolidated companies, including the intragroup payment of dividends, are eliminated.Unrealized intercompany profits and gains and losses arising from transactions between Group companies are also eliminated.
d. The minority Shareholders’ interest in the net assets and results for the year of consolidated subsidiaries are classified separately as “Minority interests” in the consolidated balance sheet and as “Income attributable to minority interests” in the consolidated income statement.
e. The financial statements of foreign subsidiaries are translated into euro using year-end exchange rates for balance sheet items andaverage exchange rates for the year for income statement items.Differences arising from the translation into euro of foreign currency financial statements are reflected directly in consolidatedShareholders’ equity.
52
Accounting policiesThese have been adopted in observance of article 2426 of the Italian Civil Code, also taking account of accounting principles preparedby the Italian Accounting Profession and, in the absence thereof, those issued by the International Accounting Standards Board (I.A.S.B.).
Intangible fixed assets. These are recorded at purchase or production cost, including related charges. The value of these assets may be subject to revaluation in accordance with statutory regulations.One method for determining the value of intangible fixed assets is to allocate the excess price deriving from investments acquired orother company transactions. This type of allocation is used for excess prices paid for trademarks acquired under these types ofoperation, on the basis of an independent appraisal.Intangible fixed assets are written down in cases where, regardless of the amortization accumulated, there is a permanent loss in value. The value of such assets is reinstated in future accounting periods should the reasons for such writedowns no longer apply.Book value is systematically amortized on a straight-line basis in relation to the residual economic useful lives of such assets. The duration of amortization plans is based on the estimated economic use of these assets.Normally amortization periods for trademarks fluctuate between ten and fifteen years, while patents are amortized over three years.Goodwill and consolidation differences are amortized over ten years. Leasehold improvements costs are amortized over the duration of the lease contract. Start-up and expansion expenses and other deferred charges are mostly amortized over five years.
Tangible fixed assets. These are recorded at purchase or production cost, revalued where required or permitted by statutoryregulations. Cost includes related charges and direct or indirect expenses reasonably attributable to the individual assets. Tangiblefixed assets are written down in cases where, regardless of the depreciation accumulated, there is a permanent loss in value. The value of such assets is reinstated in future accounting periods should the reasons for such writedowns no longer apply. Ordinarymaintenance costs are fully expensed as incurred. Improvement expenditure is allocated to the related assets and depreciated over their residual useful lives.Depreciation is calculated systematically on a straight-line basis using rates considered to reflect the estimated useful lives of the assets.In the first year such assets enter into service these rates are halved in consideration of their shorter period of use.
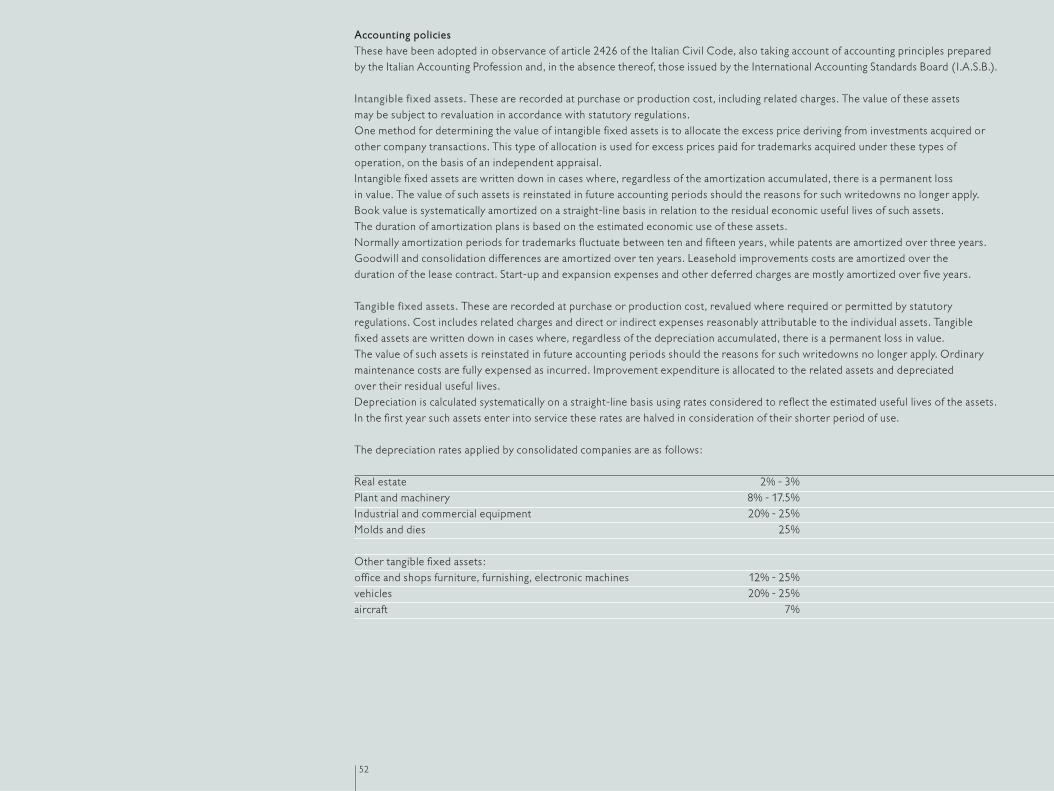
The depreciation rates applied by consolidated companies are as follows:
Real estate 2% - 3%Plant and machinery 8% - 17.5%Industrial and commercial equipment 20% - 25%Molds and dies 25%
Other tangible fixed assets:office and shops furniture, furnishing, electronic machines 12% - 25%vehicles 20% - 25%aircraft 7%
Accelerated depreciation calculated in the financial statements of Group companies is reversed and the related accumulateddeprecation is adjusted as a result.Assets acquired under finance leases are stated at their fair value at the start of the lease and the capital portion of the lease instalmentsis recorded as a liability.Such assets are depreciated over their economic useful lives on the same basis as other tangible fixed assets.
Financial fixed assets. Investments in subsidiaries not consolidated on a line-by-line basis, together with those in associated companies,are accounted for on an equity basis, eliminating the Group’s share of any unrealized intercompany profits, where significant.The difference between the cost and the net equity of investments at the time they were acquired is allocated on the basis described in paragraph b) of the consolidation principles.Equity investments of less than 20% in other companies are stated at cost, which is written down where there is a permanent loss in value. The original value of these investments is reinstated in future accounting periods should the reasons for such writedownsno longer apply.Receivables included among financial fixed assets are stated at their estimated realizable value.Other securities held as financial fixed assets are stated at cost, which is written down where there is permanent loss in value, takinginto account any accrued issue premiums and discounts.
Inventories. Inventories are stated at the lower of purchase or manufacturing cost, generally determined on a weighted average costbasis, and their market or net realizable value.Manufacturing cost includes raw materials and all direct or indirect production-related expenses.The calculation of estimated realizable value includes any manufacturing costs to be incurred and direct selling expenses. Obsolete andslow-moving inventories are written down in relation to their possibility of employment in the production process or to their netrealizable value.
Accounts receivable. These are recorded at their estimated realizable value, net of appropriate allowances for doubtful accountsdetermined on a prudent basis. Any long-term receivables that include an implicit interest component are discounted using a suitable market rate.
Other securities not held as fixed assets. Such securities are stated at the lower of purchase cost and market value. The original value of these investments is reinstated in future accounting periods should the reasons for such writedowns no longer apply.Securities acquired subject to resale commitments are recorded at cost and classified among other securities not held as fixed assets. The difference between the spot and forward prices of such securities is recognized on an accruals basis over the duration of the contract.
Accruals and deferrals. These are recorded to match costs and revenues in the accounting periods to which they relate.
Reserves for risks and charges. These reserves cover known or likely losses, the timing and amount of which cannot be determined at year-end. Reserves reflect the best estimate of losses to be incurred based on the information available.
Reserve for employee termination indemnities. This reserve represents the liability of Italian companies within the Group for indemnities payable upon termination of employment, accrued in accordance with labor laws and labor agreements in force. This liability is subject to annual revaluation using the officially-established indices.
Accounts payable. These are stated at face value. The implicit interest component which is included in long-term debt is recordedseparately using a suitable market rate.
53

Transactions in foreign currencies. Transactions in foreign currencies are recorded using the exchange rates in effect at the transactiondates. Exchange gains or losses realized during the year are included in the consolidated income statement.At the date of the financial statements, the Italian Group companies adjusted receivables and payables in foreign currency to theexchange rates ruling at the year end, booking all resulting gains and losses to the income statement. The exchange gains or losses onforward contracts opened to hedge receivables and payables are booked to the income statement; the discount or premium on these contracts is recorded on an accrual basis.The value of forward contracts, other than those hedging specific foreign currency assets and liabilities, is restated at year-end withreference to the differential between the forward exchange rates applicable to the various types of contract at the balance-sheet date and the contracted forward exchange rates. Any net results emerging are charged to the income statement.
Revenue recognition. Revenues from product sales are recognized at the time of shipment to the customer, which also represents the moment when ownership passes.
Expense recognition. Expenses are recorded in accordance with the matching principle.
Income taxes. Current income taxes are provided on the basis of a reasonable estimate of the tax liability for the year, in accordancewith applicable local regulations. The net balance between deferred tax assets and liabilities is also recorded. Deferred tax assets refer to costs and expenses not yet deductible at year-end, to consolidation adjustments and to the benefit of accumulated tax losses.Deferred tax assets are provided when it was almost certain that they can be recovered in the future.Deferred tax liabilities refer to transactions where taxation is deferred to future years, such as gains on the disposal of tangible andintangible fixed assets or consolidation adjustments arising from the reversal of accelerated depreciation or lease transactions recordedas finance leases.
Article 2423, paragraph 4, of the Italian Civil Code. Departures from statutory accounting criteria and policies according to the fourth paragraph of article 2423 of the Italian Civil Code have not occurred.
Cash flow. The statement of consolidated cash flows provides information by type of flow and activity. Cash and banks items andreadily marketable securities are treated as cash equivalents.
54

Fixed assets
Intangible fixed assets12.31.2001 12.31.2000
thousands of euro Gross Net Gross NetStart-up and expansion expenses 21,814 14,733 20,285 17,044Research and development expenses - - 7 -Industrial patents and intellectual property rights 14,214 3,260 12,811 2,956Licenses, trademarks and similar rights 371,693 204,255 368,357 225,745
Goodwill 78,971 73,918 25,026 23,733Consolidation differences 49,565 28,612 46,322 29,008Total goodwill and consolidation differences 128,536 102,530 71,348 52,741
Assets under construction and advance payments 9,895 9,895 12,708 12,708
Expenses related to bond issues and loans 3,009 918 2,956 1,464Costs for the purchase and development of software 22,781 12,742 22,052 11,725Leasehold improvements 89,302 72,897 40,681 29,279Other 31,666 22,627 26,948 21,636Total other intangible fixed assets 146,758 109,184 92,637 64,104Total 692,910 443,857 578,153 375,298
“Start-up and expansion expenses” include 13,914 thousand euro in start-up expenses for retail projects and e-commerce activities.In 1983 the original Benetton trademark was revalued in accordance with Law no. 72 of March 19, 1983. The monetary revaluation was2,288 thousand euro; at the end of 2001, the residual value of this revaluation totals 114 thousand euro.The difference emerging from the consolidation of the Benetton Sportsystem group, with respect to Shareholders’ equity at theacquisition date, was allocated to trademarks, 143,126 thousand euro, and to consolidation differences, 30,975 thousand euro, on thebasis of an independent appraisal.
Net values of trademarks are as follows:
thousands of euro 12.31.2001 12.31.2000United Colors of Benetton 1,680 1,735Sisley 243 232Nordica 50,644 55,769Rollerblade 84,715 93,695Prince 40,633 45,024Killer Loop 19,355 21,146Other 2,291 2,359Total 199,561 219,960
55
Comments on theprincipal asset items
1

The change in “Goodwill” include over 50 million euro in respect of the commercial activities acquired in major Italian cities, to be used in the development of the stores network.
“Consolidation differences” of 28,612 thousand euro reflect the residual goodwill emerging from consolidation of the companiesacquired, with 16,566 thousand euro attributable to Benetton Sportsystem S.p.A. and the remainder to other European companies.This consolidation difference is amortized over ten years, which is considered appropriate since it is consistent with the accountingpolicies currently applied in the sector where Group companies operate.
“Assets under construction and advances” involve advance payments on preliminary agreements for the purchase of trading companiesin Italy; the remainder relates to advances on the restructuring of leaseholds and to expenses for registering trademarks and patents.
“Leasehold improvements” mainly refer to the cost of restructuring and modernizing leased shops. These have increased significantlydue to the growth in the number of shops managed directly by the Group.
“Other intangible fixed assets” include the costs incurred to gain early access to premises owned by third parties, which are amortizedover the length of the rent contracts; they also include expenses in connection with the purchase of commercial activities.
Movements in the principal intangible fixed asset items during 2001 were as follows:
Licenses, Goodwill and Othertrademarks and consolidation Leasehold intangible
thousands of euro Patents similar rights differences improvements fixed assets TotalNet opening balance 2,956 225,745 52,741 29,279 64,577 375,298Change in the scope of consolidation - - 728 45 1 774Additions 941 2,103 56,373 50,580 18,007 128,004Disposals (10) (804) (1,961) (979) (160) (3,914)Amortization (1,237) (23,536) (8,394) (6,720) (14,220) (54,107)Translation differences and other movements 610 747 3,043 692 (7,290) (2,198)Net closing balance 3,260 204,255 102,530 72,897 60,915 443,857
Tangible fixed assetsTangible fixed assets are stated net of accumulated depreciation of 404,066 thousand euro. Additions made during 2001 mainly concern the following items:
• Land and buildings, 61,023 thousand euro, of which 52 thousand euro relating to the purchase, modernization and upgrading of buildings to be used for retail activities in the main European cities.
• Plant, machinery and equipment, 44,587 thousand euro to upgrade the technology of the manufacturing and logistics facilities; these investments mainly concerned Italian Group companies and consist of new plant and machinery for cotton spinning and production and finishing of fabrics.
• Furniture, furnishings, electronic machines, transport vehicles and fittings for shops, 34,816 thousand euro, mainly for the directly-managed megastores.
The depreciation charge for the period was 59,191 thousand euro.
56
2
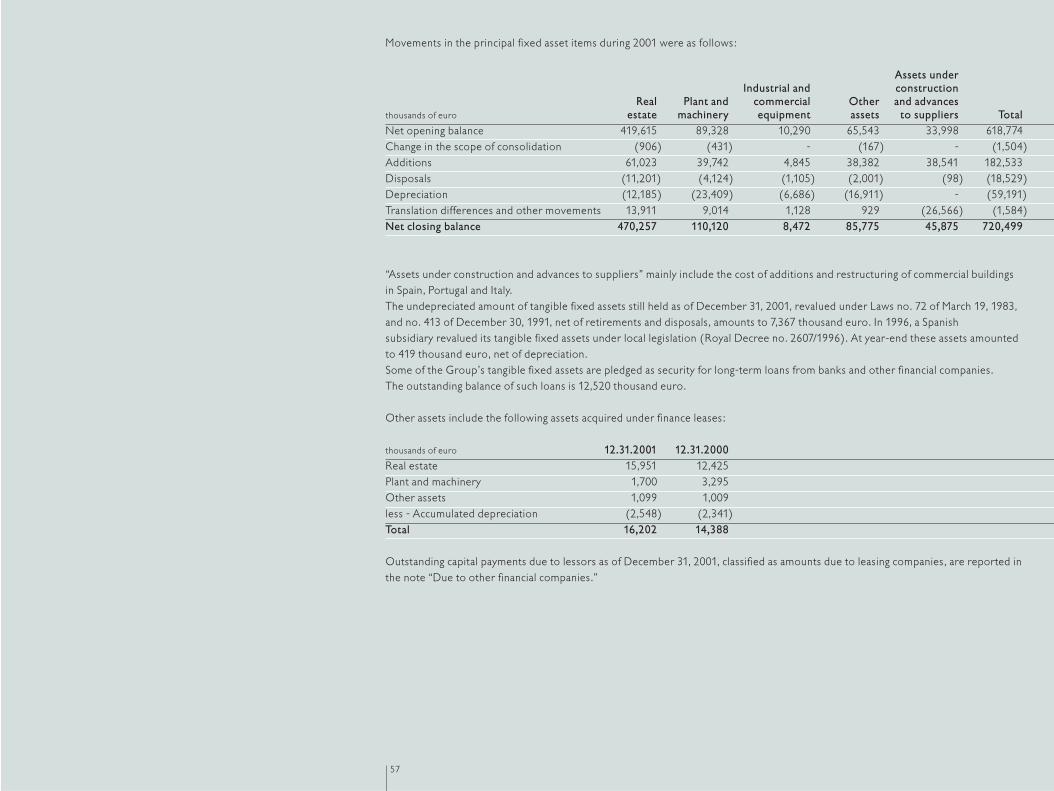
57
Movements in the principal fixed asset items during 2001 were as follows:
Assets underIndustrial and construction
Real Plant and commercial Other and advancesthousands of euro estate machinery equipment assets to suppliers TotalNet opening balance 419,615 89,328 10,290 65,543 33,998 618,774Change in the scope of consolidation (906) (431) - (167) - (1,504)Additions 61,023 39,742 4,845 38,382 38,541 182,533Disposals (11,201) (4,124) (1,105) (2,001) (98) (18,529)Depreciation (12,185) (23,409) (6,686) (16,911) - (59,191)Translation differences and other movements 13,911 9,014 1,128 929 (26,566) (1,584)Net closing balance 470,257 110,120 8,472 85,775 45,875 720,499
“Assets under construction and advances to suppliers” mainly include the cost of additions and restructuring of commercial buildings in Spain, Portugal and Italy.The undepreciated amount of tangible fixed assets still held as of December 31, 2001, revalued under Laws no. 72 of March 19, 1983,and no. 413 of December 30, 1991, net of retirements and disposals, amounts to 7,367 thousand euro. In 1996, a Spanish subsidiary revalued its tangible fixed assets under local legislation (Royal Decree no. 2607/1996). At year-end these assets amountedto 419 thousand euro, net of depreciation.Some of the Group’s tangible fixed assets are pledged as security for long-term loans from banks and other financial companies. The outstanding balance of such loans is 12,520 thousand euro.
Other assets include the following assets acquired under finance leases:
thousands of euro 12.31.2001 12.31.2000Real estate 15,951 12,425Plant and machinery 1,700 3,295Other assets 1,099 1,009less - Accumulated depreciation (2,548) (2,341)Total 16,202 14,388
Outstanding capital payments due to lessors as of December 31, 2001, classified as amounts due to leasing companies, are reported inthe note “Due to other financial companies.”
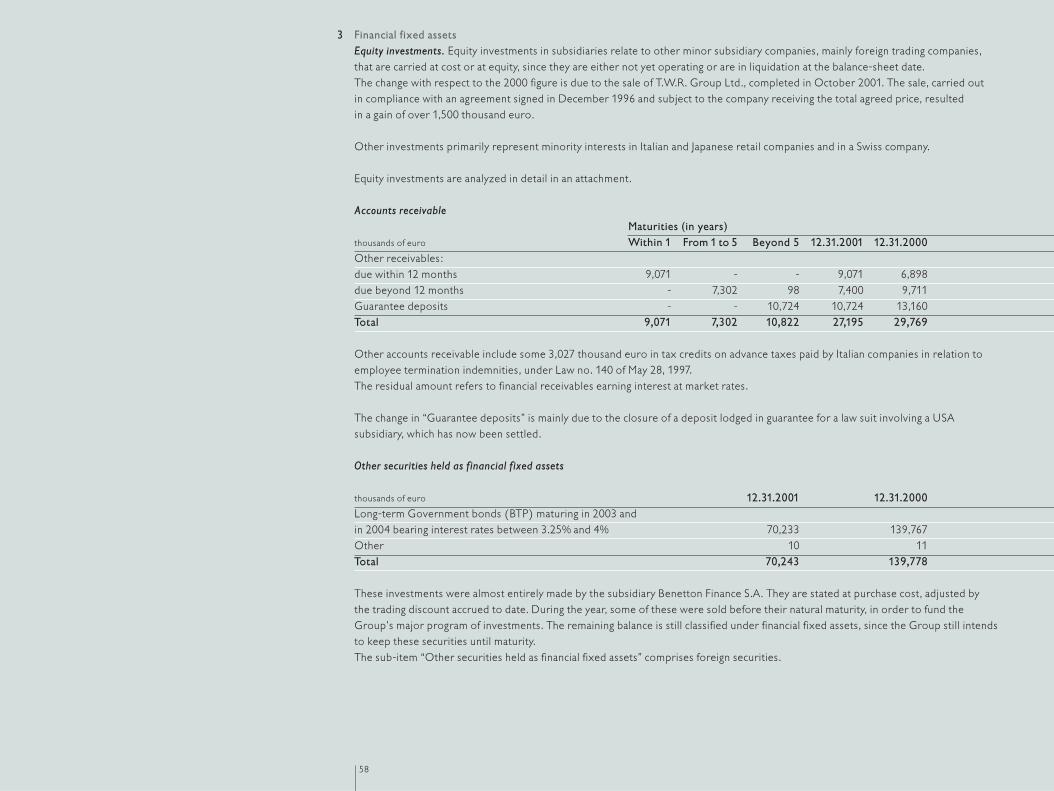
58
3 Financial fixed assetsEquity investments. Equity investments in subsidiaries relate to other minor subsidiary companies, mainly foreign trading companies,that are carried at cost or at equity, since they are either not yet operating or are in liquidation at the balance-sheet date.The change with respect to the 2000 figure is due to the sale of T.W.R. Group Ltd., completed in October 2001. The sale, carried out in compliance with an agreement signed in December 1996 and subject to the company receiving the total agreed price, resulted in a gain of over 1,500 thousand euro.
Other investments primarily represent minority interests in Italian and Japanese retail companies and in a Swiss company.
Equity investments are analyzed in detail in an attachment.
Accounts receivableMaturities (in years)
thousands of euro Within 1 From 1 to 5 Beyond 5 12.31.2001 12.31.2000Other receivables:due within 12 months 9,071 - - 9,071 6,898due beyond 12 months - 7,302 98 7,400 9,711Guarantee deposits - - 10,724 10,724 13,160Total 9,071 7,302 10,822 27,195 29,769
Other accounts receivable include some 3,027 thousand euro in tax credits on advance taxes paid by Italian companies in relation toemployee termination indemnities, under Law no. 140 of May 28, 1997. The residual amount refers to financial receivables earning interest at market rates.
The change in “Guarantee deposits” is mainly due to the closure of a deposit lodged in guarantee for a law suit involving a USAsubsidiary, which has now been settled.
Other securities held as financial fixed assets
thousands of euro 12.31.2001 12.31.2000Long-term Government bonds (BTP) maturing in 2003 andin 2004 bearing interest rates between 3.25% and 4% 70,233 139,767Other 10 11Total 70,243 139,778
These investments were almost entirely made by the subsidiary Benetton Finance S.A. They are stated at purchase cost, adjusted by the trading discount accrued to date. During the year, some of these were sold before their natural maturity, in order to fund theGroup’s major program of investments. The remaining balance is still classified under financial fixed assets, since the Group still intendsto keep these securities until maturity.The sub-item “Other securities held as financial fixed assets” comprises foreign securities.

Current assets
Inventories Inventories, 304,979 thousand euro (329,403 thousand euro as of December 31, 2000), recorded net of the related writedownreserve, consist of the following:
thousands of euro 12.31.2001 12.31.2000Raw materials, other materials and consumables 1,963 2,978Work in progress and semi-manufactured products 800 1,073Finished goods 10,423 4,611Total 13,186 8,662
The decline in inventories, mainly of the sport sector finished goods, reflects the particular attention paid by the Group to this area. The valuation of closing inventories at weighted average cost is not appreciably different from their value at current purchase cost.
Accounts receivableTrade receivables. As of December 31, 2001, trade receivables, net of the allowance for doubtful accounts, amount to 849,504 thousand euro (815,319 thousand euro as of December 31, 2000), of which 209,012 thousand euro in foreign currency. Currencyhedging transactions, valued at the year-end exchange rates, refer to accounts receivable, 125,803 thousand euro, and to orders from customers, 74,138 thousand euro.Trade receivables also include 46,287 thousand euro (90,321 thousand euro as of December 31, 2000) of bank receipts and notesdeposited with financial institutions.The allowance for doubtful accounts as of December 31, 2001 amounts to 67,326 thousand euro (62,836 thousand euro as ofDecember 31, 2000). 17,149 thousand euro of this reserve was used during the year. A prudent assessment of the specific and genericcollection risks associated with receivables outstanding at year-end has resulted in an additional provision of 23,051 thousand euro to take account of the aging of certain balances and the difficult economic conditions in a number of markets.
Due from subsidiaries, associated companies and the parent company. Accounts receivable from subsidiary companies, amounting to 2,739 thousand euro, refer to financial receivables, while those from associated companies, amounting to 41 thousand euro, andthose from the parent company, 2 thousand euro, are trade receivables.
Other receivables. Other receivables mainly include:• VAT recoverable from the tax authorities, 17,851 thousand euro (18,943 thousand euro as of December 31, 2000), of which
987 thousand euro due beyond 12 months;• tax credits, 7,837 thousand euro (9,191 thousand euro as of December 31, 2000), of which 313 thousand euro due beyond 12 months;• other amounts due from tax authorities, 36,382 thousand euro (33,201 thousand euro as of December 31, 2000), of which 409
thousand euro due beyond 12 months. The item includes 32,240 thousand euro resulting from the net balance between deferred taxassets (charges with deferred tax deductibility and carry-forward tax losses) and deferred tax liabilities (primarily the reversal ofaccelerated depreciation);
• accounts receivable from disposals, 3,878 thousand euro (3,567 thousand euro as of December 31, 2000), of which 174 thousand eurodue beyond 12 months.The remaining amount refers, among others, to advances to agents and receivables for funded projects.
59
4
5
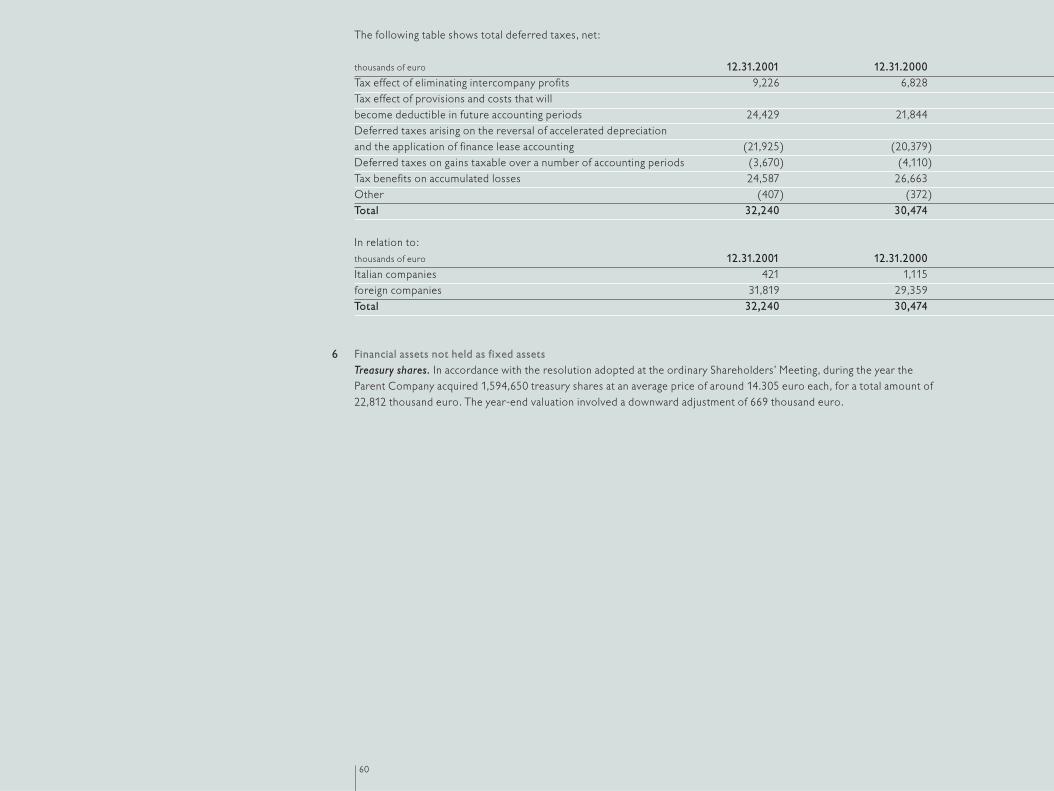
The following table shows total deferred taxes, net:
thousands of euro 12.31.2001 12.31.2000Tax effect of eliminating intercompany profits 9,226 6,828Tax effect of provisions and costs that willbecome deductible in future accounting periods 24,429 21,844Deferred taxes arising on the reversal of accelerated depreciationand the application of finance lease accounting (21,925) (20,379)Deferred taxes on gains taxable over a number of accounting periods (3,670) (4,110)Tax benefits on accumulated losses 24,587 26,663Other (407) (372)Total 32,240 30,474
In relation to:thousands of euro 12.31.2001 12.31.2000Italian companies 421 1,115foreign companies 31,819 29,359Total 32,240 30,474
Financial assets not held as fixed assetsTreasury shares. In accordance with the resolution adopted at the ordinary Shareholders’ Meeting, during the year the Parent Company acquired 1,594,650 treasury shares at an average price of around 14.305 euro each, for a total amount of 22,812 thousand euro. The year-end valuation involved a downward adjustment of 669 thousand euro.
60
6
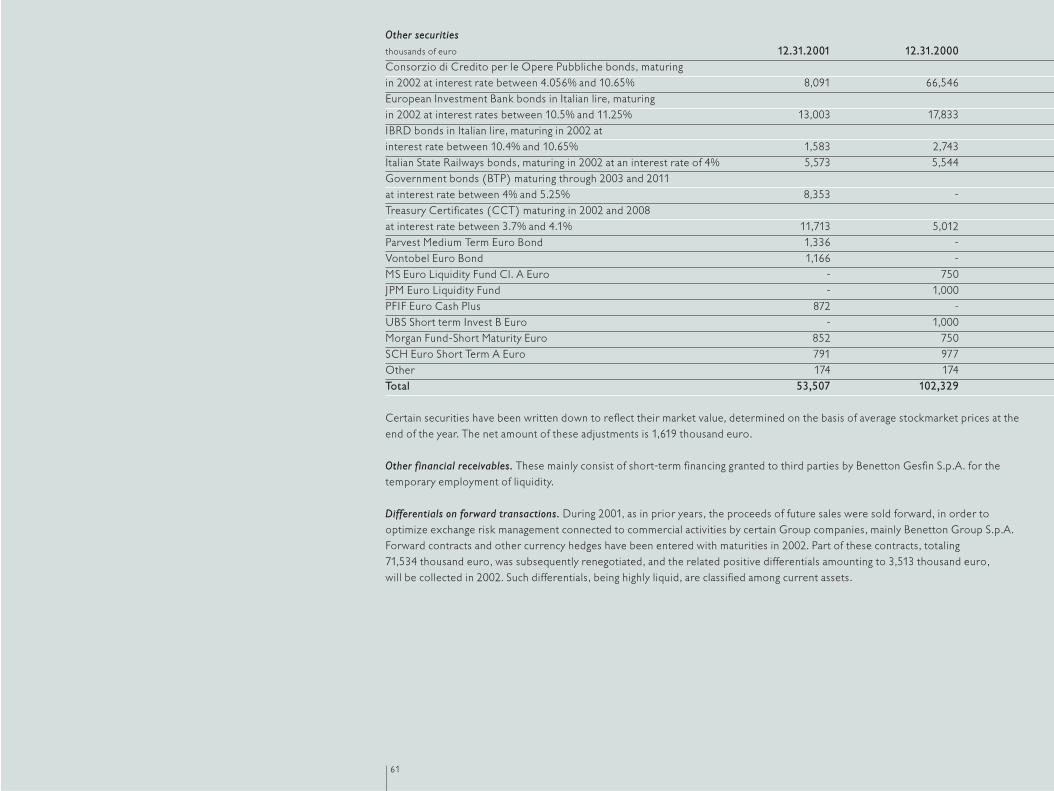
61
Other securitiesthousands of euro 12.31.2001 12.31.2000Consorzio di Credito per le Opere Pubbliche bonds, maturingin 2002 at interest rate between 4.056% and 10.65% 8,091 66,546European Investment Bank bonds in Italian lire, maturingin 2002 at interest rates between 10.5% and 11.25% 13,003 17,833IBRD bonds in Italian lire, maturing in 2002 atinterest rate between 10.4% and 10.65% 1,583 2,743Italian State Railways bonds, maturing in 2002 at an interest rate of 4% 5,573 5,544Government bonds (BTP) maturing through 2003 and 2011at interest rate between 4% and 5.25% 8,353 -Treasury Certificates (CCT) maturing in 2002 and 2008at interest rate between 3.7% and 4.1% 11,713 5,012Parvest Medium Term Euro Bond 1,336 -Vontobel Euro Bond 1,166 -MS Euro Liquidity Fund Cl. A Euro - 750JPM Euro Liquidity Fund - 1,000PFIF Euro Cash Plus 872 -UBS Short term Invest B Euro - 1,000Morgan Fund-Short Maturity Euro 852 750SCH Euro Short Term A Euro 791 977Other 174 174Total 53,507 102,329
Certain securities have been written down to reflect their market value, determined on the basis of average stockmarket prices at theend of the year. The net amount of these adjustments is 1,619 thousand euro.
Other financial receivables. These mainly consist of short-term financing granted to third parties by Benetton Gesfin S.p.A. for thetemporary employment of liquidity.
Differentials on forward transactions. During 2001, as in prior years, the proceeds of future sales were sold forward, in order tooptimize exchange risk management connected to commercial activities by certain Group companies, mainly Benetton Group S.p.A.Forward contracts and other currency hedges have been entered with maturities in 2002. Part of these contracts, totaling 71,534 thousand euro, was subsequently renegotiated, and the related positive differentials amounting to 3,513 thousand euro, will be collected in 2002. Such differentials, being highly liquid, are classified among current assets.
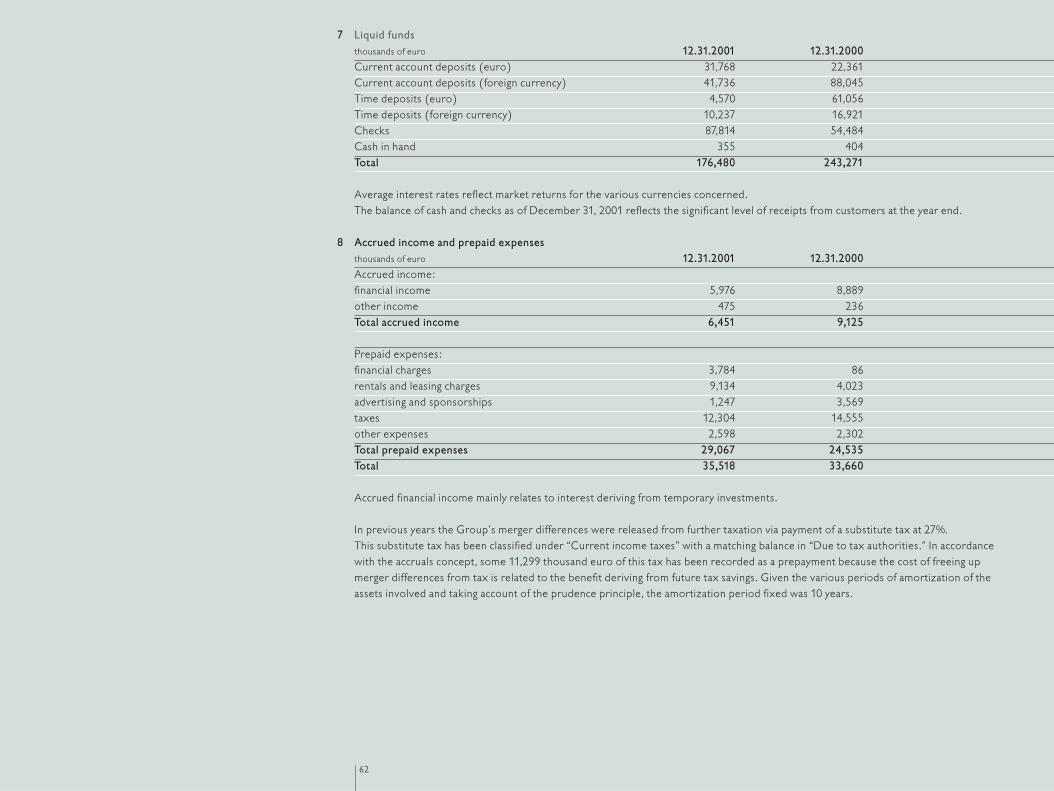
62
7
8
Liquid fundsthousands of euro 12.31.2001 12.31.2000Current account deposits (euro) 31,768 22,361Current account deposits (foreign currency) 41,736 88,045Time deposits (euro) 4,570 61,056Time deposits (foreign currency) 10,237 16,921Checks 87,814 54,484Cash in hand 355 404Total 176,480 243,271
Average interest rates reflect market returns for the various currencies concerned.The balance of cash and checks as of December 31, 2001 reflects the significant level of receipts from customers at the year end.
Accrued income and prepaid expensesthousands of euro 12.31.2001 12.31.2000Accrued income:financial income 5,976 8,889other income 475 236Total accrued income 6,451 9,125
Prepaid expenses:financial charges 3,784 86rentals and leasing charges 9,134 4,023advertising and sponsorships 1,247 3,569taxes 12,304 14,555other expenses 2,598 2,302Total prepaid expenses 29,067 24,535Total 35,518 33,660
Accrued financial income mainly relates to interest deriving from temporary investments.
In previous years the Group’s merger differences were released from further taxation via payment of a substitute tax at 27%. This substitute tax has been classified under “Current income taxes” with a matching balance in “Due to tax authorities.” In accordancewith the accruals concept, some 11,299 thousand euro of this tax has been recorded as a prepayment because the cost of freeing upmerger differences from tax is related to the benefit deriving from future tax savings. Given the various periods of amortization of theassets involved and taking account of the prudence principle, the amortization period fixed was 10 years.
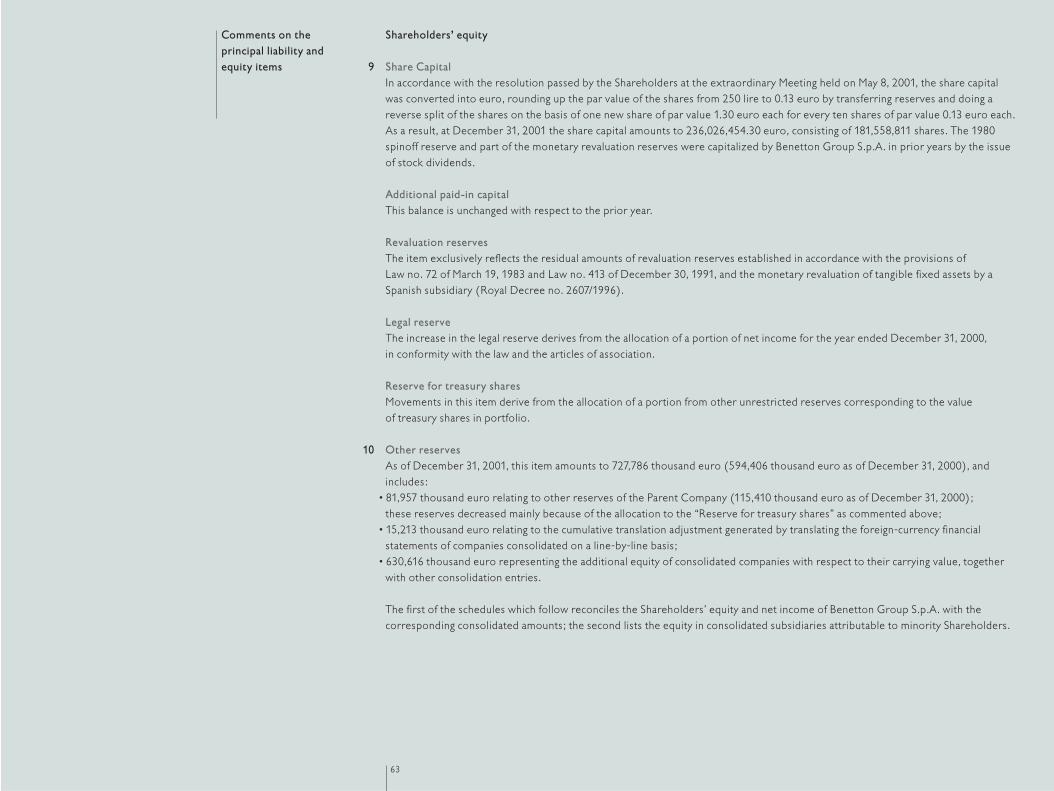
Shareholders’ equity
Share CapitalIn accordance with the resolution passed by the Shareholders at the extraordinary Meeting held on May 8, 2001, the share capital was converted into euro, rounding up the par value of the shares from 250 lire to 0.13 euro by transferring reserves and doing areverse split of the shares on the basis of one new share of par value 1.30 euro each for every ten shares of par value 0.13 euro each. As a result, at December 31, 2001 the share capital amounts to 236,026,454.30 euro, consisting of 181,558,811 shares. The 1980 spinoff reserve and part of the monetary revaluation reserves were capitalized by Benetton Group S.p.A. in prior years by the issue of stock dividends.
Additional paid-in capitalThis balance is unchanged with respect to the prior year.
Revaluation reservesThe item exclusively reflects the residual amounts of revaluation reserves established in accordance with the provisions of Law no. 72 of March 19, 1983 and Law no. 413 of December 30, 1991, and the monetary revaluation of tangible fixed assets by aSpanish subsidiary (Royal Decree no. 2607/1996).
Legal reserveThe increase in the legal reserve derives from the allocation of a portion of net income for the year ended December 31, 2000, in conformity with the law and the articles of association.
Reserve for treasury shares Movements in this item derive from the allocation of a portion from other unrestricted reserves corresponding to the value of treasury shares in portfolio.
Other reservesAs of December 31, 2001, this item amounts to 727,786 thousand euro (594,406 thousand euro as of December 31, 2000), andincludes:
• 81,957 thousand euro relating to other reserves of the Parent Company (115,410 thousand euro as of December 31, 2000); these reserves decreased mainly because of the allocation to the “Reserve for treasury shares” as commented above;
• 15,213 thousand euro relating to the cumulative translation adjustment generated by translating the foreign-currency financialstatements of companies consolidated on a line-by-line basis;
• 630,616 thousand euro representing the additional equity of consolidated companies with respect to their carrying value, together with other consolidation entries.
The first of the schedules which follow reconciles the Shareholders’ equity and net income of Benetton Group S.p.A. with thecorresponding consolidated amounts; the second lists the equity in consolidated subsidiaries attributable to minority Shareholders.
63
Comments on theprincipal liability andequity items 9
10

64
Reconciliation of the Shareholders’ equity and net income of Benetton Group S.p.A. with the corresponding consolidated amounts.
12.31.2001 12.31.2000Shareholders’ Net Shareholders’ Net
thousands of euro equity income equity incomePer Benetton Group S.p.A.financial statements 526,655 83,749 526,958 78,276Net income and Shareholders’ equity of consolidated subsidiaries, net of their carrying value 638,014 17,670 565,048 162,540Reversal of writedownof equity investments - 58,858 - 16,690Elimination of dividends paid by consolidated subsidiaries - (5,000) - -Reversal of merger differences and related amortizationin Benetton Group S.p.A. (67,601) 6,905 (74,506) 6,905Allocation to fixed assets of the difference between the purchase price and the equity of new subsidiaries at the time they were acquired and related depreciation 130,272 (16,535) 142,742 (14,888)Reversal of accelerated depreciation considering the useful lives of fixedassets and of intercompany gains on disposal of tangible fixed assets, net of the related tax effect 24,334 1,011 23,323 (757)Application of finance lease accounting,taking account of the related tax effect 5,516 871 4,645 (1,512)Elimination of intercompany profits included in the inventory ofconsolidated subsidiaries, net of therelated tax effect (16,314) (1,762) (14,552) (2,235)Adjustment to reflect the equity value of associated companies (208) (260) 2,784 (37)Net effect of other consolidation entries 35 2,570 (1,607) (1,717)Per Group’s consolidated financial statements 1,240,703 148,077 1,174,835 243,265
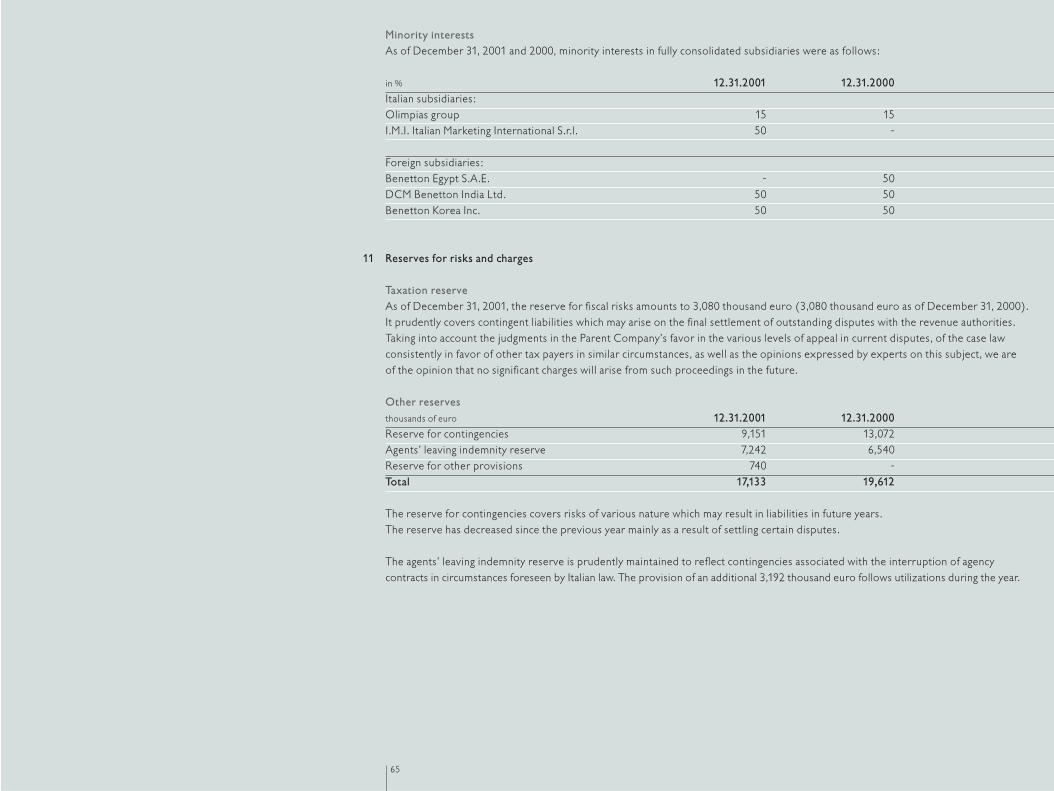
65
11
Minority interestsAs of December 31, 2001 and 2000, minority interests in fully consolidated subsidiaries were as follows:
in % 12.31.2001 12.31.2000Italian subsidiaries:Olimpias group 15 15I.M.I. Italian Marketing International S.r.l. 50 -
Foreign subsidiaries:Benetton Egypt S.A.E. - 50DCM Benetton India Ltd. 50 50Benetton Korea Inc. 50 50
Reserves for risks and charges
Taxation reserveAs of December 31, 2001, the reserve for fiscal risks amounts to 3,080 thousand euro (3,080 thousand euro as of December 31, 2000).It prudently covers contingent liabilities which may arise on the final settlement of outstanding disputes with the revenue authorities.Taking into account the judgments in the Parent Company’s favor in the various levels of appeal in current disputes, of the case lawconsistently in favor of other tax payers in similar circumstances, as well as the opinions expressed by experts on this subject, we are of the opinion that no significant charges will arise from such proceedings in the future.
Other reservesthousands of euro 12.31.2001 12.31.2000Reserve for contingencies 9,151 13,072Agents’ leaving indemnity reserve 7,242 6,540Reserve for other provisions 740 -Total 17,133 19,612
The reserve for contingencies covers risks of various nature which may result in liabilities in future years.The reserve has decreased since the previous year mainly as a result of settling certain disputes.
The agents’ leaving indemnity reserve is prudently maintained to reflect contingencies associated with the interruption of agencycontracts in circumstances foreseen by Italian law. The provision of an additional 3,192 thousand euro follows utilizations during the year.
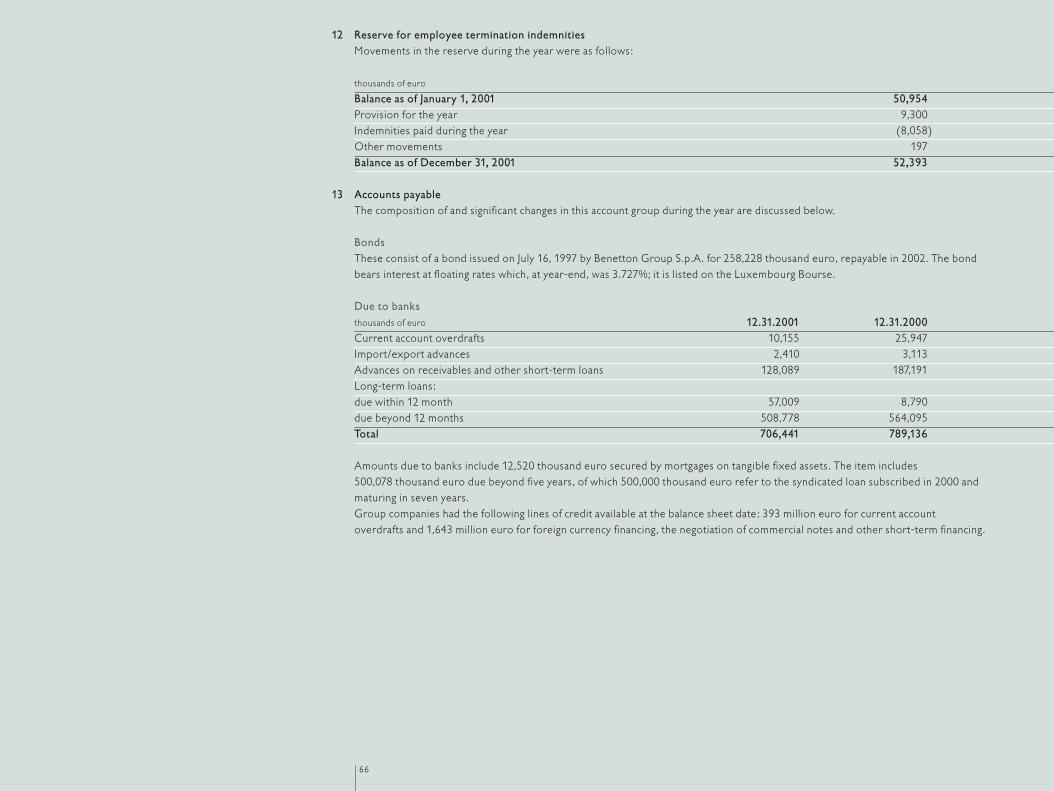
Reserve for employee termination indemnitiesMovements in the reserve during the year were as follows:
thousands of euro
Balance as of January 1, 2001 50,954Provision for the year 9,300Indemnities paid during the year (8,058)Other movements 197Balance as of December 31, 2001 52,393
Accounts payableThe composition of and significant changes in this account group during the year are discussed below.
BondsThese consist of a bond issued on July 16, 1997 by Benetton Group S.p.A. for 258,228 thousand euro, repayable in 2002. The bondbears interest at floating rates which, at year-end, was 3.727%; it is listed on the Luxembourg Bourse.
Due to banksthousands of euro 12.31.2001 12.31.2000Current account overdrafts 10,155 25,947Import/export advances 2,410 3,113Advances on receivables and other short-term loans 128,089 187,191Long-term loans:due within 12 month 57,009 8,790due beyond 12 months 508,778 564,095Total 706,441 789,136
Amounts due to banks include 12,520 thousand euro secured by mortgages on tangible fixed assets. The item includes 500,078 thousand euro due beyond five years, of which 500,000 thousand euro refer to the syndicated loan subscribed in 2000 andmaturing in seven years. Group companies had the following lines of credit available at the balance sheet date: 393 million euro for current account overdrafts and 1,643 million euro for foreign currency financing, the negotiation of commercial notes and other short-term financing.
66
12
13
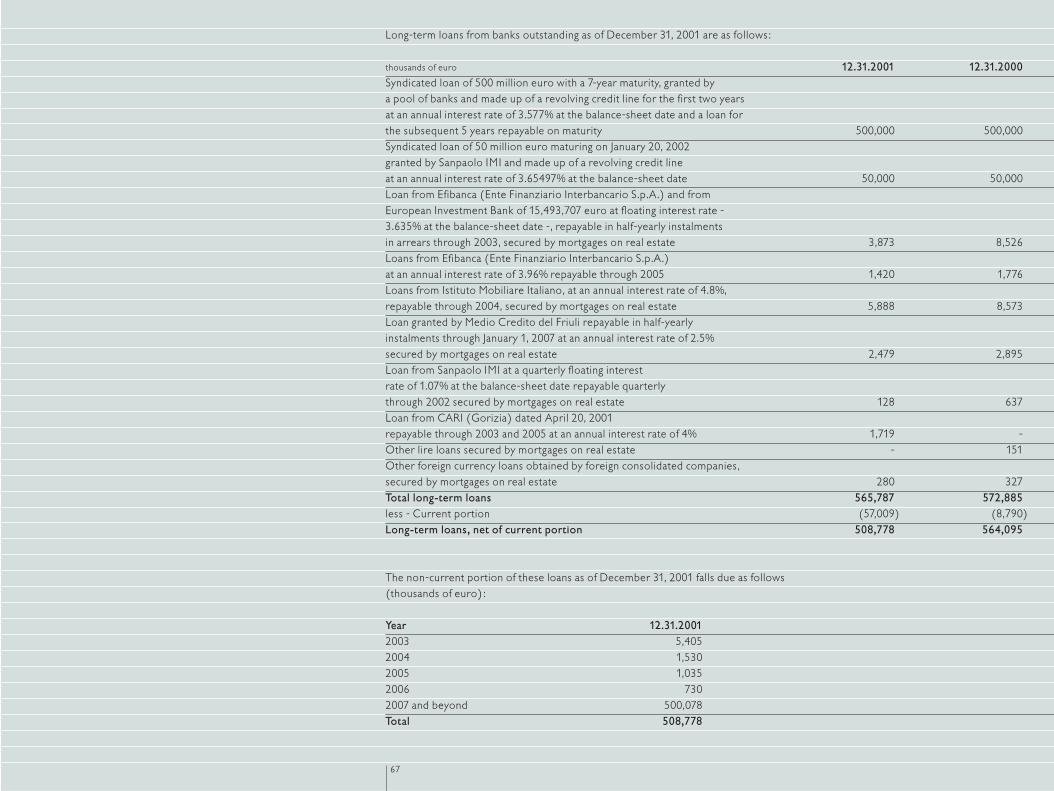
67
Long-term loans from banks outstanding as of December 31, 2001 are as follows:
thousands of euro 12.31.2001 12.31.2000Syndicated loan of 500 million euro with a 7-year maturity, granted bya pool of banks and made up of a revolving credit line for the first two years at an annual interest rate of 3.577% at the balance-sheet date and a loan for the subsequent 5 years repayable on maturity 500,000 500,000Syndicated loan of 50 million euro maturing on January 20, 2002granted by Sanpaolo IMI and made up of a revolving credit line at an annual interest rate of 3.65497% at the balance-sheet date 50,000 50,000Loan from Efibanca (Ente Finanziario Interbancario S.p.A.) and fromEuropean Investment Bank of 15,493,707 euro at floating interest rate - 3.635% at the balance-sheet date -, repayable in half-yearly instalments in arrears through 2003, secured by mortgages on real estate 3,873 8,526Loans from Efibanca (Ente Finanziario Interbancario S.p.A.) at an annual interest rate of 3.96% repayable through 2005 1,420 1,776Loans from Istituto Mobiliare Italiano, at an annual interest rate of 4.8%, repayable through 2004, secured by mortgages on real estate 5,888 8,573Loan granted by Medio Credito del Friuli repayable in half-yearlyinstalments through January 1, 2007 at an annual interest rate of 2.5%secured by mortgages on real estate 2,479 2,895Loan from Sanpaolo IMI at a quarterly floating interest rate of 1.07% at the balance-sheet date repayable quarterlythrough 2002 secured by mortgages on real estate 128 637Loan from CARI (Gorizia) dated April 20, 2001repayable through 2003 and 2005 at an annual interest rate of 4% 1,719 -Other lire loans secured by mortgages on real estate - 151Other foreign currency loans obtained by foreign consolidated companies, secured by mortgages on real estate 280 327Total long-term loans 565,787 572,885less - Current portion (57,009) (8,790) Long-term loans, net of current portion 508,778 564,095
The non-current portion of these loans as of December 31, 2001 falls due as follows (thousands of euro):
Year 12.31.20012003 5,4052004 1,5302005 1,0352006 7302007 and beyond 500,078Total 508,778

68
Due to other financial companiesthousands of euro 12.31.2001 12.31.2000Other short-term loans 1,037 733Long-term loans:due within 12 months 406 357due beyond 12 months 1,052 1,361Due to leasing companies:due within 12 months 3,761 3,432due beyond 12 months 20,670 21,240Total 26,926 27,123
Long-term loans obtained from other financial companies outstanding at the balance sheet date are as follows:
thousands of euro 12.31.2001 12.31.2000Other euro loans 1,458 1,718less - Current portion (406) (357)Long-term loans, net of current portion 1,052 1,361
The non-current portion of these loans as of December 31, 2001 falls due as follows (thousands of euro):
Year 12.31.20012003 5062004 542005 582006 622007 and beyond 372Total 1,052
The non-current portion of amounts due to leasing companies as of December 31, 2001 falls due as follows (thousands of euro):
Year 12.31.20012003 3,7822004 3,6532005 3,7292006 3,5992007 and beyond 5,907Total 20,670
AdvancesAdvances, totaling 3,577 thousand euro (22,559 thousand euro as of December 31, 2000) decreased due to the disposal of the investment in T.W.R. Group Ltd.
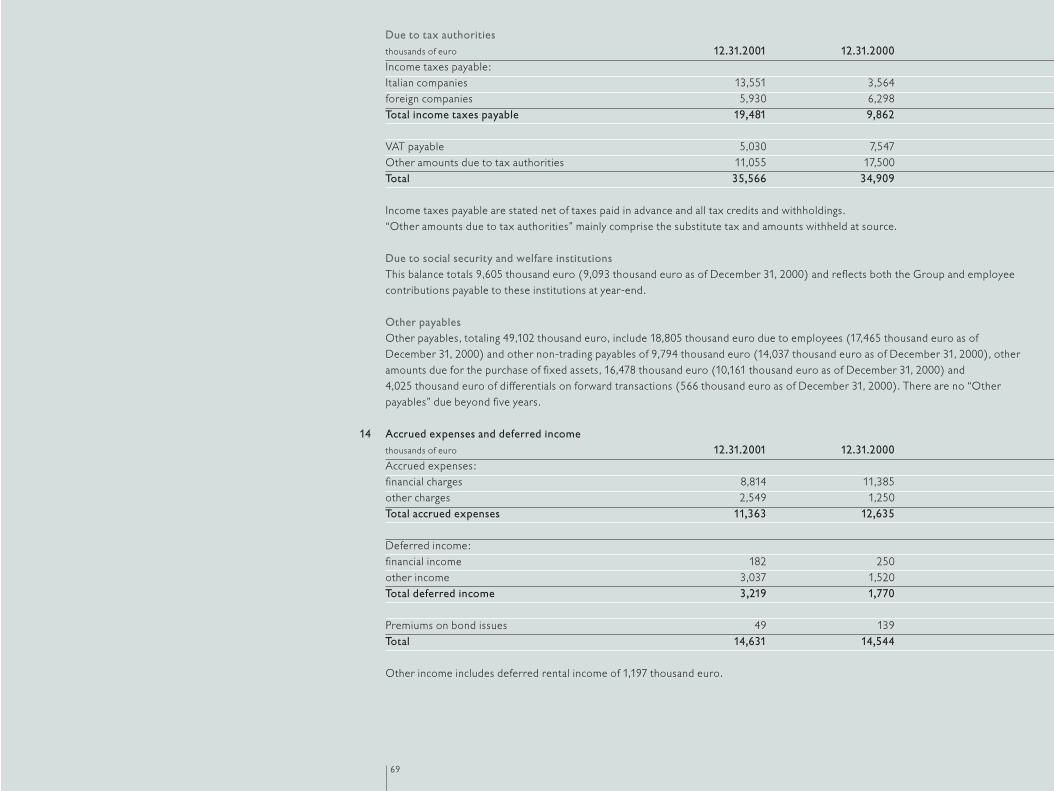
Due to tax authoritiesthousands of euro 12.31.2001 12.31.2000Income taxes payable:Italian companies 13,551 3,564foreign companies 5,930 6,298Total income taxes payable 19,481 9,862
VAT payable 5,030 7,547Other amounts due to tax authorities 11,055 17,500Total 35,566 34,909
Income taxes payable are stated net of taxes paid in advance and all tax credits and withholdings.“Other amounts due to tax authorities” mainly comprise the substitute tax and amounts withheld at source.
Due to social security and welfare institutionsThis balance totals 9,605 thousand euro (9,093 thousand euro as of December 31, 2000) and reflects both the Group and employeecontributions payable to these institutions at year-end.
Other payablesOther payables, totaling 49,102 thousand euro, include 18,805 thousand euro due to employees (17,465 thousand euro as ofDecember 31, 2000) and other non-trading payables of 9,794 thousand euro (14,037 thousand euro as of December 31, 2000), otheramounts due for the purchase of fixed assets, 16,478 thousand euro (10,161 thousand euro as of December 31, 2000) and 4,025 thousand euro of differentials on forward transactions (566 thousand euro as of December 31, 2000). There are no “Otherpayables” due beyond five years.
Accrued expenses and deferred incomethousands of euro 12.31.2001 12.31.2000Accrued expenses:financial charges 8,814 11,385other charges 2,549 1,250Total accrued expenses 11,363 12,635
Deferred income:financial income 182 250other income 3,037 1,520Total deferred income 3,219 1,770
Premiums on bond issues 49 139Total 14,631 14,544
Other income includes deferred rental income of 1,197 thousand euro.
69
14
These mainly include currency to be sold or purchased forward. This is the countervalue in euro at the forward exchange rate of commitments deriving from contracts signed during the year for various hedging transactions. For the most part, the item reflectstransactions opened to hedge receivables, firm orders and future sales. Those covering future sales were subsequently partiallyrenegotiated by carrying out reverse transactions. Other transactions were entered into to hedge the exchange risk on capital investedin Group companies.
As of December 31, 2001, there were outstanding interest rate swaps for a figurative value of 410,000 thousand euro and 1 billion yen,as well as forward rate agreements for a notional value some 70,000 thousand euro.
The item “Guarantees” includes two guarantees worth 5,165 thousand euro issued in connection with the purchase and restoration of a building in Taranto.
The item “Sales commitments” refers to the option to sell a business branch in Pescara expiring at the end of 2003.
“Purchase commitments” mainly relate to preliminaries for the purchase of a building (for 1,446 thousand euro, of which 289 thousand euro already paid by way of a downpayment) and of certain commercial activities in Italy (for a total of 24,151 thousandeuro, of which 5,056 thousand euro already paid by way of a downpayment). They also include an option to purchase a building in Barcelona for 28,067 thousand euro, of which 2,807 thousand euro already paid as advance.
70
Memorandum accounts15
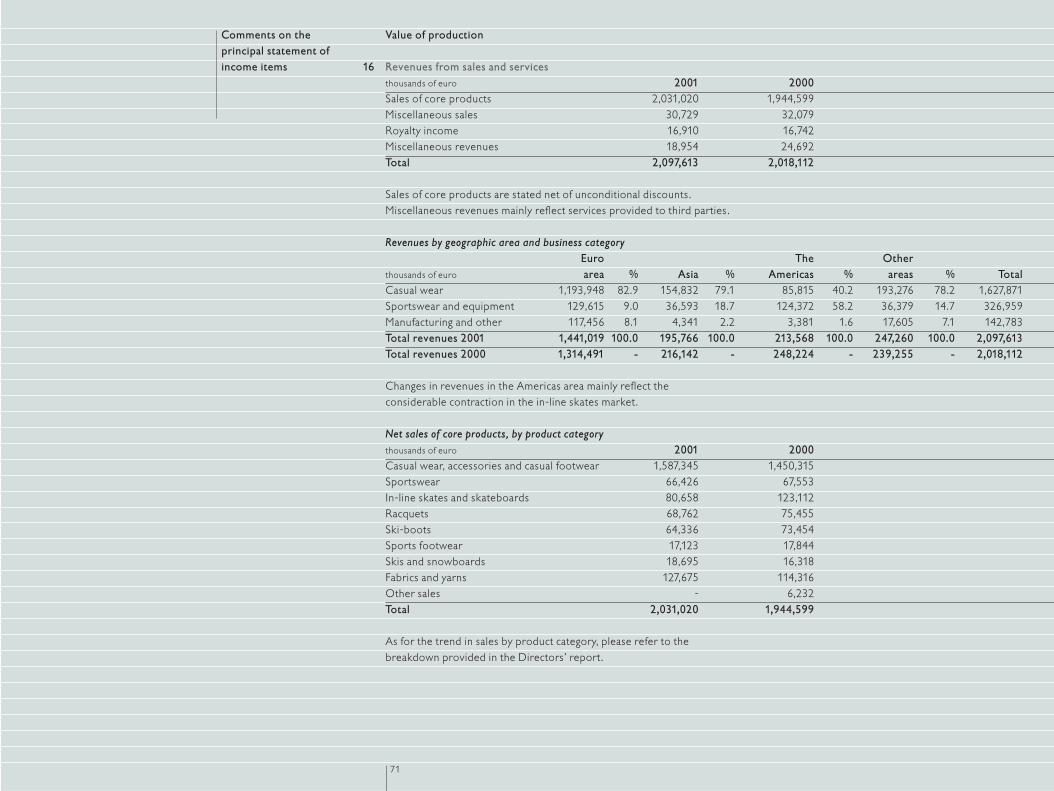
Value of production
Revenues from sales and services thousands of euro 2001 2000Sales of core products 2,031,020 1,944,599Miscellaneous sales 30,729 32,079Royalty income 16,910 16,742Miscellaneous revenues 18,954 24,692Total 2,097,613 2,018,112
Sales of core products are stated net of unconditional discounts.Miscellaneous revenues mainly reflect services provided to third parties.
Revenues by geographic area and business categoryEuro The Other
thousands of euro area % Asia % Americas % areas % TotalCasual wear 1,193,948 82.9 154,832 79.1 85,815 40.2 193,276 78.2 1,627,871Sportswear and equipment 129,615 9.0 36,593 18.7 124,372 58.2 36,379 14.7 326,959Manufacturing and other 117,456 8.1 4,341 2.2 3,381 1.6 17,605 7.1 142,783Total revenues 2001 1,441,019 100.0 195,766 100.0 213,568 100.0 247,260 100.0 2,097,613Total revenues 2000 1,314,491 - 216,142 - 248,224 - 239,255 - 2,018,112
Changes in revenues in the Americas area mainly reflect the considerable contraction in the in-line skates market.
Net sales of core products, by product categorythousands of euro 2001 2000Casual wear, accessories and casual footwear 1,587,345 1,450,315Sportswear 66,426 67,553In-line skates and skateboards 80,658 123,112Racquets 68,762 75,455Ski-boots 64,336 73,454Sports footwear 17,123 17,844Skis and snowboards 18,695 16,318Fabrics and yarns 127,675 114,316Other sales - 6,232Total 2,031,020 1,944,599
As for the trend in sales by product category, please refer to the breakdown provided in the Directors’ report.
71
Comments on theprincipal statement ofincome items 16
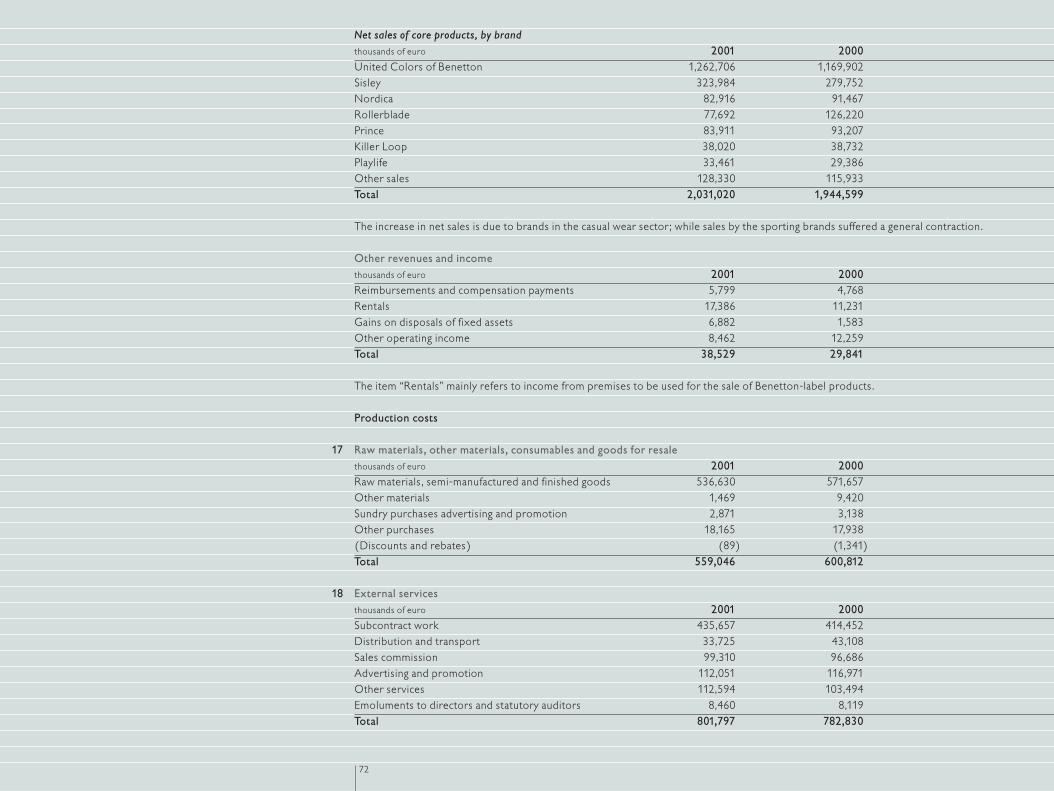
Net sales of core products, by brandthousands of euro 2001 2000United Colors of Benetton 1,262,706 1,169,902Sisley 323,984 279,752Nordica 82,916 91,467Rollerblade 77,692 126,220Prince 83,911 93,207Killer Loop 38,020 38,732Playlife 33,461 29,386Other sales 128,330 115,933Total 2,031,020 1,944,599
The increase in net sales is due to brands in the casual wear sector; while sales by the sporting brands suffered a general contraction.
Other revenues and incomethousands of euro 2001 2000Reimbursements and compensation payments 5,799 4,768Rentals 17,386 11,231Gains on disposals of fixed assets 6,882 1,583Other operating income 8,462 12,259Total 38,529 29,841
The item “Rentals” mainly refers to income from premises to be used for the sale of Benetton-label products.
Production costs
Raw materials, other materials, consumables and goods for resalethousands of euro 2001 2000Raw materials, semi-manufactured and finished goods 536,630 571,657Other materials 1,469 9,420Sundry purchases advertising and promotion 2,871 3,138Other purchases 18,165 17,938(Discounts and rebates) (89) (1,341)Total 559,046 600,812
External servicesthousands of euro 2001 2000Subcontract work 435,657 414,452Distribution and transport 33,725 43,108Sales commission 99,310 96,686Advertising and promotion 112,051 116,971Other services 112,594 103,494Emoluments to directors and statutory auditors 8,460 8,119Total 801,797 782,830
72
17
18

The decrease in distribution and transport costs reflects the reduction of these costs for the sport sector and the reclassification of certain expenses to other items. Advertising and promotion expenses include the sponsorship of the Benetton F1 team for year 2001.Other services include power costs, 26,518 thousand euro, maintenance costs, 14,039 thousand euro, consultancy and other fees, 55,649 thousand euro, insurance premiums, 3,880 thousand euro and personnel travel expenses, 12,508 thousand euro.
The following is gross remuneration paid by the Benetton Group to directors and members of the Board of statutory auditors of the Parent Company.
Name and Surname Position covered Duration of office (1) Gross remuneration (euro)Luciano Benetton Chairman 12.31.2001 1,500,000Carlo Benetton Deputy Chairman 12.31.2001 1,500,000Luigi de Puppi Managing Director 12.31.2001 535,323 (2)
Carlo Gilardi Managing Director 05.08.2001 2,422,456 (3)
Giuliana Benetton Director 12.31.2001 1,500,000Gilberto Benetton Director 12.31.2001 1,500,000Gianni Mion Director 12.31.2001 31,000 (4)
Angelo Tantazzi Director 12.31.2001 77,000Alessandro Benetton Director 12.31.2001 31,000Ulrich Weiss Director 12.31.2001 77,000Reginald Bartholomew Director 12.31.2001 77,000Luigi Arturo Bianchi Director 12.31.2001 77,000Angelo Casò Chairman of the Board of
statutory auditors 12.31.2001 61,975Dino Sesani Auditor 12.31.2001 41,317Filippo Duodo Auditor 12.31.2001 136,219
(1) Up to the approval of these financial statements(2) Managing Director from May 14, 2001(3) The remuneration includes termination indemnity(4) Amount paid to Edizione Holding S.p.A.
Leases and rentalsLeases and rentals, 54,368 thousand euro, mainly relate to rental paid of 48,916 thousand euro.
Payroll and related costsThese costs are already analyzed in the statement of income. Personnel are analyzed below, by category:
Average2001 2000 of the year
Managers 130 143 136White collars 3,326 3,017 3,172Workers 3,489 3,347 3,418Part-time 721 406 564Total 7,666 6,913 7,290
73
19
20
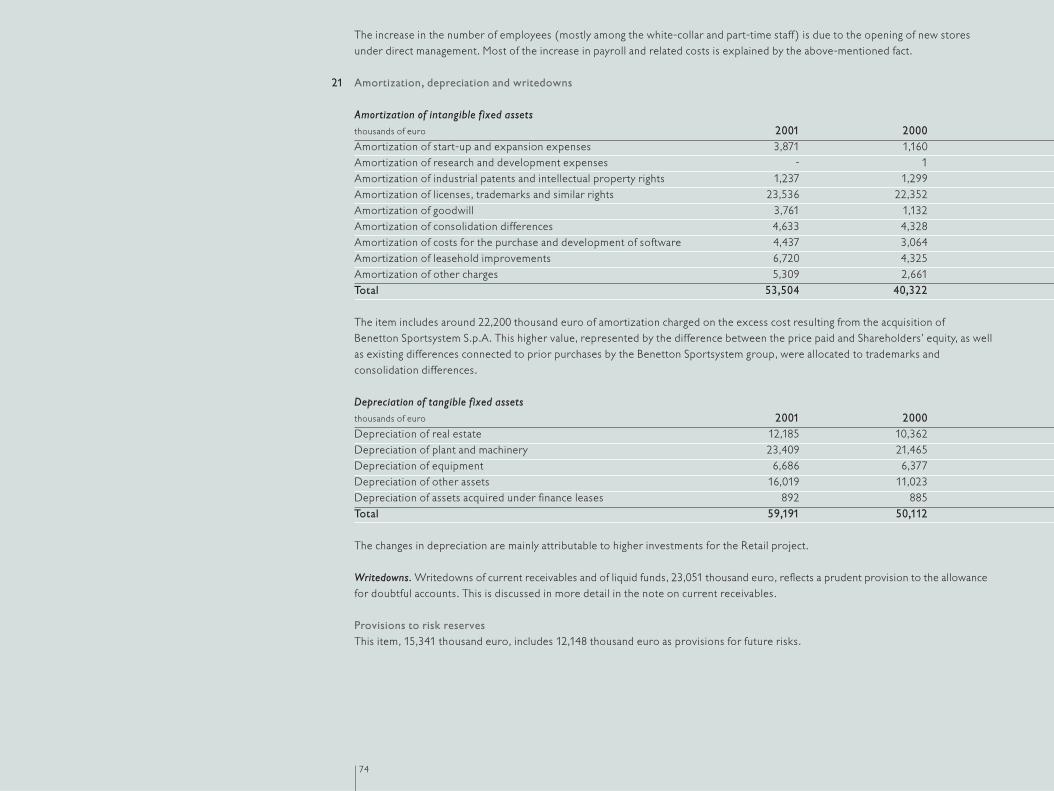
The increase in the number of employees (mostly among the white-collar and part-time staff) is due to the opening of new storesunder direct management. Most of the increase in payroll and related costs is explained by the above-mentioned fact.
Amortization, depreciation and writedowns
Amortization of intangible fixed assetsthousands of euro 2001 2000Amortization of start-up and expansion expenses 3,871 1,160Amortization of research and development expenses - 1Amortization of industrial patents and intellectual property rights 1,237 1,299Amortization of licenses, trademarks and similar rights 23,536 22,352Amortization of goodwill 3,761 1,132Amortization of consolidation differences 4,633 4,328Amortization of costs for the purchase and development of software 4,437 3,064Amortization of leasehold improvements 6,720 4,325Amortization of other charges 5,309 2,661Total 53,504 40,322
The item includes around 22,200 thousand euro of amortization charged on the excess cost resulting from the acquisition of Benetton Sportsystem S.p.A. This higher value, represented by the difference between the price paid and Shareholders’ equity, as wellas existing differences connected to prior purchases by the Benetton Sportsystem group, were allocated to trademarks andconsolidation differences.
Depreciation of tangible fixed assetsthousands of euro 2001 2000Depreciation of real estate 12,185 10,362Depreciation of plant and machinery 23,409 21,465Depreciation of equipment 6,686 6,377Depreciation of other assets 16,019 11,023Depreciation of assets acquired under finance leases 892 885Total 59,191 50,112
The changes in depreciation are mainly attributable to higher investments for the Retail project.
Writedowns. Writedowns of current receivables and of liquid funds, 23,051 thousand euro, reflects a prudent provision to the allowancefor doubtful accounts. This is discussed in more detail in the note on current receivables.
Provisions to risk reservesThis item, 15,341 thousand euro, includes 12,148 thousand euro as provisions for future risks.
74
21

Other operating coststhousands of euro 2001 2000Indirect taxation 6,076 5,157Losses on disposal of fixed assets 2,106 3,381Losses on receivables 513 1,083Other general expenses 9,082 10,958Total 17,777 20,579
Other general expenses include, for an amount of 4,746 thousand euro, returns and discounts relating to sales made in the prior year, especially in the sport sector.
Financial income and expenses
Income from equity investmentsThis balance, 1,479 thousand euro (2,385 thousand euro in 2000), includes 1,289 thousand euro of tax credits on dividends distributed by consolidated subsidiaries for the portion which could not be offset against taxes due.
Other financial income The item includes the following sub-accounts:
thousands of euro 2001 2000From receivables held as financial fixed assets from other companies 1,512 2,020From securities held as financial fixed assetsnot representing equity investments 5,286 5,233From securities included among current assets not representing equity investments 6,134 10,189Financial income other than the above:interest income from subsidiary companies 158 142interest income from trade and other receivables 1,481 2,743interest income from banks 5,603 4,384miscellaneous financial income and income from derivatives 23,007 10,126exchange gains and income from currency management 104,618 147,572Total other than the above 134,867 164,967Total 147,799 182,409
“Miscellaneous financial income and income from derivatives” includes: • positive differentials on interest rate swaps and forward rate agreements for 20,306 thousand euro (6,824 thousand euro in 2000);• income from cross-currency and currency swaps and forward rate agreements, 2,647 thousand euro (3,237 thousand euro in 2000).
75
22
23
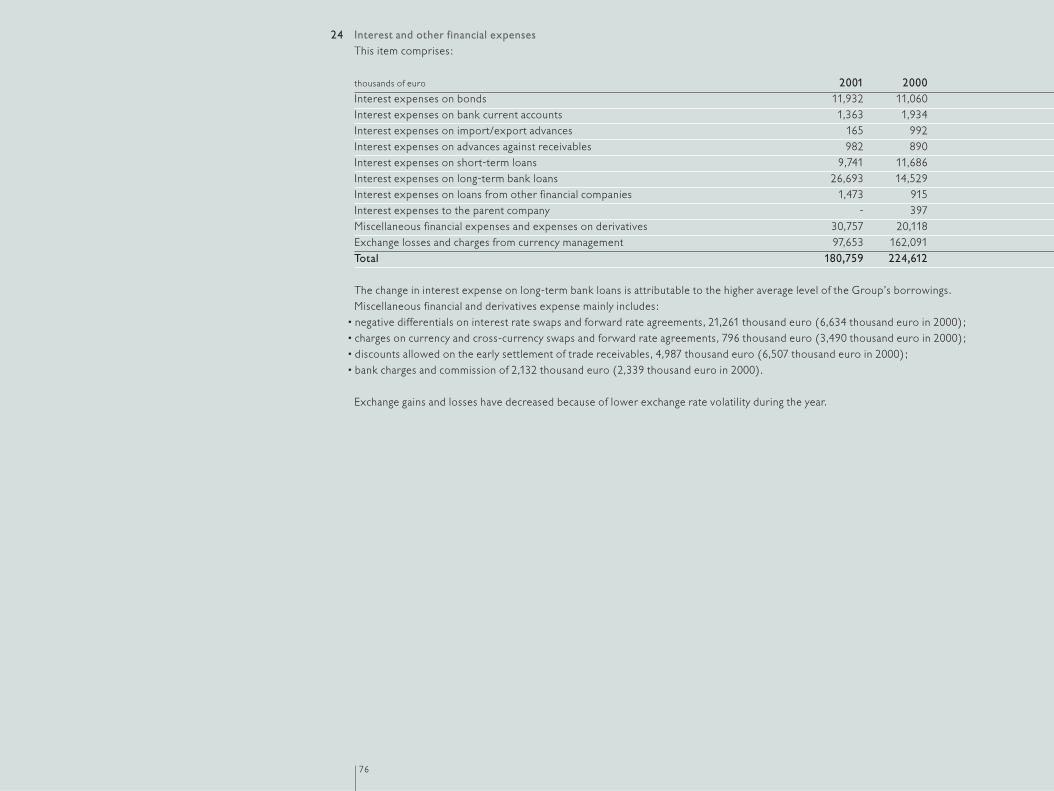
Interest and other financial expensesThis item comprises:
thousands of euro 2001 2000Interest expenses on bonds 11,932 11,060Interest expenses on bank current accounts 1,363 1,934Interest expenses on import/export advances 165 992Interest expenses on advances against receivables 982 890Interest expenses on short-term loans 9,741 11,686Interest expenses on long-term bank loans 26,693 14,529Interest expenses on loans from other financial companies 1,473 915Interest expenses to the parent company - 397Miscellaneous financial expenses and expenses on derivatives 30,757 20,118Exchange losses and charges from currency management 97,653 162,091Total 180,759 224,612
The change in interest expense on long-term bank loans is attributable to the higher average level of the Group’s borrowings.Miscellaneous financial and derivatives expense mainly includes:
• negative differentials on interest rate swaps and forward rate agreements, 21,261 thousand euro (6,634 thousand euro in 2000);• charges on currency and cross-currency swaps and forward rate agreements, 796 thousand euro (3,490 thousand euro in 2000); • discounts allowed on the early settlement of trade receivables, 4,987 thousand euro (6,507 thousand euro in 2000); • bank charges and commission of 2,132 thousand euro (2,339 thousand euro in 2000).
Exchange gains and losses have decreased because of lower exchange rate volatility during the year.
76
24
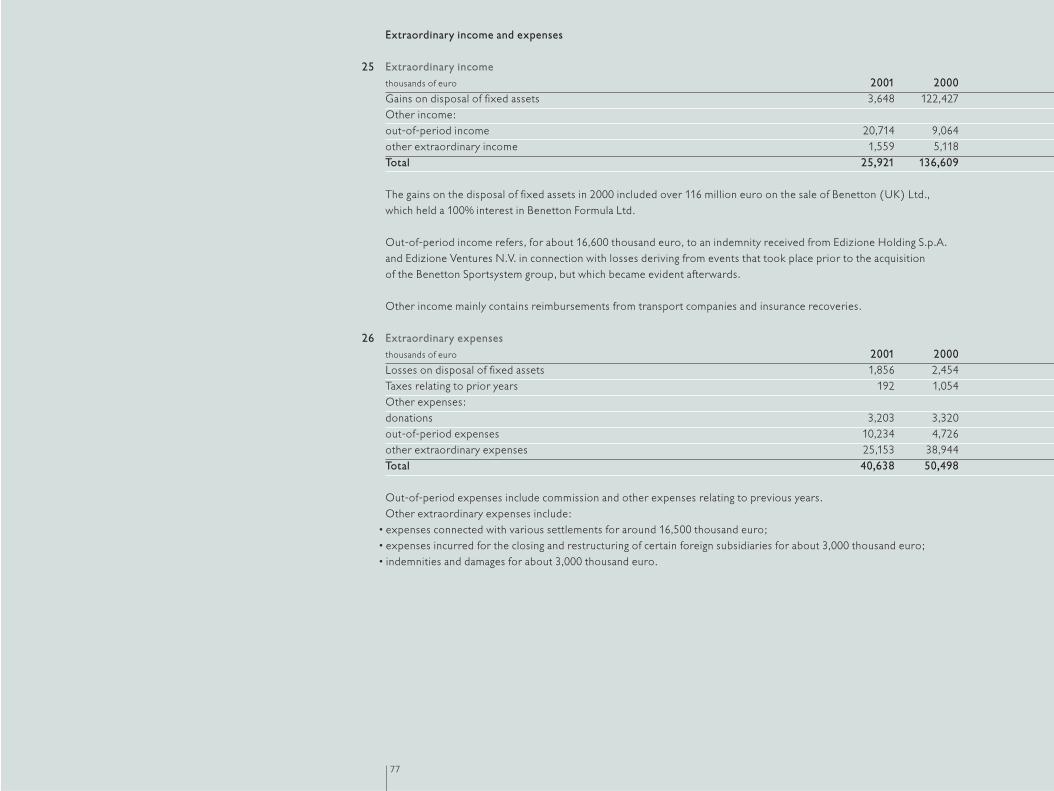
Extraordinary income and expenses
Extraordinary incomethousands of euro 2001 2000Gains on disposal of fixed assets 3,648 122,427Other income:out-of-period income 20,714 9,064other extraordinary income 1,559 5,118Total 25,921 136,609
The gains on the disposal of fixed assets in 2000 included over 116 million euro on the sale of Benetton (UK) Ltd., which held a 100% interest in Benetton Formula Ltd.
Out-of-period income refers, for about 16,600 thousand euro, to an indemnity received from Edizione Holding S.p.A. and Edizione Ventures N.V. in connection with losses deriving from events that took place prior to the acquisition of the Benetton Sportsystem group, but which became evident afterwards.
Other income mainly contains reimbursements from transport companies and insurance recoveries.
Extraordinary expensesthousands of euro 2001 2000Losses on disposal of fixed assets 1,856 2,454Taxes relating to prior years 192 1,054Other expenses:donations 3,203 3,320out-of-period expenses 10,234 4,726other extraordinary expenses 25,153 38,944Total 40,638 50,498
Out-of-period expenses include commission and other expenses relating to previous years.Other extraordinary expenses include:
• expenses connected with various settlements for around 16,500 thousand euro;• expenses incurred for the closing and restructuring of certain foreign subsidiaries for about 3,000 thousand euro;• indemnities and damages for about 3,000 thousand euro.
77
25
26

Income taxes
thousands of euro 2001 2000Income taxes:Italian companies 86,084 87,568foreign companies 8,173 9,093Total income taxes 94,257 96,661
Deferred taxes:Italian companies (256) 3,001foreign companies (1,588) 877Total deferred taxes (1,844) 3,878Total 92,413 100,539
Income taxes are down mainly thanks to the lower tax burden of the Italian Group companies.
Reconciliation of the tax charge is as follows:
in % 2001 2000Italian statutory tax rate 40.25 41.25Aggregate effect of different taxation of subsidiaries’ income (9.90) (15.90)Effect of writing down of the cost of consolidated investments (9.80) (1.70)Effect of losses from consolidated subsidiaries 17.20 5.70Amortization and write off of excess cost deriving from investments acquired 1.50 2.40Net tax effect of loss carry-forwards (0.40) (1.70)Other, net (0.70) (1.10)Effective tax rate 38.15 28.95
78
27
To the Shareholders of Benetton Group S.p.A.
We have audited the consolidated financial statements of Benetton Group S.p.A. as of December 31, 2001. These financial statements are the responsibility of the Company’s management. Our responsibility is to express an opinion on these financial statements based on our audit.
We conducted our audit in accordance with the Auditing Standards recommended by Consob, the Italian Stock ExchangeCommission. Those standards require that we plan and perform the audit to obtain reasonable assurance about whether the financial statements are free of material misstatement. An audit includes examining, on a test basis, evidencesupporting the amounts and disclosures in the financial statements. An audit also includes assessing the accountingprinciples used and significant estimates made by management, as well as evaluating the overall financial statement presentation. We believe that our audit provides a reasonable basis for our opinion.
For the opinion on the consolidated financial statements of the prior year, presented for comparison in accordance withlegal requirements, reference should be made to the auditor’s report issued by us on March 31, 2001.
In our opinion, the consolidated financial statements present fairly the financial position of the Company as of December 31, 2001, and the results of its operations for the year then ended, and comply with the principles which regulatethe preparation of financial statements in Italy.
This report has been translated into the English language solely for the convenience of international readers.
Deloitte & Touche S.p.A.
Andrea RuggeriPartner
Fausto ZanonPartner
Treviso, March 29, 2002
79
Independent Auditors’report in accordance witharticle 156 of LegislativeDecree of February 24, 1998, no. 58
HeadquartersBenetton Group S.p.A.Villa Minelli31050 Ponzano Veneto (Treviso) - Italytel +39 0422 519111
Legal dataShare Capital: Euro 236,026,454.30 fully paid-inTreviso Register of commerce: no. 84146Tax ID/Treviso Company register: no. 00193320264
Media and communication departmente-mail: [email protected] tel +39 0422 519036 fax +39 0422 519930
Investor relationse-mail: [email protected] +39 0422 519412 fax +39 0422 519740 TV Conference +39 0422 510623/24/25
To request a copy of the annual report: www.benetton.com
Corporate information
Graphic design and photographyFabrica - Catena di Villorba - Treviso (Italy)
Consultancy & co-ordinationD&C Financial Communication - Milano (Italy)
Color separationsSartori Group Srl - Quinto di Treviso (Italy)
PrintingGrafiche Tintoretto - Villorba (Treviso, Italy)