Benelux Real Estate - Vastgoedjournaal.nl
259
Benelux Real Estate EQUITY MARKETS February 2010 Benelux Real Estate Crisis controlled, directions for recovery Average expected total return for Benelux Real Estate is 15%, of which 7% is dividend Our top picks are Cofinimmo, Corio, Eurocommercial, VastNed O&I, VastNed Retail and Wereldhave The strong defensive qualities of a number of Belgian companies will become less relevant as the recovery firms up Arjan Knibbe Amsterdam (31) 20 563 8780 [email protected] Jean-Yves Devloo Amsterdam (31) 20 563 8745 [email protected] SEE THE DISCLOSURES APPENDIX FOR IMPORTANT DISCLOSURES AND ANALYST CERTIFICATION Benelux Real Estate February 2010
Transcript of Benelux Real Estate - Vastgoedjournaal.nl
BeneluxReal EstateEquity MARKEtS
February 2010
Benelux Real EstateCrisis controlled, directions for recovery
Average expected total return for Benelux Real Estate is 15%, of which 7% is dividend
Our top picks are Cofinimmo, Corio, Eurocommercial, VastNed O&I, VastNed Retail and Wereldhave
The strong defensive qualities of a number of Belgian companies will become less relevant as the recovery firms up
Arjan KnibbeAmsterdam (31) 20 563 [email protected]
Jean-Yves DevlooAmsterdam (31) 20 563 [email protected]
SEE THE DISCLOSURES APPENDIX FOR IMPORTANT DISCLOSURES AND ANALYST CERTIFICATION
Benelux R
eal EstateFebruary 2010
AMStERDAM BRuSSELS LONDON NEW yORK SiNGAPORE Tel: 31 20 563 8417 Tel: 32 2 547 7534 Tel: 44 20 7767 1000 Tel: 1 646 424 6000 Tel: 65 6535 3688
Bratislava Tel: 421 2 5934 6111 Bucharest Tel: 40 21 222 1600 Budapest Tel: 36 1 235 8800 Buenos Aires Tel: 54 11 4310 4700 Dublin Tel: 353 1 638 4000
Geneva Tel: 41 22 593 8050 Hong Kong Tel: 852 2848 8488 Istanbul Tel: 90 212 367 7011 Kiev Tel: 380 44 230 3030 Madrid Tel: 34 91 789 8880
Manila Tel: 63 2 479 8888 Mexico City Tel: 52 55 5258 2199 Milan Tel: 39 02 89629 3610 Moscow Tel: 7 495 755 5400 Paris Tel: 33 1 56 39 32 84
Prague Tel: 420 257 473 111 Santiago Tel: 56 2 659 2700 Sao Paulo Tel: 55 11 4504 6000 Seoul Tel: 82 2 317 1800 Shanghai Tel: 86 21 6841 3355
Sofia Tel: 359 2 917 6400 Taipei Tel: 886 2 2734 7600 Tokyo Tel: 81 3 5210 0100 Warsaw Tel: 48 22 820 5018
Research offices: legal entity/address/primary securities regulator Amsterdam ING Bank N.V., Foppingadreef 7, Amsterdam, Netherlands, 1102BD. Netherlands Authority for the Financial Markets
Bratislava ING Bank N.V., pobocka zahranicnej banky, Jesenskeho 4/C, 811 02 Bratislava, Slovak Republic. National Bank of Slovakia
Brussels ING Belgium S.A./N.V., Avenue Marnix 24, Brussels, Belgium, B-1000. Banking Finance and Insurance Commission
Bucharest ING Bank N.V. Bucharest Branch, 11-13 Kiseleff Avenue, PO Box 2-208, 011342, Bucharest 1, Romania Romanian National Securities and Exchange Commission
Budapest ING Bank N.V. Hungary Branch, Dozsa Gyorgy ut 84\B, H - 1068 Budapest, Hungary. Hungarian Financial Supervisory Authority
Hong Kong ING Bank N.V. Hong Kong Branch, 39/F, One International Finance Centre, Central Hong Kong. Hong Kong Monetary Authority
Istanbul ING Bank N.V. Istanbul Representative Office, Eski Buyukdere Caddesi Guney Plaza No: 17 / A Kat: 3 Maslak, Istanbul, Turkey, 34398. Capital Markets Board
Kiev ING Bank Ukraine JSC, 30-a, Spaska Street, Kiev, Ukraine, 04070 Ukrainian Securities and Stock Commission
London ING Bank N.V. London Branch, 60 London Wall, London EC2M 5TQ, United Kingdom. Authorised by the Dutch Central Bank
Manila ING Bank N.V. Manila Branch, 21/F Tower I, Ayala Avenue, 1226 Makati City, Philippines. Philippine Securities and Exchange Commission
Mexico City ING Bank (Mexico) SA, Bosques de Alisos 45-B, Piso 4, Bosques de Las Lomas, 05120, Mexico City, Mexico. Comisión Nacional Bancaria y de Valores
Milan ING Bank N.V. Milano, Via Paleocapa, 5, Milano, Italy, 20121. Commissione Nazionale per le Società e la Borsa
Moscow ING Bank (Eurasia) ZAO, 36, Krasnoproletarskaya ulitsa, 127473 Moscow, Russia. Federal Financial Markets Service
Mumbai ING Vysya Bank Limited, A Wing, Shivsagar Estate, 2nd Floor, South Wing, Dr. Annie Besant Road, Worli, Mumbai, 400 018. India Securities and Exchange Board of India
New York ING Financial Markets LLC, 1325 Avenue of the Americas, New York, United States, 10019. Securities and Exchange Commission
Prague ING Bank N.V. Prague Branch, Nadrazni 25, 150 00 Prague 5, Czech Republic. Czech National Bank
Sao Paulo ING Bank N.V. Sao Paulo, Ave. Presidente Juscelino Kubistchek, 2nd floor, Sao Paulo, Brazil 04543-000. Securities and Exchange Commission of Brazil
Singapore ING Bank N.V. Singapore Branch, 19/F Republic Plaza, 9 Raffles Place, #19-02, Singapore, 048619. Monetary Authority of Singapore
Sofia ING Bank N.V. Sofia Branch, 49B Bulgaria Blvd, Sofia 1404 Bulgaria. Financial Supervision Commission
Warsaw ING Securities S.A., Plac Trzech Krzyzy, 10/14, Warsaw, Poland, 00-499. Polish Financial Supervision Authority
Disclaimer This report has been prepared on behalf of ING (being for this purpose the wholesale and investment banking business of ING Bank NV and certain of its subsidiary companies) solely for the information of its clients. ING forms part of ING Group (being for this purpose ING Groep NV and its subsidiary and affiliated companies). It is not investment advice or an offer or solicitation for the purchase or sale of any financial instrument. While reasonable care has been taken to ensure that the information contained herein is not untrue or misleading at the time of publication, ING makes no representation that it is accurate or complete. The information contained herein is subject to change without notice. ING Group and any of its officers, employees, related and discretionary accounts may, to the extent not disclosed above and to the extent permitted by law, have long or short positions or may otherwise be interested in any transactions or investments (including derivatives) referred to in this report. In addition, ING Group may provide banking, insurance or asset management services for, or solicit such business from, any company referred to in this report. Neither ING Group nor any of its officers or employees accepts any liability for any direct or consequential loss arising from any use of this report or its contents. Copyright and database rights protection exists in this report and it may not be reproduced, distributed or published by any person for any purpose without the prior express consent of ING. All rights are reserved. Any investments referred to herein may involve significant risk, are not necessarily available in all jurisdictions, may be illiquid and may not be suitable for all investors. The value of, or income from, any investments referred to herein may fluctuate and/or be affected by changes in exchange rates. Past performance is not indicative of future results. Investors should make their own investigations and investment decisions without relying on this report. Only investors with sufficient knowledge and experience in financial matters to evaluate the merits and risks should consider an investment in any issuer or market discussed herein and other persons should not take any action on the basis of this report. This report is issued: 1) in the United Kingdom only to persons described in Articles 19, 47 and 49 of the Financial Services and Markets Act 2000 (Financial Promotion) Order 2005 and is not intended to be distributed, directly or indirectly, to any other class of persons (including private investors); 2) in Italy only to persons described in Article No. 31 of Consob Regulation No. 11522/98. Clients should contact analysts at, and execute transactions through, an ING entity in their home jurisdiction unless governing law permits otherwise. ING Bank N.V. London Branch is authorised by the Dutch Central Bank. It is incorporated in the Netherlands and its London Branch is registered in the UK (number BR000341) at 60 London Wall, London EC2M 5TQ. ING Financial Markets LLC, which is a member of the NYSE, FINRA and SIPC and part of ING, has accepted responsibility for the distribution of this report in the United States under applicable requirements. ING Vysya Bank Ltd is responsible for the distribution of this report in India. EQ Additional information is available on request
1
Benelux Real Estate February 2010
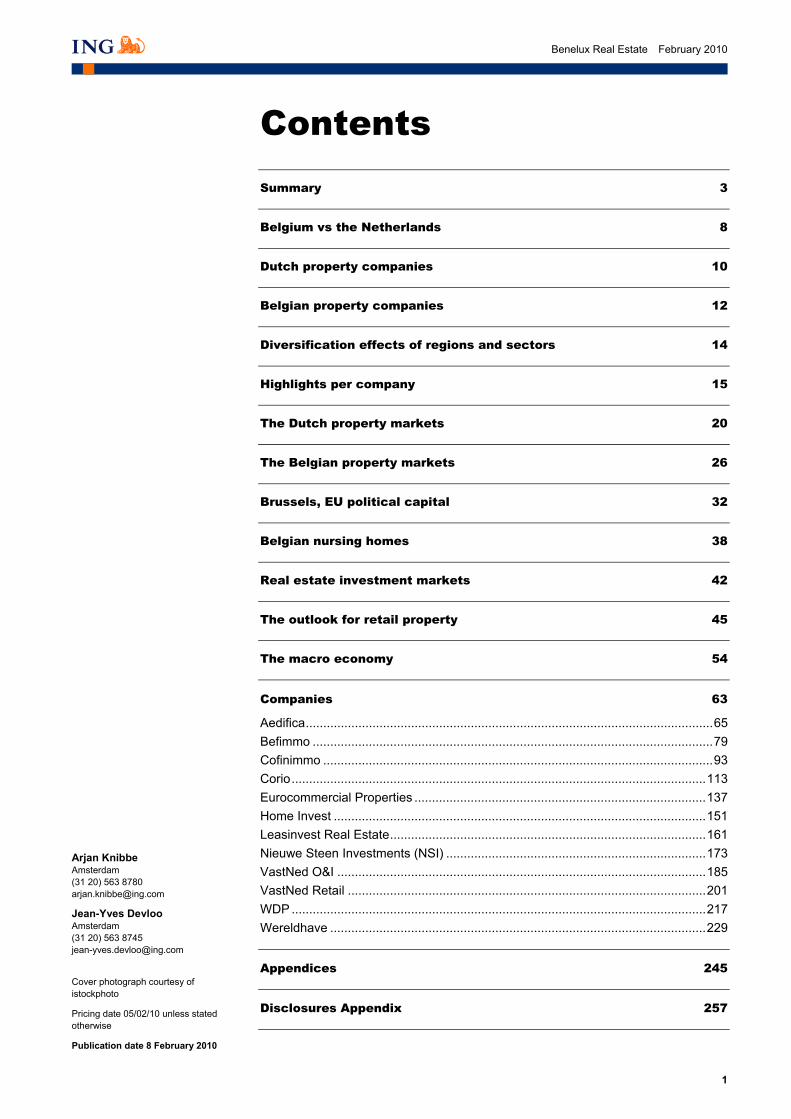
Contents Summary 3
Belgium vs the Netherlands 8
Dutch property companies 10
Belgian property companies 12
Diversification effects of regions and sectors 14
Highlights per company 15
The Dutch property markets 20
The Belgian property markets 26
Brussels, EU political capital 32
Belgian nursing homes 38
Real estate investment markets 42
The outlook for retail property 45
The macro economy 54
Companies 63 Aedifica....................................................................................................................65 Befimmo ..................................................................................................................79 Cofinimmo ...............................................................................................................93 Corio......................................................................................................................113 Eurocommercial Properties ...................................................................................137 Home Invest ..........................................................................................................151 Leasinvest Real Estate..........................................................................................161 Nieuwe Steen Investments (NSI) ..........................................................................173 VastNed O&I .........................................................................................................185 VastNed Retail ......................................................................................................201 WDP ......................................................................................................................217 Wereldhave ...........................................................................................................229
Appendices 245
Disclosures Appendix 257
Arjan Knibbe Amsterdam (31 20) 563 8780 [email protected]
Jean-Yves Devloo Amsterdam (31 20) 563 8745 [email protected]
Cover photograph courtesy of istockphoto
Pricing date 05/02/10 unless stated otherwise
Publication date 8 February 2010

2
Benelux Real Estate February 2010
Our cover picture shows the Oosterscheldekering (the Eastern Scheldt storm surge barrier), between the Schouwen-Duiveland and Noord-Beveland islands, which is the largest of the 13 ambitious Delta works series of dams, designed to protect the Netherlands from flooding. The construction of the Delta Works was in response to the North Sea Flood of 1953. The nine kilometre-long Oosterscheldekering (kering meaning barrier) was initially designed, and partly built, as a closed dam, but after public protest huge sluice-gate-type doors were installed in the remaining four kilometres. These doors are normally open, but can be closed under adverse weather conditions. In this way the saltwater marine life behind the dam is preserved and fishing can continue, while the land behind the dam is safe from the water.
On 4 October 1986, Queen Beatrix officially opened the dam for use by saying De stormvloedkering is gesloten. De Deltawerken zijn voltooid. Zeeland is veilig. (The flood barrier is closed. The Delta Works are completed. Zealand is safe.) At the Neeltje-Jans artificial island, at one end of the barrier, a plaque is installed with the words "Hier gaan over het tij, de wind, de maan en wij" ("Here the tide is ruled, by the wind, the moon and us (the Dutch)").
Source: Wikipedia
We believe that after the flood of equity and convertible bond raisings, Benelux property companies have built sufficient surge barriers of capital and have become masters of their own destiny. The property companies are unlikely to be surprised again by a spring-tide of adverse property and finance conditions which destroyed most of the returns in 2008 and 2009. It is time to look forward.

3
Benelux Real Estate February 2010
Summary
Our valuation framework
We introduce a valuation framework which bases our price targets on target discounts or premiums to 2010F IFRS NAV. A large number of the Belgian companies, Wereldhave and NSI, do not provide EPRA NNNAV numbers, and this methodology tackles that problem. The target discounts range from -10% for VastNed Offices and Industrial to +10% for Corio and Cofinimmo. Factors that drive the target discounts are management track record, development exposure, flexibility of the business model, corporate governance, disclosure and quality of the assets and outlook for these markets. We will initiate on Unibail-Rodamco shortly.
We believe our target discount model is simple and straightforward and is more attractive than DCF-based models, which often resemble black boxes, or PE ratios which favour gearing and fail to discriminate between prime and secondary property. A sum of the parts approach would become interesting as well when investors want to attach value to development pipelines, but this is currently not really the case.
Bear in mind that the EPRA NAVs are higher than the IFRS NAVs, as they add back all or parts of transfer tax, capital gains tax and differences between nominal values and market values of debt and derivatives. Drivers of the NAVs are property valuations, retentions of earnings, currency results and dilutive or positive effects of capital raisings. The average market cap-weighted target premium to 2010F IFRS for Belgian property companies is 5%, which equals our Dutch weighted average target discount.
Fig 1 Valuation framework
Name IFRS NAV
TargetPremium(+) Target price Price
Priceupside DPS 2009
Total return Rating
Marketcap
2010F Discount(-) (€) (€) (%) (€) (%) (€m)
Aedifica 35.66 -5 33.9 40.55 -16 1.88 -12 Sell 189Befimmo 58.28 5 61.2 59.27 3 3.90 10 Hold 152Cofinimmo 99.32 10 109.3 98.34 11 6.50 18 Buy 1,246Corio 45.07 10 49.6 44.37 12 2.64 18 Buy 3,379Eurocommercial properties 30.25 5 31.8 28.69 11 1.78 17 Buy 1,164Home Invest Belgium 50.55 -5 48.0 54.20 -11 2.43 -7 Sell 151Leasinvest 63.21 -5 60.0 63.00 -5 4.01 2 Hold 252NSI 13.75 0 13.1 14.34 -9 1.34 0 Hold 565VastNed Office&I 17.06 -10 15.4 12.81 20 1.62 32 Buy 240VastNed Retail 50.65 0 50.7 46.60 9 4.05 17 Buy 851WDP 26.90 5 28.2 32.62 -13 2.94 -4 Hold 409Wereldhave 72.71 0 72.7 63.50 15 4.59 22 Buy 1,382
Average unweighted Belgium 0.8 0 4Average M Cap weighted Belgium 5.1 1 8Avg unweighted Netherlands 2.9 4 10Avg M Cap weighted Netherlands 5.1 10 17Avg unweighted total 1.3 2 9Avg M Cap weighted total 5.1 8 15
Source: ING estimates
Our target discounts range from -5% to +10%
to 2010F IFRS NAV
Average Belgian target discount equals Dutch
discount today

4
Benelux Real Estate February 2010
Fig 2 Valuation sensitivities
Name IFRS NAV Sensitivity to target discount/premium Target Premium(+) 2010F -10% -5% 0% 5% 10% 15% Discount (-)
Aedifica 35.66 32.09 33.88 35.66 37.44 39.23 41.01 -5Befimmo 58.28 52.45 55.37 58.28 61.19 64.11 67.02 0Cofinimmo 99.32 89.38 94.35 99.32 104.28 109.25 114.21 0Corio 45.07 40.56 42.82 45.07 47.33 49.58 51.83 10Eurocommercial properties 30.25 27.23 28.74 30.25 31.76 33.28 34.79 5Home Invest Belgium 50.55 45.49 48.02 50.55 53.08 55.6 58.13 -5Leasinvest 63.21 56.89 60.05 63.21 66.37 69.53 72.69 -5NSI 13.75 12.37 13.06 13.75 14.44 15.12 15.81 0VastNed Office&I 17.06 15.35 16.2 17.06 17.91 18.76 19.61 -5VastNed Retail 50.65 45.59 48.12 50.65 53.19 55.72 58.25 0WDP 26.9 24.21 25.55 26.9 28.24 29.59 30.93 5Wereldhave 72.71 65.44 69.07 72.71 76.35 79.98 83.62 0
Source: ING estimates
_
Our recommendations
We have six Buys, which we expect to post total returns of more than 15%, four Holds and two Sells, which we expect to post negative returns of less than -5%. We have Buy recommendations on Corio (upgraded from Hold, PT unchanged), Cofinimmo, Eurocommercial, VastNed Offices and Industrial, VastNed Retail and Wereldhave. The Sell recommendations are on the Belgian residential specialists, Aedifica and Home Invest Belgium, which we believe are currently expensive.
The shape of the recovery
We believe many Belgian companies will perform well in a W-shaped recovery where another dip will occur later this year or in 2011. Despite recent financial turmoil triggered by Greece, we do not expect this to happen. In a V-shaped recovery we would add upside through vacancy, more secondary real estate, more office space, and more financial gearing. We illustrate our recommendations for different shapes of the recovery in the figure below.
Fig 3 Shapes of recovery
V U WBUY
SELL
NSIVastned O&IWDPVastNed Retail
WereldhaveCorioUnibail-Rodamco
Unibail-RodamcoCorioCofinimmoBefimmo
WereldhaveHomeInvestAedificaEurocommercial
Unibail RodamcoCorioCofinimmoBefimmoWereldhaveLeaseinvest
CofinimmoBefimmoEurocommercial
NSIVastned O&IWDPVastNed Retail
Source: ING _
Six Buys, two Sells

5
Benelux Real Estate February 2010
The investment market for real estate is picking up
The chart below clearly illustrates that the investment markets have picked up, in particular in the Netherlands and France. We do not think the real estate markets will quickly return to normality.
Fig 4 Benelux and France investment markets in 2009 (€m)
6061,015 1,143
1,940
32576
519 352748
1,7661,586
3,500
0
500
1,000
1,500
2,000
2,500
3,000
3,500
4,000
1Q09 2Q09 3Q09 4Q9
Netherlands Belgium France
Source: CBRE 2010
_
Reasons to be careful
We think there are a number of reasons not to become too bullish in the short term. A major concern is the termination of a number of highly geared non-listed property funds. The graph below breaks down these liquidations by sector and year. Disposal of large portfolios could put pressure on real estate prices. In the event of restructuring and/or refinancing, cash flows will look significantly different as the cost of interest will be higher.
Fig 5 Termination of non-listed real estate funds by sector
0
5
10
15
20
25
2009 2010 2011 2012 2013 2014 2015 2016 2017 2018 2019
€Bn
Diversified Industrial / logistics Office Other Residential Retail
Source: Inrev, ING Research
_
Indexation is weakening
Most commercial property leases in Continental Europe are indexed to inflation or an adjusted type of inflation. In France and Sweden, this indexation is going to be below 1% to negative for 2010. That means that a large proportion of the rental growth in these markets will come to a halt.
Indexation comes to a near halt
Transaction volume up sharply in NL and
France
Terminations of real estate funds are an
€18bn dark cloud over 2010

6
Benelux Real Estate February 2010
Retail property catch-up may come to an end
We believe that the relative strength of the retail property markets in comparison to office real estate markets will decrease as the yield catch-up seen in recent years has come to an end, and most institutional investors have reached their desired retail weighting. Retail is still the sector where much more value can be added through active management, but the performance race with offices has become harder.
Retail trends hardly in favour of shopping centres
We believe that there are a number of potential trends that will lower future returns of retail property. We see the following important changes ahead:
• The end of the growth era of multiples.
• French Food retailers internalise and beef up development.
• E-commerce depresses footfall and turnover.
• Proximity and authenticity gain in importance.
• SRI does not fit with the traffic of a regional mall.
• Multiples opening in smaller centres, eroding the exclusivity of larger centres.
• Physical presence is declining in importance as social networks move to the web.
• Random meetings have become less important with the use of mobile phones.
• Sports, culture, and the internet are all competing for consumers’ time budget.
• Food retailers are trying to find the right web-based format.
We discuss these changes in depth later in this report. We believe that retail property risk is increasing and that these risks have not been adequately presented by the real estate investment industry.
Portfolio weighted GDP averages: 3.1 – 3.6%
We have calculated the average portfolio-weighted GDP growth numbers for the international Dutch companies. They range from 3.1% to 3.6% compound for 2010 and 2011. Strongest GDP performance will be shown for Unibail-Rodamco, Wereldhave (despite its Finnish weighting) and NSI. VastNed Retail’s portfolio will see the lowest economic growth, 3.1%, as a result of its Spanish exposure.
Portfolios of the Belgian majors compared
In Belgium we have compared the portfolio breakdowns of the majors, Cofinimmo and Befimmo. The breakdown is shown in the chart below and illustrates Befimmo’s overweight in Brussels-North and Cofinimmo’s overweight in the Decentralised area. We also analysed the differences of impact on gearing between off-balance sheet (Cofinimmo) and on-balance sheet (Befimmo) sale of receivables.
Retail property catch-up with offices is over
Retail property risks on the rise
We calculated overweight and
underweight positions in relation to the market

7
Benelux Real Estate February 2010
Fig 6 Cofinimmo and Befimmo overweight and underweight areas
-15.0 -10.0 -5.0 0.0 5.0 10.0 15.0 20.0 25.0
Centre
Midi
North
Leopold
Louise
Decentralised
Periphery
%
Cofinimmo Befimmo
Source: Company data, ING estimates _
Retail portfolios mapped
We have mapped the top 10 Dutch retail assets of our universe on a map with population growth indicated by colour on page 19. We believe this is a powerful tool to compare Dutch retail portfolios. Utrecht, Flevoland and Noord-Holland are expected to show the strongest growth in population. Corio and Unibail-Rodamco are the dominant players in these regions. The map positions 18% of the total holdings of Corio.
Utrecht, Flevoland and Noord-Holland expected
to show strongest population growth
8
Benelux Real Estate February 2010
Belgium vs the Netherlands
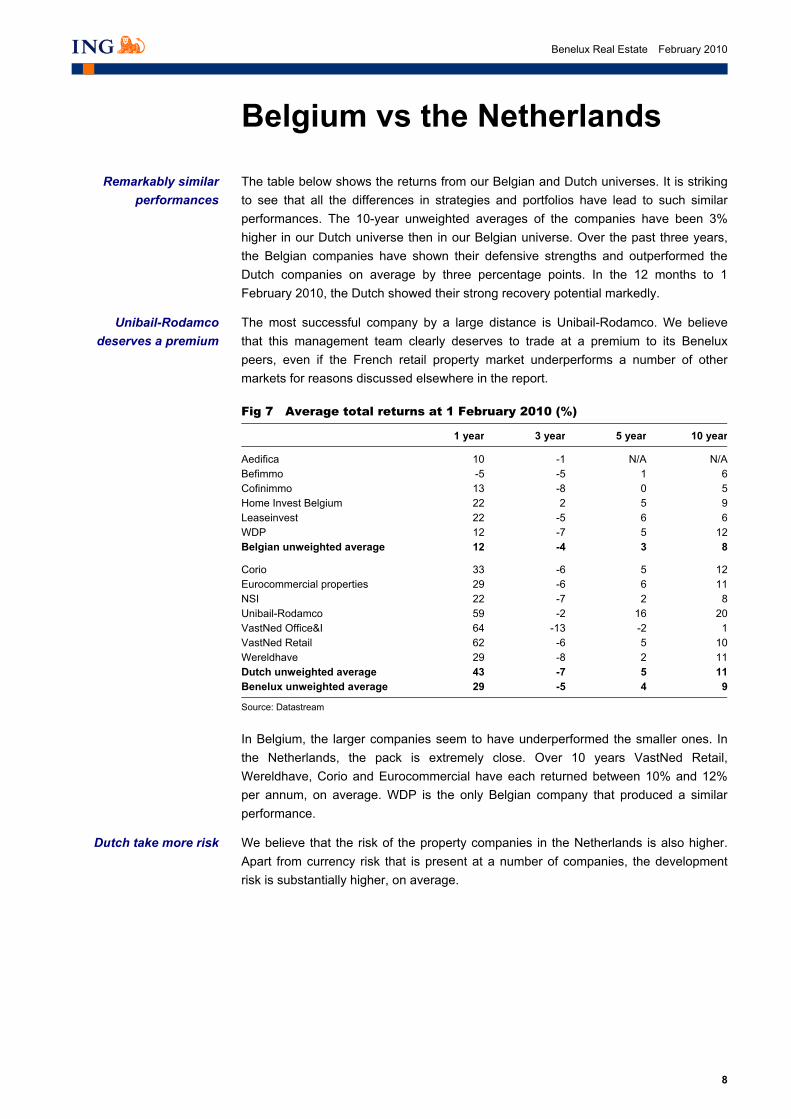
The table below shows the returns from our Belgian and Dutch universes. It is striking to see that all the differences in strategies and portfolios have lead to such similar performances. The 10-year unweighted averages of the companies have been 3% higher in our Dutch universe then in our Belgian universe. Over the past three years, the Belgian companies have shown their defensive strengths and outperformed the Dutch companies on average by three percentage points. In the 12 months to 1 February 2010, the Dutch showed their strong recovery potential markedly.
The most successful company by a large distance is Unibail-Rodamco. We believe that this management team clearly deserves to trade at a premium to its Benelux peers, even if the French retail property market underperforms a number of other markets for reasons discussed elsewhere in the report.
Fig 7 Average total returns at 1 February 2010 (%)
1 year 3 year 5 year 10 year
Aedifica 10 -1 N/A N/ABefimmo -5 -5 1 6Cofinimmo 13 -8 0 5Home Invest Belgium 22 2 5 9Leaseinvest 22 -5 6 6WDP 12 -7 5 12Belgian unweighted average 12 -4 3 8
Corio 33 -6 5 12Eurocommercial properties 29 -6 6 11NSI 22 -7 2 8Unibail-Rodamco 59 -2 16 20VastNed Office&I 64 -13 -2 1VastNed Retail 62 -6 5 10Wereldhave 29 -8 2 11Dutch unweighted average 43 -7 5 11Benelux unweighted average 29 -5 4 9
Source: Datastream
_
In Belgium, the larger companies seem to have underperformed the smaller ones. In the Netherlands, the pack is extremely close. Over 10 years VastNed Retail, Wereldhave, Corio and Eurocommercial have each returned between 10% and 12% per annum, on average. WDP is the only Belgian company that produced a similar performance.
We believe that the risk of the property companies in the Netherlands is also higher. Apart from currency risk that is present at a number of companies, the development risk is substantially higher, on average.
Unibail-Rodamco deserves a premium
Remarkably similar performances
Dutch take more risk

9
Benelux Real Estate February 2010
Fig 8 Unweighted average total returns (%)
12.2
3.9 3.57.9
42.6
6.84.8
10.5
0
510
152025
3035
4045
1 year 3 year 5 year 10 year
Belgium unweighted average Dutch unweighted average
Source: Datastream
_
10
Benelux Real Estate February 2010
Dutch property companies
Although the debt markets are still very discriminating, they have opened up for solvent lenders which bring equity to the table. At the same time, banks have not yet started to force borrowers to liquidate, at least not on a large scale. However, the refinancing of loans that come to an end is a significant issue for a broader recovery of the property markets.
Although in the UK a more pronounced bounce in values is taking place, investors should take into account that the downward valuations in the UK have also been much steeper. The UK value decreases were particularly steeper than in Belgium, where values fell by less than 5%.
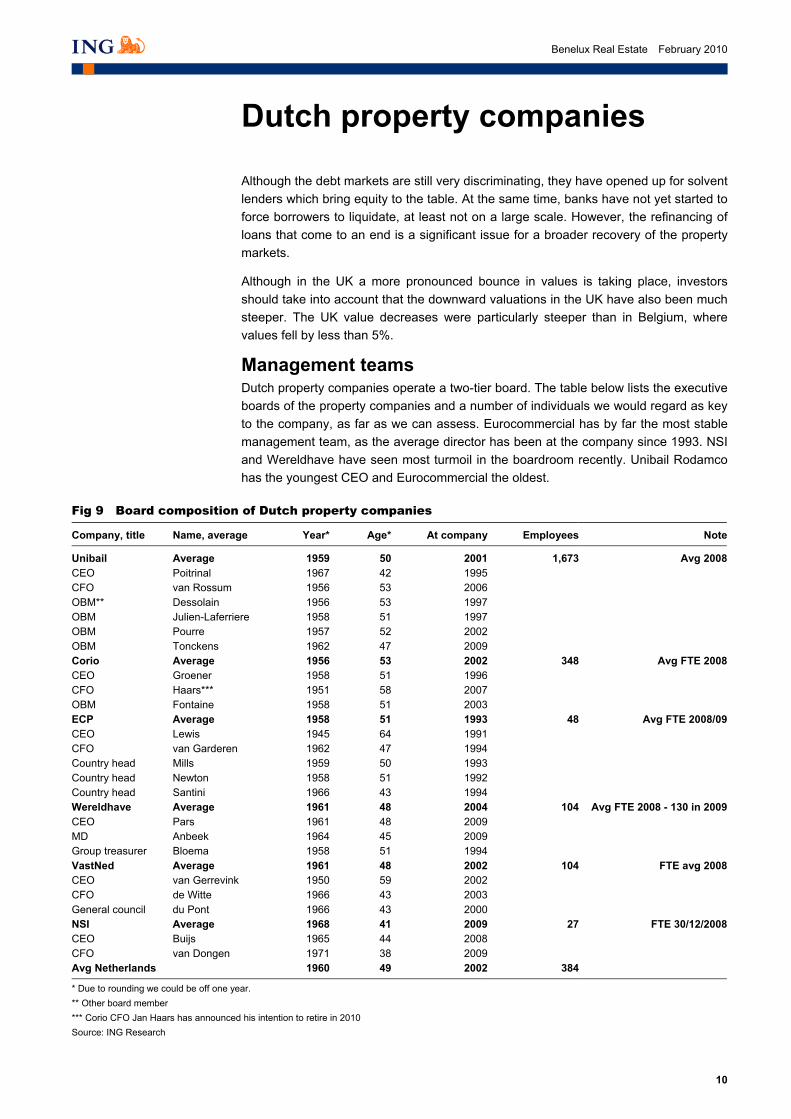
Management teams Dutch property companies operate a two-tier board. The table below lists the executive boards of the property companies and a number of individuals we would regard as key to the company, as far as we can assess. Eurocommercial has by far the most stable management team, as the average director has been at the company since 1993. NSI and Wereldhave have seen most turmoil in the boardroom recently. Unibail Rodamco has the youngest CEO and Eurocommercial the oldest.
Fig 9 Board composition of Dutch property companies
Company, title Name, average Year* Age* At company Employees Note
Unibail Average 1959 50 2001 1,673 Avg 2008CEO Poitrinal 1967 42 1995CFO van Rossum 1956 53 2006OBM** Dessolain 1956 53 1997OBM Julien-Laferriere 1958 51 1997OBM Pourre 1957 52 2002OBM Tonckens 1962 47 2009Corio Average 1956 53 2002 348 Avg FTE 2008CEO Groener 1958 51 1996CFO Haars*** 1951 58 2007OBM Fontaine 1958 51 2003ECP Average 1958 51 1993 48 Avg FTE 2008/09CEO Lewis 1945 64 1991CFO van Garderen 1962 47 1994Country head Mills 1959 50 1993Country head Newton 1958 51 1992Country head Santini 1966 43 1994Wereldhave Average 1961 48 2004 104 Avg FTE 2008 - 130 in 2009CEO Pars 1961 48 2009MD Anbeek 1964 45 2009Group treasurer Bloema 1958 51 1994VastNed Average 1961 48 2002 104 FTE avg 2008CEO van Gerrevink 1950 59 2002CFO de Witte 1966 43 2003General council du Pont 1966 43 2000NSI Average 1968 41 2009 27 FTE 30/12/2008CEO Buijs 1965 44 2008CFO van Dongen 1971 38 2009Avg Netherlands 1960 49 2002 384
* Due to rounding we could be off one year. ** Other board member *** Corio CFO Jan Haars has announced his intention to retire in 2010 Source: ING Research
_

11
Benelux Real Estate February 2010
The chart below highlights the average age of the board members and other key individuals, and the number of people at the company. NSI has the youngest board. With 1,673 full-time equivalent staff, Unibail employs more than four times as many people as Corio, with 348.
Fig 10 Board characteristics and number of employees
5053 51
48 48
41
8 7
16
5 71
0
10
20
30
40
50
60
Unibail Corio ECP Wereldhave VastNed NSI02004006008001,0001,2001,4001,6001,800
Average age Av. years at company Employees rhs
Source: ING Research
_

12
Benelux Real Estate February 2010
Belgian property companies
Belgium currently has 14 quoted property companies that operate the REIT1 structure. These property companies are ranked below, according to portfolio valuation.
Fig 11 Belgian REIT overview in terms of portfolio value (€m)
0500
1,0001,5002,0002,5003,0003,500
Cofinim
mo
Befimmo
WDP
Interv
est O
ffices
Leas
inves
t Rea
l Esta
te
Retail E
states
Wereldh
ave B
elgium
Aedific
a
Interv
est R
etail
Ascenc
io
Home I
nves
t Belg
iumMon
tea
Wareho
use E
states
Belgium
Service
flats
Inves
t
Intervest Offices, Intervest Retail and Wereldhave Belgium are the Belgian subsidiaries of Dutch property companies VastNed Offices/Industrial, VastNed Retail and Wereldhave NV, which are discussed further in this report. Source: ING Research
_
In the table below, we show an overview of the board composition of Belgium’s principal REITs. When compared to the Dutch companies (see below), Belgian property companies’ board members are 9 years older on average, but have comparable experience at the company (7 years).
1 The REIT structure has been implemented in Belgian law as a Sicafi (French equivalent) or a Bevak (Flemish equivalent)
On average, Belgian board members are
older than Dutch board members

13
Benelux Real Estate February 2010
Fig 12 Board composition of Belgian property companies
Company, title Name, average Birth year * Age * At company Employees Real estate assets/
employee (€m)
Aedifica average 1951 59 2006 25 14Chairman Duplat 1937 73 2005 CEO Gielens 1965 45 2005 CFO Kotarakos 1973 37 2007 Befimmo average 1947 63 2000 34 56Chairman De Vos 1953 57 2002 CEO De Blieck 1957 53 1999 OBM ** Vandewalle 1944 66 1995 Cofinimmo average 1952 58 2003 108 28Chairman Dirckx 1936 74 2001 CEO Fautré 1960 50 2002 CFO Carbonnelle 1953 57 1999 Home Invest Belgium average N/A N/A 2007 10 20Chairman Pleeck N/A N/A 2004 CEO Mertens 1956 54 2002 Leasinvest Real Estate average N/A N/A 2001 17 31Chairman Bertrand 1951 59 1999 CEO Appelmans 1953 57 1999 WDP average 1958 52 2002 25 32Chairman Duyck 1950 60 1999 CEO De Pauw 1954 56 1999 CFO Uwents 1969 41 1999
Average Belgium 1952 58 2003 30
* Due to rounding we could be off one year ** Other board member Source: ING research
_
Aedifica is the youngest Belgian property company (founded in 2005) and Cofinimmo is the oldest (founded in 1983) and the largest. Befimmo has the oldest and most seasoned board members.
Fig 13 Board characteristics and number of employees
5963
5852
39 6
38 8
0
10
20
30
40
50
60
70
Aedifica Befimmo Cofinimmo Home InvestBelgium
LeasinvestReal Estate
WDP0
20
40
60
80
100
120
Average age Average years at company Employees RHS
Source: ING research
_
Cofinimmo is Belgium’s largest in terms of
assets, employees and years since
establishment

14
Benelux Real Estate February 2010
Diversification effects of regions and sectors
Several property companies are diversifying across Europe, and Wereldhave is even diversifying into the US. We believe the merits of geographical diversification are exaggerated. Companies should focus on choosing the most attractively priced market and take into account its risk.
The most strikingly high correlation is that between Continental and Dutch retail: 0.98. This means that the addition of continental retail to a Dutch portfolio does not reduce the risk in any significant way. Lowest correlations are those between Dutch offices and Non European retail: 0.51 and Non European office space and Anglo-Saxon retail: 0.47. Wereldhave’s statement that it wants to diversify by having UK and US assets makes sense. The real question is whether investors want to give it the mandate to do so or keep that decision in-house.
Fig 14 Correlations between office and retail market returns
Office Retail Anglo-Saxon Outside of Europe Continental Netherlands Retail
Anglo-Saxon 0.85 0.79 0.54 0.52 Anglo-Saxon Outside of Europe 0.47 0.61 0.86 0.80 Outside of Europe Continental 0.72 0.81 0.87 0.98 Continental Netherlands 0.59 0.51 0.85 0.68 Netherlands Anglo-Saxon Outside of Europe Continental Netherlands
Source: Company data, ING estimates
Correlation between Continental and Dutch
retail: 0.98
Merits of geographical diversification are
exaggerated

15
Benelux Real Estate February 2010
Highlights per company
Belgium Aedifica Aedifica is the second-largest nursing homes REIT in Belgium, after its larger peer Cofinimmo. While the nursing homes (c.46% of the portfolio) add stability to the business model, Aedifica still has considerable cyclical exposure in hotels (10% of the portfolio) and Brussels-based furnished apartments (12% of the portfolio), which rely on short-term rentals. Trading at c.21x FY09/10F PER, we find Aedifica overbought and expect this cyclical exposure to largely offset nursing homes resilience. Showing operating margins of c.70% 2009/10F, we believe Aedifica must grow to become more efficient, gain more international recognition and improve the shares’ liquidity. We find the young management team very ambitious in achieving more growth and expect further nursing home deals, potentially with additional equity issuance. We initiate with a Sell rating and a target price of €33.7.
Befimmo Befimmo is Belgium’s pure play investor in prime offices, and forms part of the BEL-20 index. We believe Befimmo will underperform the offices market in the next 12 months, as it has a large exposure to the c.400,000m² of speculative office space coming on to the market and also has a number of key renovations that will come on stream over 2010-11, which have not yet been let. In addition, the Axento Luxembourg office complex which was recently acquired (value c.€100m) will have its rental guarantee expire at end-2010. We would not be surprised to see considerable lease incentives being used to keep occupancy at decent levels. The weak outlook for the Brussels offices market was confirmed during the FY08/09 results presentation, when management stated it expects decreasing CFPS. We expect a 16% drop in EPS YoY. We prefer Cofinimmo over Befimmo, for a number of reasons put forward below. We maintain a Hold rating, and lower our target price to €60.7.
Cofinimmo Cofinimmo is Belgium’s largest REIT and is also a member of the BEL-20 index. It has an office portfolio that is comparable in size with Befimmo’s. Cofinimmo has an overweight offices position in the Brussels decentralised district, while Befimmo is overweight in the Brussels North district. We would not be surprised if Cofinimmo decreased this overweight position and moved more into nursing homes (currently c.25% of the portfolio), potentially doubling the size of this portfolio. We expect Cofinimmo to outperform Befimmo because of its favourable diversification into nursing homes and pubs, its innovative financing strategy, which has obviated the need for a dilutive rights issue (unlike Befimmo), its corporate governance structure which allows it more flexibility than Befimmo (where AG Insurance has some influence), and the proven management track record. We upgrade to Buy and increase our target price to €109.2.
Home Invest Belgium Home Invest Belgium is Belgium’s focused apartment REIT, and is active primarily in the Brussels area. Unlike its peer, Aedifica, it does not intend to expand into nursing home assets. Trading at c.26x 2010F PER, we believe Home Invest Belgium is overvalued. The current premium valuation to IFRS NAV is not justified, in our view,

16
Benelux Real Estate February 2010
and does not reflect the low liquidity of the stock and the small size of the portfolio (valued at c.€210m) and the low operating margin at c.66%. Home Invest Belgium should present results in English. We initiate with a Sell rating and a target price of €48.0.
Leaseinvest Real Estate Leasinvest Real Estate is Belgium’s diversified offices, retail and logistics company, looking to establish a balanced portfolio of retail assets and offices, spread over Belgium and Luxembourg. In this process, we would not be surprised if the Belgian offices portfolio of c.€160m was sold, to the advantage of retail assets. We like the resilient effect of the addition of committed developments, but are somewhat hesitant about the potentially large influence of Ackermans & van Haaren on the management team. We initiate with a Hold rating and a target price of €60.0.
WDP WDP is Belgium’s leading semi-industrial and logistics player. It has a strong reputation in property development, which has allowed a historical premium valuation to IFRS NAV. It has a c.€50m land reserve and all important building permits in place, making it geared to seize opportunities. WDP currently still has to renegotiate a number of lease expiries and has temporarily halted any speculative developments, limiting the potential for near-term development gains. We do not think WDP currently deserves a premium valuation as high as its historical average and stick to a 5% premium valuation to IFRS NAV 2010F. We downgrade to Hold from Buy and reduce our target price to €28.2.
Netherlands Corio All eyes are on the deal with Multi, in particular on the size and the entry yield. Also it will be interesting to see if the parties can reach agreement over assets outside Germany. In our recent note we have calculated the impact on EPS and NAV of the deal, when financed with debt. CFO Jan Haars will leave the company in May.
We have analysed the sensitivities of EPS and NAV per share for a number of Multi portfolio sizes and acquisition yields. The table below highlights Corio’s 2010F EPS sensitivity to vacancy rate and like for like rental growth.
Sensitivity of our 2010F EPS adj to vacancy rates and LfL (€)
0% 1% 2% 3% 4% 5% 6% 7%-1% 0.09 0.05 0.00 -0.05 -0.09 -0.14 -0.18 -0.230% 0.14 0.09 0.04 0.00 -0.05 -0.09 -0.14 -0.191% 0.18 0.13 0.09 0.04 0.00 -0.05 -0.10 -0.142% 0.22 0.18 0.13 0.09 0.04 -0.01 -0.05 -0.103% 0.27 0.22 0.18 0.13 0.08 0.04 -0.01 -0.054% 0.31 0.27 0.22 0.17 0.13 0.08 0.04 -0.015% 0.36 0.31 0.26 0.22 0.17 0.13 0.08 0.036% 0.40 0.35 0.31 0.26 0.22 0.17 0.12 0.08
Source: ING
We upgrade Corio from Hold to Buy, PT unchanged at €50.
Eurocommercial Properties Eurocommercial is going to maintain its steady course. It has such a low vacancy rate that it may underperform in a V-shaped recovery. Also it will feel the effect of a sharp drop in indexation in France and Sweden. Our model has not been updated for the
Upgrade to Buy, PT unchanged
17
Benelux Real Estate February 2010
reported numbers, but investors will hardly notice the difference. Investors with a pessimistic outlook should overweight this stock in their real estate stock portfolio. We initiate with a Buy rating and a price target of €31.80.
NSI NSI is looking for sizeable acquisition opportunities, primarily in France, and potentially needs additional equity to grow, in our view. The new CEO wants to achieve a turnaround by adding and in-sourcing development and creating a balanced portfolio over the Netherlands, Switzerland and France. We look forward to hearing more about the letting progress at NSI. We initiate with a Hold rating and a price target of €13.
Unibail-Rodamco We believe that Unibail demonstrated it had the strongest company and the winning business model in the downturn. If Unibail aims to outperform in an upturn, it probably needs to change its portfolio or business model. The split of Liberty may be an idea to consider, so that highly lucrative office opportunities do not compete for capital with strategic retail acquisitions.
The recent €715m deal with Simon is hard to interpret as yields have not been disclosed. Excluding the capital expenditure on the stakes in the six developments, the capital outlay is below 4% off the balance sheet. The crucial question for Unibail is at what stage size becomes a handicap as the flexibility decreases. We will initiate on Unibail Rodamco shortly.
VastNed Office & Industrial VastNed Office and Industrial is the stock with the highest vacancy rate in the Netherlands. Although we believe that the Dutch office markets are going to recover very slowly, we believe that the stock offers good value at 26% below IFRS 2010F. We initiate with a Buy rating and a price target of €16.20.
VastNed Retail VastNed Retail offers good operational upside from the retail property companies as a result of its 3% vacancy rate and 6% reversionary potential. The Spanish weighting of 26% will hold back a strong recovery. This is a good stock for the optimistic investor. The dividend yield of 8.7% seems unsustainable to us but consensus is already pointing in this direction. With €4.06, we are more optimist about 2009 EPS then consensus (€3.95) and the company (€4.00). We initiate with a Buy and a price target of €50.65.
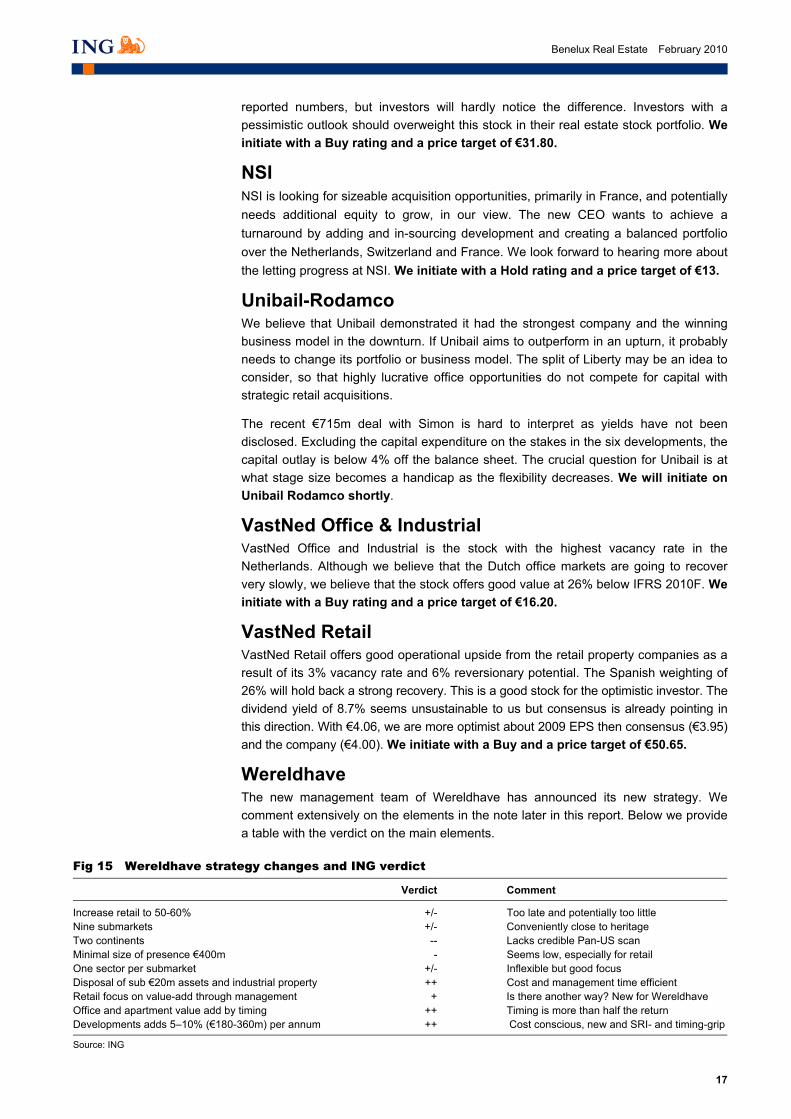
Wereldhave The new management team of Wereldhave has announced its new strategy. We comment extensively on the elements in the note later in this report. Below we provide a table with the verdict on the main elements.
Fig 15 Wereldhave strategy changes and ING verdict
Verdict Comment
Increase retail to 50-60% +/- Too late and potentially too little Nine submarkets +/- Conveniently close to heritage Two continents -- Lacks credible Pan-US scan Minimal size of presence €400m - Seems low, especially for retail One sector per submarket +/- Inflexible but good focus Disposal of sub €20m assets and industrial property ++ Cost and management time efficient Retail focus on value-add through management + Is there another way? New for Wereldhave Office and apartment value add by timing ++ Timing is more than half the return Developments adds 5–10% (€180-360m) per annum ++ Cost conscious, new and SRI- and timing-grip
Source: ING _
18
Benelux Real Estate February 2010
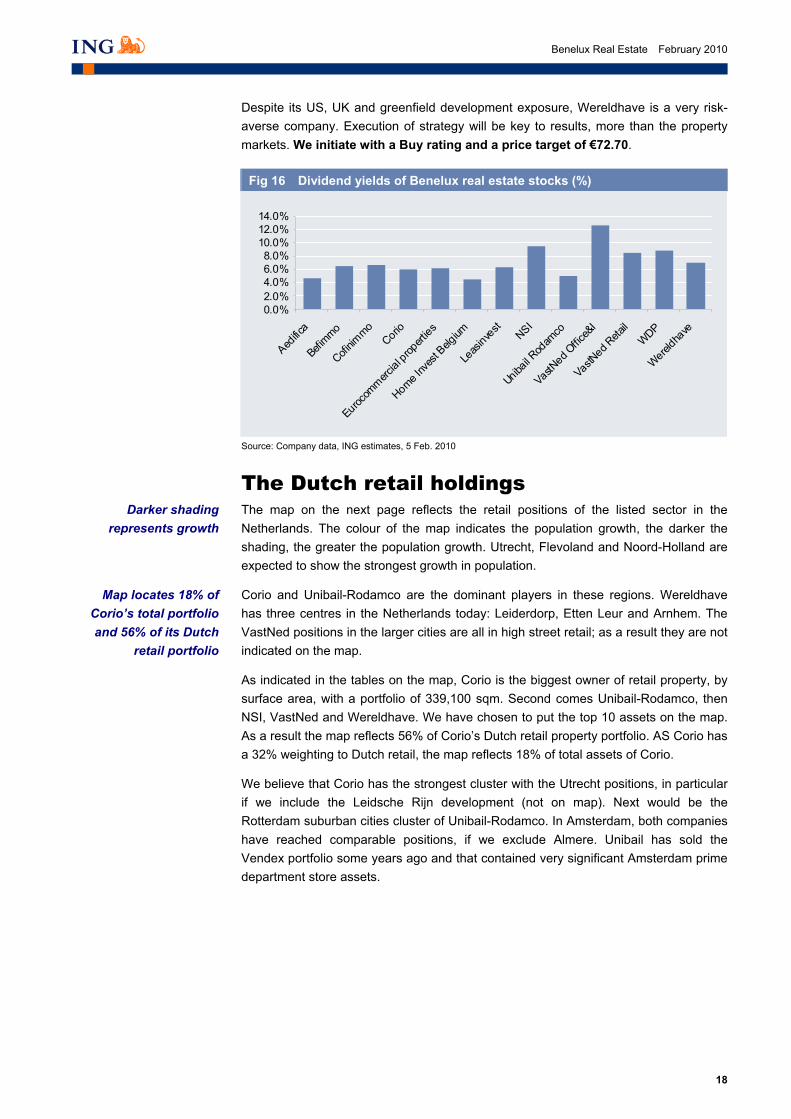
Despite its US, UK and greenfield development exposure, Wereldhave is a very risk-averse company. Execution of strategy will be key to results, more than the property markets. We initiate with a Buy rating and a price target of €72.70.
Fig 16 Dividend yields of Benelux real estate stocks (%)
0.0%2.0%4.0%6.0%8.0%
10.0%12.0%14.0%
Aedific
a
Befimmo
Cofinim
moCorio
Eurocom
mercial p
ropert
ies
Home Inv
est B
elgium
Leas
invest NSI
Unibail R
odam
co
VastNed O
ffice&
I
VastNed R
etail
WDP
Wereldha
ve
Source: Company data, ING estimates, 5 Feb. 2010
_
The Dutch retail holdings The map on the next page reflects the retail positions of the listed sector in the Netherlands. The colour of the map indicates the population growth, the darker the shading, the greater the population growth. Utrecht, Flevoland and Noord-Holland are expected to show the strongest growth in population.
Corio and Unibail-Rodamco are the dominant players in these regions. Wereldhave has three centres in the Netherlands today: Leiderdorp, Etten Leur and Arnhem. The VastNed positions in the larger cities are all in high street retail; as a result they are not indicated on the map.
As indicated in the tables on the map, Corio is the biggest owner of retail property, by surface area, with a portfolio of 339,100 sqm. Second comes Unibail-Rodamco, then NSI, VastNed and Wereldhave. We have chosen to put the top 10 assets on the map. As a result the map reflects 56% of Corio’s Dutch retail property portfolio. AS Corio has a 32% weighting to Dutch retail, the map reflects 18% of total assets of Corio.
We believe that Corio has the strongest cluster with the Utrecht positions, in particular if we include the Leidsche Rijn development (not on map). Next would be the Rotterdam suburban cities cluster of Unibail-Rodamco. In Amsterdam, both companies have reached comparable positions, if we exclude Almere. Unibail has sold the Vendex portfolio some years ago and that contained very significant Amsterdam prime department store assets.
Darker shading represents growth
Map locates 18% of Corio’s total portfolio and 56% of its Dutch
retail portfolio

19
Benelux R
eal Estate
February 2010
Fig 17 Dutch retail holdings of the Dutch companies
WereldhaveWinkelcentrum Kronenburg (Arnhem) 31752Winkelcentrum Etten-Leur (Etten-Leur) 22146Winkelcentrum Winkelhof (Leiderdorp) 17857Kerk (Geldrop) 4537
Owner Name centre (Location) sqmHoog Catherijne (Utrecht)Villa ArenA (Amsterdam)Alexandrium I (Rotterdam)Presikhaaf (Arnhem)Cityplaza (Nieuwegein)Middenwaard (Heerhugowaard)Pieter Vreedeplein (Tilburg)In de Bogaard (Rijswijk)Emiclaer (Amersfoort)Corio Center (Heerlen)
67300504004610031500291002890027900198001970018400
Corio Novicenter (Alphen a/d Rijn) 9360Het Rietveld (Apeldoorn) 23890Hoofddorp 1958Leiderdorp 5807Middelburg 20363Oostplein (Roosendaal) 10366Veenendaal 19539Hagenborgh (Almelo) 9215t Loon (Heerlen) 25177Zevenkamp (Rotterdam) 9943
NSIOwner Name centre (Location) sqm
Unibail- Stadshart (Almere) 19900Stadshart (Zoetermeer) 50300Stadshart (Amstelveen) 48200De Bossche Boulevard (Den Bosch) 39200Vier Meren (Hoofddorp) 31600Piazza Center (Eindhoven) 23900Leidsenhage (Leidschendam) 21700Eggert Winkelcentrum (Purmerend 19900St. Jorisplein (Amersfoort) 1717300Carnisse Veste (Barendrecht) 15900
Owner Name centre (Location) sqm
Zoetermeer 2482
Roermond 34098Het rond (Houten) 27991Capelle a/d Ijssel 13702Wageningen 6058Vuldersbrink (Harderwijk) 4735Eindhoven 3102Doorwerth 2854Tilburg 2696Zoetermeer 2274
VastNedRetail
Owner Name centre (Location) sqm
WereldhaveWinkelcentrum Kronenburg (Arnhem) 31752Winkelcentrum Etten-Leur (Etten-Leur) 22146Winkelcentrum Winkelhof (Leiderdorp) 17857Kerk (Geldrop) 4537
WereldhaveWinkelcentrum Kronenburg (Arnhem) 31752Winkelcentrum Etten-Leur (Etten-Leur) 22146Winkelcentrum Winkelhof (Leiderdorp) 17857Kerk (Geldrop) 4537
Owner Name centre (Location) sqmHoog Catherijne (Utrecht)Villa ArenA (Amsterdam)Alexandrium I (Rotterdam)Presikhaaf (Arnhem)Cityplaza (Nieuwegein)Middenwaard (Heerhugowaard)Pieter Vreedeplein (Tilburg)In de Bogaard (Rijswijk)Emiclaer (Amersfoort)Corio Center (Heerlen)
67300504004610031500291002890027900198001970018400
CorioOwner Name centre (Location) sqm
Hoog Catherijne (Utrecht)Villa ArenA (Amsterdam)Alexandrium I (Rotterdam)Presikhaaf (Arnhem)Cityplaza (Nieuwegein)Middenwaard (Heerhugowaard)Pieter Vreedeplein (Tilburg)In de Bogaard (Rijswijk)Emiclaer (Amersfoort)Corio Center (Heerlen)
67300504004610031500291002890027900198001970018400
Corio Novicenter (Alphen a/d Rijn) 9360Het Rietveld (Apeldoorn) 23890Hoofddorp 1958Leiderdorp 5807Middelburg 20363Oostplein (Roosendaal) 10366Veenendaal 19539Hagenborgh (Almelo) 9215t Loon (Heerlen) 25177Zevenkamp (Rotterdam) 9943
NSIOwner Name centre (Location) sqm
Novicenter (Alphen a/d Rijn) 9360Het Rietveld (Apeldoorn) 23890Hoofddorp 1958Leiderdorp 5807Middelburg 20363Oostplein (Roosendaal) 10366Veenendaal 19539Hagenborgh (Almelo) 9215t Loon (Heerlen) 25177Zevenkamp (Rotterdam) 9943
NSINSIOwner Name centre (Location) sqm
Unibail- Stadshart (Almere) 19900Stadshart (Zoetermeer) 50300Stadshart (Amstelveen) 48200De Bossche Boulevard (Den Bosch) 39200Vier Meren (Hoofddorp) 31600Piazza Center (Eindhoven) 23900Leidsenhage (Leidschendam) 21700Eggert Winkelcentrum (Purmerend 19900St. Jorisplein (Amersfoort) 1717300Carnisse Veste (Barendrecht) 15900
Owner Name centre (Location) sqmUnibail- Stadshart (Almere) 19900
Stadshart (Zoetermeer) 50300Stadshart (Amstelveen) 48200De Bossche Boulevard (Den Bosch) 39200Vier Meren (Hoofddorp) 31600Piazza Center (Eindhoven) 23900Leidsenhage (Leidschendam) 21700Eggert Winkelcentrum (Purmerend 19900St. Jorisplein (Amersfoort) 1717300Carnisse Veste (Barendrecht) 15900
Owner Name centre (Location) sqm
Zoetermeer 2482
Roermond 34098Het rond (Houten) 27991Capelle a/d Ijssel 13702Wageningen 6058Vuldersbrink (Harderwijk) 4735Eindhoven 3102Doorwerth 2854Tilburg 2696Zoetermeer 2274
VastNedRetail
Owner Name centre (Location) sqm
Source: ING _

20
Benelux Real Estate February 2010
The Dutch property markets
We believe that the Dutch retail and office markets may underperform most other markets in Europe for a number of reasons. Retail markets will feel the pressure of existing and on-stream oversupply. In addition, Dutch internet literacy is likely to be above the European average, resulting in a greater e-commerce impact. Dutch property companies have limited exposure to the Dutch retail markets, as illustrated in the table below. ECP has no exposure.
Fig 18 Dutch retail weightings of property companies
0%5%
10%15%20%25%30%35%40%45%50%
Corio VastNed Retail Unibail-Rodamco
Wereldhave NSI
Source: Company data, ING estimates
_
The office markets also suffer from occupants that have too much space and will not let additional space even when they are hiring. Subletting is another factor slowing the recovery. The Dutch office players VastNed O&I and NSI therefore need to focus on their vacancies and reduce these numbers.
The Dutch property markets have performed well in the past 10 years. According to ROZ/IPD, no single real estate category posted negative returns in any year since 2000. 2009 is set to become the worst year of the past decade, but after three quarters all categories were still posting positive total returns. The other weak year was 2003, when retail posted 9.2% and office space produced a 5.2% total return.
The quality of the numbers is sometimes in doubt, as the institutional holders of real estate that contribute to the database have interest in the outcome and are often rewarded partly on the basis of their relative performance. Nevertheless, we believe that these data offer a valuable view of historic returns.
Fig 19 ROZ/IPD property returns 2001-09 (%)
Total returns 2001 2002 2003 2004 2005 2006 2007 2008 1Q09 2Q09 3Q09 9M09
Retail 9.9 9.8 9.2 10.3 13.5 14.9 13.4 5.5 0.5 0.1 0.9 1.5Office 12.0 8.3 5.2 5.5 7.0 11.5 11.3 0.9 0.6 0.5 0.6 1.7Industrial 10.5 9.5 6.4 8.5 11.1 13.0 11.7 4.0 1.0 0.4 1.1 2.5Residential 12.1 8.4 7.1 7.6 10.1 11.4 9.6 2.8 0.5 1.6 0.3 2.4Mixed use 11.1 10.5 10.1 8.6 11.9 13.2 13.1 8.5 1.5 0.4 1.1 3.0All property 11.4 8.8 7.1 7.8 10.2 12.5 11.3 3.3 0.2 0.9 0.6 1.7
Source: ROZ/IPD _
A very strong decade
Weak Dutch property performance does not necessarily suffocate
returns
From location, location, location to LETTING,
LETTING, LETTING

21
Benelux Real Estate February 2010
For the listed sector, the relevant question is whether to overweight office or retail space. The chart below gives the different returns over the past 10 years. It is clear that retail has dramatically outperformed office space in the Netherlands. The average outperformance has been c 2.7% per annum.
One underlying factor has no doubt been that 10 years ago retail was valued at a higher yield than office space and that gap has been closed or even reversed in several cases. Another reason is that institutional portfolios were likely to be underweight retail 10 years ago and the catch up resulted in a re-pricing.
We believe that the outperformance may have come to an end as the yield catch up effect is over and institutional investors have had ample time to reach their desired weightings.
Fig 20 Retail Total Return -/- Office Total Return (%)
-3.0-2.0-1.00.01.02.03.04.05.06.07.0
2001 2002 2003 2004 2005 2006 2007 2008 2009 9m
Retail TR -/- Office TR
Source: ROZ/IPD, ING Research
_
If we look at the rebased compound returns per real estate sector the picture below emerges. Mixed use and other property have outperformed, closely followed by retail. The office sector performed worst in the Netherlands.
Fig 21 Rebased total returns Dutch real estate 2000-09
100
120
140
160
180
200
220
240
260
2000 2001 2002 2003 2004 2005 2006 2007 2008 20099m
Retail Office Industrial Residential Mixed use/other
Source: ROZ/IPD
_
Office underperformed all other sectors in the
Netherlands in the past 10 years
Retail outperformance drivers are changing
Retail outperformed office space by 2.7% on
average
Catch up is over, underweight is
corrected
22
Benelux Real Estate February 2010
Industrial outperformed offices every year but 2001, on average by c 1.5%. So the heavy Wereldhave distribution weighting in the Netherlands seems reasonably well founded.
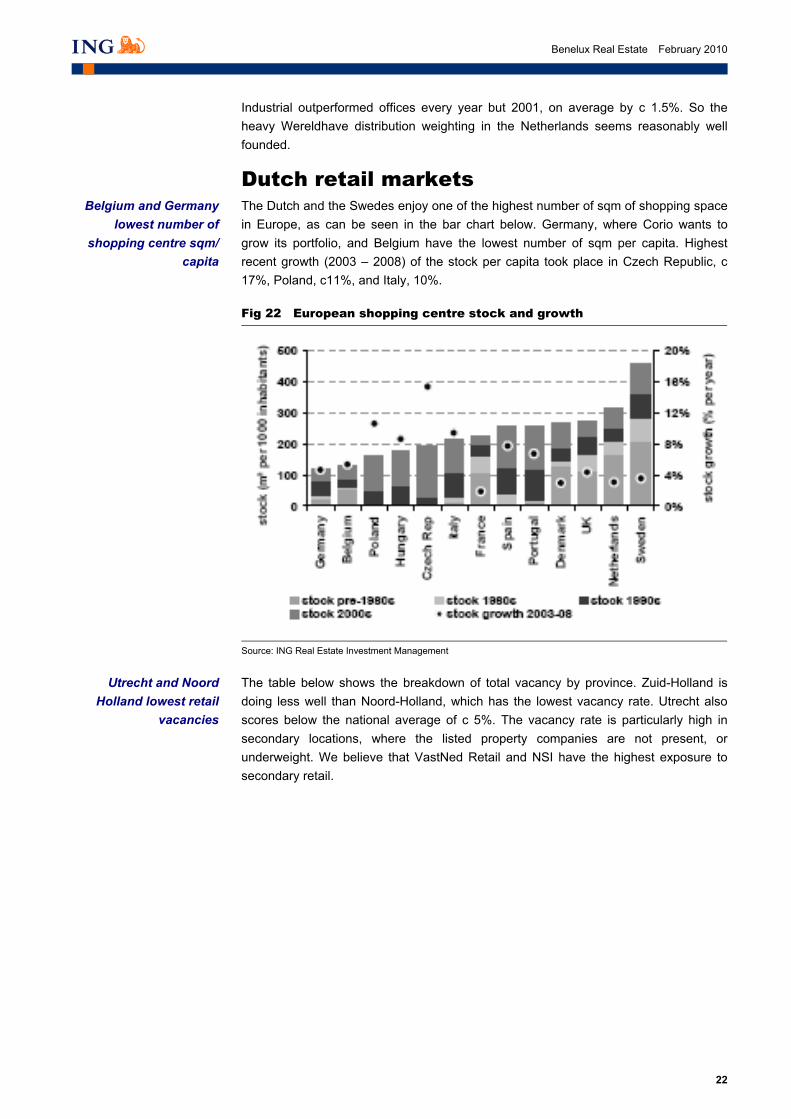
Dutch retail markets The Dutch and the Swedes enjoy one of the highest number of sqm of shopping space in Europe, as can be seen in the bar chart below. Germany, where Corio wants to grow its portfolio, and Belgium have the lowest number of sqm per capita. Highest recent growth (2003 – 2008) of the stock per capita took place in Czech Republic, c 17%, Poland, c11%, and Italy, 10%.
Fig 22 European shopping centre stock and growth
Source: ING Real Estate Investment Management
_
The table below shows the breakdown of total vacancy by province. Zuid-Holland is doing less well than Noord-Holland, which has the lowest vacancy rate. Utrecht also scores below the national average of c 5%. The vacancy rate is particularly high in secondary locations, where the listed property companies are not present, or underweight. We believe that VastNed Retail and NSI have the highest exposure to secondary retail.
Utrecht and Noord Holland lowest retail
vacancies
Belgium and Germany lowest number of
shopping centre sqm/ capita

23
Benelux Real Estate February 2010
Fig 23 Vacancy rates by Dutch province
0 20 40 60 80 100 120 140 160 180
Noord-Holland
Friesland
Utrecht Provincie
Flevoland
Drenthe
Gelderland
Total/average
Groningen
Zuid-Holland
Noord-Brabant
Overijssel
Zeeland
Limburg
Vacancy rate (national average = 100)
Source: Locatus
_
Retail vacancies in larger cities are lower than those in the provinces. The chart below shows that in particular Rotterdam has retail space is seeing a lot of vacancy. Utrecht, where Corio has its Hoog Catharijne re-development, has a low vacancy, also when taken into account that it is the smallest of the four cities. Further Corio positions in the Utrecht region are the Nieuwegein extension and the Leidsche Rijn shopping centre.
Fig 24 Retail vacancies (in sqm) in larger Dutch cities
0
10
20
30
40
50
60
70
80
2001 2002 2003 2004 2005 2006 2007 2008 2009 Q3
Amsterdam Rotterdam the Hague Utrecht
Source: Locatus
_
Larger cities have lower retail vacancies

24
Benelux Real Estate February 2010
From a supply point of view, the Dutch situation hardly seems attractive for investors as The Netherlands has 80sqm per 1,000 inhabitants in the pipeline, either under construction or planned with full/outline planning permission or building permit. Germany and Belgium have the smallest pipeline per capita. This makes those markets attractive. Wereldhave is one of the larger retail developers in Belgium.
Fig 25 Shopping centre pipeline per capita
Source: ING Real Estate Investment Management
_
Office markets The Dutch office markets are characterised by a fairly relaxed planning regime and a consequently high vacancy rate. In 2009 take up fell in Amsterdam and Rotterdam but rose in Utrecht and The Hague, which are dominated by government-related occupiers. Supply continued to come onto to the market in Amsterdam, which added more than 10% to stock. In the other cities additional supply was limited.
Fig 26 Big four take up
Fig 27 Big four supply
0
50100
150200
250300
Amsterdam Rotterdam T he Hague Utrecht
2008 2009
0
200400600800
100012001400
Amsterdam Rotterdam T he Hague Utrecht
2008 2009
Source: CBRE February 2010 Source: CBRE February 2010
_
We do not expect to see a sharp recovery in office space as many occupants are likely to have too much space, and even if they start to hire, they will not rent more space. In addition, the numbers below do not reflect the subletting market, where quality space can often be rented for attractive rents.
Relaxed planning and high vacancy rates
Very significant retail supply ahead in NL
Belgium and Germany
very restrictive
Subletting and oversized contracts will
slow recovery

25
Benelux Real Estate February 2010
Fig 28 Vacant office space since 2005 (sqm *1,000)
2005 2006 2007 2008 1Q09 2Q09 3Q09
Region Amsterdam 1,361 1,240 1,141 1,049 1,122 1,065 1,121 Region Rotterdam 511 491 464 339 408 340 354 Region Den Haag 460 463 464 546 580 533 544 Region Utrecht 313 361 365 303 305 315 305 Groningen 160 137 128 132 132 132 135 Friesland 65 53 43 48 48 46 46 Drenthe 58 63 31 44 44 46 45 Overijssel 218 236 228 274 273 272 272 Gelderland 449 455 446 448 448 458 473 Utrecht Provincie 500 515 457 546 546 547 552 Flevoland 104 84 127 154 154 151 145 Noord-Holland 561 523 501 593 592 569 534 Zuid-Holland 378 413 365 387 387 417 431 Zeeland 20 21 10 12 12 12 11 Noord-Brabant 639 619 564 534 534 495 519 Limburg 161 165 180 202 202 216 223 Total 5,958 5,836 5,511 5,608 5,786 5,614 5,710
Source: We're Amsterdam
_
Total vacant space stayed more or less stable around 5.7m sqm. From the table below it can be seen that the take up is slowly moving up on a national level.
Fig 29 Dutch office space take-up (sqm *1,000)
1Q09 2Q09 3Q09
Region Amsterdam 85 97 29 Region Rotterdam 30 23 27 Region Den Haag 97 - 10 Region Utrecht 17 12 16 Groningen 9 3 5 Friesland 1 14 6 Drenthe 3 1 17 Overijssel 9 23 4 Gelderland 35 81 110 Utrecht Provincie 40 67 26 Flevoland 3 4 37 Noord-Holland 21 16 45 Zuid-Holland 38 23 36 Zeeland - - 2 Noord-Brabant 28 130 200 Limburg 33 60 18 Total 445 553 587
Source: We're Amsterdam

26
Benelux Real Estate February 2010
The Belgian property markets
Belgium has a relatively short history of IPD data. We outline the results below.
Fig 30 IPD Belgian property returns 2005-08 (%)
0
2
4
6
8
10
12
14
16
2005 2006 2007 2008
Tota
l ret
urn
per a
nnum
(%)
All property Retail Offices Logistics/Industrial Other
Source: IPD
_
Annualised IPD returns per asset type are depicted above. Retail showed the strongest performance, generating a total annualised return of 10% in 2008. Offices and logistics/industrial property showed strong income returns, but took large hits in capital growth over 2008. No 2009 figures have been published yet.
Fig 31 IPD Belgian property return 2008: income versus capital growth
Fig 32 IPD Belgian property index composition
-4
-20
2
46
810
All prop
erty
Retail
Office
Logis
tics/In
dustr
ialOthe
r
Annu
aliz
ed re
turn
(%)
Income return Capital growth
Retail22%
Offices65%
Residential6%
Other3%
Logistics/Industrial4%
Source: IPD Source: IPD
_
The composition of the Belgian IPD index shows a large weighting of the offices property market and a low weighting of the retail property market. Compared to the Netherlands, which has c.300-350 sqm of retail property per 1,000 inhabitants, Belgium has a substantially lower retail property stock of 100-150 sqm per 1,000 inhabitants (see “The Dutch retail markets” for a full overview).
IPD historical performance
Lower retail stock and higher offices stock
compared to the Netherlands

27
Benelux Real Estate February 2010
The Brussels offices market
The Brussels office market is touching record high vacancy rates at >12%. Large speculative delivery of additional office space, significant lease incentives and decreasing like-for-like rental growth are the key issues for 2010-11.
We believe property values are stabilising, looking at key players Cofinimmo and Befimmo showing property fair value adjustments of -0.5% and +0.9% respectively during the quarter to end-September.
Large speculative deliveries and a persistently increasing market vacancy rate have been favourable for tenants, who have been able to negotiate lower rental levels and lease incentives. Taking into account a Brussels offices market stock of c.12.9m sqm, we estimate there is c.400,000 sqm to be added over 2010-2011, most of which is speculative.
We strongly believe landowners will have to give additional lease incentives to their tenants in order to prevent vacancy rates rising (even further). An example is the letting of the recently delivered 27,000 sqm City Link office project of Cofinimmo in the East Singel district (south of the Antwerp centre district) during 4Q09 to several tenants, for which we believe attractive incentives must have been offered.
During the communication of its FY08/09 results November 2009, Befimmo expressed concern about the deteriorating Brussels offices market - primarily driven by the high speculative deliveries - by decreasing its outlook for CFPS by 5% from €5.15 FY08/09 to €4.88 FY09/10 and €4.24 FY10/11 (-13% Y-o-Y).
Cofinimmo and Befimmo’s positioning We have calculated that Cofinimmo has an overweight position in the Brussels Decentralised district, while Befimmo is overweight in the Brussels North district. For a complete comparison of both companies, please refer to the investment case section of Cofinimmo.
Fig 33 Cofinimmo and Befimmo overweight and underweight areas
-15.0 -10.0 -5.0 0.0 5.0 10.0 15.0 20.0 25.0
Centre
Midi
North
Leopold
Louise
Decentralised
Periphery
%
Cofinimmo Befimmo
Source: Company data, ING estimates _
In the appendix, we have provided an overview of the Belgian and Dutch Cofinimmo portfolio, the Brussels Befimmo portfolio and the Brussels Leasinvest Real Estate portfolio. In our view, the Belgian Leasinvest Real Estate portfolio is more focused on
Stabilising valuations for prime offices
Focus will be on letting…
…at decent rental levels
28
Benelux Real Estate February 2010
smaller offices and retail assets in secondary cities, which makes it not comparable to Cofinimmo and Befimmo.
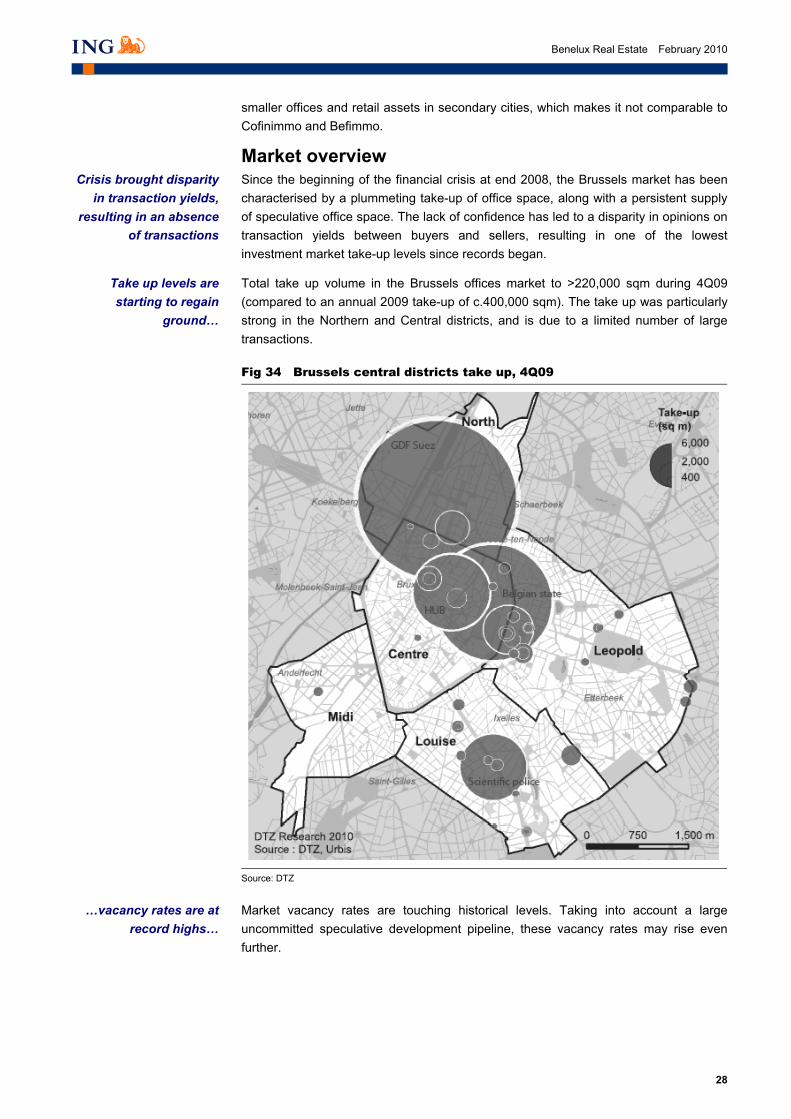
Market overview Since the beginning of the financial crisis at end 2008, the Brussels market has been characterised by a plummeting take-up of office space, along with a persistent supply of speculative office space. The lack of confidence has led to a disparity in opinions on transaction yields between buyers and sellers, resulting in one of the lowest investment market take-up levels since records began.
Total take up volume in the Brussels offices market to >220,000 sqm during 4Q09 (compared to an annual 2009 take-up of c.400,000 sqm). The take up was particularly strong in the Northern and Central districts, and is due to a limited number of large transactions.
Fig 34 Brussels central districts take up, 4Q09
Source: DTZ
_
Market vacancy rates are touching historical levels. Taking into account a large uncommitted speculative development pipeline, these vacancy rates may rise even further.
Crisis brought disparity in transaction yields,
resulting in an absence of transactions
Take up levels are starting to regain
ground…
…vacancy rates are at record highs…

29
Benelux Real Estate February 2010
Fig 35 Brussels central districts take up (sqm)
Fig 36 Brussels central districts vacancy rates (%)
0
40,000
80,000
120,000
160,000
200,000
240,000
Q204
Q404
Q205
Q405
Q206
Q406
Q207
Q407
Q208
Q408
Q209
Q409
sq m
Leopold Midi Centre North Louise
0%1%2%3%4%5%6%7%8%9%
10%11%12%13%14%
Q204
Q404
Q205
Q405
Q206
Q406
Q207
Q407
Q208
Q408
Q209
Q409
Leopold Midi Centre North Louise
Source: DTZ Source: DTZ
_
Although headline prime rents seem to have decreased just a little over the last few quarters, these face-value rents should be compensated by a large number of lease incentives that are often given in return for long-term lease contracts.
Below, we illustrate the longer-term trend of office rents in Brussels. In the past five years, rents have hardly ever moved up in any of the submarkets. This is also true of the ‘good years’ in 2004-2007. The highest rents are being paid in the Leopold quarter.
Fig 37 Brussels pipeline overview (sqm)
Fig 38 Central Brussels prime rents (€/sqm/year)
020,00040,00060,00080,000
100,000120,000140,000160,000180,000
2008
, 4
2009
, 1
2009
, 2
2009
, 3
2009
, 4
2010
, 1
2010
, 2
2010
, 3
sq m
Speculative Committed
100120140160180200220240260280300320
Q204
Q404
Q205
Q405
Q206
Q406
Q207
Q407
Q208
Q408
Q209
Q409
€/sq m/year
Leopold Midi Centre North Louise
Source: DTZ Source: DTZ
_
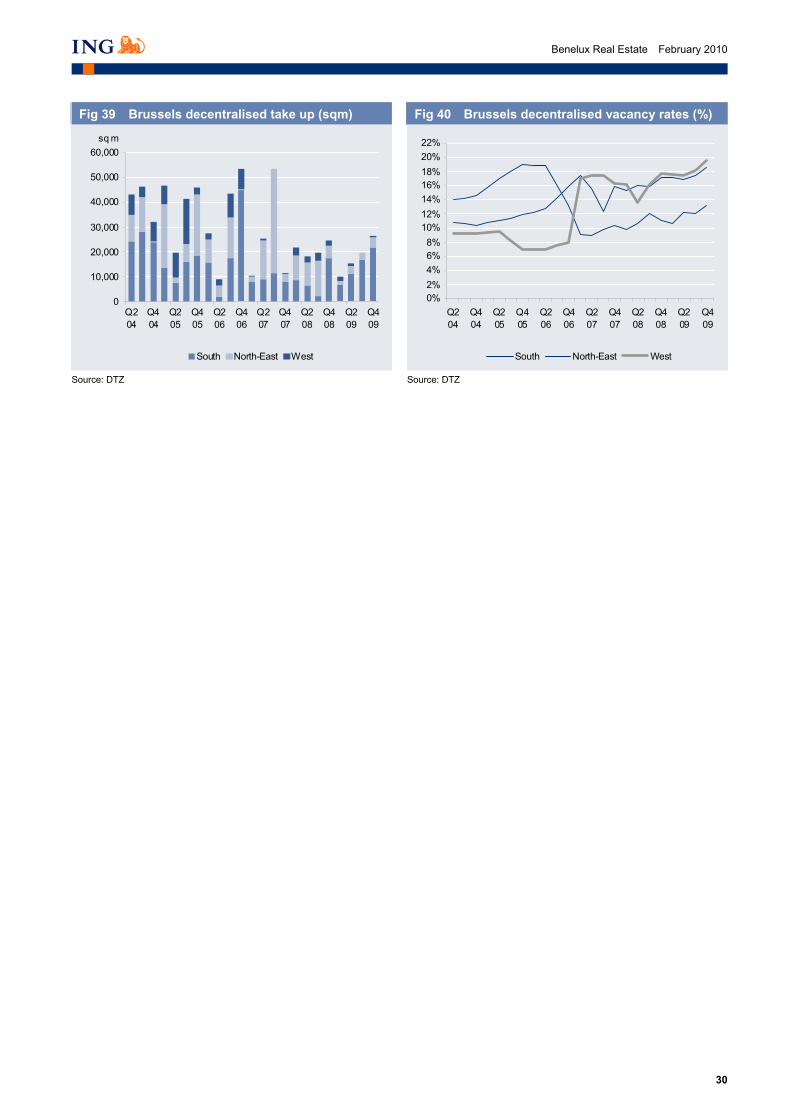
In the decentralised district, take up has also increased in 4Q09, but is still much below average. Activity was strongest in the South district. Vacancy levels here are also touching historical levels.
…prime rents do not take incentives into
account
30
Benelux Real Estate February 2010
Fig 39 Brussels decentralised take up (sqm)
Fig 40 Brussels decentralised vacancy rates (%)
0
10,000
20,000
30,000
40,000
50,000
60,000
Q204
Q404
Q205
Q405
Q206
Q406
Q207
Q407
Q208
Q408
Q209
Q409
sq m
South North-East West
0%2%4%6%8%
10%12%14%16%18%20%22%
Q204
Q404
Q205
Q405
Q206
Q406
Q207
Q407
Q208
Q408
Q209
Q409
South North-East West
Source: DTZ Source: DTZ _
31
Benelux Real Estate February 2010
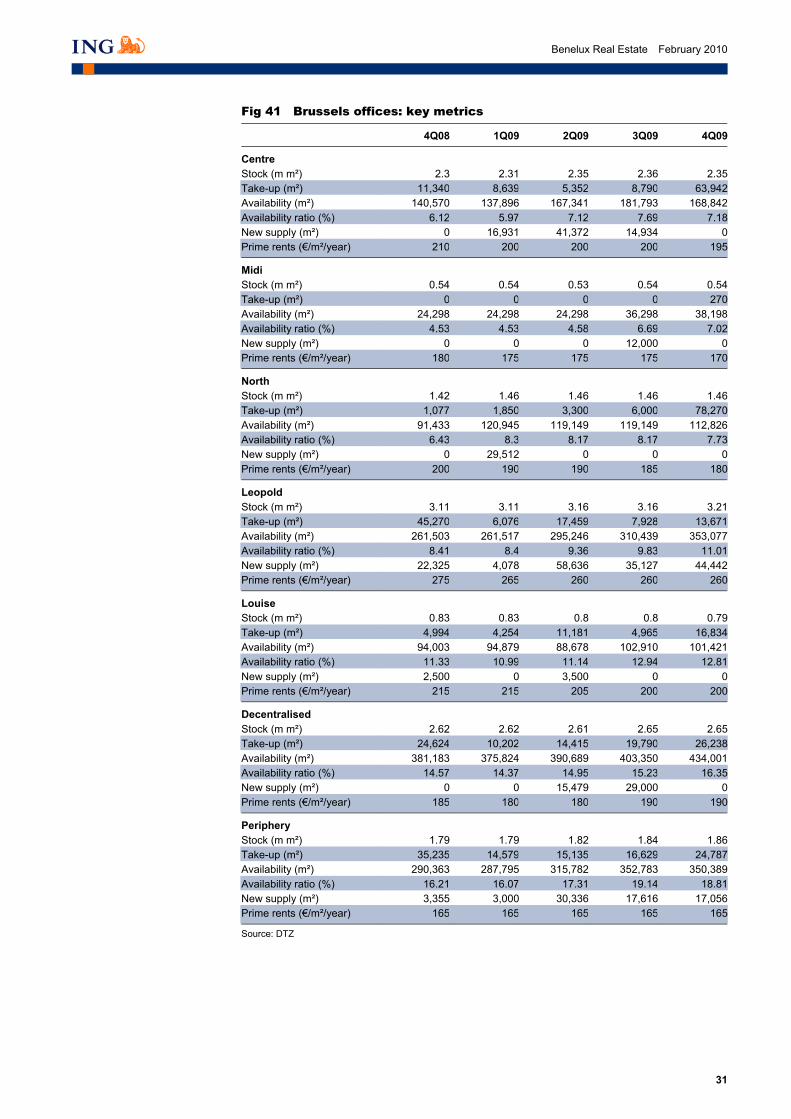
Fig 41 Brussels offices: key metrics
4Q08 1Q09 2Q09 3Q09 4Q09
Centre Stock (m m²) 2.3 2.31 2.35 2.36 2.35Take-up (m²) 11,340 8,639 5,352 8,790 63,942Availability (m²) 140,570 137,896 167,341 181,793 168,842Availability ratio (%) 6.12 5.97 7.12 7.69 7.18New supply (m²) 0 16,931 41,372 14,934 0Prime rents (€/m²/year) 210 200 200 200 195
Midi Stock (m m²) 0.54 0.54 0.53 0.54 0.54Take-up (m²) 0 0 0 0 270Availability (m²) 24,298 24,298 24,298 36,298 38,198Availability ratio (%) 4.53 4.53 4.58 6.69 7.02New supply (m²) 0 0 0 12,000 0Prime rents (€/m²/year) 180 175 175 175 170
North Stock (m m²) 1.42 1.46 1.46 1.46 1.46Take-up (m²) 1,077 1,850 3,300 6,000 78,270Availability (m²) 91,433 120,945 119,149 119,149 112,826Availability ratio (%) 6.43 8.3 8.17 8.17 7.73New supply (m²) 0 29,512 0 0 0Prime rents (€/m²/year) 200 190 190 185 180
Leopold Stock (m m²) 3.11 3.11 3.16 3.16 3.21Take-up (m²) 45,270 6,076 17,459 7,928 13,671Availability (m²) 261,503 261,517 295,246 310,439 353,077Availability ratio (%) 8.41 8.4 9.36 9.83 11.01New supply (m²) 22,325 4,078 58,636 35,127 44,442Prime rents (€/m²/year) 275 265 260 260 260
Louise Stock (m m²) 0.83 0.83 0.8 0.8 0.79Take-up (m²) 4,994 4,254 11,181 4,965 16,834Availability (m²) 94,003 94,879 88,678 102,910 101,421Availability ratio (%) 11.33 10.99 11.14 12.94 12.81New supply (m²) 2,500 0 3,500 0 0Prime rents (€/m²/year) 215 215 205 200 200
Decentralised Stock (m m²) 2.62 2.62 2.61 2.65 2.65Take-up (m²) 24,624 10,202 14,415 19,790 26,238Availability (m²) 381,183 375,824 390,689 403,350 434,001Availability ratio (%) 14.57 14.37 14.95 15.23 16.35New supply (m²) 0 0 15,479 29,000 0Prime rents (€/m²/year) 185 180 180 190 190
Periphery Stock (m m²) 1.79 1.79 1.82 1.84 1.86Take-up (m²) 35,235 14,579 15,135 16,629 24,787Availability (m²) 290,363 287,795 315,782 352,783 350,389Availability ratio (%) 16.21 16.07 17.31 19.14 18.81New supply (m²) 3,355 3,000 30,336 17,616 17,056Prime rents (€/m²/year) 165 165 165 165 165
Source: DTZ

32
Benelux Real Estate February 2010
Brussels, EU political capital
The European institutions occupy c.1.7m sqm of the total available office space in the Brussels Leopold district, which is also known as the “European district”. This is more than half of the total market stock. Below, we provide a brief overview.
Brussels is a key location for European institutions, from both a political and a trade and legal standpoint. Having housed nearly all the important European political institutions for many years, Brussels is increasingly attracting interest from companies, associations and trade groups. The Belgian authorities have attracted the private sector with the introduction of the notional interest deduction, prompting multinational companies to establish their European headquarters in or near Brussels.
A leading example from the real estate industry is the recent relocation of EPRA from Amsterdam towards the Brussels periphery in the Woluwelaan in 2009. The main driver of this relocation was EPRA’s desire to be closer to the European institutions in order to facilitate its lobbying efforts towards more concrete European legislation for REITs.
In appendix, we have provided an overview of all buildings occupied by the European Commission in Brussels.
A cross reference to Washington DC A recent market insight report from DTZ compared Brussels and Washington DC as the political capitals of their respective continents. The main conclusions from an offices investment perspective are:
• Both cities are home to the most important political institutions of their continent;
• The diplomatic presence in Washington is about twice the size of that in Brussels;
• The Washington offices market is much more periphery-based than the Brussels offices market; and
• Correcting for the number of inhabitants in the CBD area, both markets tend to have a comparable supply of office space per inhabitant.
Brussels and Washington have a lot
in common…
33
Benelux Real Estate February 2010
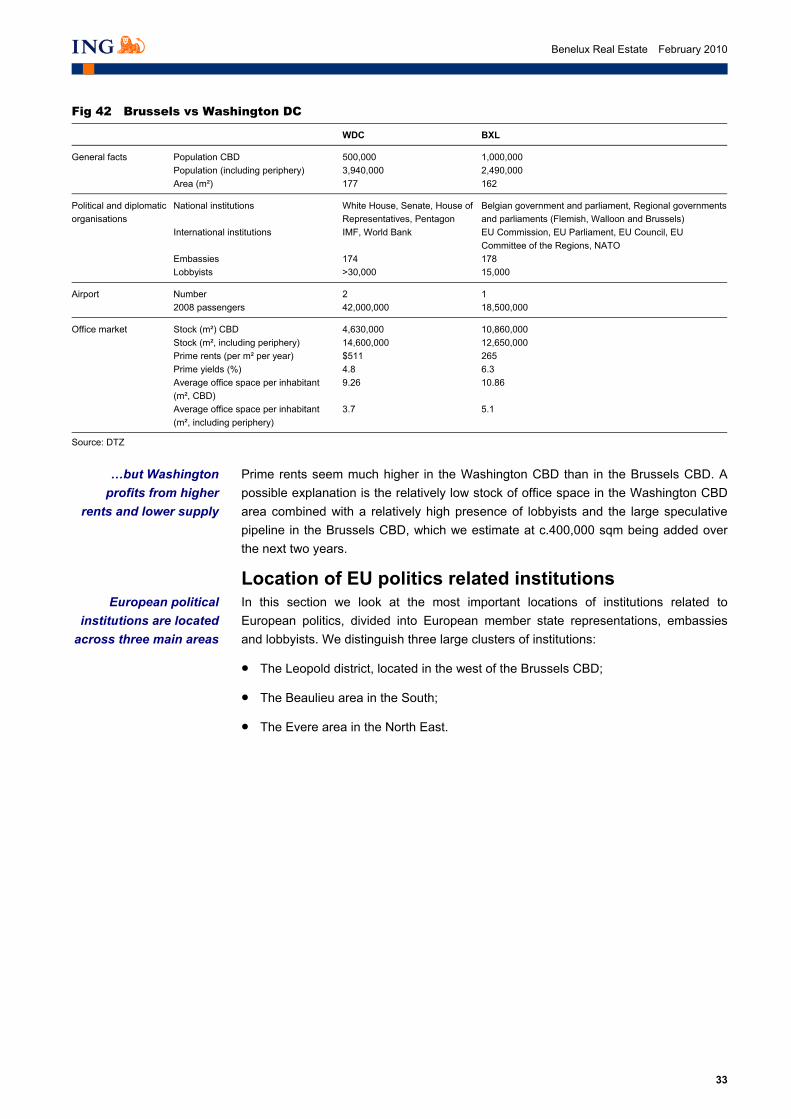
Fig 42 Brussels vs Washington DC
WDC BXL
General facts Population CBD 500,000 1,000,000 Population (including periphery) 3,940,000 2,490,000 Area (m²) 177 162
Political and diplomatic organisations
National institutions White House, Senate, House of Representatives, Pentagon
Belgian government and parliament, Regional governments and parliaments (Flemish, Walloon and Brussels)
International institutions IMF, World Bank EU Commission, EU Parliament, EU Council, EU Committee of the Regions, NATO
Embassies 174 178 Lobbyists >30,000 15,000
Airport Number 2 1 2008 passengers 42,000,000 18,500,000
Office market Stock (m²) CBD 4,630,000 10,860,000 Stock (m², including periphery) 14,600,000 12,650,000 Prime rents (per m² per year) $511 265 Prime yields (%) 4.8 6.3 Average office space per inhabitant
(m², CBD) 9.26 10.86
Average office space per inhabitant (m², including periphery)
3.7 5.1
Source: DTZ
_
Prime rents seem much higher in the Washington CBD than in the Brussels CBD. A possible explanation is the relatively low stock of office space in the Washington CBD area combined with a relatively high presence of lobbyists and the large speculative pipeline in the Brussels CBD, which we estimate at c.400,000 sqm being added over the next two years.
Location of EU politics related institutions In this section we look at the most important locations of institutions related to European politics, divided into European member state representations, embassies and lobbyists. We distinguish three large clusters of institutions:
• The Leopold district, located in the west of the Brussels CBD;
• The Beaulieu area in the South;
• The Evere area in the North East.
…but Washington profits from higher
rents and lower supply
European political institutions are located
across three main areas

34
Benelux Real Estate February 2010
Fig 43 European political institutions’ location
Source: DTZ
_
The Leopold area is by far the most important location for European politics. It is home to around 80% of the European Commission’s offices and also houses the European Parliament, the Council and the Committee of the Regions. Its importance will increase in the future, especially with the European Commission’s plans to further centralise its offices by adding an extra c.230,000 sqm of offices in the “Rue de la Loi”, the main artery of Belgian and international politics together with the “Place de Luxembourg”. Hence, the Leopold district is often referred to as the “European district”. Located at the very heart of the Leopold district, the Schuman square (location of the European Commission) has been dictating prime rents in Brussels for years. Current prime rent levels are estimated at c.€260/sqm/year2.
We estimate that the EU Institutions occupy c.1.7m sqm of the total office space available in the Leopold district (total office space is c.3.2m sqm).
EU member state representations The Leopold district houses all of the 27 EU member states’ permanent representations, except for France (located in the Central District) and Poland (located in the “avenue Tervuren”). These permanent representations clearly want to near to the EU institutions, in order to facilitate access during EU summits and meetings between different countries’ representations.
2 Source : DTZ, 2009
The Leopold district is becoming a true
European district
Proximity to EU institutions is key
determinant of location

35
Benelux Real Estate February 2010
Embassies
Fig 44 Embassy distribution by area
Roosevelt area20%
Leopold area19%
Tervuren area17%
Louise area13%
Molière area13%
Dispersed18%
Source: DTZ
_
Clearly differing from the representations, embassies have a much lower requirement to be near the EU institutions. They tend to be located in clusters according to the culture or geographical presence of the countries they represent. The most popular location is the Roosevelt area, housing 35 out of 178 embassies in Brussels. African embassies are the most important ones in this area, with 34% of the embassies in this area.
Fig 45 Embassies in Brussels
Source: DTZ _
Embassies are clustered based on
similarities between countries
36
Benelux Real Estate February 2010
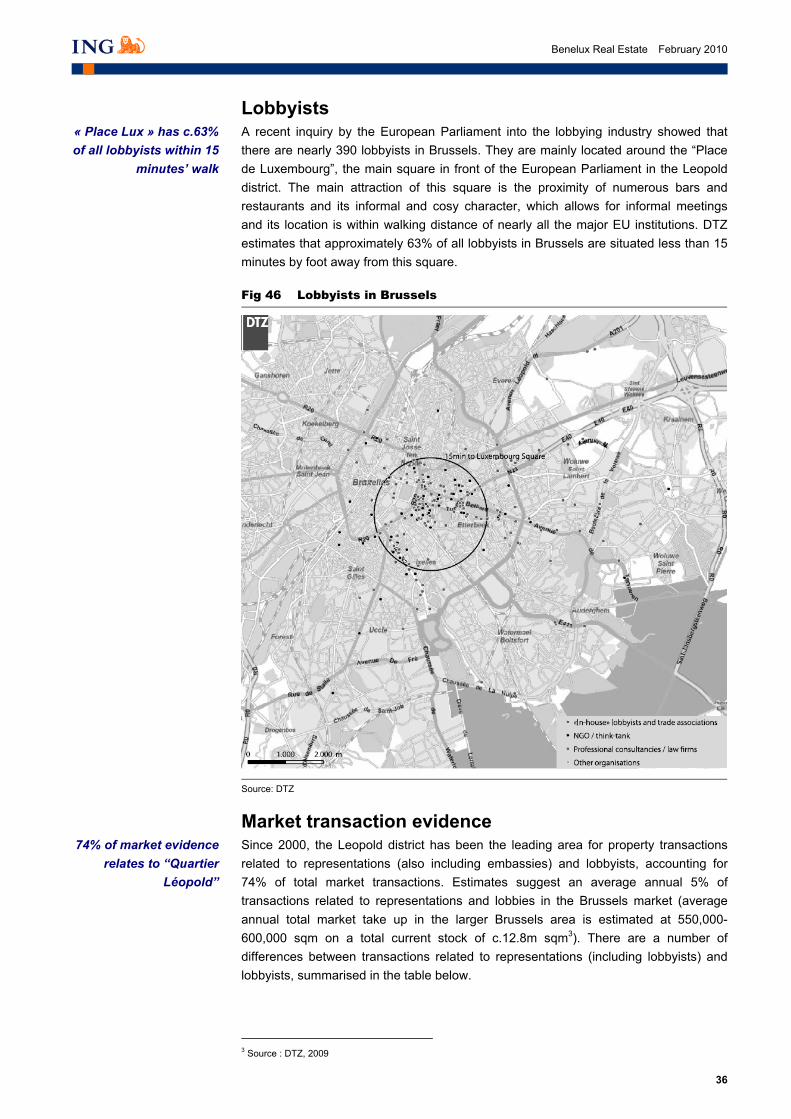
Lobbyists A recent inquiry by the European Parliament into the lobbying industry showed that there are nearly 390 lobbyists in Brussels. They are mainly located around the “Place de Luxembourg”, the main square in front of the European Parliament in the Leopold district. The main attraction of this square is the proximity of numerous bars and restaurants and its informal and cosy character, which allows for informal meetings and its location is within walking distance of nearly all the major EU institutions. DTZ estimates that approximately 63% of all lobbyists in Brussels are situated less than 15 minutes by foot away from this square.
Fig 46 Lobbyists in Brussels
Source: DTZ
_
Market transaction evidence Since 2000, the Leopold district has been the leading area for property transactions related to representations (also including embassies) and lobbyists, accounting for 74% of total market transactions. Estimates suggest an average annual 5% of transactions related to representations and lobbies in the Brussels market (average annual total market take up in the larger Brussels area is estimated at 550,000-600,000 sqm on a total current stock of c.12.8m sqm3). There are a number of differences between transactions related to representations (including lobbyists) and lobbyists, summarised in the table below.
3 Source : DTZ, 2009
« Place Lux » has c.63% of all lobbyists within 15
minutes’ walk
74% of market evidence relates to “Quartier
Léopold”

37
Benelux Real Estate February 2010
Fig 47 Representations (including embassies) vs lobbyists in Brussels
Representations Lobbyists
Average size of a transaction (sqm) 1,250 457 Purchase or lease? Even distribution Mostly leases Location Determined by EU institution’s proximity Determined by rents Duration Long-term vision Flexible Transactions 2000-2009 (sqm) 200,000 74,400
Source: DTZ
_
A key difference between representations and lobbyists is the term of their residence: representations often have a much longer term of residence and generally prefer location over level of rents when compared to lobbies. Their average transaction size is also c.2.5 times higher than the size of transactions related to lobbyists.
Fig 48 Take-up distribution of representations, embassies and lobbyists
Fig 49 Proportions of letting and purchases
European district74%
Louise district5%
Madoux/ Orban district
2%
Other districts6%
Woluwe/ Tervuren district
5%
East Pentagon
8%
0%10%
20%
30%40%
50%
60%70%
80%
90%100%
Lobbies Representations
Letting Purchases
Source: DTZ Source: DTZ
_
The proximity to EU institutions’ preference of representations and embassies is clearly reflected in the highest level of rents, estimated at €207/sqm/year in the Leopold district. As lobbyists are more cost-conscious than representations, they tend to seek areas neighbouring the European district, yet still close to Place Luxembourg.
Leopold district preferred by
representations, reflected in the highest
rents
Representations prefer locations over cost and
have a long-term view

38
Benelux Real Estate February 2010
Belgian nursing homes
Cash flow security
In recent years, Belgian property investors Cofinimmo and Aedifica have increasingly invested in nursing homes. We believe there is more to come, thanks to a number of key attractions and – currently – limited risks.
Nursing homes have emerged as a new diversification method for leading real estate investors in Belgium. We believe the main drivers from a real estate investment perspective are:
• Overall ageing demographic structure in Belgium (estimates suggest that there will be three times as many people in nursing homes by 2050);
• Structural shortage in the number of beds: considerable capacity for extra beds (c.9,000 by 2012), despite the heavily-regulated nature of the sector;
• Separation of roles and consolidation: nursing home operators need to increase the average size per home as well as the overall size of their portfolio in order to become more efficient. A partnership with a private investor in the form of a sale and lease back is a commonly-used method to achieve such efficiencies;
• Full occupation is guaranteed thanks to strict government planning in terms of issuing limited licences to nursing home operators;
• Sustainable rents thanks to a government subsidy system roughly equal to half of the nursing home operators’ expenses; and
• Long-term lease contracts running up to 24 years.
These drivers should be weighed against the sustainability of the favourable regulatory system and the modest yields which, taken together with overall long-term fixed leases, allow for little rent reversion.
We have identified the main risks of investing in nursing homes as:
• Permits and subsidies are given to the nursing home operators, not to the investors. As more real estate investors step in, the market might become saturated over the longer term. Requiring custom-designed buildings, conversion of a nursing home to e.g. residential assets may become expensive when operators decide to move. Nevertheless, we point out that there is still a structural under-supply of nursing homes in the next few years.
• Sustainability of public authorities’ subsidies may become more difficult in future, particularly when taking into account increasing budget deficits. Lower subsidies could in turn start to affect sustainability of rents that are paid by the operators.
Main risks
Key investment drivers
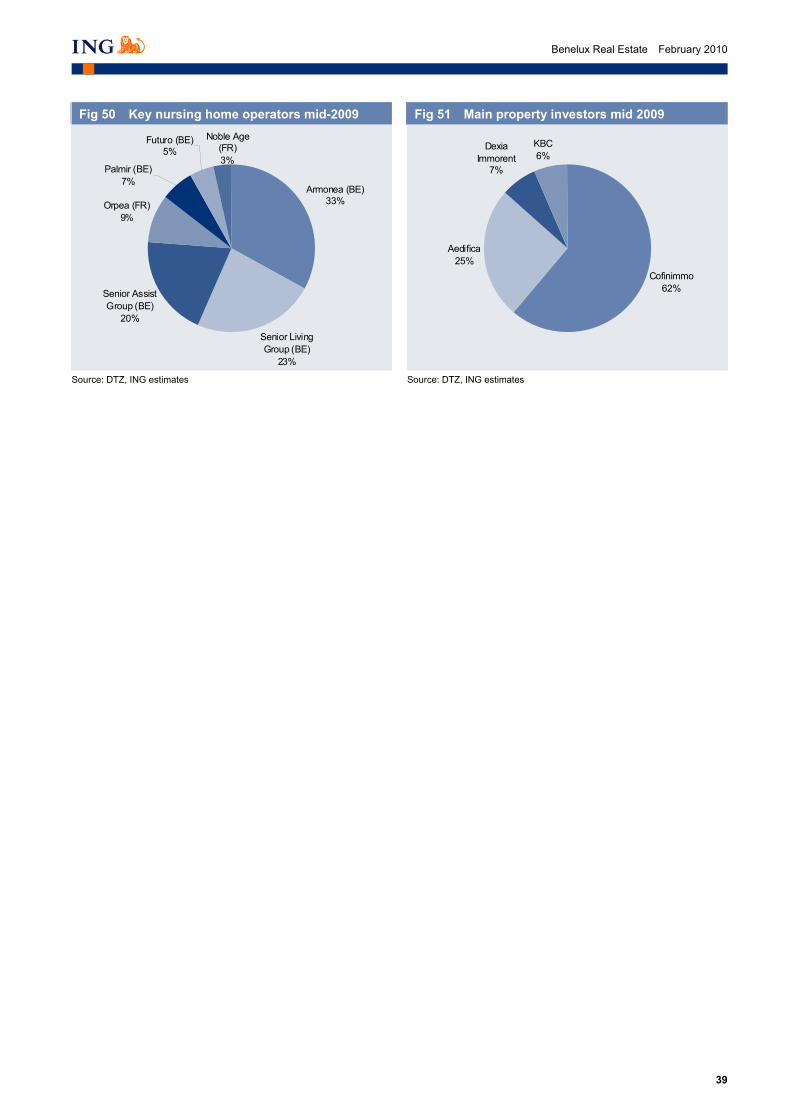
39
Benelux Real Estate February 2010
Fig 50 Key nursing home operators mid-2009
Fig 51 Main property investors mid 2009
Armonea (BE)33%
Senior Living Group (BE)
23%
Senior Assist Group (BE)
20%
Orpea (FR)9%
Noble Age (FR)3%
Futuro (BE)5%
Palmir (BE)7%
Cofinimmo62%
Aedifica25%
Dexia Immorent
7%
KBC6%
Source: DTZ, ING estimates Source: DTZ, ING estimates
_
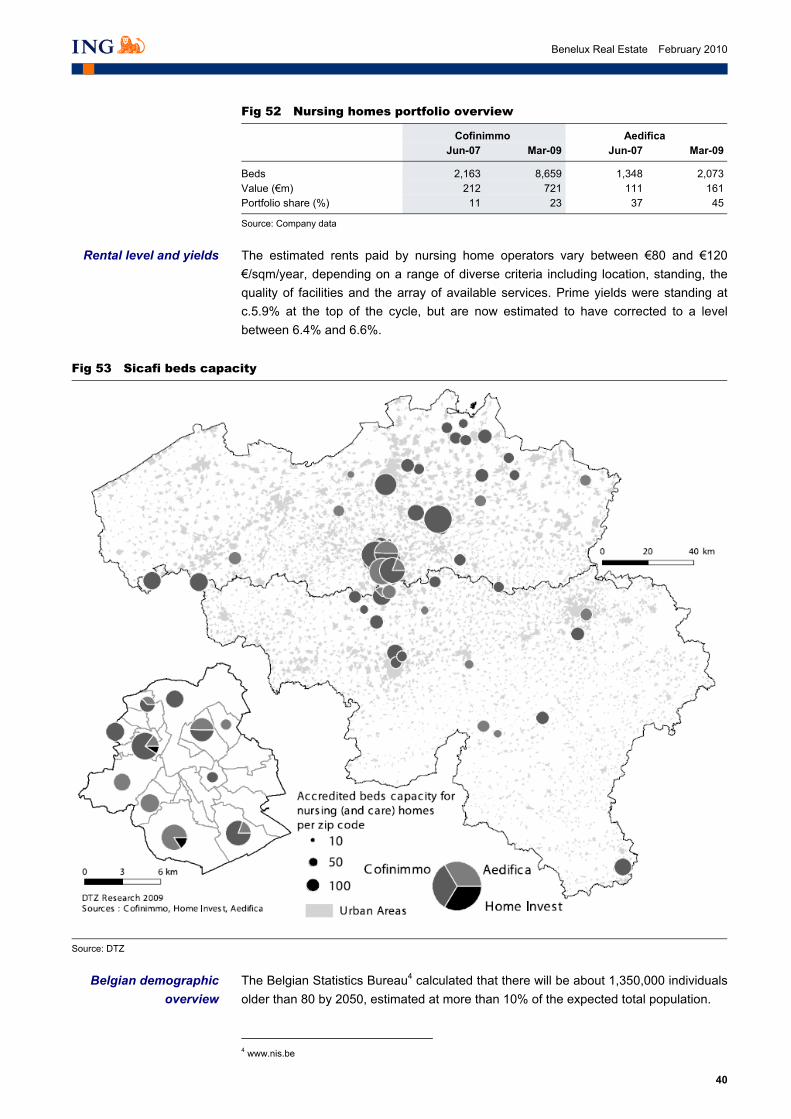
40
Benelux Real Estate February 2010
Fig 52 Nursing homes portfolio overview
Cofinimmo Aedifica Jun-07 Mar-09 Jun-07 Mar-09
Beds 2,163 8,659 1,348 2,073Value (€m) 212 721 111 161Portfolio share (%) 11 23 37 45
Source: Company data
_
The estimated rents paid by nursing home operators vary between €80 and €120 €/sqm/year, depending on a range of diverse criteria including location, standing, the quality of facilities and the array of available services. Prime yields were standing at c.5.9% at the top of the cycle, but are now estimated to have corrected to a level between 6.4% and 6.6%.
Fig 53 Sicafi beds capacity
Source: DTZ
_
The Belgian Statistics Bureau4 calculated that there will be about 1,350,000 individuals older than 80 by 2050, estimated at more than 10% of the expected total population.
4 www.nis.be
Rental level and yields
Belgian demographic overview

41
Benelux Real Estate February 2010
Taken together with the lower proportion of families taking care of their older relatives, the need for external residential care facilities for elderly people is estimated by the national economic study bureau5 to be 318,000 individuals, which is substantially higher than the current figure. As a comparison, some 130,000 beds have been counted in nursing and care homes across Belgium (mid 2009).
The need for additional elderly care facilities will be highest in the Flemish region, characterised by a structurally older population and a lower current supply of care facilities relative to the total number of elderly people.
5 www.plan.be

42
Benelux Real Estate February 2010
Real estate investment markets
The investment markets picked up considerably in H2 2009. CBRE reports that European investments in H2 were 75% higher than in H1, with Benelux outperforming this figure with a 95% rise in investment activity. Spain seems to remain inactive so far and CEE and Germany have experienced the sharpest growth.
Fig 54 European investment activity 2009 (€bn)
1H09 2H09 (%ch)
UK 9.4 15.4 64 Germany 3.3 7.1 115 France 2.5 5.0 100 Nordics 2.7 4.4 63 Benelux 2.1 4.1 95 Italy 2.1 3.0 43 Iberia 1.9 2.2 16 CEE 0.5 1.6 229 Europe 24.5 42.8 75
Source: CB Richard Ellis, January 2010
_
From the chart below it can be seen that investment market volumes are picking up. The chart includes the UK which, with a transaction volume of €8.3bn in 2009 4Q, accounted for a third of European turnover.
Fig 55 European investment turnover (€bn)
49
5955
77
5968 67
60
42
29 30
2012 14
1826
0
10
20
30
40
50
60
70
80
90
1Q06
2Q06
3Q06
4Q06
1Q07
2Q07
3Q07
4Q07
1Q08
2Q08
3Q08
4Q08
1Q09
2Q09
3Q09
4Q09
Source: CBRE, Jan 2010
_
If we focus on the Benelux, it emerges that Belgian real estate turnover was very weak in Q2, with only €76m in completed transactions. In addition, we see that Belgium and Spain (not shown in the chart) were the only countries where Q4 volume lagged Q3.
H2 European RE investments were up
75% to €43bn

43
Benelux Real Estate February 2010
Fig 56 Benelux and France investment markets in 2009 (€m)
6061,015 1,143
1,940
32576
519 352748
1,7661,586
3,500
0
500
1,000
1,500
2,000
2,500
3,000
3,500
4,000
1Q09 2Q09 3Q09 4Q9
Netherlands Belgium France
Source: CBRE 2010
_
The chart below provides a breakdown of investors in European property by type of fund strategy. As a result of better availability of debt and a more attractive market outlook, we believe that deal flow will improve further in 2010.
A large number of funds are members of Inrev, the European Association for Investors in Non-listed Real Estate Vehicles. Inrev has produced very relevant research to analyse selling pressure from funds that are terminated. Clearly, termination is often used as a reason to restructure a fund or continue under the same or different management. Inrev has separated the funds into three categories: Core, Value Added and Opportunity. As a result of the economic crisis and the resulting loss of risk appetite, interest in non-core funds has dropped considerably in the past 18 months.
Fig 57 Termination of real estate funds by style (€bn)
0
5
10
15
20
25
2009 2010 2011 2012 2013 2014 2015 2016 2017 2018 2019
€Bn
Core Value Added Opportunity
Source: Inrev, ING research
_
The listed companies in the Benelux invest mostly in Retail, Office and Industrial property. The table below illustrates potential deal flow per real estate sector by year. The retail component of the terminations is the highest block of the stacked bar. In 2010, €2.4bn and in 2011 €5.2bn of retail property of non-listed funds is expected to be put on the market.
Half of the 2010 terminations expected
to be value added or opportunistic funds

44
Benelux Real Estate February 2010
Fig 58 Termination of non-listed real estate funds by sector
0
5
10
15
20
25
2009 2010 2011 2012 2013 2014 2015 2016 2017 2018 2019
€Bn
Diversified Industrial / logistics Office Other Residential Retail
Source: Inrev, ING Research
_

45
Benelux Real Estate February 2010
The outlook for retail property
We believe there are a number of material changes currently underway in retailing which will likely weaken the position of shopping centres. In addition, the place of the super-regional mall in the retail hierarchy is under attack from expansive food retailers and the declining exclusivity of multiples, increased SRI consciousness about travel-to-buy and a social function of retail that is eroding.
Consumers’ time budgets are under increasing pressure and this may lead to a reduced number of trips. A greying population may have a growing time budget, and at some stage may offset the previous trend.
In a recent presentation about the future of the city of The Hague, Carl Rhode, a trend-watcher stated: “In the past businesses determined what customers need and then manipulate demand to meet their offerings. A shopping centre plays a role here. The future consumers and producers jointly create value. This could come at the expense of the middle man, who is the tenant in the shopping centre.”
We see the following important changes ahead:
• The end of the growth era of multiples.
• French Food retailers internalise and beef up development.
• E-commerce depresses footfall and turnover.
• Proximity and authenticity gain in importance.
• SRI does not fit with the traffic of a regional mall.
• Multiples opening in smaller centres, eroding the exclusivity of larger centres.
• Physical presence is declining in importance as social networks move to the web.
• Random meetings have become less important with the use of mobile phones.
• Sports, culture, and the internet are all competing for consumers’ time budget.
• Food retailers are trying to find the right web-based format.
We believe that in 10 years’ time, a smaller number of consumers will spend less time in shopping centres and will also spend less once they are in there. These effects could be partially offset if the grey wave spends much of its new spare time in shopping centres.
The end of the growth era of multiples?
A number of social studies point to the reversal of the trend of consumers wanting to shop at the same shops. Good examples of this are the several different shopping districts in larger cities such as The Hague, Milan and Amsterdam, where clusters of new independent and exclusive, but not necessarily expensive, shops have popped up. Clients value the authenticity of the offer and the service and passion of the personnel who are often the co-owner. Consumers seem to be less concerned about the comfort brought by wearing a particular brand, possibly also because the production of most fashion brands is now globalised.
A number of trends may weaken shopping centres’ position
Grey is good
Power of consumers will grow, middle-men
under pressure
The proposition of all brands under one roof
is losing relevance
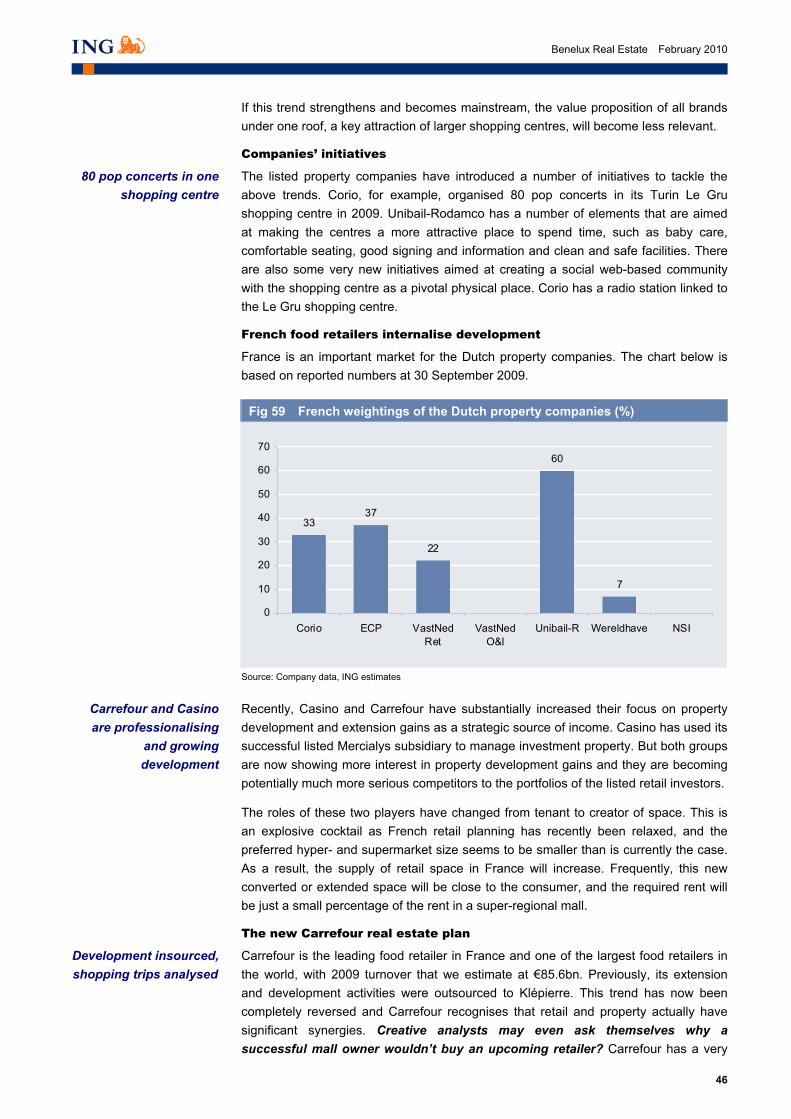
46
Benelux Real Estate February 2010
If this trend strengthens and becomes mainstream, the value proposition of all brands under one roof, a key attraction of larger shopping centres, will become less relevant.
Companies’ initiatives
The listed property companies have introduced a number of initiatives to tackle the above trends. Corio, for example, organised 80 pop concerts in its Turin Le Gru shopping centre in 2009. Unibail-Rodamco has a number of elements that are aimed at making the centres a more attractive place to spend time, such as baby care, comfortable seating, good signing and information and clean and safe facilities. There are also some very new initiatives aimed at creating a social web-based community with the shopping centre as a pivotal physical place. Corio has a radio station linked to the Le Gru shopping centre.
French food retailers internalise development
France is an important market for the Dutch property companies. The chart below is based on reported numbers at 30 September 2009.
Fig 59 French weightings of the Dutch property companies (%)
3337
22
60
7
0
10
20
30
40
50
60
70
Corio ECP VastNedRet
VastNedO&I
Unibail-R Wereldhave NSI
Source: Company data, ING estimates
_
Recently, Casino and Carrefour have substantially increased their focus on property development and extension gains as a strategic source of income. Casino has used its successful listed Mercialys subsidiary to manage investment property. But both groups are now showing more interest in property development gains and they are becoming potentially much more serious competitors to the portfolios of the listed retail investors.
The roles of these two players have changed from tenant to creator of space. This is an explosive cocktail as French retail planning has recently been relaxed, and the preferred hyper- and supermarket size seems to be smaller than is currently the case. As a result, the supply of retail space in France will increase. Frequently, this new converted or extended space will be close to the consumer, and the required rent will be just a small percentage of the rent in a super-regional mall.
The new Carrefour real estate plan
Carrefour is the leading food retailer in France and one of the largest food retailers in the world, with 2009 turnover that we estimate at €85.6bn. Previously, its extension and development activities were outsourced to Klépierre. This trend has now been completely reversed and Carrefour recognises that retail and property actually have significant synergies. Creative analysts may even ask themselves why a successful mall owner wouldn’t buy an upcoming retailer? Carrefour has a very
80 pop concerts in one shopping centre
Carrefour and Casino are professionalising
and growing development
Development insourced, shopping trips analysed

47
Benelux Real Estate February 2010
good understanding of consumer behaviour, both inside and outside France. This is illustrated in the graphic below, which distinguishes between four types of shopping mission, and allocates the favourite store format and internet relevance.
Fig 60 Carrefour’s shopping trip segmentation
Source: Carrefour
_
Carrefour’s second chart must have sent shivers down the spines of the many successful developers of French retail space. It illustrates the upside when too-large hypermarkets are shrunk and the surplus space is converted to smaller units, sometimes with an extension to the parking. This is a direct threat to the existing shopping centres, in our view, particularly because some of the hypers offer a proximity that, if well exploited, could form a (new) heart of a small community. A community based on proximity would fit well with new sociological trends.
Carrefour intends to roll out the hypermarket repositioning programme in France, Spain, Italy and Belgium. Deployment is planned to start in 2011 and the company wants to have everything completed by the end of 2012. It will test prototypes in 2010. Carrefour has decided to dispose of all southern Italian hypermarkets. The graphic below illustrates how Carrefour has created additional return from the conversion of hypermarket space, on top of the rental increase.
Carrefour will roll out the programme in
France, Spain, Belgium and Italy
Carrefour is going to create a large number of
new communities

48
Benelux Real Estate February 2010
Fig 61 Upside from redevelopment according to Carrefour
Source: Carrefour
_
Casino’s real estate ambitions
With the creation of Mercyalys, Casino has already experienced many of the blessings that come with listed real estate. Casino has recently announced a further growth path for its real estate arm. This plan encompasses a broadening of the real estate activities from investment, as done by Mercialys, to a better focus on development and conversion of space. The chart below outlines the philosophy behind the project, which is called Alcudia.
This project will create considerable additional floor space in France, which will in turn put pressure on current rent levels - particularly non-prime retail rents. The listed property companies in French retail markets tend to focus on the larger centres, but we would argue that they would also feel the impact. As neighbourhood retailing undergoes a massive national clean-up and broadens its offer with more boutique space and better bars, cafes and food offer, trips to the bigger malls could be expected to come down.
Casino broadens real estate activities and will
also create new competition

49
Benelux Real Estate February 2010
Fig 62 Outline of Casino’s Alcudia project
Source: Casino
_
Casino has already quantified many of its plans, as shown in the chart below. We think the numbers mentioned in the chart are substantial. In addition, the timescale seems ambitious but achievable; 445,000 sqm means 45 retail galleries of 10,000 sqm each added in the next three years, in addition to the existing retail pipeline. These numbers do not yet include any shrinkage of Casino hypermarkets.
Fig 63 Casino’s development plans quantified
Source: Casino
_
Casino intends to create 445,000 sqm new space, 50% before end of 2012, excluding conversion of
hypers

50
Benelux Real Estate February 2010
As a result of these plans, we believe that French retail property may not perform as well as it has in the past. Bear in mind that indexation in France has also come down very considerably, from above 5% in 2008 to below 1% for 2010.
E-commerce depresses footfall and turnover
Both French and Dutch e-commerce is rising rapidly. In France, e-commerce has risen by 25% to €45bn, in the 12 months to June 2009. Apart from business to consumer retailing, we believe that consumer to consumer trading poses a threat to the shopping centre as a physical place to buy goods. Not only do tenants approach consumers directly, but consumers are increasingly selling goods to other consumers. The graph below illustrates the Dutch market.
Fig 64 Dutch E-Commerce as a percentage of total non-food turnover consumption
0.0%
1.0%
2.0%
3.0%
4.0%
5.0%
6.0%
2000 2001 2002 2003 2004 2005 2006 2007 2008 2009H1
Source: Blaauw, Thuiswinkel.org
_
It is useful to analyse internet usage during the three phases of shopping: orientation (comparison), acquisition, and after sales. In the orientation phase, the internet has become more important that the physical shop, in the Netherlands. The numbers below are based on a June 2009 analysis of 1706 Dutch consumers aged between 16 and 65. In the acquisition phase consumers still prefer the shop, as illustrated by the strong lead of 72% over the 23% acquisition over the internet. In after sales the internet is used by 4% of respondents and actual shops by 11%.
Fig 65 Distribution channel usage by shopping phase in the Netherlands
2009 (%) Orientation Acquisition After-sales
Internet 41 23 4Retail 35 72 11Print 33 0 0Telephone/ mail 1 1 5 110 96 20
Source: Blaauw, 2009
_
One of the traditional roles of a larger shopping centre is comparison. Consumers like to compare competing products, brands and prices before they buy. This important first step is increasingly being done via the internet, as illustrated in the chart below.
The internet is especially dominant
before the actual transaction takes place
The internet is replacing part of the comparison
function of the mall
French retail will have a challenging time
Consumer-to-consumer trading comes out of
retailers’ wallets

51
Benelux Real Estate February 2010
Fig 66 Channel use in orientation phase by product (%)
38
35
52
22
30
30
48
29
52
43
39
24
51
30
61
31
17
14
57
38
16
41
56
16
33
35
24
17
14
15
18
19
23
28
31
32
33
38
40
42
42
43
50
51
54
54
55
55
57
60
63
64
65
65
77
83
0 10 20 30 40 50 60 70 80 90
Animal care
Plants/flowers
Optical
Groceries
Pers care
Clothing shoes
DIY
Books, magazines
Sports articles
Garden equipment
Toys
DVDs
Bicycle
Home entert software
Interior
Music
Erotics
Insurance
Whitegoods
(Mob) Telecom
Car
Comp hardware
Audio/video
Tickets
Other Cons electr
Photo/fil
Software
Travel
Internet Retail
Source: Blaauw 2009, ING Research
_
The chart above breaks down the comparison phase by favourite distribution channel, for example, 51% of the consumers that are willing to buy music are using the internet when deciding what to buy, and only 31 percent use actual stores to compare before they buy music. The internet is mostly used to compare what is on offer by consumers planning to buy travel (83%), software (77%), photographic and film accessories (65%) and other consumer electronics (65%).
Proximity and authenticity gain in importance
If the past decade has seen the rolling-out of multiples across Europe, notably H&M and Zara and its Inditex sister retailers, we think the next decade may well look different. There seems to be a trend whereby consumers want to differentiate themselves from the masses. The large multiples are not well positioned to cater to these wishes. The shopping patterns of the new consumers are used to express themselves, not to conform. Being on the mailing list of a particular chocolate shop or second-hand vintage children’s clothing shop may be a small part of the identity of the new consumer. Buying from the owners of these unique shops creates different transactions to doing so in a multiple.
The next decade is not about multiples but
about smaller, differentiating retail

52
Benelux Real Estate February 2010
Some sociological researchers believe that after a period of individualisation, consumers are increasingly looking to be part of communities. If true, this may also lead to an adoption of shopping patterns toward shops closer to home, in order to ‘support’ the local community. On the other hand, a regional mall seems a logical starting point for a community, as illustrated in some larger Swedish centres, which have a City Hall, post office and even a church integrated in the mall.
The web can be used increasingly effectively for tracking down desirable physical shops, or clusters. We would not be surprised if larger shopping centres offered less well located space to the new type of entrepreneur that is able to attract the young pioneering and early adopting consumers. Obsolete department store space can also be used as a breeding ground for clusters of new retail entrepreneurs.
The message of the consumer change that is affecting the retail markets is not that the shopping centre is going to be obsolete. But owners and investors will have to work harder to retain clients. We think the low risk perception of a large shopping centre, which was appropriate in the past two decades, may change.
Socially-responsible investment clashes with traffic of a regional mall
Consumers’ preference shifts to socially responsible behaviour. It is hard to argue that taking the car to a shopping centre 15 km down the road is socially responsible behaviour. The number of consumers that visit a centre on foot or by bicycle will be an increasingly important factor in the success of a centre. Unibail Rodamco has addressed this issue a number of times, for example in Spain. In addition, we believe that larger centres may well be more efficient than smaller centres in usage of water and energy.
Multiples are opening everywhere, eroding exclusivity of larger centres
Now that a large number of multiples have decided to open shops in smaller centres, part of the attraction of the large centres is diluted. In addition, the selection of a number of goods is now made over the internet and no longer in physical shops. Large centres need to find other ways to attract visitors in order to keep turnover healthy.
‘See and be seen’ partly replaced by mobile social behaviour
Apart from buying goods, one of the traditional roles of a shopping centre is to meet and look at other people and be looked at. In recent years, a number of alternative social networks have been created. Facebook, LinkedIn, Hyves, and other web- or mobile phone-based communities are moving the focus of the consumer away from the largest physical meeting place to the most attractive place. In past years, the use of mobile phones has probably had a deep impact on footfall patterns in centres because it has reduced the random strolling (and let’s see who we meet) and replaced it with a more targeted and efficient approach. Sports, culture, and the internet are all competing for the consumer’s time budget.
Food retailers are searching for a web-based format to gain market share
To date, most retailers have been unsuccessful as they struggle to get paid for the cost of the logistics and in particular the picking (the assemblage of the ordered baskets of goods), while the high-margin foods are mostly fresh so delivery is time-critical. If they find a good format, this will reduce the pulling power of traditional food retailers, which often anchor shopping centres.
We believe that the yields of the shopping centres have not really been tested in Continental Europe. The oligopolistic ownership structure of larger shopping centres,
After a period of individualisation,
consumers increasingly want to belong
Owners will have to work hard to remain on
consumers’ minds
Means of transport should be in the SRI
box
Attention shift from largest place to most
attractive place

53
Benelux Real Estate February 2010
coupled with an lack of transparency, has led to semi-stable yields for the top end of the investment market for larger shopping centres.
Smaller centres easier to double in size
It is easier to add 5,000sqm to a small centre of 5,000 sqm than 50,000 sqm to a 50,000 sqm centre. As a result, the potential development earnings growth from a portfolio of small centres is often larger than that of a portfolio consisting of a small number of larger centres. This effect is further enhanced by the fact that lower rents from the smaller centres are easier to increase when the size has doubled, than the rents of already large centres, where rents are at their local peak.
The recent relaxation of retail planning in France, whereby the threshold for which a permit is required rose from 300 sqm to 1,000 sqm, benefits smaller centres more than larger ones.
On the other hand, in general smaller centres are much more likely to be not as well managed, and in the current downturn they may be suffering more than prime centres.
Development potential of small centres is more
attractive

54
Benelux Real Estate February 2010
The macro economy
Real estate returns have a strong correlation with growth of gross domestic product. In this chapter we analyse the distribution of expected GDP growth over European countries and the weightings of the international companies’ portfolios. The strongest growth is expected in Turkey, Russia, Poland, Norway and the Czech Republic; we expect compound GDP to grow by 6% or more in 2010 and 2011. This top five is followed closely by Sweden, Slovakia and the US. With forecast 2010 – 2011 compound GDP growth of 3.6% and 3.4% respectively, the Netherlands and Belgium are both expected to underperform the Eurozone and EMEA.
Dutch and Belgian economic growth is fairly comparable. The Dutch economy seems slightly more volatile, reflecting its open economy and the heavier weight of the EU on the Belgian economy. We will illustrate later that inflation presents a different picture.
Fig 67 GDP growth Belgium and the Netherlands 2009–11F
-5.0-4.0-3.0-2.0-1.00.01.02.03.04.05.0
2009F 2010F 2011F 2009-11F 2010F - 11F
Netherlands Belgium
Source: ING estimates
_
One of the most striking outcomes is the wide difference between Finland, which is a strong underperformer, and Norway and Sweden, which are both expected to post very strong GDP growth. Wereldhave has a 22% portfolio weighting to Finland, while Unibail-Rodamco (8%) and Eurocommercial (22%) offer strong Swedish exposure. Klépierre (not rated) has c.9% of its portfolio in Norway and another 9% in Sweden and Denmark. Spain is at the bottom of the pack, as expected. VastNed Retail has a 23% exposure to that market. Italy, where Eurocommercial has 41% of its investments and Corio 18%, is also expected to post disappointing GDP growth.
Finland is the surprise underperformer
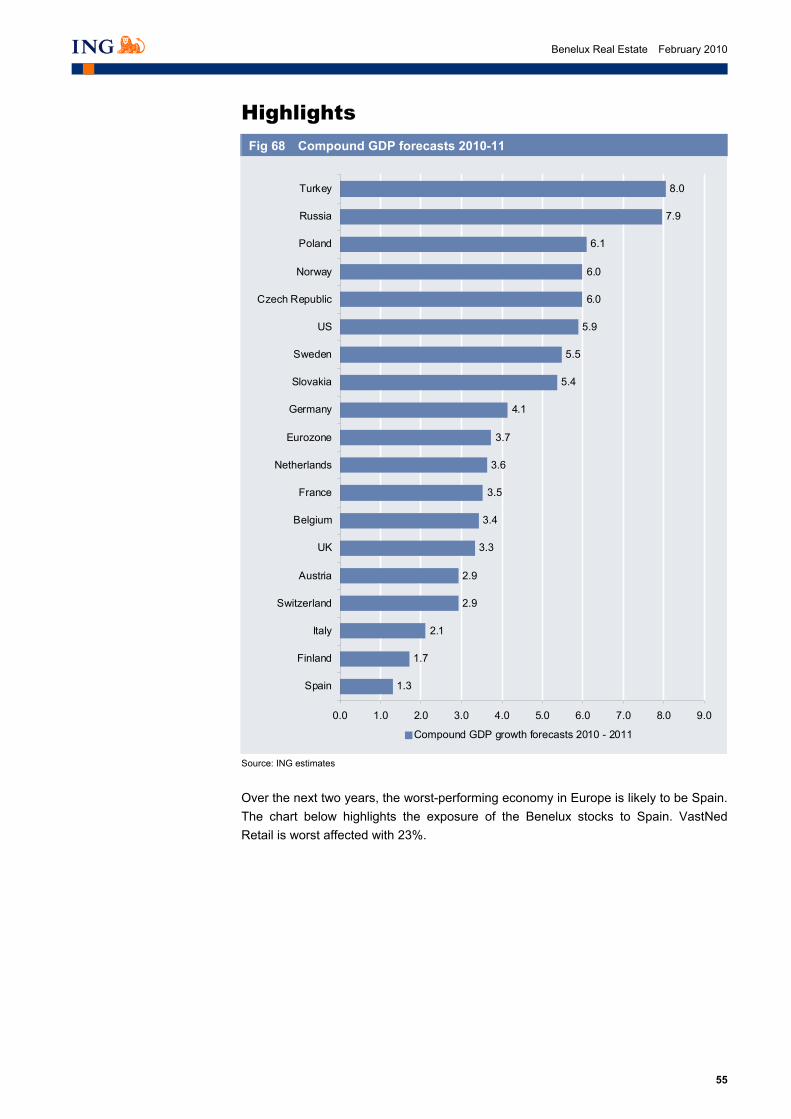
55
Benelux Real Estate February 2010
Highlights
Fig 68 Compound GDP forecasts 2010-11
1.3
1.7
2.1
2.9
2.9
3.3
3.4
3.5
3.6
3.7
4.1
5.4
5.5
5.9
6.0
6.0
6.1
7.9
8.0
0.0 1.0 2.0 3.0 4.0 5.0 6.0 7.0 8.0 9.0
Spain
Finland
Italy
Switzerland
Austria
UK
Belgium
France
Netherlands
Eurozone
Germany
Slovakia
Sweden
US
Czech Republic
Norway
Poland
Russia
Turkey
Compound GDP growth forecasts 2010 - 2011
Source: ING estimates
_
Over the next two years, the worst-performing economy in Europe is likely to be Spain. The chart below highlights the exposure of the Benelux stocks to Spain. VastNed Retail is worst affected with 23%.

56
Benelux Real Estate February 2010
Fig 69 Spanish exposure of Dutch property companies (%)
0
5
10
15
20
25
Corio ECP VastNedRet
VastNedO&I
Unibail- R Wereldhave NSI
Source: Company data, ING estimates
_
In the table below we have calculated the country-weighted average GDP growth of the portfolios of the Dutch property companies. The outcomes range from 3.1% for VastNed Retail, as a result of its high Spanish exposure, to 3.6% for Unibail-Rodamco, Wereldhave and Nieuwe Steen Investment.
Fig 70 Country-weighted average GDP growth 2010-11 (%)
Company Corio ECP VastNed Ret VastNed O&I Unibail- R Wereldhave NSI GDP
Date of breakdown 30 Sep 09 30 Jun 09 30 Sep 09 30 Sep 09 30 Jun 09 30 Sep 09 30 Sep 09 2010 -11F Austria 5 2.9 Belgium 16 47 16 3.4 Czech Republic 1 6.0 Eurozone 3.7 Finland 22 1.7 France 33 37 22 60 7 3.5 Germany 10 4.1 Italy 18 41 2.1 Netherlands 33 37 42 13 15 92 3.6 Norway 6.0 Poland 3 6.1 Russia 7.9 Slovakia 1 5.4 Spain 9 23 9 6 1.3 Sweden 22 8 5.5 Switzerland 8 2.9 Turkey 7 1 8.0 UK 8 3.3 US 26 5.9 Value (€m) 6,000 2,137 1,871 1,090 22,794 2,413 1,330
Average GDP growth 3.4 3.4 3.1 3.6 3.6 3.6 3.6
Source: Company data, ING estimates
_
In the medium term, we believe that Spanish exposure could be positive as the market is likely to remain a source of property bargains. A recent example is the acquisition by Corio of 95% of the shares of Principe Pio, from Riofisa, the subsidiary of Colonial, at a net yield of 7.8%, for a price of €127m. In the summer of 2008, Unibail-Rodamco bought the 74,400 sqm La Maquinista shopping centre in Barcelona and the 24,000 sqm Habaneras S.C in Torrevieja from Metrovacesa, for €434 million, at a net yield of 6.0%. La Maquinista has a 15,200 sqm extension possibility.
Country-weighted GDP growth 2010 – 2011
ranges between 3.1% and 3.6%
Spanish exposure opens window to
‘Rabajas’
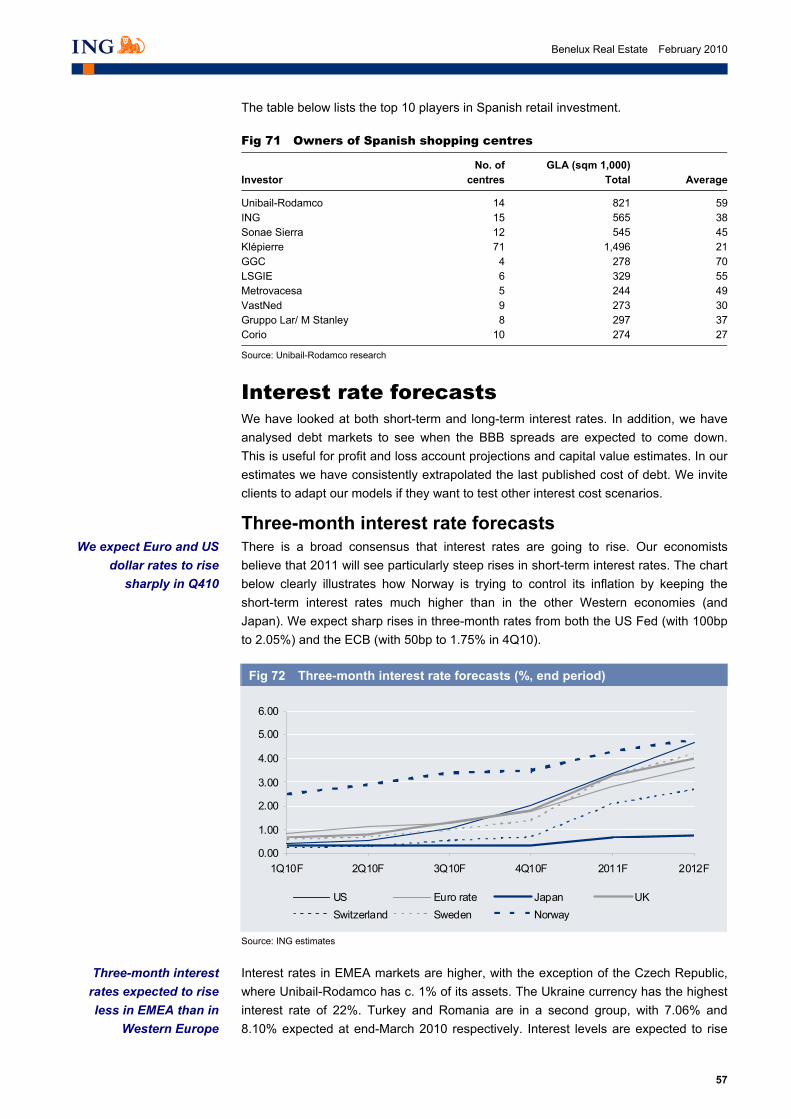
57
Benelux Real Estate February 2010
The table below lists the top 10 players in Spanish retail investment.
Fig 71 Owners of Spanish shopping centres
No. of GLA (sqm 1,000)Investor centres Total Average
Unibail-Rodamco 14 821 59ING 15 565 38Sonae Sierra 12 545 45Klépierre 71 1,496 21GGC 4 278 70LSGIE 6 329 55Metrovacesa 5 244 49VastNed 9 273 30Gruppo Lar/ M Stanley 8 297 37Corio 10 274 27
Source: Unibail-Rodamco research
_
Interest rate forecasts We have looked at both short-term and long-term interest rates. In addition, we have analysed debt markets to see when the BBB spreads are expected to come down. This is useful for profit and loss account projections and capital value estimates. In our estimates we have consistently extrapolated the last published cost of debt. We invite clients to adapt our models if they want to test other interest cost scenarios.
Three-month interest rate forecasts There is a broad consensus that interest rates are going to rise. Our economists believe that 2011 will see particularly steep rises in short-term interest rates. The chart below clearly illustrates how Norway is trying to control its inflation by keeping the short-term interest rates much higher than in the other Western economies (and Japan). We expect sharp rises in three-month rates from both the US Fed (with 100bp to 2.05%) and the ECB (with 50bp to 1.75% in 4Q10).
Fig 72 Three-month interest rate forecasts (%, end period)
0.00
1.00
2.00
3.00
4.00
5.00
6.00
1Q10F 2Q10F 3Q10F 4Q10F 2011F 2012F
US Euro rate Japan UKSwitzerland Sweden Norway
Source: ING estimates
_
Interest rates in EMEA markets are higher, with the exception of the Czech Republic, where Unibail-Rodamco has c. 1% of its assets. The Ukraine currency has the highest interest rate of 22%. Turkey and Romania are in a second group, with 7.06% and 8.10% expected at end-March 2010 respectively. Interest levels are expected to rise
We expect Euro and US dollar rates to rise
sharply in Q410
Three-month interest rates expected to rise less in EMEA than in
Western Europe
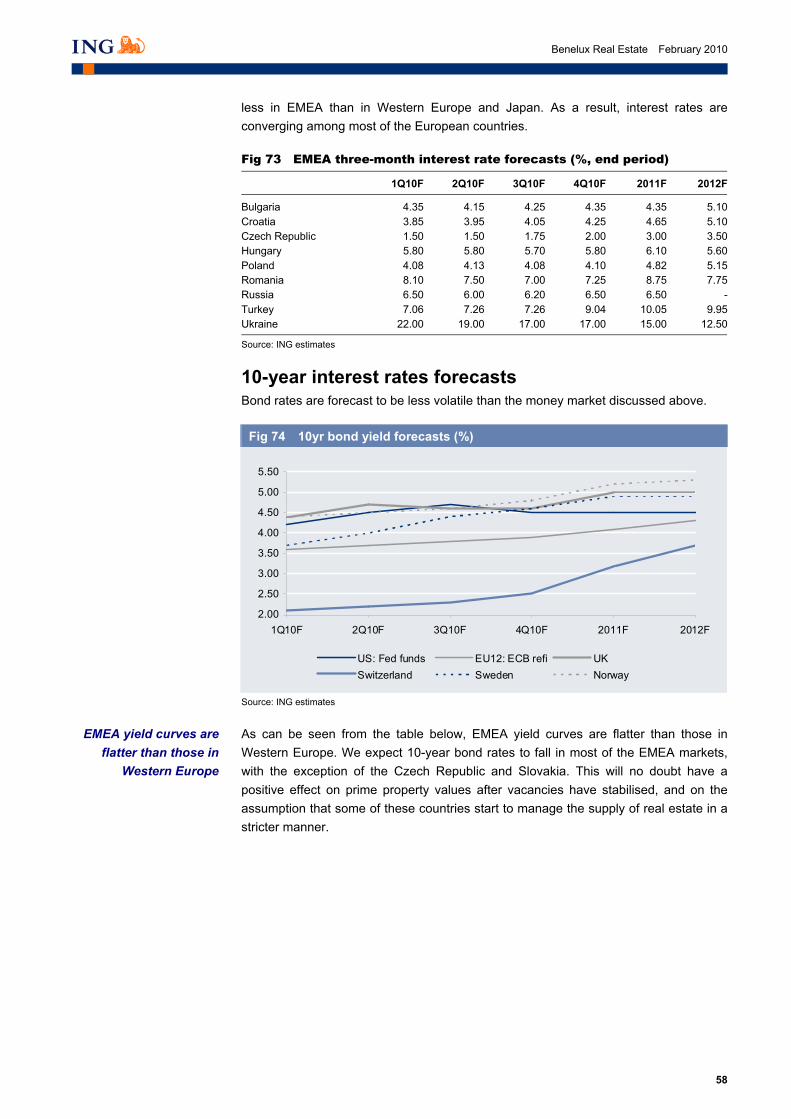
58
Benelux Real Estate February 2010
less in EMEA than in Western Europe and Japan. As a result, interest rates are converging among most of the European countries.
Fig 73 EMEA three-month interest rate forecasts (%, end period)
1Q10F 2Q10F 3Q10F 4Q10F 2011F 2012F
Bulgaria 4.35 4.15 4.25 4.35 4.35 5.10Croatia 3.85 3.95 4.05 4.25 4.65 5.10Czech Republic 1.50 1.50 1.75 2.00 3.00 3.50Hungary 5.80 5.80 5.70 5.80 6.10 5.60Poland 4.08 4.13 4.08 4.10 4.82 5.15Romania 8.10 7.50 7.00 7.25 8.75 7.75Russia 6.50 6.00 6.20 6.50 6.50 -Turkey 7.06 7.26 7.26 9.04 10.05 9.95Ukraine 22.00 19.00 17.00 17.00 15.00 12.50
Source: ING estimates
_
10-year interest rates forecasts Bond rates are forecast to be less volatile than the money market discussed above.
Fig 74 10yr bond yield forecasts (%)
2.00
2.50
3.00
3.50
4.00
4.50
5.00
5.50
1Q10F 2Q10F 3Q10F 4Q10F 2011F 2012F
US: Fed funds EU12: ECB refi UKSwitzerland Sweden Norway
Source: ING estimates
_
As can be seen from the table below, EMEA yield curves are flatter than those in Western Europe. We expect 10-year bond rates to fall in most of the EMEA markets, with the exception of the Czech Republic and Slovakia. This will no doubt have a positive effect on prime property values after vacancies have stabilised, and on the assumption that some of these countries start to manage the supply of real estate in a stricter manner.
EMEA yield curves are flatter than those in
Western Europe

59
Benelux Real Estate February 2010
Fig 75 10yr bond yield forecasts EMEA (%)
1Q10F 2Q10F 3Q10F 4Q10F 2011F 2012F
Bulgaria 6.80 6.70 6.30 5.90 5.40 5.60Croatia 6.10 6.20 5.80 5.60 5.40 5.60Czech Republic 4.40 4.50 4.80 4.90 5.60 5.50Hungary 8.00 8.20 7.70 7.30 6.50 6.20Poland 5.88 5.71 5.96 5.88 6.05 5.72Romania (5Y) 8.75 8.00 7.80 8.00 8.50 7.00Russia 8.00 7.50 7.80 8.00 8.00 -Slovakia 4.60 4.70 4.75 4.80 4.90 4.90Ukraine (5Y) 10.80 10.50 10.10 9.80 9.70 9.70
Source: ING estimates
_
The charts below illustrate the striking difference between our forecast Western European and EMEA 10-year bond rates. The strongest bond rate increase is expected in Switzerland, where 10-year bond rates are expected to rise by 160bp in the period between March 2010 and December 2012. NSI wants to grow substantially in Switzerland and should lock in the cost of debt, in our view. In EMEA, 10-year bond rates are expected to fall in most countries, with the exception of Slovakia and the Czech Republic. Russia is expected to have flat 10-year interest rates over the period.
Fig 76 10y bond Dec 2012F - Mar 2010F (%)
Fig 77 10y bond Dec 2012F - Mar 2010F (%)
0.00 0.50 1.00 1.50 2.00
US: Fed funds
UK
EU12: ECB refi
Norway
Sweden
Switzerland
-2.00 -1.50 -1.00 -0.50 0.00 0.50 1.00 1.50
C zech Republic
Slovakia
Russia
Poland
Croatia
Ukraine (5Y)
Bulgaria
Romania (5Y)
Hungary
Source: ING estimates Source: ING estimates
_
We expect most EMEA 10-year rates to fall and
all Western European ones to rise

60
Benelux Real Estate February 2010
Inflation – CPI forecasts The table below shows our CPI forecasts. We believe that the Eurozone will have lower inflation than the global economy, the US and the UK, in both 2010 and 2011. EMEA is expected to show the highest inflation rates, illustrated in the table below.
Fig 78 CPI forecasts 2009 – 2011 (%YoY)
4Q09 1Q10 2Q10 3Q10 2009F 2010F 2011F
G7 World 1.4 2.0 2.1 1.9 1.0 2.0 1.9US 1.5 2.8 3.0 2.6 -0.3 2.7 2.0Japan -2.0 -1.6 -1.3 -0.8 -1.3 -1.0 0.2Germany 0.4 1.1 1.3 1.5 0.3 1.4 1.7France 0.2 1.0 1.3 1.6 0.1 1.5 1.9UK 2.0 2.9 2.4 2.0 2.2 2.3 2.2Italy 0.7 1.5 1.4 1.7 0.8 1.6 1.7Canada 0.6 0.6 0.5 0.6 0.5 1.9 2.2
Western Europe Eurozone 0.5 1.2 1.4 1.4 0.3 1.4 1.8Spain 0.4 1.0 1.3 1.6 -0.3 1.4 1.6Netherlands 0.9 1.1 0.9 1.6 1.2 1.2 1.1Belgium -0.3 1.1 1.8 1.5 -0.1 1.5 2.0Greece 1.9 2.5 2.5 2.3 1.3 2.4 2.0Switzerland -0.2 0.7 1.7 1.0 -0.5 1.0 1.3Sweden -0.4 1.1 1.3 1.4 -0.3 1.4 1.8Norway 1.3 1.6 1.5 1.9 2.2 1.8 2.0Iceland 8.6 7.3 6.2 3.7 12.2 4.7 1.6
EMEA Bulgaria 0.0 0.4 0.0 1.2 2.8 1.1 3.0Croatia 1.8 1.6 1.2 1.9 2.4 1.9 2.8Czech Republic 1.0 1.3 1.5 2.0 2.4 1.6 2.5Hungary 5.6 4.8 3.9 3.2 4.2 3.8 3.0Kazakhstan 6.0 7.5 7.1 - 7.4 7.2 8.0Poland 3.4 2.9 1.8 1.6 3.5 2.1 2.1Romania 4.7 3.9 4.4 5.3 5.6 4.7 4.5Russi 9.3 7.1 5.9 - 11.8 6.1 8.2Slovakia 0.3 0.0 0.3 0.6 1.0 0.2 2.1Turkey 6.5 7.7 8.6 8.8 6.3 7.9 6.2Ukraine 12.3 11.8 12.9 12.7 16.0 12.6 11.7
Source: ING estimates
_
The CPI outliers are the Ukraine, Russia, Kazakhstan and Turkey (7.9% in 2010 and 6.2% in 2011). Norway and Sweden, which are expected to post strong GDP growth, are not expected to see strong inflation. Belgian inflation is forecast to be 2% in 2011 versus just 1.1% in the Netherlands. This reverses the 2009 inflation number where Belgium showed deflation of 0.1% and the Netherlands suffered inflation of 1.2%.
Belgian inflation expectations outlook
Our Belgium economists believe that the strong historic link of automatic wage indexation to inflation will trigger price rises. In addition, the Belgian economy seems to be more sensitive to oil price rises than most of the surrounding countries. This explains why our economists believe that Belgian inflation will run 20bp above the Eurozone average of 1.8%.
No such thing as Benelux inflation
Eurozone expected to show lowest inflation in
2010 and 2011
Oil sensitive and indexed wages
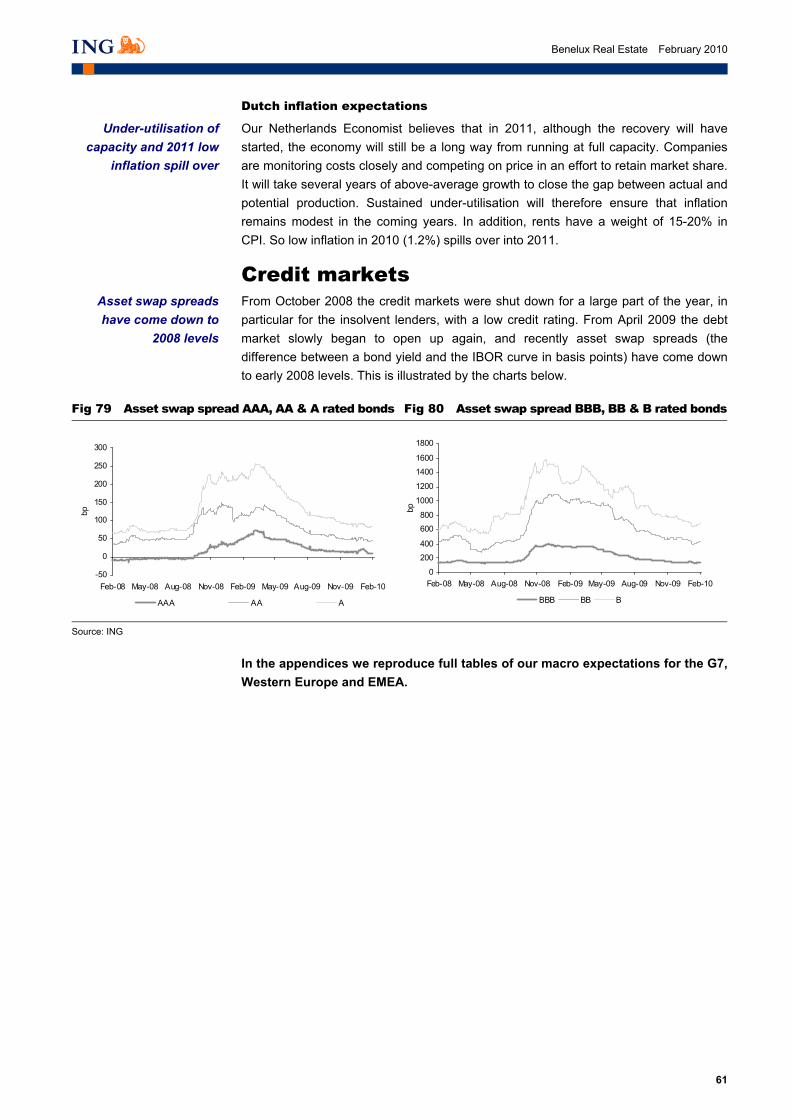
61
Benelux Real Estate February 2010
Dutch inflation expectations
Our Netherlands Economist believes that in 2011, although the recovery will have started, the economy will still be a long way from running at full capacity. Companies are monitoring costs closely and competing on price in an effort to retain market share. It will take several years of above-average growth to close the gap between actual and potential production. Sustained under-utilisation will therefore ensure that inflation remains modest in the coming years. In addition, rents have a weight of 15-20% in CPI. So low inflation in 2010 (1.2%) spills over into 2011.
Credit markets From October 2008 the credit markets were shut down for a large part of the year, in particular for the insolvent lenders, with a low credit rating. From April 2009 the debt market slowly began to open up again, and recently asset swap spreads (the difference between a bond yield and the IBOR curve in basis points) have come down to early 2008 levels. This is illustrated by the charts below.
Fig 79 Asset swap spread AAA, AA & A rated bonds Fig 80 Asset swap spread BBB, BB & B rated bonds
-50
0
50
100
150
200
250
300
Feb-08 May-08 Aug-08 Nov-08 Feb-09 May-09 Aug-09 Nov-09 Feb-10
bp
AAA AA A
0
200
400
600800
1000
1200
1400
1600
1800
Feb-08 May-08 Aug-08 Nov-08 Feb-09 May-09 Aug-09 Nov-09 Feb-10
bp
BBB BB B
Source: ING
_
In the appendices we reproduce full tables of our macro expectations for the G7, Western Europe and EMEA.
Under-utilisation of capacity and 2011 low
inflation spill over
Asset swap spreads have come down to
2008 levels

62
Benelux Real Estate February 2010
This page is left blank intentionally

63
Benelux Real Estate February 2010
Companies

64
Benelux Real Estate February 2010
This page is left blank intentionally

65
Benelux Real Estate February 2010
Belgium
Aedifica Ex-expats?
Key ratios (%)
2008/09 2009/10F
Rental growth 20.5 1.2Operating margin 70.8 69.7Occupancy rate 96.2 95.5
Share data No of shares (€m) 4.7Daily turnover (shares, 3M) 3,700Free float (%) 100Enterprise value (€m) 367.96Market cap (€m) 188.61
12-month forecast returns (%) Share price -16.0Dividend 4.712m f'cst total return -11.3
Share price performance
15
20
25
30
35
40
45
1/08 7/08 1/09 7/09 1/10
Price BEL 20 (rebased)
Source: ING
Aedifica shares have performed well, up c.20% since April lows. The results in the apartments and hotels division are likely to offset resilience in nursing homes, leading to a fall of nearly 20% in 2010F EPS. SELL.
Initiating coverage
€40.555 February 2010
Sell
Real Estate
€33.88 Target price (12 month)
AOO.BR Reuters
Jean-Yves Devloo Amsterdam (31) 20 563 8745 [email protected]
Arjan Knibbe Amsterdam (31) 20 563 8780 [email protected]
We believe the furnished part of the portfolio will disappoint, relying on short-term Brussels CBD corporate rentals. Nursing homes (currently c.46% of the portfolio’s value) will only partly limit the damage. The FY08/09 dividend of €1.80 might be at risk. Valued at a FY09/10F PER of c.21x, we prefer to take profits and wait for further nursing home deals to add stability.
Sensitivity of 2010F EPS to vacancy and total like-for-like (€)
Vacancy rate (%) 2.5 3.5 4.5 5.5 6.5 7.5 8.5 9.5 -1 1.83 1.78 1.73 1.68 1.62 1.57 1.52 1.47 0 1.88 1.83 1.78 1.72 1.67 1.62 1.57 1.52 1 1.93 1.88 1.82 1.77 1.72 1.67 1.62 1.57LFL (%) 2 1.98 1.92 1.87 1.82 1.77 1.72 1.67 1.62 3 2.03 1.97 1.92 1.87 1.82 1.77 1.72 1.67 4 2.07 2.02 1.97 1.92 1.87 1.82 1.77 1.72 5 2.12 2.07 2.02 1.97 1.92 1.87 1.82 1.77 6 2.17 2.12 2.07 2.02 1.97 1.92 1.87 1.82
Source: ING estimates _
Key ratios and forecasts
Yr to June 2008/09 2009/10F 2010/11F 2011/12F 2012/13F
EPS adj (€) 2.09 1.91 2.38 2.61 2.74PER (x) 19.1 20.9 16.9 15.3 14.6Net yield (%) 6.5 6.4 5.7 5.8 6.0IFRS NAV per share (€) 37.7 35.4 35.7 36.4 37.0EPRA NNNAV per share (€) N/A N/A N/A N/A N/AP/IFRS NAV (%) 1.06 1.13 1.12 1.10 1.08DPS (€) 1.80 1.82 2.14 2.35 2.46Dividend yield (%) 4.5 4.5 5.3 5.9 6.1CFPS (€) 2.09 1.91 2.38 2.61 2.74LTV (%) 53.0 55.8 60.6 59.9 59.3
Source: Company data, ING estimates _
_

66
Benelux Real Estate February 2010
Investment case
Aedifica owns a c.€351m portfolio and has a strong track record in the nursing homes segment, valued at 46% of total portfolio. Aedifica has nearly 2,100 beds, on triple-net long-term rental contracts to solvent operators. The most important value drivers are Belgium’s population demographics, favourable legislation regarding nursing homes, the need for more consolidation among nursing home operators and (longer term) value-driven investments. We find management very ambitious and focused on achieving cash-flow growth, fuelled by nursing home acquisitions, likely to be combined with the issuance of additional equity. Value-based investments in the apartments segment are likely to add growth in the longer run given the short maturity profile of the portfolio. The current business model is likely to suffer from a cyclical downturn in the Brussels short-term rental market. The dividend only looks sustainable based on a 94% payout rate (86% in FY08/09). We believe Aedifica is currently overbought and prefer to cash in. Sell on strength.
SWOT Fig 81 SWOT analysis
Strengths Weaknesses
Diversified portfolio (albeit that short-term apartment leases will suffer in coming quarters)
Independent corporate governance structure allows quick expansion of the portfolio without controlling shareholders’ interference
Residential REIT: no withholding tax is imposed on the dividends
Ambitious and commercial management
Aedifica is a small and flexible company
Short-debt maturity
Lack of implementation of the EPRA best practice recommendations
Unfurnished apartments will hurt EPS
Small liquidity and market cap limits visibility for institutional investors
Apartments portfolio is too young to allow value creation from lot-for-lot sales
Low operating margin
Opportunities Threats/Risks
Strong equity story for future growth with nursing home acquisitions
Supportive macro economic and legal environment regarding nursing home investments
Student housing
Public private partnerships in the undersupplied Brussels social housing segment
Limited tax advantages for Belgian households buying their house compared with other countries leads to a stronger tenant market
Addition of more growth should allow a fully internalised management structure in furnished apartments and an improving operating margin
Need for more consolidation among nursing home operators creates ample opportunities for real estate partnerships
Add value by adding nursing home developments
Persistence of the economic crisis may cause a slump in the Brussels short rental market
According to our model, he dividend FY09/10 is only sustainable on a 98% payout basis
Change in the favourable government attitude regarding subsidies to nursing home operators
Source: ING _

67
Benelux Real Estate February 2010
Risks Because of the contractual nature of a large part of the recurring cash flows, property companies are usually considered to have less risk than most other equity sectors. The risks for any property company bear a strong relationship with the amount of development exposure, the geographical and sector breakdown, corporate governance and the alignment of interest between management and shareholders.
Principally an investor
We believe that Aedifica carries low risk as it is principally an investor, which is the least risky activity of the four core real estate company activities: investment, development, trading and asset management. The current business model carries some cyclical risk with the furnished apartments (which are generally short-term let to Central Brussels-based expats), a market that is expected to suffer heavily from the economic crisis. We expect additional nursing homes to remove some cyclicality.
Tenant risk
Approximately 40% of FY08/09 rents was derived from nursing home operators, who have long-term, triple-net, indexed rental contracts. We believe these rental inflows carry low risk as c.50% of the nursing home operators’ income is secured by government subsidies.
Accounting for leases
There are accounting initiatives that may lead to the obligation of tenants to account long leases as a liability in their balance sheets. This could, in the future, put pressure on the average lease lengths of real estate companies and Aedifica.
No currency risks
All rents and expenses are made in euro, so there are no currency risks.
Catalysts We see the following catalysts:
• performance of the furnished apartments versus our expectations
• increase in the proportion of nursing homes in the current portfolio
• effect of the economic crisis on the Brussels rental market
• Half-year results on 16 February
• Diversification into student housing
• Public-private partnership in the undersupplied social housing sector
• Change in the government’s attitude towards nursing home care
Outlook Aedifica said it hopes to maintain the FY08/09 dividend of €1.80. We believe this guidance could be at risk (it would involve a 94% payout according to our model), on the back of limited indexation and increasing vacancies, primarily in the unfurnished apartments segment.
We believe dividend could be at risk
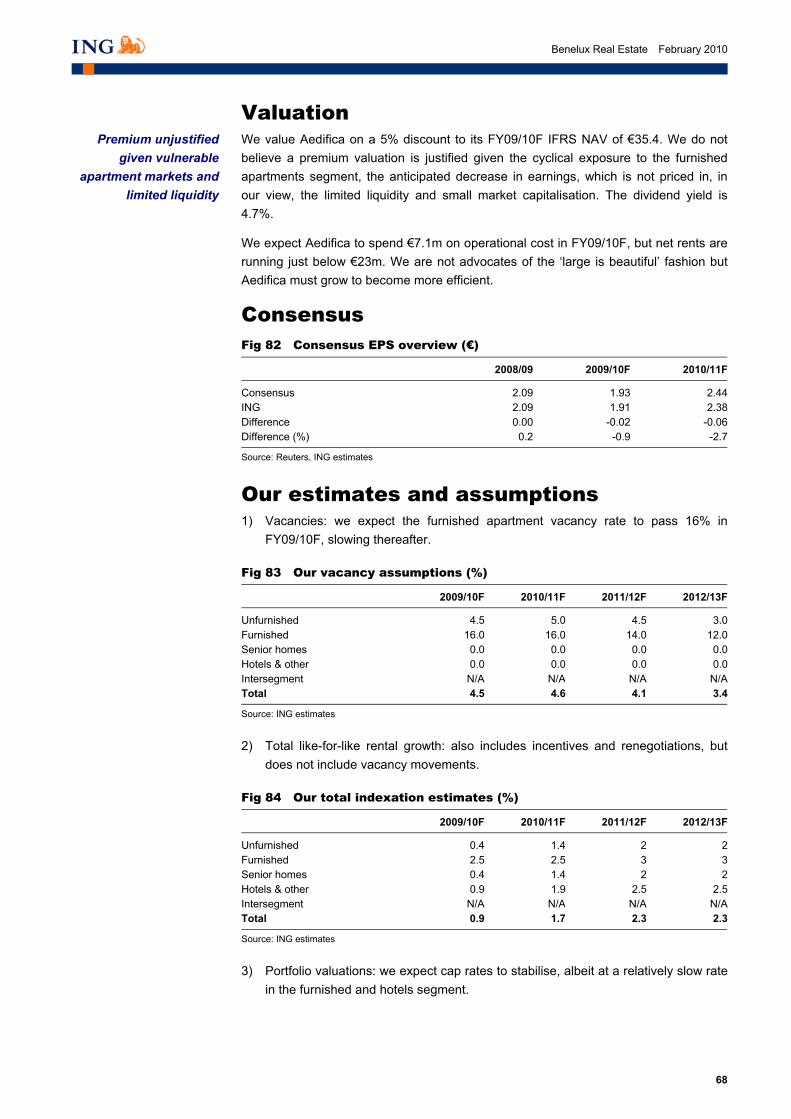
68
Benelux Real Estate February 2010
Valuation We value Aedifica on a 5% discount to its FY09/10F IFRS NAV of €35.4. We do not believe a premium valuation is justified given the cyclical exposure to the furnished apartments segment, the anticipated decrease in earnings, which is not priced in, in our view, the limited liquidity and small market capitalisation. The dividend yield is 4.7%.
We expect Aedifica to spend €7.1m on operational cost in FY09/10F, but net rents are running just below €23m. We are not advocates of the ‘large is beautiful’ fashion but Aedifica must grow to become more efficient.
Consensus Fig 82 Consensus EPS overview (€)
2008/09 2009/10F 2010/11F
Consensus 2.09 1.93 2.44ING 2.09 1.91 2.38Difference 0.00 -0.02 -0.06Difference (%) 0.2 -0.9 -2.7
Source: Reuters, ING estimates
_
Our estimates and assumptions 1) Vacancies: we expect the furnished apartment vacancy rate to pass 16% in
FY09/10F, slowing thereafter.
Fig 83 Our vacancy assumptions (%)
2009/10F 2010/11F 2011/12F 2012/13F
Unfurnished 4.5 5.0 4.5 3.0Furnished 16.0 16.0 14.0 12.0Senior homes 0.0 0.0 0.0 0.0Hotels & other 0.0 0.0 0.0 0.0Intersegment N/A N/A N/A N/ATotal 4.5 4.6 4.1 3.4
Source: ING estimates
_
2) Total like-for-like rental growth: also includes incentives and renegotiations, but does not include vacancy movements.
Fig 84 Our total indexation estimates (%)
2009/10F 2010/11F 2011/12F 2012/13F
Unfurnished 0.4 1.4 2 2Furnished 2.5 2.5 3 3Senior homes 0.4 1.4 2 2Hotels & other 0.9 1.9 2.5 2.5Intersegment N/A N/A N/A N/ATotal 0.9 1.7 2.3 2.3
Source: ING estimates
_
3) Portfolio valuations: we expect cap rates to stabilise, albeit at a relatively slow rate in the furnished and hotels segment.
Premium unjustified given vulnerable
apartment markets and limited liquidity

69
Benelux Real Estate February 2010
Fig 85 Our valuation assumptions (%)
2009/10F 2010/11F 2011/12F 2012/13F
Unfurnished -1.5 0.0 1.0 1.0Furnished -4.7 -1.0 0.0 0.0Senior homes -0.5 0.0 0.0 0.0Hotels & other -4.9 -2.0 -0.5 0.0Total -1.7 -0.3 0.2 0.3
Source: ING estimates
_

70
Benelux Real Estate February 2010
Company profile
Aedifica was founded at the end of 2005 by the Belgian bank, Degroof, and the Brussels-based real estate broker, GVA finance, with the strategy of developing a Belgium-based residential real estate portfolio. This was done according to a three-point investment strategy:
• Presence in large and important city centres in Belgium as people tend to prefer cities over less urbanised areas;
• Address the living needs of an overall ageing population;
• Focus on niche opportunities, such as temporary furnished apartments on short-term lets with several add on services
After being recognised as a Bevak/Sicafi (Belgian REIT structure) shortly after its foundation, Aedifica was quoted at end-2006. At the time of writing, Aedifica is operating as the foremost quoted investor in residential real estate in Belgium with a portfolio valued at €351m as at end-September 2009, spread over nursing homes, furnished and unfurnished apartments and hotels.
Fig 86 Breakdown per type of asset
Fig 87 Breakdown per location
Unfurnished apartments
32%
Furnished apartments
12%
Senior homes46%
Other10%
Brussels63%
Flanders16%
Wallonia21%
Source: Company data Source: Company data
_
Aedifica is recognised as a residential Sicafi, and therefore must be distinguished from other, general Sicafi’s in that there is no withholding tax levied on the dividends distributed. This is because the registration rights cannot be deferred on the tenants, but must be paid by the owner, which is not the case with Sicafi’s that invest in other asset classes.
Aedifica’s growth is primarily based on the generation of stable and growing cash flows. Lot-for-lot apartment sales should add additional value. Given the portfolio’s young profile, we believe growth will especially come from the nursing homes as the apartment buildings are too young to be suited for lot-for-lot sales.
Belgian residential player
Residential Sicafi pays no witholding tax on
dividends
Cash flow growth versus value growth
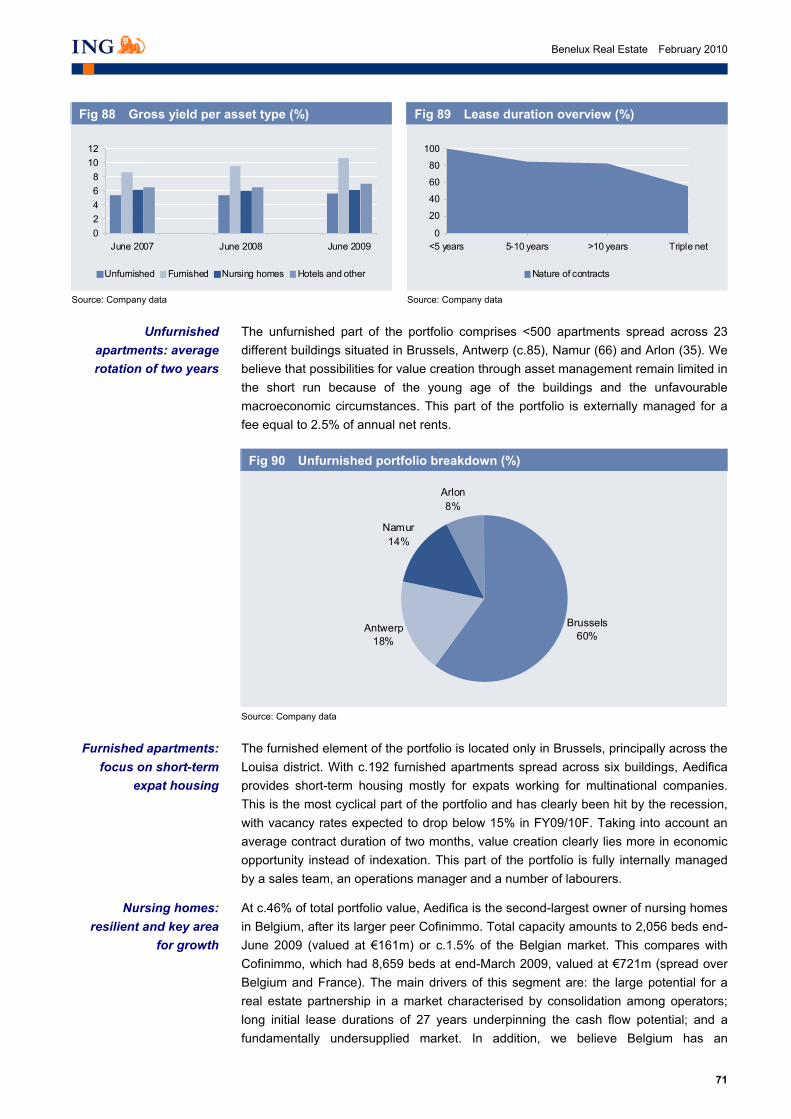
71
Benelux Real Estate February 2010
Fig 88 Gross yield per asset type (%)
Fig 89 Lease duration overview (%)
02468
1012
June 2007 June 2008 June 2009
Unfurnished Furnished Nursing homes Hotels and other
0
20
40
60
80
100
<5 years 5-10 years >10 years Triple net
Nature of contracts
Source: Company data Source: Company data
The unfurnished part of the portfolio comprises <500 apartments spread across 23 different buildings situated in Brussels, Antwerp (c.85), Namur (66) and Arlon (35). We believe that possibilities for value creation through asset management remain limited in the short run because of the young age of the buildings and the unfavourable macroeconomic circumstances. This part of the portfolio is externally managed for a fee equal to 2.5% of annual net rents.
Fig 90 Unfurnished portfolio breakdown (%)
Brussels60%
Antwerp18%
Namur14%
Arlon8%
Source: Company data
_
The furnished element of the portfolio is located only in Brussels, principally across the Louisa district. With c.192 furnished apartments spread across six buildings, Aedifica provides short-term housing mostly for expats working for multinational companies. This is the most cyclical part of the portfolio and has clearly been hit by the recession, with vacancy rates expected to drop below 15% in FY09/10F. Taking into account an average contract duration of two months, value creation clearly lies more in economic opportunity instead of indexation. This part of the portfolio is fully internally managed by a sales team, an operations manager and a number of labourers.
At c.46% of total portfolio value, Aedifica is the second-largest owner of nursing homes in Belgium, after its larger peer Cofinimmo. Total capacity amounts to 2,056 beds end-June 2009 (valued at €161m) or c.1.5% of the Belgian market. This compares with Cofinimmo, which had 8,659 beds at end-March 2009, valued at €721m (spread over Belgium and France). The main drivers of this segment are: the large potential for a real estate partnership in a market characterised by consolidation among operators; long initial lease durations of 27 years underpinning the cash flow potential; and a fundamentally undersupplied market. In addition, we believe Belgium has an
Unfurnished apartments: average rotation of two years
Furnished apartments: focus on short-term
expat housing
Nursing homes: resilient and key area
for growth

72
Benelux Real Estate February 2010
advantageous regulatory system that ensures full occupancy, and triple-net letting contracts pushing all operating costs towards the tenant and thus ensuring an operating margin of 100%.6
Fig 91 Key nursing home tenants according to FY08/09 total nursing home rental income (%)
New Philip13%
Château Chenois Gestion
18%
Medibelge30%
Futuro9%
Senior Living Group23%
Armonea7%
Source: Company data
_
Aedifica currently has two hotels, which are fully let on a triple net basis and have been part of the portfolio since the start of the company. Given the limited size of these assets (c.10% of the portfolio’s contractual rents), there is no risk that the residential status of the Sicafi would be lost, resulting in taxability of the dividends distributed (residential Sicafi’s must have at least 60% of funds invested in residential real estate).
Fig 92 Top-ten assets according to FY08/09 estimated rental value
Name Type Location Floor area (000m²)
Residential units
Occupancy rate (%)
Estimated rental value
(€m)
% of group ERV
Complex Opperstraat Furnished appt Brussels 11.9 116.0 84.2 1.4 6.2Hotel Martin's Brugge Hotel Bruges 11.4 - 100.0 1.1 4.9Residentie Parc Palace Senior home Brussels 6.7 180.0 100.0 1.1 4.8Zavel Unfurnished appt Brussels 4.7 30.0 92.7 1.0 4.7Résidence du Golf Senior home Brussels 6.4 202.0 100.0 1.0 4.5Residentie Service Senior home Brussels 8.7 200.0 100.0 0.9 4.2Ring Unfurnished appt Antwerp 10.2 82.0 100.0 0.8 3.7Château Chenois Senior home Waterloo 6.4 75.0 100.0 0.8 3.6Residentie Palace Unfurnished appt Brussels 6.4 57.0 82.9 0.7 3.1Tervuren 13 A/B Unfurnished appt Brussels 4.6 3.0 84.1 0.7 3.0
Total 77.4 9.5 42.7Portfolio total 184.9 22.0 100.0% of portfolio total 41.9 43.2
Source: Company data
_
6 For a general overview of the nursing homes business, refer to the front section of this book
Hotels are not strategically owned
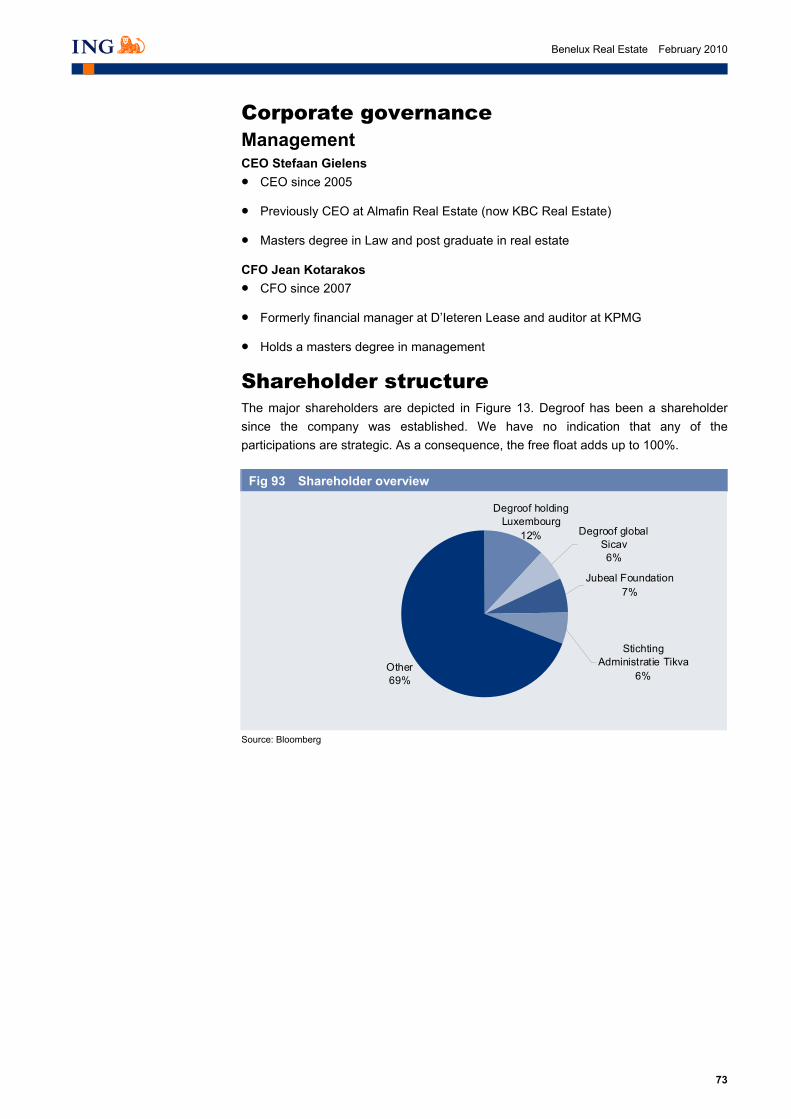
73
Benelux Real Estate February 2010
Corporate governance Management CEO Stefaan Gielens • CEO since 2005
• Previously CEO at Almafin Real Estate (now KBC Real Estate)
• Masters degree in Law and post graduate in real estate
CFO Jean Kotarakos • CFO since 2007
• Formerly financial manager at D’Ieteren Lease and auditor at KPMG
• Holds a masters degree in management
Shareholder structure The major shareholders are depicted in Figure 13. Degroof has been a shareholder since the company was established. We have no indication that any of the participations are strategic. As a consequence, the free float adds up to 100%.
Fig 93 Shareholder overview
Other69%
Degroof holding Luxembourg
12% Degroof global Sicav6%
Jubeal Foundation7%
Stichting Administratie Tikva
6%
Source: Bloomberg
_

74
Benelux Real Estate February 2010
Financials
Fig 94 Balance sheet (€m)
As at 30 June 2008/09 2009/10F 2010/11F 2011/12F 2012/13F 2014/15F
Goodwill 1.9 1.9 1.9 1.9 1.9 1.9Intangible fixed assets 0.1 0.1 0.1 0.1 0.1 0.1Investment properties 351.1 361.2 410.1 411.0 412.2 413.3Project developments 5.2 5.2 5.2 5.2 5.2 5.2Other fixed assets 1.7 1.7 1.7 1.7 1.7 1.7Financial fixed assets 3.2 3.2 3.2 3.2 3.2 3.2Financial lease receivables 0.0 0.0 0.0 0.0 0.0 0.0Participations 0.0 0.0 0.0 0.0 0.0 0.0Receivables and other 0.0 0.0 0.0 0.0 0.0 0.0Deferred taxes 0.0 0.0 0.0 0.0 0.0 0.0Total fixed assets 363.1 373.2 422.1 423.1 424.2 425.4Assets held for sale 0.0 0.0 0.0 0.0 0.0 0.0Current financial assets 0.0 0.0 0.0 0.0 0.0 0.0Financial lease receivables 0.0 0.0 0.0 0.0 0.0 0.0Trade debtors 1.1 1.2 1.4 1.4 1.5 1.5Deferred taxes 2.9 3.0 3.5 3.6 3.7 3.8Cash and equivalent 1.0 (14.6) (61.8) (59.6) (57.8) (56.0)Accruals 0.4 0.4 0.4 0.4 0.4 0.5Total current assets 5.3 (10.0) (56.6) (54.2) (52.3) (50.3)Total assets 368.4 363.2 365.6 368.8 371.9 375.1
Total equity to shareholders 172.7 167.1 168.5 171.6 174.5 177.4Minority interests 0.0 0.0 0.0 0.0 0.0 0.0Total equity 172.7 167.1 168.5 171.6 174.5 177.4Provisions 0.0 0.0 0.0 0.0 0.0 0.0Long-term financial debt 176.3 176.3 176.3 176.3 176.3 176.3Other long-term financial debt 13.5 13.5 13.5 13.5 13.5 13.5Trade debt and others 0.0 0.0 0.0 0.0 0.0 0.0Other long-term debt 0.0 0.0 0.0 0.0 0.0 0.0Deferred taxes 0.0 0.0 0.0 0.0 0.0 0.0Total long-term liabilities 189.8 189.8 189.8 189.8 189.8 189.8Provisions 0.0 0.0 0.0 0.0 0.0 0.0Current financial debt 0.0 0.0 0.0 0.0 0.0 0.0Other short-term financial debt 0.0 0.0 0.0 0.0 0.0 0.0Trade debt and other 4.0 4.2 4.9 5.0 5.1 5.3Other short-term debts 0.0 0.0 0.0 0.0 0.0 0.0Accruals 1.9 2.1 2.4 2.4 2.5 2.6Total short-term liabilities 5.9 6.3 7.2 7.4 7.6 7.8Total liabilities 195.7 196.1 197.0 197.2 197.5 197.7Total equity and liabilities 368.4 363.2 365.6 368.8 371.9 375.1
Source: Company data, ING estimates
_

75
Benelux Real Estate February 2010
Fig 95 Profit and loss (€m)
Yr to June 2008/09 2009/10F 2010/11F 2011/12F 2012/13F 2014/15F
Gross rents 23.1 23.9 26.9 28.4 29.2 30.1Rent expenses (0.1) (0.1) (0.1) (0.1) (0.1) (0.1)Net rents 22.9 22.9 23.3 24.0 24.7 25.4Subtotal operational costs ex portfolio result (6.6) (7.1) (8.0) (8.5) (8.7) (9.0)Operational property result before portfolio result 16.3 16.7 18.8 19.8 20.4 21.0Gain on sales 0.0 0.0 0.0 0.0 0.0 0.0Gain on sales other non financial assets 0.0 0.0 0.0 0.0 0.0 0.0FV on property (9.7) (6.1) (1.1) 1.0 1.1 1.1Total operational result 6.6 10.5 17.6 20.8 21.5 22.1Financial gains 1.3 0.0 0.0 0.0 0.0 0.0Interest costs (7.9) (8.0) (8.0) (8.0) (8.0) (8.0)Net interest costs (6.5) (8.0) (8.0) (8.0) (8.0) (8.0)Net financial result (15.4) (8.0) (8.0) (8.0) (8.0) (8.0)Result before taxes (8.8) 2.5 9.7 12.8 13.5 14.1Corporation tax 0.0 0.0 (0.1) (0.1) (0.1) (0.1)Total taxes 0.0 0.0 (0.1) (0.1) (0.1) (0.1)Net result (8.9) 2.5 9.6 12.7 13.5 14.1Net result attributed to shareholders (8.9) 2.5 9.6 12.7 13.5 14.1
Source: Company data, ING estimates _
Fig 96 Cash flow statement (€m)
Yr to June 2008/09 2009/10F 2010/11F 2011/12F 2012/13F 2014/15F
Net result (8.9) 2.5 9.6 12.7 13.5 14.1Minority interest 0.0 0.0 0.0 0.0 0.0 0.0Taxes 0.0 0.0 0.0 0.0 0.0 0.0Depreciations 0.3 0.0 0.0 0.0 0.0 0.0Amortisations 0.1 0.0 0.0 0.0 0.0 0.0FV changes on investment properties and developments 9.7 6.1 1.1 (1.0) (1.1) (1.1)Gains on sales 0.0 0.0 0.0 0.0 0.0 0.0Financial result 15.4 0.0 0.0 0.0 0.0 0.0Change in trade debtors (0.5) (0.1) (0.2) 0.0 0.0 0.0Change in tax debts and other current assets 0.5 (0.1) (0.5) (0.1) (0.1) (0.1)Change in accruals (asset items) 0.3 0.0 (0.1) 0.0 0.0 0.0Change in trade debts and other current debts (except exit tax) 0.3 0.2 0.6 0.1 0.1 0.1Change in accruals (liability items) 0.4 0.2 0.3 0.1 0.1 0.1Total cash from operating activities 17.8 8.8 11.0 11.8 12.4 13.0Taxes paid (0.1) 0.0 0.0 0.0 0.0 0.0CF from operating activities (net) 17.8 8.8 11.0 11.8 12.4 13.0
Financial fixed asset purchases 0.0 0.0 0.0 0.0 0.0 0.0Purchases of investment companies (7.4) (16.2) (50.0) 0.0 0.0 0.0Purchases of other fixed assets (0.1) 0.0 0.0 0.0 0.0 0.0Purchases of project developments (2.4) 0.0 0.0 0.0 0.0 0.0Sale of investment properties 0.0 0.0 0.0 0.0 0.0 0.0Payment of non current debtors 1.2 0.0 0.0 0.0 0.0 0.0Net investment in other fixed assets 0.0 0.0 0.0 0.0 0.0 0.0CF from Investment activities (8.7) (16.2) (50.0) 0.0 0.0 0.0
Capital raise (net of expenses) 0.0 0.0 0.0 0.0 0.0 0.0Sale of own shares 0.0 0.0 0.0 0.0 0.0 0.0Dividend of previous year (7.5) (8.1) (8.2) (9.6) (10.6) (11.1)Net change in bank credit lines 14.3 0.0 0.0 0.0 0.0 0.0Net change in other loans 0.0 0.0 0.0 0.0 0.0 0.0Net financial expenses paid (7.0) 0.0 0.0 0.0 0.0 0.0Redemption of financial debt of companies acquired (2.5) 0.0 0.0 0.0 0.0 0.0Redemption of working capital needs of companies acquired (5.8) 0.0 0.0 0.0 0.0 0.0CF from financing activities (8.5) (8.1) (8.2) (9.6) (10.6) (11.1)
Total cash flow 0.6 (15.6) (47.2) 2.2 1.8 1.9Cash BOP 0.4 1.0 (14.6) (61.8) (59.6) (57.8)Cash EOP 1.0 (14.6) (61.8) (59.6) (57.8) (56.0)
Source: Company data, ING estimates _
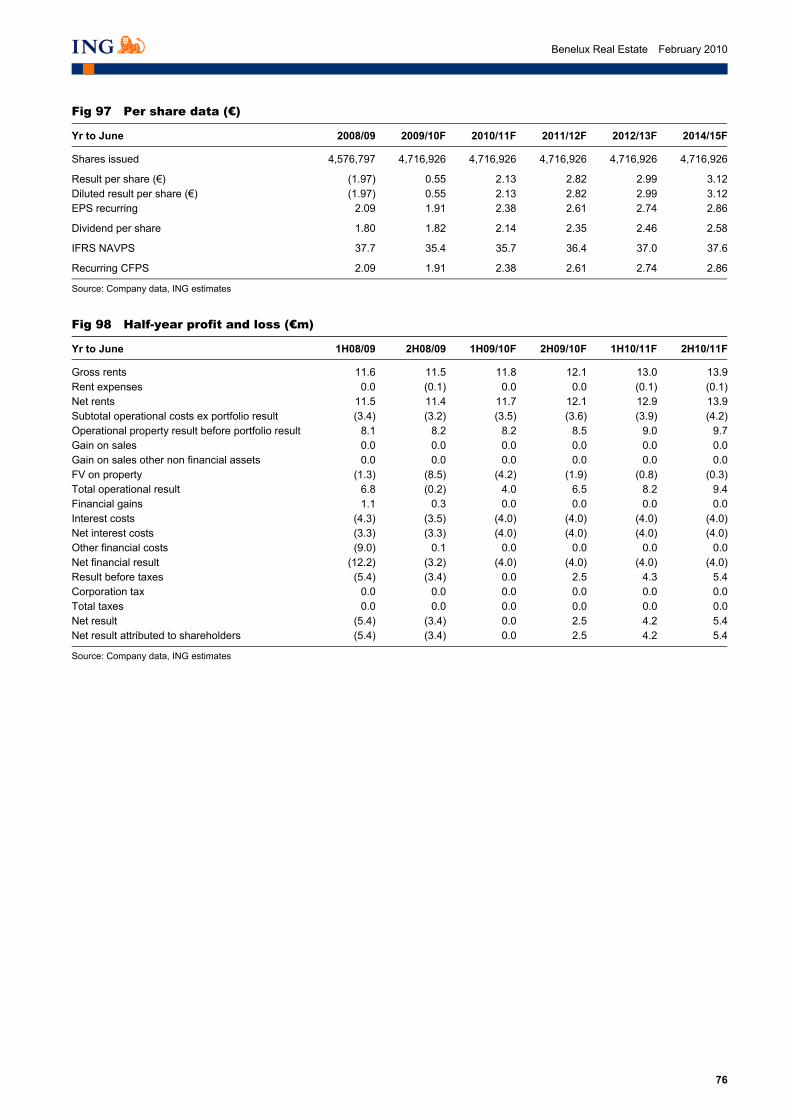
76
Benelux Real Estate February 2010
Fig 97 Per share data (€)
Yr to June 2008/09 2009/10F 2010/11F 2011/12F 2012/13F 2014/15F
Shares issued 4,576,797 4,716,926 4,716,926 4,716,926 4,716,926 4,716,926
Result per share (€) (1.97) 0.55 2.13 2.82 2.99 3.12Diluted result per share (€) (1.97) 0.55 2.13 2.82 2.99 3.12EPS recurring 2.09 1.91 2.38 2.61 2.74 2.86
Dividend per share 1.80 1.82 2.14 2.35 2.46 2.58
IFRS NAVPS 37.7 35.4 35.7 36.4 37.0 37.6
Recurring CFPS 2.09 1.91 2.38 2.61 2.74 2.86
Source: Company data, ING estimates
_
Fig 98 Half-year profit and loss (€m)
Yr to June 1H08/09 2H08/09 1H09/10F 2H09/10F 1H10/11F 2H10/11F
Gross rents 11.6 11.5 11.8 12.1 13.0 13.9Rent expenses 0.0 (0.1) 0.0 0.0 (0.1) (0.1)Net rents 11.5 11.4 11.7 12.1 12.9 13.9Subtotal operational costs ex portfolio result (3.4) (3.2) (3.5) (3.6) (3.9) (4.2)Operational property result before portfolio result 8.1 8.2 8.2 8.5 9.0 9.7Gain on sales 0.0 0.0 0.0 0.0 0.0 0.0Gain on sales other non financial assets 0.0 0.0 0.0 0.0 0.0 0.0FV on property (1.3) (8.5) (4.2) (1.9) (0.8) (0.3)Total operational result 6.8 (0.2) 4.0 6.5 8.2 9.4Financial gains 1.1 0.3 0.0 0.0 0.0 0.0Interest costs (4.3) (3.5) (4.0) (4.0) (4.0) (4.0)Net interest costs (3.3) (3.3) (4.0) (4.0) (4.0) (4.0)Other financial costs (9.0) 0.1 0.0 0.0 0.0 0.0Net financial result (12.2) (3.2) (4.0) (4.0) (4.0) (4.0)Result before taxes (5.4) (3.4) 0.0 2.5 4.3 5.4Corporation tax 0.0 0.0 0.0 0.0 0.0 0.0Total taxes 0.0 0.0 0.0 0.0 0.0 0.0Net result (5.4) (3.4) 0.0 2.5 4.2 5.4Net result attributed to shareholders (5.4) (3.4) 0.0 2.5 4.2 5.4
Source: Company data, ING estimates _

77
Benelux Real Estate February 2010
Fig 99 Half-year cash flow statement (€m)
Yr to June 1H08/09 2H08/09 1H09/10F 2H09/10F 1H10/11F 2H10/11F
Net result (5.4) (3.4) 0.0 2.5 4.2 5.4Minority interest 0.0 0.0 0.0 0.0 0.0 0.0Taxes 0.0 0.0 0.0 0.0 0.0 0.0Depreciations 0.2 0.2 0.0 0.0 0.0 0.0Amortisations 0.0 0.1 0.0 0.0 0.0 0.0FV changes on investment properties and developments 1.3 8.5 4.2 1.9 0.8 0.3Gains on sales 0.0 0.0 0.0 0.0 0.0 0.0Financial result 12.2 3.2 0.0 0.0 0.0 0.0Change in trade debtors (0.5) 0.0 (0.1) 0.0 (0.1) (0.1)Change in tax debts and other current assets 0.3 0.2 (0.1) (0.1) (0.2) (0.2)Change in accruals (asset items) 0.2 0.1 0.0 0.0 0.0 0.0Change in trade debts and other current debts (except exit tax) (0.2) 0.5 0.1 0.1 0.3 0.3Change in accruals (liability items) (0.7) 1.1 0.1 0.1 0.1 0.2Total cash from operating activities 7.4 10.4 4.3 4.5 5.1 5.8CF from operating activities (net) 7.4 10.4 4.3 4.5 5.1 5.8
Financial fixed asset purchases 0.0 0.0 0.0 0.0 0.0 0.0Purchases of investment companies (6.9) (0.5) (16.2) 0.0 (25.0) (25.0)Purchases of other fixed assets 0.0 0.0 0.0 0.0 0.0 0.0Purchases of project developments (1.7) (0.7) 0.0 0.0 0.0 0.0Sale of investment properties 0.0 0.0 0.0 0.0 0.0 0.0Payment of non current debtors 1.2 0.0 0.0 0.0 0.0 0.0Net investment in other fixed assets 0.0 0.0 0.0 0.0 0.0 0.0CF from investment activities (7.5) (1.2) (16.2) 0.0 (25.0) (25.0)
Capital raise (net of expenses) 0.0 0.0 0.0 0.0 0.0 0.0Sale of own shares 0.0 0.0 0.0 0.0 0.0 0.0Dividend of previous year (7.5) 0.0 (8.1) 0.0 (8.2) 0.0Net change in bank credit lines 21.7 (7.4) 0.0 0.0 0.0 0.0Net change in other loans 0.0 0.0 0.0 0.0 0.0 0.0Net financial expenses paid (3.5) (3.5) 0.0 0.0 0.0 0.0Redemption of financial debt of companies acquired (2.5) 0.0 0.0 0.0 0.0 0.0Redemption of working capital needs of companies acquired (8.2) 2.3 0.0 0.0 0.0 0.0CF from financing activities 0.1 (8.5) (8.1) 0.0 (8.2) 0.0
Total cash flow (0.1) 0.6 (20.0) 4.5 (28.1) (19.2)Cash BOP 0.4 0.3 1.0 (19.1) (14.6) (42.7)Cash EOP 0.3 1.0 (19.1) (14.6) (42.7) (61.8)
Source: Company data, ING estimates
_
Fig 100 Half-year per share data (€)
Yr to June 1H08/09 2H08/09 1H09/10F 2H09/10F 1H10/11F 2H10/11F
Shares issued 4,436,668 4,576,797 4,716,926 4,716,926 4,716,926 4,716,926
Result per share (€) (1.21) (0.76) 0.00 0.56 0.94 1.19EPS recurring 1.07 1.09 0.93 0.98 1.11 1.26Dividend per share 1.71 0.00 1.80 0.00 1.82 0.00
IFRS NAVPS 39.4 37.7 34.9 35.4 34.6 35.7
Recurring CFPS 1.07 1.09 0.93 0.98 1.11 1.26
Source: Company data, ING estimates
_

78
Benelux Real Estate February 2010
This page is left blank intentionally

79
Benelux Real Estate February 2010
Belgium
Befimmo Quality offices in weakening market
Key ratios (%)
Yr to Sep FY08/09 FY09/10F
Rental growth 8.7 -0.2Operating margin 89.1 88.7Occupancy rate 93.7 93.4
Share data no of shares (m) 16.8Daily turnover (shares, 3M) 25,000Free float (%) 81Enterprise value (€m) 1940.7Market cap (€m) 992.63
12-month forecast returns (%) Share price 3.0Dividend 6.612m f'cst total return 9.6
Share price performance
2030405060708090
1/08 7/08 1/09 7/09 1/10
Price BEL 20 (rebased)
Source: ING
Despite its focused quality portfolio, we believe Befimmo will underperform the European real estate market. We expect substantial lease incentives to hurt like-for-like rental growth in a deteriorating Brussels offices market. HOLD.
Maintained
€59.35 February 2010
Hold
Real Estate
€61.19 Target price (12 month): Previously: €57.8
BFB.BR Reuters
Jean-Yves Devloo Amsterdam (31) 20 563 8745 [email protected]
Arjan Knibbe Amsterdam (31) 20 563 8780 [email protected]
We expect EPS to drop 16% YoY, on the back of the recent rights issue proceeds that have not materialised in accretive acquisitions and incentives used to fill current renovations. We see limited near-term growth: our 2010-11F EPS are 3-14% and 3-7% below company guidance and consensus.
Sensitivity of our 2010F EPS to vacancy rate and total like-for-like (€)
Vacancy rate (%)
4.5 5.5 6.5 7.5 8.5 9.5 10.5 11.5 -4 4.35 4.27 4.20 4.12 4.05 3.97 3.89 3.82 -3 4.42 4.34 4.27 4.19 4.12 4.04 3.97 3.89 -2 4.49 4.41 4.34 4.26 4.19 4.11 4.04 3.96LFL (%) -1 4.56 4.48 4.41 4.33 4.26 4.18 4.11 4.03 0 4.63 4.56 4.48 4.40 4.33 4.25 4.18 4.10 1 4.70 4.63 4.55 4.48 4.40 4.32 4.25 4.17 2 4.77 4.70 4.62 4.55 4.47 4.39 4.32 4.24 3 4.84 4.77 4.69 4.62 4.54 4.47 4.39 4.31
Source: ING estimates _
Key ratios and forecasts
Year to Sep FY08/09 FY09/10F FY10/11F FY11/12F FY12/13F
EPS adj (€) 5.16 4.36 4.45 4.56 4.69PER (x) 11.5 13.6 13.3 13.0 12.6Net yield (%) 6.2 6.3 6.4 6.5 6.6IFRS NAV per share (€) 58.9 57.8 58.3 59.0 59.6EPRA NNNAV per share (€) N/A N/A N/A N/A N/AP/IFRS NAV (%) 1.0 1.0 1.0 1.0 1.0DPS (€) 4.40 3.90 4.02 4.14 4.26Dividend yield (%) 7.4 6.6 6.8 7.0 7.2CFPS (€) 5.16 4.36 4.46 4.57 4.70LTV (%) 40.9 41.1 40.5 39.8 39.1
Source: Company data, ING estimates

80
Benelux Real Estate February 2010
Investment case
With its €1.9bn portfolio of quality office space, Befimmo has a leading market position in the Brussels offices market. Befimmo has a number of key renovations that will come on stream during 2010-11. In addition, the lease guarantee related to the recently delivered Axento office project in Luxembourg (valued at c.€100m) will expire at end-2010.
With c.400,000m² of speculative deliveries coming on stream, the Brussels offices market (which has stock of 12.9m m²) will see vacancy levels pass current historical highs at >12%. We expect lease incentives will be used in order to maintain decent occupancy levels, resulting in negative like-for-like rental levels and a 2% decrease in FY09/10 IFRS NAV. This was reflected in Befimmo’s outlook for the FY09/10 cash flow per share (CFPS) during its communication of the FY08/09 results. We expect Befimmo’s share price to drop on the back of the overheated supply and prefer an underweight position in Brussels offices. We expect a 6.6% dividend yield after the cut in gross DPS from €4.55 to €3.90. We maintain our HOLD recommendation.
We have calculated that Befimmo has an overweight position in the Brussels North offices district, while Cofinimmo has an overweight position in the Decentralised district. For a more in-depth comparison between both companies, see the Investment Case discussion in our note on Cofinimmo.
Fig 1 Cofinimmo and Befimmo overweight and underweight areas
-15.0 -10.0 -5.0 0.0 5.0 10.0 15.0 20.0 25.0
Centre
Midi
North
Leopold
Louise
Decentralised
Periphery
%
Cofinimmo Befimmo
Source: Company data, ING estimates _
Befimmo is overweight in the North district

81
Benelux Real Estate February 2010
SWOT Fig 2 SWOT analysis
Strengths Weaknesses
Virtually no corporate taxation thanks to SICAFI status
Exposure to Brussels’ CBD, a less volatile and speculative market than most office markets in other countries
Long-term duration of rental contracts
Diversified and prime tenant base
Strong exposure to public tenants: ensures long-term and stable cash flow
Inflation-protected investment
Low rental reversion limits the risk of rents dropping sharply in a falling property market
No speculative project development
Lack of EPRA best practices guidance despite size and prestige
Low level of detail in interim financial reporting
Absence of accretive acquisitions after the large capital increase
Limited experience and networking in foreign offices market
Little diversification of assets
Long-term contracts limit the downside, but also the upside potential should there be a fast recovery
Legal from (“commanditair vennootschap”) enables potential strong influence of AG Insurance on management, at the expense of other shareholders
Opportunities Threats
Acquisitions in foreign markets at fire-sale prices
In source property management and other functions
Start managing assets for third parties
Delivery of speculative projects in the Brussels market will increase the overall vacancy risk
Source: ING
_
Risks Because of the contractual nature of a large part of the recurring cash flows, property companies are usually considered to have less risk than most other equity sectors. The risk of property companies bears a strong relation to the amount of development exposure, the geographical and sector breakdown, corporate governance and alignment of interest between management and shareholders.
Principally an investor, but in an oversupplied market
We believe that Befimmo is a low risk property company. It is principally an investor, which is the least risky activity of the four core real estate company activities: investment, development, trading and asset management.
The focus on Brussels offices together with some key renovations increases the risk given the overheated supply. This could result in long-term rental contracts substantially below the lucrative rental levels seen a couple of years ago, and which could become visible again after a full recovery.
Development risk
Befimmo has no exposure to speculative developments. The only major development that is currently in the pipeline is Liège Paradis, the development of a fully pre-let office building in Liège, Belgium (capex €60m).
Accounting for leases
There are accounting initiatives that may lead to the obligation of tenants to account long leases as a liability in their balance sheets. In the future this could put pressure on the average lease lengths of real estate companies and Befimmo.
Tenant risk is limited
The largest group of Befimmo’s tenants is formed by the Belgian national and regional government and the EU institutions, together representing c.60% of the rent payroll on a long-term basis. The next biggest tenant is BNP Paribas Fortis bank, representing
Public institutions take c.60% of the rent payroll
Property companies are low risk, on average
Potential pressure on lease length
Befimmo’s main activity is the least risky:
investment
No speculative developments
Pure play Brussels offices is not always as
advantageous
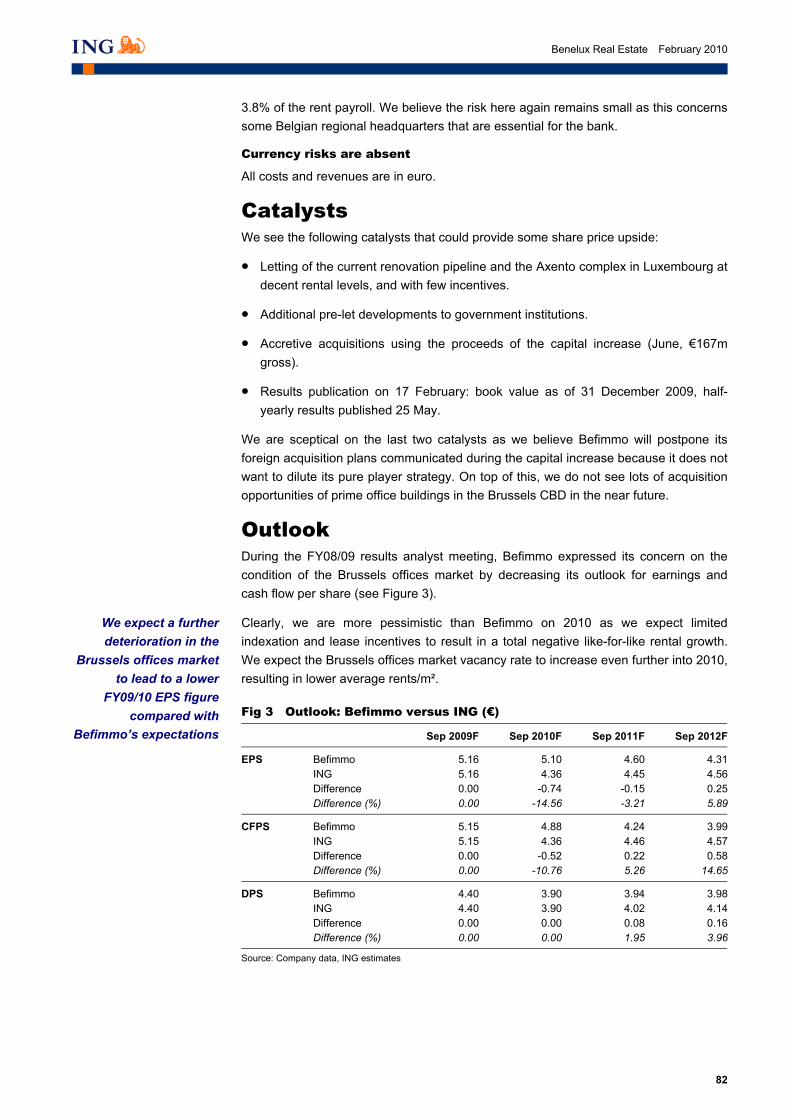
82
Benelux Real Estate February 2010
3.8% of the rent payroll. We believe the risk here again remains small as this concerns some Belgian regional headquarters that are essential for the bank.
Currency risks are absent
All costs and revenues are in euro.
Catalysts We see the following catalysts that could provide some share price upside:
• Letting of the current renovation pipeline and the Axento complex in Luxembourg at decent rental levels, and with few incentives.
• Additional pre-let developments to government institutions.
• Accretive acquisitions using the proceeds of the capital increase (June, €167m gross).
• Results publication on 17 February: book value as of 31 December 2009, half-yearly results published 25 May.
We are sceptical on the last two catalysts as we believe Befimmo will postpone its foreign acquisition plans communicated during the capital increase because it does not want to dilute its pure player strategy. On top of this, we do not see lots of acquisition opportunities of prime office buildings in the Brussels CBD in the near future.
Outlook During the FY08/09 results analyst meeting, Befimmo expressed its concern on the condition of the Brussels offices market by decreasing its outlook for earnings and cash flow per share (see Figure 3).
Clearly, we are more pessimistic than Befimmo on 2010 as we expect limited indexation and lease incentives to result in a total negative like-for-like rental growth. We expect the Brussels offices market vacancy rate to increase even further into 2010, resulting in lower average rents/m².
Fig 3 Outlook: Befimmo versus ING (€)
Sep 2009F Sep 2010F Sep 2011F Sep 2012F
EPS Befimmo 5.16 5.10 4.60 4.31 ING 5.16 4.36 4.45 4.56 Difference 0.00 -0.74 -0.15 0.25 Difference (%) 0.00 -14.56 -3.21 5.89
CFPS Befimmo 5.15 4.88 4.24 3.99 ING 5.15 4.36 4.46 4.57 Difference 0.00 -0.52 0.22 0.58 Difference (%) 0.00 -10.76 5.26 14.65
DPS Befimmo 4.40 3.90 3.94 3.98 ING 4.40 3.90 4.02 4.14 Difference 0.00 0.00 0.08 0.16 Difference (%) 0.00 0.00 1.95 3.96
Source: Company data, ING estimates
_
We expect a further deterioration in the
Brussels offices market to lead to a lower
FY09/10 EPS figure compared with
Befimmo’s expectations

83
Benelux Real Estate February 2010
Valuation We value Befimmo at 1.05x 2010F IFRS NAV of €57.8, resulting in a new target price of €61.2. We believe Befimmo deserves a lower premium valuation than Cofinimmo (which we value at 1.1x 2010F NAV) for a number of reasons:
• The large exposure to the weakening Brussels offices market, while Cofinimmo is diversified into low-risk, long-term let nursing homes and pubs, which will add more resilience to its business model.
• Cofinimmo’s less dilutive recent deleveraging compared with Befimmo.
• Absence of acquisition opportunities for Befimmo, despite the recent rights issue which was partly “opportunistic”, yet quite expensive, in our view.
• Corporate governance: Befimmo is a commanditaire vennootschap, while Cofinimmo is an NV. Befimmo carries large influence from AG Insurance, while we find Cofinimmo more flexible.
Consensus Figure 4 depicts the consensus overview for EPS. We are 4% more conservative for the FY09/10F EPS outlook. This can be partly explained by the increase in incentives that we expect and the deteriorating offices market, which may not be fully incorporated in consensus estimates.
Fig 4 Consensus overview EPS (€)
Year to Sep FY09/10 FY10/11 FY11/12
Consensus 4.54 4.64 4.91ING 4.36 4.45 4.56Difference (0.18) (0.19) (0.35)Difference (%) -4.0 -4.0 -7.1
Source: Reuters, ING estimates
_
Our estimates and assumptions Our earnings and valuation estimates are based on the following assumptions:
1) Vacancy rates: we do not expect vacancy levels to move much given the long-term lease contracts. Additional incentives related to current renovations should be able to support current occupancy levels.
Fig 5 Our vacancy assumptions (%)
Year to Sep FY09/10F FY10/11F FY11/12F FY12/13F
Brussels CBD 8.0 6.0 6.0 6.0Brussels decentralised 4.0 3.0 3.0 3.0Brussels periphery 20.0 18.0 18.0 18.0Wallonia 0.0 0.0 0.0 0.0Flanders 5.0 5.0 5.0 5.0Luxembourg 0.0 5.0 5.0 5.0Total 6.6 5.3 5.3 5.3
Source: ING estimates
_
2) Total like-for-like rental growth (including incentives, but not vacancy movements): we rely on the forecasts of the ING economics department for the CPI indexation forecast, but apply a penalty in 2010 and 2011 for lease incentives,
Befimmo looks 10% too expensive
We are 4-7% below consensus on EPS

84
Benelux Real Estate February 2010
which we expect to occur if Befimmo maintains its occupancy rate in line with current levels.
Fig 6 Our total like-for-like rental growth estimates (%)
Year to Sep FY09/10F FY10/11F FY11/12F FY12/13F
Brussels CBD -1.8 0.0 2.0 2.0Brussels decentralised -1.8 0.0 2.0 2.0Brussels periphery -1.8 0.0 2.0 2.0Wallonia -1.8 0.0 2.0 2.0Flanders -1.8 0.0 2.0 2.0Luxembourg -1.8 0.0 2.0 2.0Total -1.8 0.0 2.0 2.0
Source: ING estimates
_
3) Portfolio movements: in line with the trend of previous quarters, we expect overall portfolio valuations to stabilise into 2010 and 2011. We believe this trend of stabilisation will be slower for the decentralised and the peripheral area, where lease durations are shorter and the vacancy levels of both the portfolio and market are higher.
Fig 7 Portfolio valuation movements (%)
Year to Sep FY09/10F FY10/11F FY11/12F FY12/13F
Brussels CBD -1.5 0.0 0.0 0.0Brussels decentralised -4.5 -1.0 0.0 0.0Brussels periphery -3.0 -1.0 0.0 0.0Wallonia -4.5 0.0 0.0 0.0Flanders -1.5 0.0 0.0 0.0Luxembourg -0.8 0.0 0.0 0.0Total -2.0 -0.2 0.0 0.0
Source: ING estimates
_
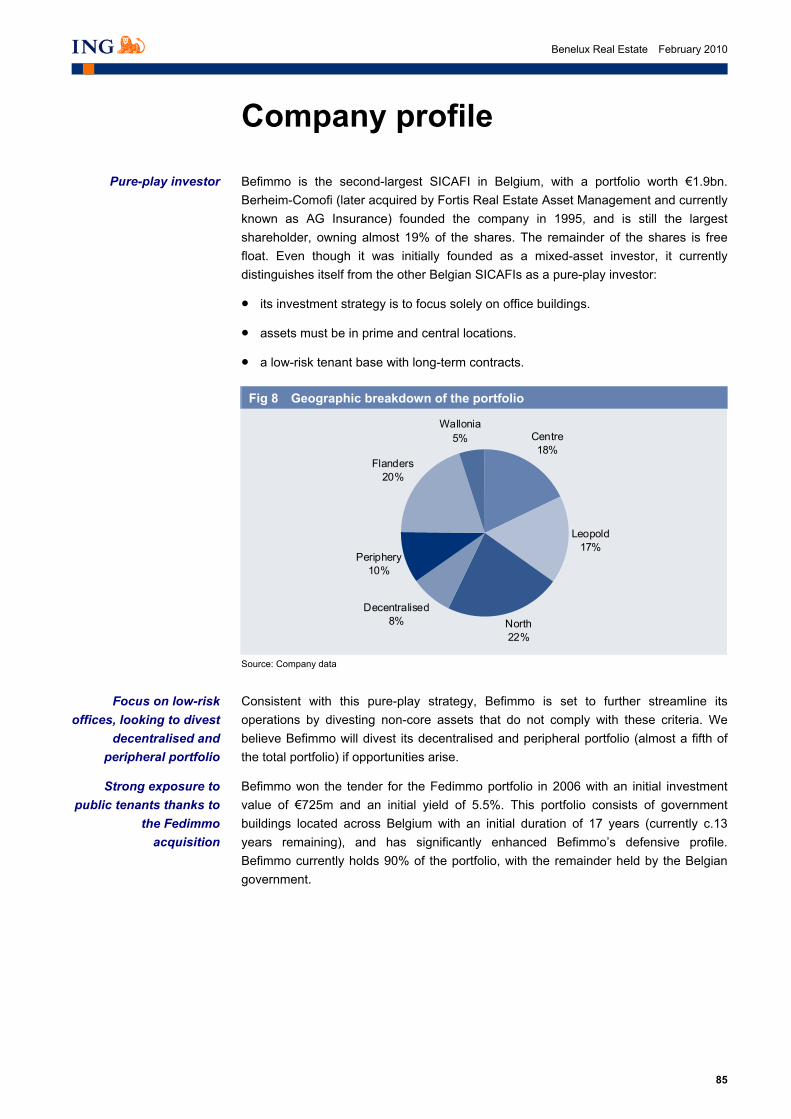
85
Benelux Real Estate February 2010
Company profile
Befimmo is the second-largest SICAFI in Belgium, with a portfolio worth €1.9bn. Berheim-Comofi (later acquired by Fortis Real Estate Asset Management and currently known as AG Insurance) founded the company in 1995, and is still the largest shareholder, owning almost 19% of the shares. The remainder of the shares is free float. Even though it was initially founded as a mixed-asset investor, it currently distinguishes itself from the other Belgian SICAFIs as a pure-play investor:
• its investment strategy is to focus solely on office buildings.
• assets must be in prime and central locations.
• a low-risk tenant base with long-term contracts.
Fig 8 Geographic breakdown of the portfolio
Centre18%
Leopold17%
North22%
Decentralised8%
Periphery10%
Flanders20%
Wallonia5%
Source: Company data
_
Consistent with this pure-play strategy, Befimmo is set to further streamline its operations by divesting non-core assets that do not comply with these criteria. We believe Befimmo will divest its decentralised and peripheral portfolio (almost a fifth of the total portfolio) if opportunities arise.
Befimmo won the tender for the Fedimmo portfolio in 2006 with an initial investment value of €725m and an initial yield of 5.5%. This portfolio consists of government buildings located across Belgium with an initial duration of 17 years (currently c.13 years remaining), and has significantly enhanced Befimmo’s defensive profile. Befimmo currently holds 90% of the portfolio, with the remainder held by the Belgian government.
Pure-play investor
Focus on low-risk offices, looking to divest
decentralised and peripheral portfolio
Strong exposure to public tenants thanks to
the Fedimmo acquisition
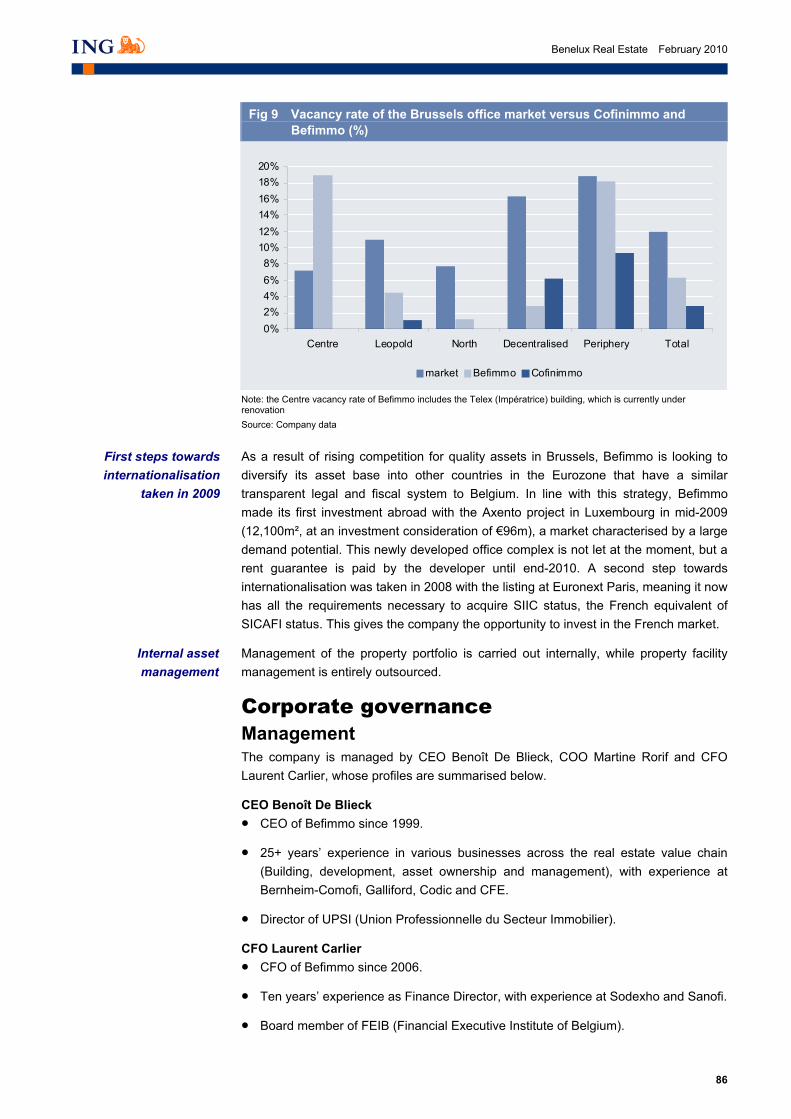
86
Benelux Real Estate February 2010
Fig 9 Vacancy rate of the Brussels office market versus Cofinimmo and Befimmo (%)
0%2%4%6%8%
10%12%14%16%18%20%
Centre Leopold North Decentralised Periphery Total
market Befimmo Cofinimmo
Note: the Centre vacancy rate of Befimmo includes the Telex (Impératrice) building, which is currently under renovation Source: Company data
_
As a result of rising competition for quality assets in Brussels, Befimmo is looking to diversify its asset base into other countries in the Eurozone that have a similar transparent legal and fiscal system to Belgium. In line with this strategy, Befimmo made its first investment abroad with the Axento project in Luxembourg in mid-2009 (12,100m², at an investment consideration of €96m), a market characterised by a large demand potential. This newly developed office complex is not let at the moment, but a rent guarantee is paid by the developer until end-2010. A second step towards internationalisation was taken in 2008 with the listing at Euronext Paris, meaning it now has all the requirements necessary to acquire SIIC status, the French equivalent of SICAFI status. This gives the company the opportunity to invest in the French market.
Management of the property portfolio is carried out internally, while property facility management is entirely outsourced.
Corporate governance Management The company is managed by CEO Benoît De Blieck, COO Martine Rorif and CFO Laurent Carlier, whose profiles are summarised below.
CEO Benoît De Blieck • CEO of Befimmo since 1999.
• 25+ years’ experience in various businesses across the real estate value chain (Building, development, asset ownership and management), with experience at Bernheim-Comofi, Galliford, Codic and CFE.
• Director of UPSI (Union Professionnelle du Secteur Immobilier).
CFO Laurent Carlier • CFO of Befimmo since 2006.
• Ten years’ experience as Finance Director, with experience at Sodexho and Sanofi.
• Board member of FEIB (Financial Executive Institute of Belgium).
First steps towards internationalisation
taken in 2009
Internal asset management

87
Benelux Real Estate February 2010
COO Martine Rorif • COO of Befimmo since 1997.
• Formerly member of the operations staff of Devimmo.
• Formerly member of the real estate development team at Entreprises Jacques Delens.
Shareholders and stock liquidity Befimmo was launched in 1995 by Berheim-Comofi (later acquired by Fortis Insurance Belgium and currently known as AG Insurance). This explains the longstanding shareholder relationship with AG Insurance, which according to Bloomberg currently holds a 14% stake in Befimmo and has participated in the recent rights issue.
Fig 10 Shareholders
Fortis *14%
Free float86%
* Fortis element refers to part held by AG Insurance (formerly Fortis Insurance, 8.8%) and Fortis Real Estate (5.7%) Source: Bloomberg
_
Close relation with its founder AG Insurance
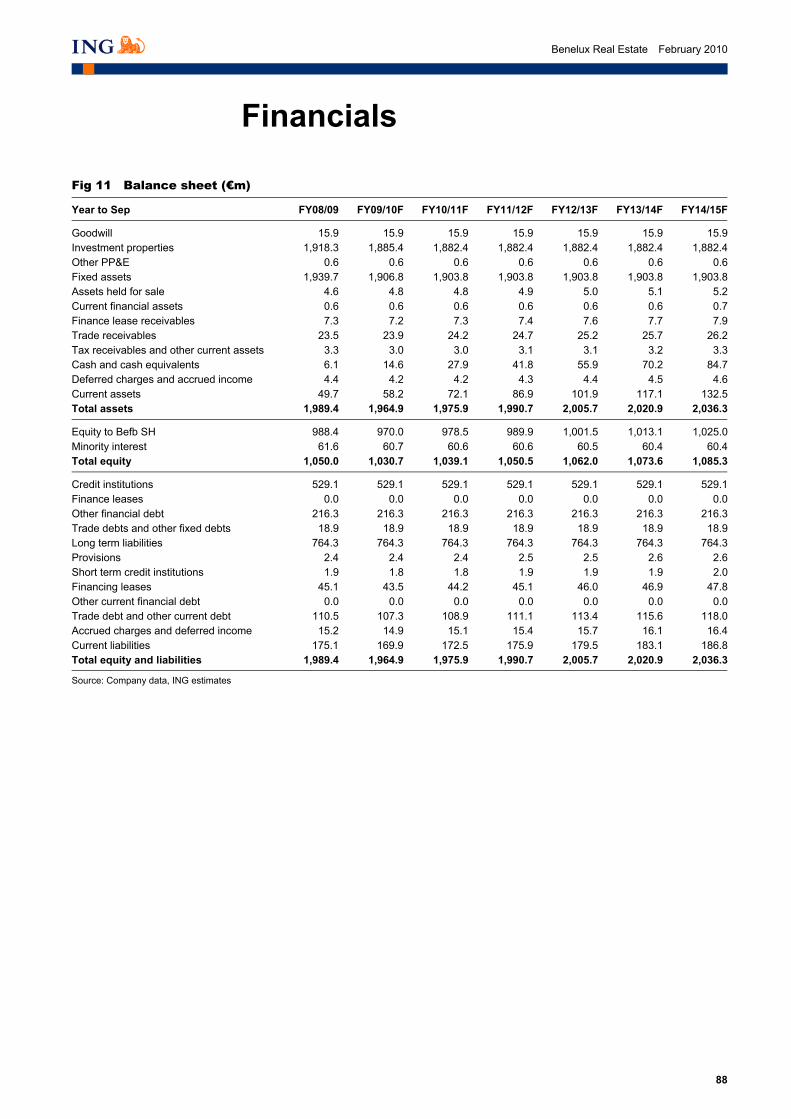
88
Benelux Real Estate February 2010
Financials
Fig 11 Balance sheet (€m)
Year to Sep FY08/09 FY09/10F FY10/11F FY11/12F FY12/13F FY13/14F FY14/15F
Goodwill 15.9 15.9 15.9 15.9 15.9 15.9 15.9Investment properties 1,918.3 1,885.4 1,882.4 1,882.4 1,882.4 1,882.4 1,882.4Other PP&E 0.6 0.6 0.6 0.6 0.6 0.6 0.6Fixed assets 1,939.7 1,906.8 1,903.8 1,903.8 1,903.8 1,903.8 1,903.8Assets held for sale 4.6 4.8 4.8 4.9 5.0 5.1 5.2Current financial assets 0.6 0.6 0.6 0.6 0.6 0.6 0.7Finance lease receivables 7.3 7.2 7.3 7.4 7.6 7.7 7.9Trade receivables 23.5 23.9 24.2 24.7 25.2 25.7 26.2Tax receivables and other current assets 3.3 3.0 3.0 3.1 3.1 3.2 3.3Cash and cash equivalents 6.1 14.6 27.9 41.8 55.9 70.2 84.7Deferred charges and accrued income 4.4 4.2 4.2 4.3 4.4 4.5 4.6Current assets 49.7 58.2 72.1 86.9 101.9 117.1 132.5Total assets 1,989.4 1,964.9 1,975.9 1,990.7 2,005.7 2,020.9 2,036.3
Equity to Befb SH 988.4 970.0 978.5 989.9 1,001.5 1,013.1 1,025.0Minority interest 61.6 60.7 60.6 60.6 60.5 60.4 60.4Total equity 1,050.0 1,030.7 1,039.1 1,050.5 1,062.0 1,073.6 1,085.3
Credit institutions 529.1 529.1 529.1 529.1 529.1 529.1 529.1Finance leases 0.0 0.0 0.0 0.0 0.0 0.0 0.0Other financial debt 216.3 216.3 216.3 216.3 216.3 216.3 216.3Trade debts and other fixed debts 18.9 18.9 18.9 18.9 18.9 18.9 18.9Long term liabilities 764.3 764.3 764.3 764.3 764.3 764.3 764.3Provisions 2.4 2.4 2.4 2.5 2.5 2.6 2.6Short term credit institutions 1.9 1.8 1.8 1.9 1.9 1.9 2.0Financing leases 45.1 43.5 44.2 45.1 46.0 46.9 47.8Other current financial debt 0.0 0.0 0.0 0.0 0.0 0.0 0.0Trade debt and other current debt 110.5 107.3 108.9 111.1 113.4 115.6 118.0Accrued charges and deferred income 15.2 14.9 15.1 15.4 15.7 16.1 16.4Current liabilities 175.1 169.9 172.5 175.9 179.5 183.1 186.8Total equity and liabilities 1,989.4 1,964.9 1,975.9 1,990.7 2,005.7 2,020.9 2,036.3
Source: Company data, ING estimates
_

89
Benelux Real Estate February 2010
Fig 12 Profit and loss (€m)
Year to Sep FY08/09 FY09/10F FY10/11F FY11/12F FY12/13F FY13/14F FY14/15F
Rental income 119.1 118.8 120.7 122.9 125.3 127.8 130.4Charges linked to letting (0.4) (0.4) (0.4) (0.4) (0.4) (0.4) (0.4)Net rental income 118.6 118.5 120.3 122.5 124.9 127.5 130.0Property result 131.8 130.4 132.4 134.8 137.5 140.2 143.1Technical costs (14.5) (14.3) (14.5) (14.7) (15.0) (15.3) (15.6)Other costs (commercial, property mngt, etc) (3.1) (3.0) (3.0) (3.1) (3.1) (3.2) (3.3)Total property charges (17.7) (17.2) (17.5) (17.8) (18.2) (18.5) (18.9)Property operating result 114.1 113.1 114.9 117.0 119.3 121.7 124.2Corporate management costs (9.8) (9.5) (9.7) (9.8) (10.0) (10.2) (10.4)Other income and charges 1.9 1.8 1.8 1.8 1.9 1.9 2.0Operating result before result on portfolio 106.1 105.4 107.0 109.0 111.2 113.4 115.7Gains or losses on disposals of investment property 0.2 0.0 0.0 0.0 0.0 0.0 0.0FV on investment property (75.0) (37.5) (2.9) 0.0 0.0 0.0 0.0Operating result 31.4 67.9 104.1 109.0 111.2 113.4 115.7Financial income 5.0 0.0 0.2 0.2 0.2 0.2 0.2Interest charges (30.0) (29.9) (29.9) (29.9) (29.9) (29.9) (29.9)Total interest (25.0) (29.9) (29.7) (29.7) (29.7) (29.7) (29.7)FV on derivatives (39.3) 0.0 0.0 0.0 0.0 0.0 0.0Net financing expenses (64.3) (29.9) (29.7) (29.7) (29.7) (29.7) (29.7)Pre tax result (32.9) 38.0 74.4 79.3 81.5 83.7 86.0Corporation tax (0.5) (0.5) (0.5) (0.5) (0.5) (0.5) (0.5)Net result (33.4) 37.5 73.9 78.8 81.0 83.2 85.4
Total direct result 75.7 75.0 76.7 78.6 80.8 83.0 85.3Group share 73.8 73.2 74.8 76.6 78.8 80.9 83.1Minorities 1.9 1.9 1.9 2.0 2.0 2.1 2.1Total indirect result (109.0) (37.5) (2.8) 0.2 0.2 0.2 0.2Group share (106.3) (36.6) (2.7) 0.2 0.2 0.2 0.2Minorities (2.7) (0.9) (0.1) 0.0 0.0 0.0 0.0
Source: Company data, ING estimates
_

90
Benelux Real Estate February 2010
Fig 13 Cash flow statement (€m)
Year to Sep FY08/09 FY09/10F FY10/11F FY11/12F FY12/13F FY13/14F FY14/15F
Operating income 31.4 67.9 104.1 109.0 111.2 113.4 115.7Interest paid (24.3) (29.9) (29.9) (29.9) (29.9) (29.9) (29.9)Interest received 2.6 0.0 0.2 0.2 0.2 0.2 0.2Dividends received 0.4 0.0 0.0 0.0 0.0 0.0 0.0Taxes paid (0.5) (0.5) (0.5) (0.5) (0.5) (0.5) (0.5)Fair value adjustments (35.0) 0.0 0.0 0.0 0.0 0.0 0.0Other income (8.0) 0.0 0.0 0.0 0.0 0.0 0.0Non cash adjustments 0.0 0.0 0.0 0.0 0.0 0.0 0.0Change in value of trade receivables 0.2 (0.3) (0.4) (0.5) (0.5) (0.5) (0.5)Change in value of PP&E 0.2 0.0 0.0 0.0 0.0 0.0 0.0FV on investment portfolio 75.0 37.5 2.9 0.0 0.0 0.0 0.0FV on fixed financial assets booked to earnings 35.0 0.0 0.0 0.0 0.0 0.0 0.0Other items 6.0 0.0 0.0 0.0 0.0 0.0 0.0Gain on sales (0.2) 0.0 0.0 0.0 0.0 0.0 0.0Change in working capital assets (1.7) 0.4 (0.3) (0.4) (0.4) (0.4) (0.4)Change in working capital liabilities 6.5 (5.5) 2.3 3.0 3.1 3.1 3.2CF from operations 87.6 69.6 78.5 80.9 83.1 85.4 87.7
Acquisition of Fedimmo 0.0 0.0 0.0 0.0 0.0 0.0 0.0Acquisition of Meir and Vital 0.0 0.0 0.0 0.0 0.0 0.0 0.0Acquisition of Axento (1.8) 0.0 0.0 0.0 0.0 0.0 0.0Downpayment on buildings and similar 0.0 0.0 0.0 0.0 0.0 0.0 0.0Liquidation of La Hulpe certificates 0.0 0.0 0.0 0.0 0.0 0.0 0.0Investment in investment properties (29.8) 0.0 0.0 0.0 0.0 0.0 0.0Disposals of investment properties 4.2 0.0 0.0 0.0 0.0 0.0 0.0Other PP&E (0.1) 0.0 0.0 0.0 0.0 0.0 0.0Hedging instruments and other financial assets (1.8) 0.0 0.0 0.0 0.0 0.0 0.0CF from investing (29.4) 0.0 0.0 0.0 0.0 0.0 0.0
Change in financial debt (142.5) 0.0 0.0 0.0 0.0 0.0 0.0Change in financial lease debt (12.9) 0.3 0.3 0.4 0.5 0.5 0.5Change in non-current debt 0.0 0.0 0.0 0.0 0.0 0.0 0.0Capital increase/decrease 159.5 0.0 0.0 0.0 0.0 0.0 0.0Dividend for the previous fiscal year (60.6) (61.3) (65.5) (67.4) (69.5) (71.6) (73.7)CF from financing (56.7) (61.0) (65.2) (67.0) (69.0) (71.1) (73.2)
Net change in cash 1.5 8.6 13.3 13.9 14.1 14.3 14.5Cash BOP 4.6 6.1 14.6 27.9 41.8 55.9 70.2Cash EOP 6.1 14.6 27.9 41.8 55.9 70.2 84.7
Source: Company data, ING estimates _
Fig 14 Per share data (€)
Year to Sep FY08/09 FY09/10F FY10/11F FY11/12F FY12/13F FY13/14F FY14/15F
Number of shares (m) 16,790,103 16,790,103 16,790,103 16,790,103 16,790,103 16,790,103 16,790,103Total number of shares (m) 16,790,103 16,790,103 16,790,103 16,790,103 16,790,103 16,790,103 16,790,103Average no of shares (m) 14,302,680 16,790,103 16,790,103 16,790,103 16,790,103 16,790,103 16,790,103
Direct result per share 5.16 4.36 4.45 4.56 4.69 4.82 4.95Indirect result per share (7.43) (2.18) (0.16) 0.01 0.01 0.01 0.01Total result per share (2.28) 2.18 4.29 4.57 4.70 4.83 4.96
DPS 4.40 3.90 4.02 4.14 4.26 4.39 4.52
IFRS NAV 58.9 57.8 58.3 59.0 59.6 60.3 61.0
Recurring CFPS 5.16 4.36 4.46 4.57 4.70 4.83 4.96Recurring EPS 5.16 4.36 4.46 4.57 4.70 4.83 4.96
Source: Company data, ING estimates
_
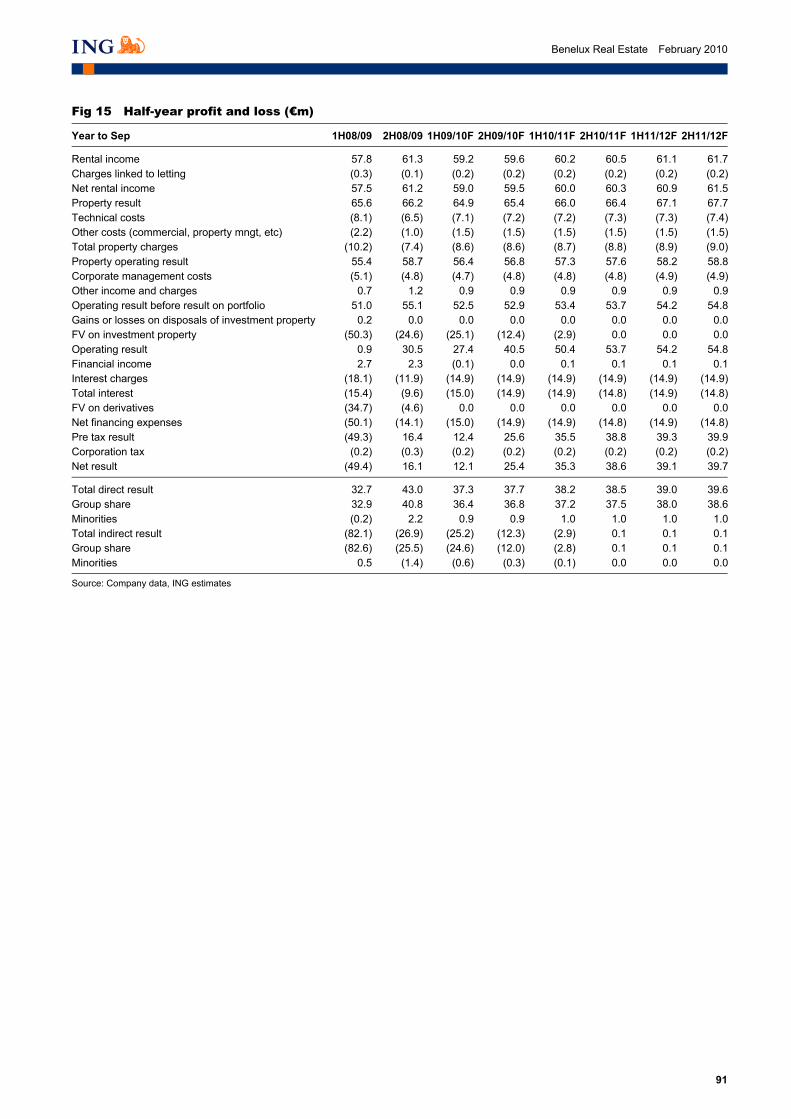
91
Benelux Real Estate February 2010
Fig 15 Half-year profit and loss (€m)
Year to Sep 1H08/09 2H08/09 1H09/10F 2H09/10F 1H10/11F 2H10/11F 1H11/12F 2H11/12F
Rental income 57.8 61.3 59.2 59.6 60.2 60.5 61.1 61.7Charges linked to letting (0.3) (0.1) (0.2) (0.2) (0.2) (0.2) (0.2) (0.2)Net rental income 57.5 61.2 59.0 59.5 60.0 60.3 60.9 61.5Property result 65.6 66.2 64.9 65.4 66.0 66.4 67.1 67.7Technical costs (8.1) (6.5) (7.1) (7.2) (7.2) (7.3) (7.3) (7.4)Other costs (commercial, property mngt, etc) (2.2) (1.0) (1.5) (1.5) (1.5) (1.5) (1.5) (1.5)Total property charges (10.2) (7.4) (8.6) (8.6) (8.7) (8.8) (8.9) (9.0)Property operating result 55.4 58.7 56.4 56.8 57.3 57.6 58.2 58.8Corporate management costs (5.1) (4.8) (4.7) (4.8) (4.8) (4.8) (4.9) (4.9)Other income and charges 0.7 1.2 0.9 0.9 0.9 0.9 0.9 0.9Operating result before result on portfolio 51.0 55.1 52.5 52.9 53.4 53.7 54.2 54.8Gains or losses on disposals of investment property 0.2 0.0 0.0 0.0 0.0 0.0 0.0 0.0FV on investment property (50.3) (24.6) (25.1) (12.4) (2.9) 0.0 0.0 0.0Operating result 0.9 30.5 27.4 40.5 50.4 53.7 54.2 54.8Financial income 2.7 2.3 (0.1) 0.0 0.1 0.1 0.1 0.1Interest charges (18.1) (11.9) (14.9) (14.9) (14.9) (14.9) (14.9) (14.9)Total interest (15.4) (9.6) (15.0) (14.9) (14.9) (14.8) (14.9) (14.8)FV on derivatives (34.7) (4.6) 0.0 0.0 0.0 0.0 0.0 0.0Net financing expenses (50.1) (14.1) (15.0) (14.9) (14.9) (14.8) (14.9) (14.8)Pre tax result (49.3) 16.4 12.4 25.6 35.5 38.8 39.3 39.9Corporation tax (0.2) (0.3) (0.2) (0.2) (0.2) (0.2) (0.2) (0.2)Net result (49.4) 16.1 12.1 25.4 35.3 38.6 39.1 39.7
Total direct result 32.7 43.0 37.3 37.7 38.2 38.5 39.0 39.6Group share 32.9 40.8 36.4 36.8 37.2 37.5 38.0 38.6Minorities (0.2) 2.2 0.9 0.9 1.0 1.0 1.0 1.0Total indirect result (82.1) (26.9) (25.2) (12.3) (2.9) 0.1 0.1 0.1Group share (82.6) (25.5) (24.6) (12.0) (2.8) 0.1 0.1 0.1Minorities 0.5 (1.4) (0.6) (0.3) (0.1) 0.0 0.0 0.0
Source: Company data, ING estimates _

92
Benelux Real Estate February 2010
Fig 16 Half-year cash flow statement (€m)
Year to Sep 1H08/09 2H08/09 1H09/10F 2H09/10F 1H10/11F 2H10/11F 1H11/12F 2H11/12F
Operating income 0.9 30.5 27.4 40.5 50.4 53.7 54.2 54.8Interest paid (15.2) (9.1) (14.9) (14.9) (14.9) (14.9) (14.9) (14.9)Interest received 2.0 0.6 (0.1) 0.0 0.1 0.1 0.1 0.1Dividends received 0.4 0.0 0.0 0.0 0.0 0.0 0.0 0.0Taxes paid (0.2) (0.4) (0.2) (0.2) (0.2) (0.2) (0.2) (0.2)Fair value adjustments 0.0 (35.0) 0.0 0.0 0.0 0.0 0.0 0.0Other income (37.4) 29.5 0.0 0.0 0.0 0.0 0.0 0.0Non cash adjustments 0.0 0.0 0.0 0.0 0.0 0.0 0.0 0.0Change in value of trade receivables 0.2 0.0 (0.2) (0.2) (0.2) (0.1) (0.2) (0.2)Change in value of PP&E 0.1 0.1 0.0 0.0 0.0 0.0 0.0 0.0FV on investment portfolio 50.3 24.6 25.1 12.4 2.9 0.0 0.0 0.0FV on fixed financial assets booked to earnings 33.2 1.8 0.0 0.0 0.0 0.0 0.0 0.0Other items 3.0 3.0 0.0 0.0 0.0 0.0 0.0 0.0Gain on sales (0.2) 0.0 0.0 0.0 0.0 0.0 0.0 0.0Change in working capital assets (9.0) 7.3 0.6 (0.1) (0.2) (0.1) (0.2) (0.2)Change in working capital liabilities 9.4 (2.9) (6.4) 0.9 1.5 0.7 1.7 1.3CF from operations 37.6 50.0 31.2 38.3 39.4 39.1 40.4 40.5
Acquisition of Fedimmo 0.0 0.0 0.0 0.0 0.0 0.0 0.0 0.0Acquisition of Meir and Vital 0.0 0.0 0.0 0.0 0.0 0.0 0.0 0.0Acquisition of Axento 0.0 (1.8) 0.0 0.0 0.0 0.0 0.0 0.0Downpayment on buildings and similar 0.0 0.0 0.0 0.0 0.0 0.0 0.0 0.0Liquidation of La Hulpe certificates 0.0 0.0 0.0 0.0 0.0 0.0 0.0 0.0Investment in investment properties (17.0) (12.9) 0.0 0.0 0.0 0.0 0.0 0.0Disposals of investment properties 4.2 0.0 0.0 0.0 0.0 0.0 0.0 0.0Other PP&E (0.1) 0.0 0.0 0.0 0.0 0.0 0.0 0.0Hedging instruments and other financial assets 0.0 (1.8) 0.0 0.0 0.0 0.0 0.0 0.0CF from investing (12.9) (16.5) 0.0 0.0 0.0 0.0 0.0 0.0
Change in financial debt 44.0 (186.6) 0.0 0.0 0.0 0.0 0.0 0.0Change in financial lease debt 0.0 (12.9) 0.0 0.3 0.0 0.3 0.0 0.4Change in non-current debt 0.1 (0.1) 0.0 0.0 0.0 0.0 0.0 0.0Capital increase/decrease 0.0 159.5 0.0 0.0 0.0 0.0 0.0 0.0Dividend for the previous fiscal year (60.6) 0.0 (61.3) 0.0 (65.5) 0.0 (67.4) 0.0CF from financing (16.5) (40.2) (61.3) 0.3 (65.5) 0.3 (67.4) 0.5
Net change in cash 8.2 (6.7) (30.1) 38.7 (26.1) 39.3 (27.1) 41.0Cash BOP 4.6 12.8 6.1 (24.0) 14.6 (11.4) 27.9 0.8Cash EOP 12.8 6.1 (24.0) 14.6 (11.4) 27.9 0.8 41.8
Source: Company data, ING estimates _
Fig 17 Half-year per share data (€)
Year to Sep 1H08/09 2H08/09 1H09/10F 2H09/10F 1H10/11F 2H10/11F 1H11/12F 2H11/12F
No. of shares (m) 13,058,969 16,790,103 16,790,103 16,790,103 16,790,103 16,790,103 16,790,103 16,790,103Average no of shares (m) 13,058,969 15,546,392 16,790,103 16,790,103 16,790,103 16,790,103 16,790,103 16,790,103
Direct result per share 2.52 2.62 2.17 2.19 2.22 2.24 2.27 2.30Indirect result per share (6.33) (1.64) (1.46) (0.72) (0.17) 0.01 0.00 0.01Total result per share (3.81) 0.98 0.70 1.47 2.05 2.24 2.27 2.30
DPS 0.00 4.40 4.40 0.00 3.90 0.00 4.02 0.00
IFRS NAV 65.7 58.9 56.3 57.8 56.0 58.3 56.7 59.0
Recurring CFPS 2.52 2.64 2.16 2.19 2.22 2.24 2.27 2.30Recurring EPS 2.52 2.64 2.16 2.19 2.22 2.24 2.27 2.30
Source: Company data, ING estimates
_
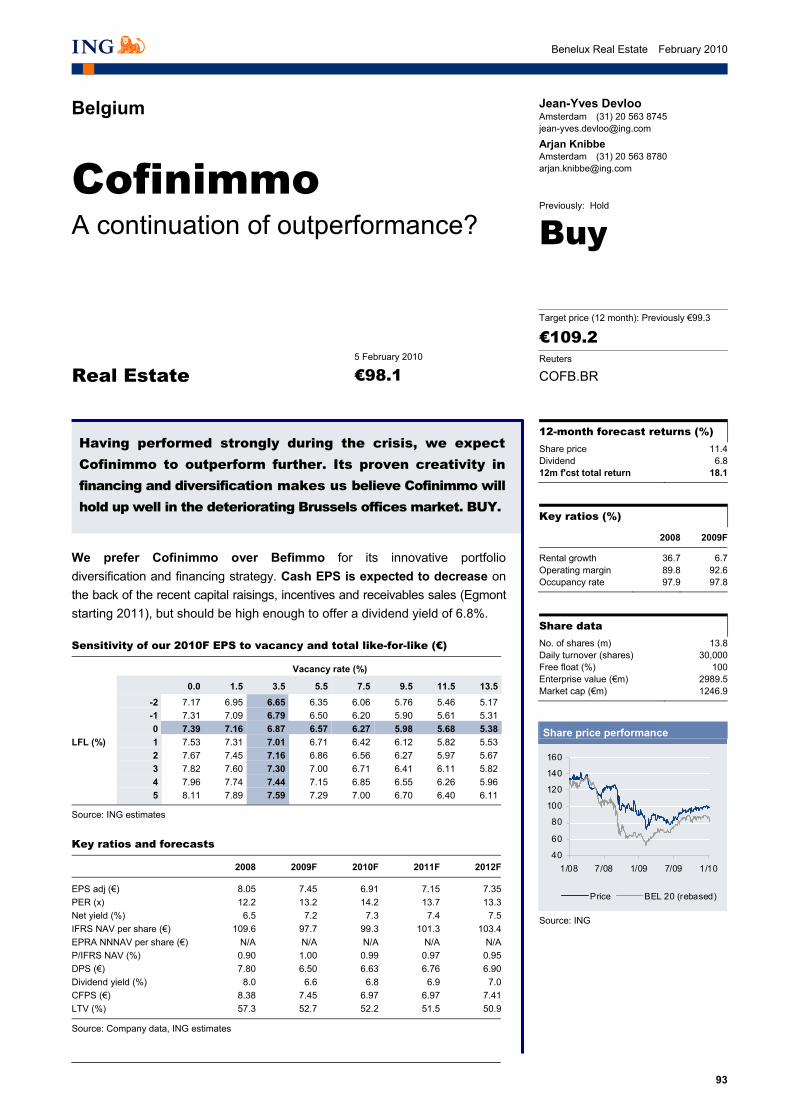
93
Benelux Real Estate February 2010
Belgium
Cofinimmo A continuation of outperformance?
Key ratios (%)
2008 2009F
Rental growth 36.7 6.7Operating margin 89.8 92.6Occupancy rate 97.9 97.8
Share data No. of shares (m) 13.8Daily turnover (shares) 30,000Free float (%) 100Enterprise value (€m) 2989.5Market cap (€m) 1246.9
12-month forecast returns (%) Share price 11.4Dividend 6.812m f'cst total return 18.1
Share price performance
40
60
80
100
120
140
160
1/08 7/08 1/09 7/09 1/10
Price BEL 20 (rebased)
Source: ING
Having performed strongly during the crisis, we expect Cofinimmo to outperform further. Its proven creativity in financing and diversification makes us believe Cofinimmo will hold up well in the deteriorating Brussels offices market. BUY.
Previously: Hold
€98.15 February 2010
Buy
Real Estate
€109.2 Target price (12 month): Previously €99.3
COFB.BR Reuters
Jean-Yves Devloo Amsterdam (31) 20 563 8745 [email protected]
Arjan Knibbe Amsterdam (31) 20 563 8780 [email protected]
We prefer Cofinimmo over Befimmo for its innovative portfolio diversification and financing strategy. Cash EPS is expected to decrease on the back of the recent capital raisings, incentives and receivables sales (Egmont starting 2011), but should be high enough to offer a dividend yield of 6.8%.
Sensitivity of our 2010F EPS to vacancy and total like-for-like (€)
Vacancy rate (%)
0.0 1.5 3.5 5.5 7.5 9.5 11.5 13.5 -2 7.17 6.95 6.65 6.35 6.06 5.76 5.46 5.17 -1 7.31 7.09 6.79 6.50 6.20 5.90 5.61 5.31 0 7.39 7.16 6.87 6.57 6.27 5.98 5.68 5.38LFL (%) 1 7.53 7.31 7.01 6.71 6.42 6.12 5.82 5.53 2 7.67 7.45 7.16 6.86 6.56 6.27 5.97 5.67 3 7.82 7.60 7.30 7.00 6.71 6.41 6.11 5.82 4 7.96 7.74 7.44 7.15 6.85 6.55 6.26 5.96 5 8.11 7.89 7.59 7.29 7.00 6.70 6.40 6.11
Source: ING estimates _
Key ratios and forecasts
2008 2009F 2010F 2011F 2012F
EPS adj (€) 8.05 7.45 6.91 7.15 7.35PER (x) 12.2 13.2 14.2 13.7 13.3Net yield (%) 6.5 7.2 7.3 7.4 7.5IFRS NAV per share (€) 109.6 97.7 99.3 101.3 103.4EPRA NNNAV per share (€) N/A N/A N/A N/A N/AP/IFRS NAV (%) 0.90 1.00 0.99 0.97 0.95DPS (€) 7.80 6.50 6.63 6.76 6.90Dividend yield (%) 8.0 6.6 6.8 6.9 7.0CFPS (€) 8.38 7.45 6.97 6.97 7.41LTV (%) 57.3 52.7 52.2 51.5 50.9
Source: Company data, ING estimates _
_
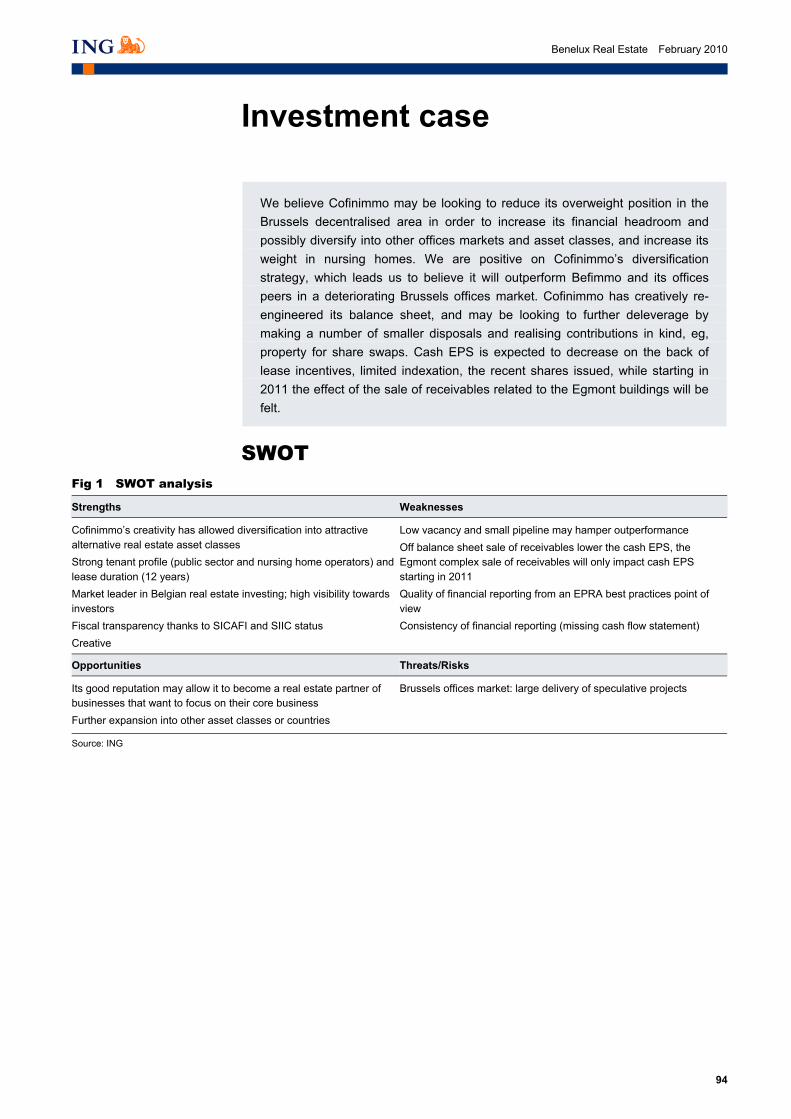
94
Benelux Real Estate February 2010
Investment case
We believe Cofinimmo may be looking to reduce its overweight position in the Brussels decentralised area in order to increase its financial headroom and possibly diversify into other offices markets and asset classes, and increase its weight in nursing homes. We are positive on Cofinimmo’s diversification strategy, which leads us to believe it will outperform Befimmo and its offices peers in a deteriorating Brussels offices market. Cofinimmo has creatively re-engineered its balance sheet, and may be looking to further deleverage by making a number of smaller disposals and realising contributions in kind, eg, property for share swaps. Cash EPS is expected to decrease on the back of lease incentives, limited indexation, the recent shares issued, while starting in 2011 the effect of the sale of receivables related to the Egmont buildings will be felt.
SWOT Fig 1 SWOT analysis
Strengths Weaknesses
Cofinimmo’s creativity has allowed diversification into attractive alternative real estate asset classes Strong tenant profile (public sector and nursing home operators) and lease duration (12 years) Market leader in Belgian real estate investing; high visibility towards investors Fiscal transparency thanks to SICAFI and SIIC status Creative
Low vacancy and small pipeline may hamper outperformance Off balance sheet sale of receivables lower the cash EPS, the Egmont complex sale of receivables will only impact cash EPS starting in 2011 Quality of financial reporting from an EPRA best practices point of view Consistency of financial reporting (missing cash flow statement)
Opportunities Threats/Risks
Its good reputation may allow it to become a real estate partner of businesses that want to focus on their core business Further expansion into other asset classes or countries
Brussels offices market: large delivery of speculative projects
Source: ING _

95
Benelux Real Estate February 2010
Positioning of Cofinimmo and Befimmo
Befimmo and Cofinimmo are the two most important players in the Brussels offices market, with office portfolios of comparable sizes. As we believe secondary office markets may underperform primary markets, Befimmo’s portfolio is likely to show more stability than Cofinimmo’s office portfolio. Nevertheless, we prefer Cofinimmo over Befimmo for a number of reasons:
• Favourable diversification in long-term let, low risk nursing homes and pubs.
• Cofinimmo’s less dilutive deleveraging compared to Befimmo.
• Low likelihood of Befimmo being able to make accretive acquisitions in its field of interest in the near future, despite its dilutive rights issue.
• Corporate governance structure is more favourable in the case of Cofinimmo and will allow more flexibility going forward. We believe Befimmo is too exposed to the influence of AG Insurance.
Offices portfolio
Fig 2 Brussels offices market versus Cofinimmo and Befimmo
0.000.501.001.502.002.503.003.504.00
m m
²
Befimmo 0.13 0.00 0.19 0.08 0.00 0.06 0.11
Cofinimmo 0.08 0.00 0.06 0.15 0.02 0.31 0.09
Market stock 2.35 0.54 1.46 3.21 0.79 2.65 1.86
Centre Midi North Leopold Louise Decentralised Periphery
Market stock excludes area held by Cofinimmo and Befimmo Source: Company data, ING estimates
_
Cofinimmo and Befimmo had a portfolio of c.€3bn and c.€1.9bn, respectively, at end-September 2009. Adjusting for AB Inbev’s Benelux Pubstone portfolio and a large number of nursing homes, the offices portfolio of Cofinimmo totalled c.€1.8bn at end-September 2009.
As a pure-play investor in well-located high quality office buildings, Befimmo has a larger proportion of its assets located in the Central Business District. During the FY08/09 results communication, Befimmo also expressed its desire to sell its decentralised and peripheral offices portfolio (total value of c.€0.6bn, 32% of portfolio).
Despite the higher proportion of decentralised and peripheral office buildings, we believe Cofinimmo has a more attractive Central Business District mix than Befimmo
Comparable offices portfolio in size…
Befimmo tends to sell decentralised and
peripheral assets…
Leopold district is the most lucrative
We prefer diversification over pure
player

96
Benelux Real Estate February 2010
by having an overweight position in the highly lucrative Leopold district (a.k.a. the European district, where we estimate EU institutions alone take c.50% of total office space on very long term, indexed leases).
Fig 3 Cofinimmo offices spread (%)
Fig 4 Befimmo offices spread (%)
Decentralised43%
Periphery13%
Louise3%
Leopold21%
Centre11% Midi
0%
North9%
Centre22%
Midi0%
North34%
Leopold14%
Louise0%
Periphery19%
Decentralised11%
Source: ING estimates Source: ING estimates
When comparing the market compositions of Cofinimmo and Befimmo, we conclude that Cofinimmo is primarily overweight in the decentralised district and underweight in the Central district, while Befimmo is overweight in the North district and underweight in the Leopold district.
Fig 5 Cofinimmo and Befimmo: overweight and underweight areas
-15.0 -10.0 -5.0 0.0 5.0 10.0 15.0 20.0 25.0
Centre
Midi
North
Leopold
Louise
Decentralised
Periphery
%
Cofinimmo Befimmo
Source: Company data, ING estimates _
Looking at the average length of leases, both Cofinimmo and Befimmo score well, with an average lease maturity of c.12 years and >9 years, respectively. Looking at the composition of tenants, Befimmo has c.60% of its leases from government institutions (duration of 12 years), which is more than double the amount of Cofinimmo. Cofinimmo, on the other hand, has more than 20% of its rents derived from nursing home operators (average duration of c.16 years), which enjoy a very favourable government subsidy and regulatory system (see the market overview section on nursing homes).
Unequal portfolio composition…
High quality leases thanks to the
government and nursing homes

97
Benelux Real Estate February 2010
Financing strategy Apart from the differences in portfolio structure, a key distinction between Cofinimmo and Befimmo lies in the recent financing policy.
Befimmo clearly has a more prudent financing strategy, as was demonstrated by the June 2009 rights issue of €167m in order to decrease its debt ratio to 45%, so as to be ready when market opportunities arise. At an issue price of €44 per share, we believe this transaction was not cheap for Befimmo. Taking into account the pure player strategy, we are not sure if attractive acquisition opportunities are likely to arise in the near future.
After the communication of its 1H09 results, Cofinimmo reported a breach in its 55% soft loan-to-value covenant by 1%. This has led to a series of actions (see Figure 6), which have enabled Cofinimmo to avoid a large dilutive rights issue and have demonstrated the company’s ability to find solutions to its financing problems.
Fig 6 Cofinimmo’s deleveraging strategy, in chronological order
Time and event Description
1Q09: accelerated book build 962,485 treasury shares sold at 5% discount to last trading price, raising €72m. Discount to NAV 2010F c.25%
1Q09: sale of receivables Off balance sheet sale of receivables related to four buildings, raising a net €71m 2Q09: accelerated book build 330,000 treasury shares sold at a 5.5% discount to the last trading price, raising €26m 3Q09: dividend cut, in line with our estimates During the 1H09 results, Cofinimmo communicated a breach in soft covenant and a
dividend cut from €7.8 to €6.5, which was in line with our expectations*. This saved c.€18m in cash.
3Q09: sale of receivables Off balance sheet sale of receivables related to the Egmont buildings, generating €200m in cash. Cofinimmo retains ownership of the cash leases during 2009 and 2010, implying unaffected CFPS during this period.
4Q09: share-based acquisition Property for share swap of four nursing homes, resulting in the issuance of 224,967 new shares
4Q09: sale of buildings Several buildings in the Brussels periphery and Central Business District have been sold, generating €55m in cash.
Current status: Cofinimmo has a debt ratio of c.50% and a LTV of 53%. Even though Cofinimmo has acted quickly to successfully avoid penalties relating to its covenant breach, we would not be surprised if additional delivering measures were to follow.
2010F? Our expectations in order of likelihood: 1. property for share acquisition of nursing homes
2. sale of smaller, decentralised and peripheral assets
* See our initiation report on Cofinimmo, 14 July 2009 Source: ING
_
Both Cofinimmo and Befimmo have used the sale of receivables as a disposal strategy, but using different techniques. The key difference is that Befimmo traditionally participates in on-balance sheet sale of receivables, while Cofinimmo always uses off-balance sheet sale of receivables. Two landmark transactions done by Cofinimmo involve the off balance sheet sale of receivables related to the North Galaxy complex in 2005 (generating €312m) and the receivables related to the Egmont buildings in late 2009 (generating €200m).
The key difference between both techniques is that the building, of which the receivables are sold, is reconstituted on the balance sheet as the maturity date of the lease approaches. As this happens through the P&L (through a non-cash lease reception and a cash interest income, see Figure 7 below), a difference must be made between cash EPS and non cash EPS, which is the case for Cofinimmo.
Key difference lies in the financing policy
Befimmo’s prudence led to a dilutive rights issue
Cofinimmo showed more creativity, eg, by
announcing a dividend cut, which we expected
Special attention must be given to the sale of
receivables technique…
…and Cofinimmo’s EPS must be reconciled
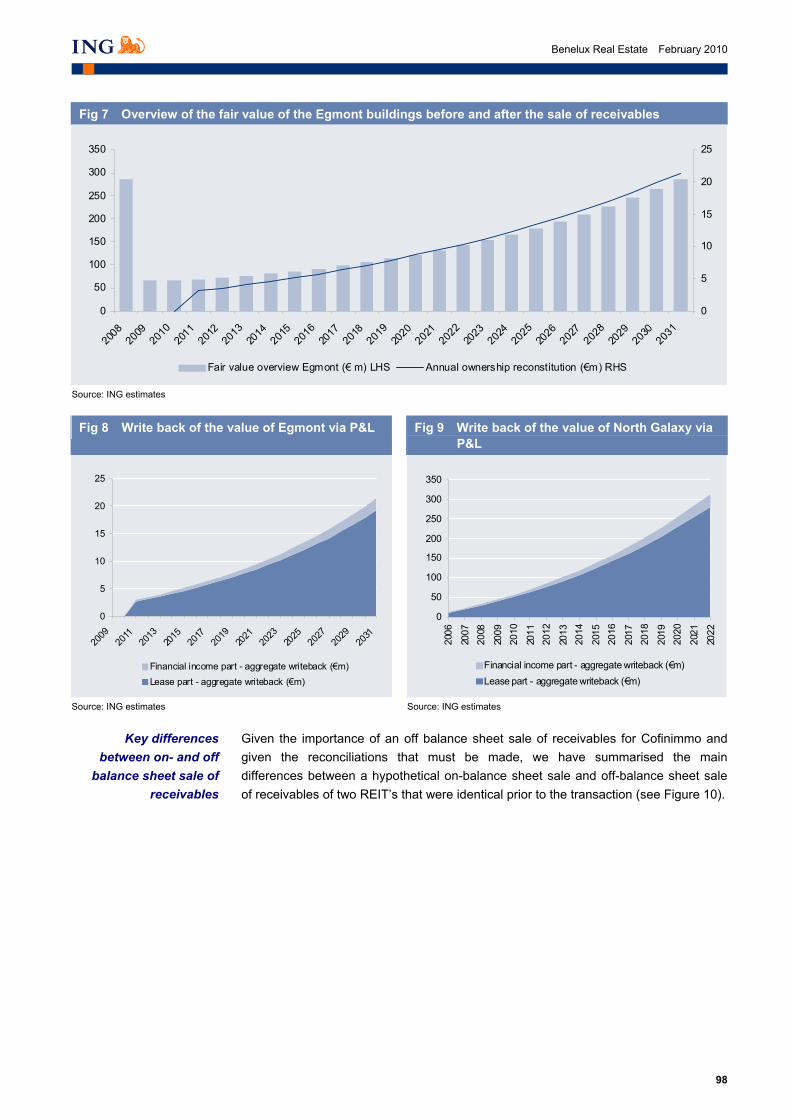
98
Benelux Real Estate February 2010
Fig 7 Overview of the fair value of the Egmont buildings before and after the sale of receivables
0
50
100
150
200
250
300
350
2008
2009
2010
2011
2012
2013
2014
2015
2016
2017
2018
2019
2020
2021
2022
2023
2024
2025
2026
2027
2028
2029
2030
2031
0
5
10
15
20
25
Fair value overview Egmont (€ m) LHS Annual ownership reconstitution (€m) RHS
Source: ING estimates _
Fig 8 Write back of the value of Egmont via P&L
Fig 9 Write back of the value of North Galaxy via P&L
0
5
10
15
20
25
2009
2011
2013
2015
2017
2019
2021
2023
2025
2027
2029
2031
Financial income part - aggregate writeback (€m)Lease part - aggregate writeback (€m)
0
50
100
150
200
250
300
350
2006
2007
2008
2009
2010
2011
2012
2013
2014
2015
2016
2017
2018
2019
2020
2021
2022
Financial income part - aggregate writeback (€m)Lease part - aggregate writeback (€m)
Source: ING estimates Source: ING estimates
_
Given the importance of an off balance sheet sale of receivables for Cofinimmo and given the reconciliations that must be made, we have summarised the main differences between a hypothetical on-balance sheet sale and off-balance sheet sale of receivables of two REIT’s that were identical prior to the transaction (see Figure 10).
Key differences between on- and off
balance sheet sale of receivables

99
Benelux Real Estate February 2010
Fig 10 On balance sheet versus off balance sheet sale of receivables
On balance sheet Off balance sheet
Economic owner of the building REIT REIT
Legal owner of the building REIT REIT
Effect on investment properties value No difference Subtract the difference between last appraisal value and PV of lease payments sold
REIT guarantees rental income collection by bank?
Yes No
Risk of lessee default for financial institution (FI)?
Yes, but mitigated by full recourse of financial institution on the lessor
Financial institution has no recourse on lessor; and therefore carries the full solvency risk of the lessee
PV of leases sold Higher Lower, depending on discount rate
Provisions by REIT? Extra provisions for bad debts are booked
Not necessarily
Magnitude of lease receivables bought by financial institution
Can be up to 100% Never entirely in order to limit risk; the difference is paid to REIT as cash interest income
Financial income booked by REIT? No Yes: cash interest income (c.5-10%) is paid by bank and depends on the quality of payments of the lessee
Reconstitution of building on balance? Not applicable Through P&L: (1) non cash write back of lease receivables; (2) cash reception of interest income (c.5-10%), the magnitude of which depends on the quality of the lessee’s lease payments
Difference between reported EPS and cash EPS?
No difference, total EPS decreases Make a distinction between cash and non cash EPS. Cash EPS will be lower
Cash flow statement reconciliation? No effect Adjust for non cash writeback of lease receivables, no adjustment for cash interest received by financial institution
Marginal net cost of debt compared to on/off balance sheet peer?
Likely higher Likely lower: (1) lower gearing; (2) higher interest income
Effect on LTV? * No effect Lower
Effect on debt ratio? * Small deleveraging Substantial deleveraging, depending on the disparity of discount rate with on balance sheet sale
Effect on balance sheet total? Grows No effect
Additional advantages? • longer duration of debt financing compared with traditional bank
• financing
mostly cheaper than traditional bank debt financing
Disadvantages? Higher discount rate is applied by the financial institution on discounting the lease receivables. The spread with the discount rate used in an on balance sheet sale of receivables largely depends on the credit quality of the tenant
Source: ING
_
As demonstrated in the intuitive approach below, an off balance sheet sale of receivables results in a more effective deleveraging compared with an on balance sheet sale of receivables.
Off balance sheet sale of receivables is the
most effective deleveraging method
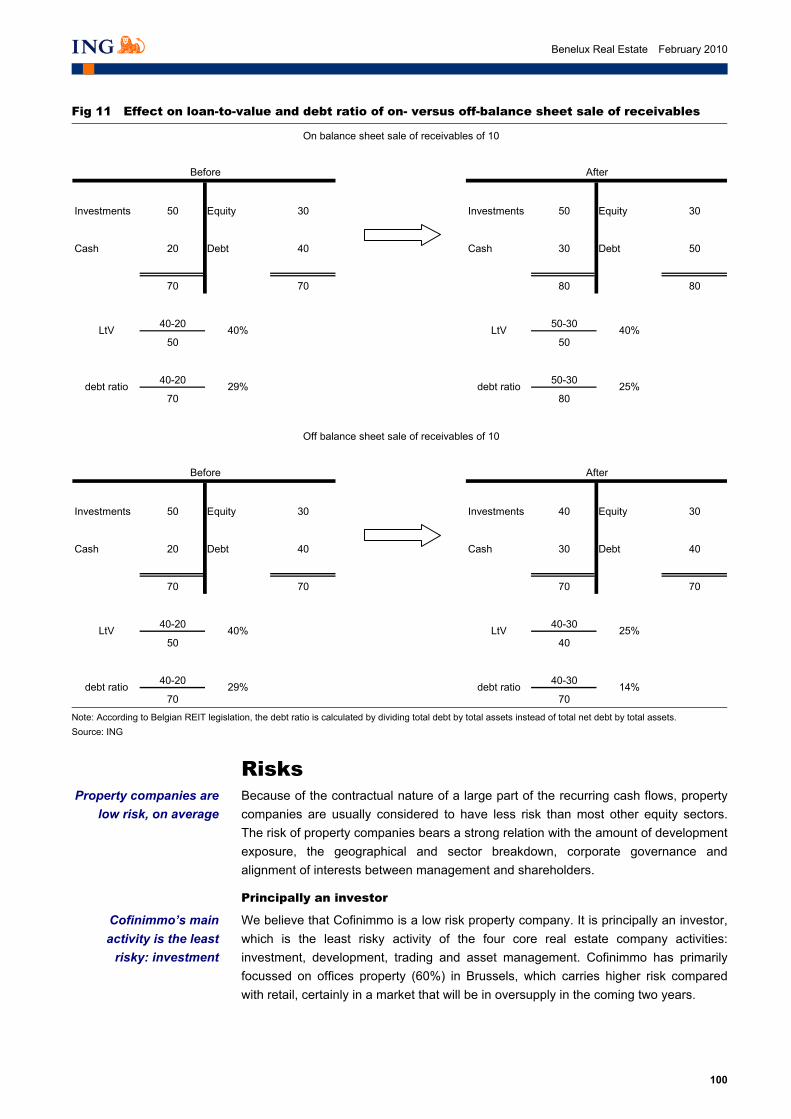
100
Benelux Real Estate February 2010
Fig 11 Effect on loan-to-value and debt ratio of on- versus off-balance sheet sale of receivables
Investments 50 Equity 30 Investments 50 Equity 30
Cash 20 Debt 40 Cash 30 Debt 50
70 70 80 80
40-20 50-30
50 50
40-20 50-30
70 80
Investments 50 Equity 30 Investments 40 Equity 30
Cash 20 Debt 40 Cash 30 Debt 40
70 70 70 70
40-20 40-30
50 40
40-20 40-30
70 70
On balance sheet sale of receivables of 10
Off balance sheet sale of receivables of 10
Before After
debt ratio 29% debt ratio 14%
debt ratio 29%
LtV 25%
debt ratio 25%
LtV 40%
Before After
40%LtV LtV 40%
Note: According to Belgian REIT legislation, the debt ratio is calculated by dividing total debt by total assets instead of total net debt by total assets. Source: ING
_
Risks Because of the contractual nature of a large part of the recurring cash flows, property companies are usually considered to have less risk than most other equity sectors. The risk of property companies bears a strong relation with the amount of development exposure, the geographical and sector breakdown, corporate governance and alignment of interests between management and shareholders.
Principally an investor
We believe that Cofinimmo is a low risk property company. It is principally an investor, which is the least risky activity of the four core real estate company activities: investment, development, trading and asset management. Cofinimmo has primarily focussed on offices property (60%) in Brussels, which carries higher risk compared with retail, certainly in a market that will be in oversupply in the coming two years.
Property companies are low risk, on average
Cofinimmo’s main activity is the least
risky: investment

101
Benelux Real Estate February 2010
The offices risk has been lowered by diversification into pubs (ABInbev’s Benelux pubs portfolio7 (13% of portfolio, 21 years duration)) and nursing homes (25% of portfolio, 16 years duration).
Tenant risk
The largest tenant is the Belgian state, paying c.20% of the total rent roll on a long-term basis. The second largest tenant is ABInbev, paying c.13% of rents on a long-term basis. Given ABInbev’s strong reputation for cutting costs, we believe this exposure is not without risk, despite the long-term and indexed nature of the lease contract. The next largest tenants are nursing home operator Korian and the EU Institution, paying c.7% of the rent roll each. We believe the risk here remains limited given the heavily subsidised business model of nursing home operators in Belgium and France (c.40-50% of their top line is subsidised) and the highest credit quality of the EU institutions.
Accounting for leases
There are accounting initiatives that may lead to the obligation of tenants to account long leases as a liability in their balance sheets. In the future this may put pressure on the average lease lengths of real estate companies and Cofinimmo.
No currency risks
All rents and expenses are made in euro, so there are no currency risks.
Catalysts We see the following catalysts:
• Increase in its firepower, eg, by decreasing its overweight position in the Brussels decentralised area or a minority stake disposal in its nursing homes subsidiary in combination with accretive acquisitions.
• Diversification into another asset class.
• Increase in committed development exposure.
• Full year results on February 12.
Outlook We expect EPS to decrease by 7% YoY by 2010F. The dividend was cut last August from €7.8 to €6.5, which is in line with our estimates and is part of the deleveraging programme. This dividend yield of 6.8% is sustainable, in our view.
When the economy recovers in 2011, we believe that the Brussels office market will lag a European recovery because of very limited supply constraints and a user breakdown that is less volatile, both up- and downward, as a result of the large presence of the EU and EU-related office space users. We believe that in order for Cofinimmo to continue its outperformance over the coming years, it should substantially beef up its growth angles, for example through development or further international expansion. We would not be surprised if Cofinimmo were to sell additional assets in the Brussels decentralised and peripheral area, and increase its weight in nursing homes.
7 Note that ABInbev acts as the master tenant towards Cofinimmo
Low risk long-term leases, but we are
cautious on ABInbev
Potential pressure on lease length
Brussels offices risk has been diversified
For outperformance to continue, Cofinimmo
needs more growth angles
The August 2009 dividend cut was in line
with our expectations

102
Benelux Real Estate February 2010
Valuation We have changed our valuation methodology and now value the Benelux property investment companies primarily based on a target discount or premium to NAV. Our 10% target premium for Cofinimmo reflects the strength of the office leases, the low risks of the pubs sale and lease back, the strong outlook for the nursing homes market, and our confidence in management. As a result, we increase our target price to €109.2 per share. Current financial reporting does not allow reconciliation to EPRA NNNAV, which is why we cannot adjust for deferred capital gains tax and fair market value of debt. The dividend yield is 6.8% and is sustainable.
Consensus Fig 12 Consensus EPS overview (€)
2009F 2010F 2011F
Consensus 7.41 8.05 7.88ING 7.45 6.91 7.15Difference 0.04 (1.14) (0.73)Difference (%) 0.5 -14.2 -9.2
Source: Reuters, ING estimates _
Comparisons with Befimmo Cofinimmo’s closest peer is Befimmo. We have made extensive comparisons between Cofinimmo and Befimmo in the earlier chapters. Cofinimmo is overweight decentralised offices whereas Befimmo is overweight in the North of Brussels office market. We favour the Brussels CBD composition of Cofinimmo over Befimmo. In addition, we have analysed the differences between the impact on balance sheets and gearing of on- and off-balance sheet sales of receivables.
Furthermore, we note that Cofinimmo is a NV (limited liability) and Befimmo is a CV, or commanditair vennootschap. This means that shareholders of Cofinimmo have more power than those of Befimmo.
Our estimates and assumptions 1) Vacancies: We expect a small increase in vacancy from 2.2% in 2009F to 3.4% in
2010F, mainly on the back of activity in the decentralised and peripheral Brussels offices market. Such a best-in-class occupancy rate looks sustainable, but we believe it takes into account some incentives. Nursing homes and pubs are fully let by contractual nature.
Fig 13 Our vacancy assumptions (%)
2009F 2010F 2011F 2012F
Offices – Brussels CBD 0.7 2.0 1.1 1.0Offices – Brussels decentralised 6.5 9.1 8.0 8.0Offices – Brussels periphery 9.5 12.0 10.0 10.0Offices – Antwerp 2.9 4.1 4.5 4.5Offices – other 0.7 5.0 2.0 2.0Other 0.0 0.0 0.0 0.0Nursing homes – Belgium 0.0 0.0 0.0 0.0Nursing homes – France 0.0 0.0 0.0 0.0Pubstone – Belgium 0.0 0.0 0.0 0.0Pubstone – Netherlands 0.0 0.0 0.0 0.0Total 2.2 3.4 2.7 2.7
Source: ING estimates _
Target premium : 10%
Cofinimmo is overweight
decentralised offices whereas Befimmo is
overweight the North
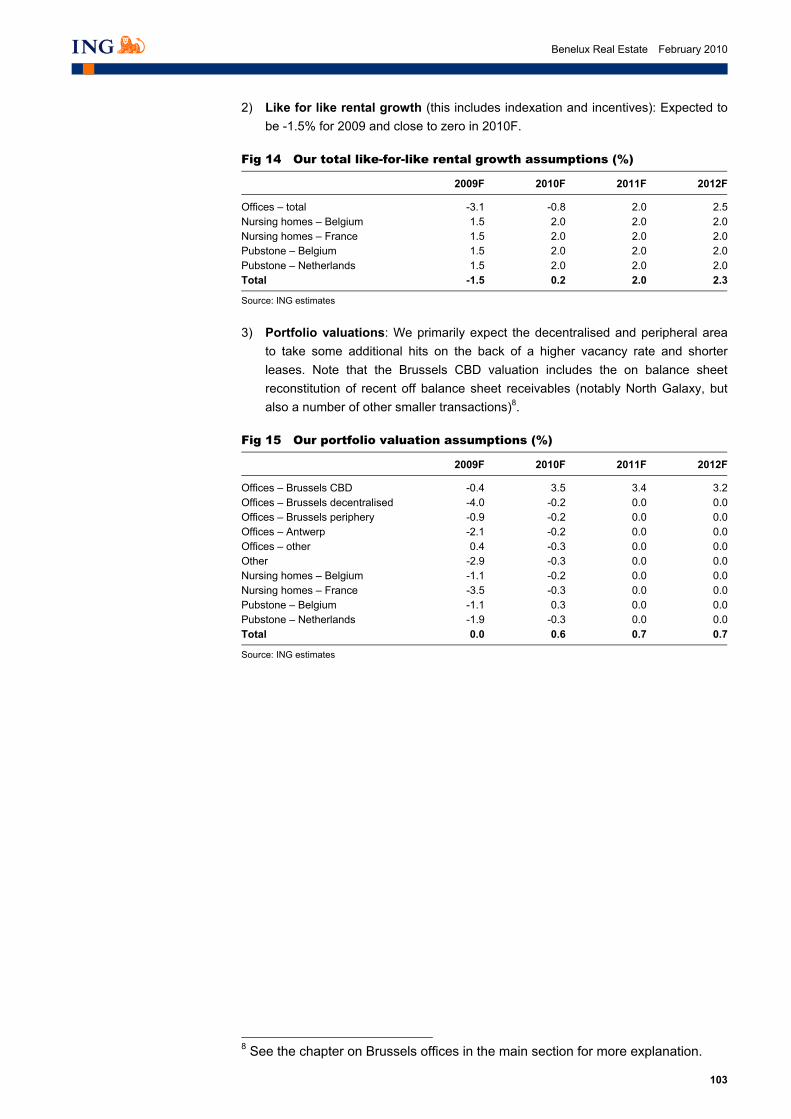
103
Benelux Real Estate February 2010
2) Like for like rental growth (this includes indexation and incentives): Expected to be -1.5% for 2009 and close to zero in 2010F.
Fig 14 Our total like-for-like rental growth assumptions (%)
2009F 2010F 2011F 2012F
Offices – total -3.1 -0.8 2.0 2.5Nursing homes – Belgium 1.5 2.0 2.0 2.0Nursing homes – France 1.5 2.0 2.0 2.0Pubstone – Belgium 1.5 2.0 2.0 2.0Pubstone – Netherlands 1.5 2.0 2.0 2.0Total -1.5 0.2 2.0 2.3
Source: ING estimates
_
3) Portfolio valuations: We primarily expect the decentralised and peripheral area to take some additional hits on the back of a higher vacancy rate and shorter leases. Note that the Brussels CBD valuation includes the on balance sheet reconstitution of recent off balance sheet receivables (notably North Galaxy, but also a number of other smaller transactions)8.
Fig 15 Our portfolio valuation assumptions (%)
2009F 2010F 2011F 2012F
Offices – Brussels CBD -0.4 3.5 3.4 3.2Offices – Brussels decentralised -4.0 -0.2 0.0 0.0Offices – Brussels periphery -0.9 -0.2 0.0 0.0Offices – Antwerp -2.1 -0.2 0.0 0.0Offices – other 0.4 -0.3 0.0 0.0Other -2.9 -0.3 0.0 0.0Nursing homes – Belgium -1.1 -0.2 0.0 0.0Nursing homes – France -3.5 -0.3 0.0 0.0Pubstone – Belgium -1.1 0.3 0.0 0.0Pubstone – Netherlands -1.9 -0.3 0.0 0.0Total 0.0 0.6 0.7 0.7
Source: ING estimates
_
8 See the chapter on Brussels offices in the main section for more explanation.

104
Benelux Real Estate February 2010
Company profile
Diversified real estate investor Originally founded as an office investor, Cofinimmo has recently diversified its portfolio into other real estate asset classes characterised by long-term leases and strong residual value appreciation potential. In 2005, Cofinimmo started buying real estate assets from leading nursing home operators, and in 2007 it bought AB InBev’s Benelux pubs real estate portfolio (Pubstone), significantly enhancing its portfolio duration (currently c.12 years) and occupancy rate. Cofinimmo bears no operational risk on the Pubstone portfolio as AB InBev acts as the master tenant, and is responsible for leasing the pubs individually. Cofinimmo has also bought various office projects requiring renovation from international investors lacking the local know-how and the team to carry out the necessary work.
Apart from the attractive lease profile associated with the recent portfolio diversification, its main advantage lies in residual value appreciation potential. We estimate that the nursing homes have been purchased at an average 30% discount to residential real estate, while the pubs with prime locations (we estimate that c.25% of the total pub portfolio has a prime retail location) could easily be converted into retail shops, characterised by much higher investment value/m². The average rent of the pub portfolio is €70/m² and €270/m² for the Belgian part and the Dutch part of the portfolio, respectively. These contract rents are well below market rents for comparable retail assets.
Fig 16 Overview of assets, September 2009
Fig 17 Lease maturity profile
Office62%
Nursing homes23%
Pubs13%
Other2%
02468
101214
2003 2004 2005 2006 2007 2008 2009
year
s
Source: Company data Source: Company data
_
Since 2005, Cofinimmo has successfully partnered with leading nursing home operators in Belgium and France by buying real estate assets and further supporting the consolidation potential in the market for elderly care in Belgium and France. Cofinimmo is currently one of the largest owners of nursing homes in Continental Europe. Having traditionally made share-based acquisitions of nursing homes, we expect more nursing home acquisitions to come.9
We see the favourable regulatory environment as the nursing home portfolio’s main attraction: c.50% and c.40% of the nursing home operators’ income is secured by government subsidies in Belgium and France, respectively. Moreover, both countries’ governments impose a strict quota on the number of nursing homes, ensuring full occupation. 9 For a general overview of nursing homes, refer the front piece of this book
Successful diversification into
nursing homes, pubs, niche offices…
…without losing track of real estate
fundamentals
More acquisitions of nursing homes are
expected, financed by share issuance
Favourable regulatory environment secures a
full occupancy rate

105
Benelux Real Estate February 2010
Fig 18 Revenues from nursing home operators
Armonea (BE)24%
Korian (FR)37%
Mediter (FR)11%
Medibelge (BE)4%
Senior Living Group (BE)
21%
Calidus (BE)1%
Senior Assist (BE)2%
Source: Company data
Cofinimmo scores better than Befimmo in terms of overall occupancy rates. We expect the overall vacancy rate to go from >2% to >3% at end-2010, which is acceptable, but in our view has to be taken with some lease incentives. No major renovations are planned, while Befimmo has the Impératrice building in renovation (c.€22m investment over 2010-11), adding c.3% to its vacancy rate.
Fig 19 Vacancy rate of the Brussels offices market versus Cofinimmo and Befimmo (%)
0%2%4%6%8%
10%12%14%16%18%20%
Centre Leopold North Decentralised Periphery Total
market Befimmo Cofinimmo
Note that the Centre vacancy rate of Befimmo contains the Telex (Impératrice) building, which is currently in renovation Source: Company data _
High occupancy rate compared with
Befimmo and the market

106
Benelux Real Estate February 2010
Fig 20 Ten most important assets according to FY08 contractual rents
Name Location TypeContractual rents FY08
Occupancy rate FY08 Tenant
Share of portfolio rents Floorspace rent/m²
(€m) (%) (%) (m²) (€)
North Galaxy Brussels North Office 11.1 100 Belgian government 5 105,418 105Souverain 25 Brussels Decentralised Office 10.5 100 Axa 5 57,415 184Egmont 1 Centre Office 10.2 100 Belgian government 5 36,674 278Livingstone 6 Leopold Office 7.6 100 Dexia 4 34,777 217Bourget 42 Leopold Square Brussels Decentralised Office 5.4 100 IBM 2 25,753 209Park Lane Brussels Periphery Office 4.8 86 Multi tenant 2 31,863 149Mechelen Station Mechelen Other 4.1 100 Multi tenant 2 28,711 143Montoyer Science Leopold Office 3.5 99 European Commission 2 12,798 277Tervuren 270-272 Brussels Decentralised Office 3.3 100 Multitenant 2 20,773 157Albert 1 Charleroi Office 3.1 100 Belgian government 1 18,823 165
Source: Company data
_
Corporate governance Management CEO Serge Fautré • Aged 49.
• Cofinimmo CEO since 2002.
• Former chairman of the European Public Real Estate Association (EPRA) and director of Union Professionnelle du Secteur Immobilier (UPSI).
• Former Director, Corporate Finance at Glaverbel and former Treasury and Finance Director at Belgacom.
• Former member of the executive committee of JP Morgan’s investment banking department.
• Holds a masters degree in economics and an MBA.
CFO Jean-Eduard Carbonnelle • Aged 56.
• Joined Cofinimmo in 1998.
• Former CFO of Diamand Boart, former member of the executive committee of Sibéka, and former Investor Relations Manager at Union Minière.
• Holds a masters degree in commercial engineering and an MBA.
COO Jean Franken • Aged 61.
• COO since 1996.
• Active in the real estate sector since the beginning of his career.
• Extensive experience in construction, development and management of real estate assets.
• Is a civil engineer.

107
Benelux Real Estate February 2010
Shareholder structure Investors holding >5% of Cofinimmo’s outstanding shares are depicted below. No shareholder agreement has been made. All shares are free float.
Fig 21 Shareholder structure
DIB Invest5%
Other90%
Allianz5%
Source: Bloomberg
_
100% free float
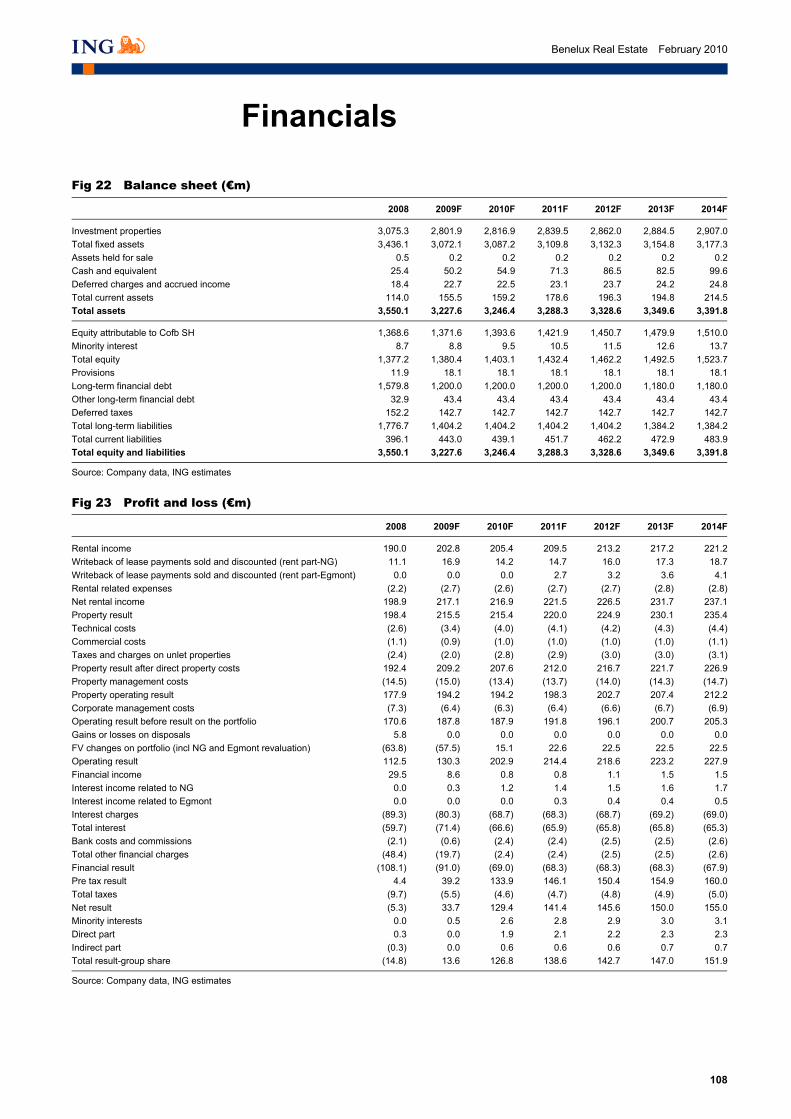
108
Benelux Real Estate February 2010
Financials
Fig 22 Balance sheet (€m)
2008 2009F 2010F 2011F 2012F 2013F 2014F
Investment properties 3,075.3 2,801.9 2,816.9 2,839.5 2,862.0 2,884.5 2,907.0Total fixed assets 3,436.1 3,072.1 3,087.2 3,109.8 3,132.3 3,154.8 3,177.3Assets held for sale 0.5 0.2 0.2 0.2 0.2 0.2 0.2Cash and equivalent 25.4 50.2 54.9 71.3 86.5 82.5 99.6Deferred charges and accrued income 18.4 22.7 22.5 23.1 23.7 24.2 24.8Total current assets 114.0 155.5 159.2 178.6 196.3 194.8 214.5Total assets 3,550.1 3,227.6 3,246.4 3,288.3 3,328.6 3,349.6 3,391.8
Equity attributable to Cofb SH 1,368.6 1,371.6 1,393.6 1,421.9 1,450.7 1,479.9 1,510.0Minority interest 8.7 8.8 9.5 10.5 11.5 12.6 13.7Total equity 1,377.2 1,380.4 1,403.1 1,432.4 1,462.2 1,492.5 1,523.7Provisions 11.9 18.1 18.1 18.1 18.1 18.1 18.1Long-term financial debt 1,579.8 1,200.0 1,200.0 1,200.0 1,200.0 1,180.0 1,180.0Other long-term financial debt 32.9 43.4 43.4 43.4 43.4 43.4 43.4Deferred taxes 152.2 142.7 142.7 142.7 142.7 142.7 142.7Total long-term liabilities 1,776.7 1,404.2 1,404.2 1,404.2 1,404.2 1,384.2 1,384.2Total current liabilities 396.1 443.0 439.1 451.7 462.2 472.9 483.9Total equity and liabilities 3,550.1 3,227.6 3,246.4 3,288.3 3,328.6 3,349.6 3,391.8
Source: Company data, ING estimates _
Fig 23 Profit and loss (€m)
2008 2009F 2010F 2011F 2012F 2013F 2014F
Rental income 190.0 202.8 205.4 209.5 213.2 217.2 221.2Writeback of lease payments sold and discounted (rent part-NG) 11.1 16.9 14.2 14.7 16.0 17.3 18.7Writeback of lease payments sold and discounted (rent part-Egmont) 0.0 0.0 0.0 2.7 3.2 3.6 4.1Rental related expenses (2.2) (2.7) (2.6) (2.7) (2.7) (2.8) (2.8)Net rental income 198.9 217.1 216.9 221.5 226.5 231.7 237.1Property result 198.4 215.5 215.4 220.0 224.9 230.1 235.4Technical costs (2.6) (3.4) (4.0) (4.1) (4.2) (4.3) (4.4)Commercial costs (1.1) (0.9) (1.0) (1.0) (1.0) (1.0) (1.1)Taxes and charges on unlet properties (2.4) (2.0) (2.8) (2.9) (3.0) (3.0) (3.1)Property result after direct property costs 192.4 209.2 207.6 212.0 216.7 221.7 226.9Property management costs (14.5) (15.0) (13.4) (13.7) (14.0) (14.3) (14.7)Property operating result 177.9 194.2 194.2 198.3 202.7 207.4 212.2Corporate management costs (7.3) (6.4) (6.3) (6.4) (6.6) (6.7) (6.9)Operating result before result on the portfolio 170.6 187.8 187.9 191.8 196.1 200.7 205.3Gains or losses on disposals 5.8 0.0 0.0 0.0 0.0 0.0 0.0FV changes on portfolio (incl NG and Egmont revaluation) (63.8) (57.5) 15.1 22.6 22.5 22.5 22.5Operating result 112.5 130.3 202.9 214.4 218.6 223.2 227.9Financial income 29.5 8.6 0.8 0.8 1.1 1.5 1.5Interest income related to NG 0.0 0.3 1.2 1.4 1.5 1.6 1.7Interest income related to Egmont 0.0 0.0 0.0 0.3 0.4 0.4 0.5Interest charges (89.3) (80.3) (68.7) (68.3) (68.7) (69.2) (69.0)Total interest (59.7) (71.4) (66.6) (65.9) (65.8) (65.8) (65.3)Bank costs and commissions (2.1) (0.6) (2.4) (2.4) (2.5) (2.5) (2.6)Total other financial charges (48.4) (19.7) (2.4) (2.4) (2.5) (2.5) (2.6)Financial result (108.1) (91.0) (69.0) (68.3) (68.3) (68.3) (67.9)Pre tax result 4.4 39.2 133.9 146.1 150.4 154.9 160.0Total taxes (9.7) (5.5) (4.6) (4.7) (4.8) (4.9) (5.0)Net result (5.3) 33.7 129.4 141.4 145.6 150.0 155.0Minority interests 0.0 0.5 2.6 2.8 2.9 3.0 3.1Direct part 0.3 0.0 1.9 2.1 2.2 2.3 2.3Indirect part (0.3) 0.0 0.6 0.6 0.6 0.7 0.7Total result-group share (14.8) 13.6 126.8 138.6 142.7 147.0 151.9
Source: Company data, ING estimates
_
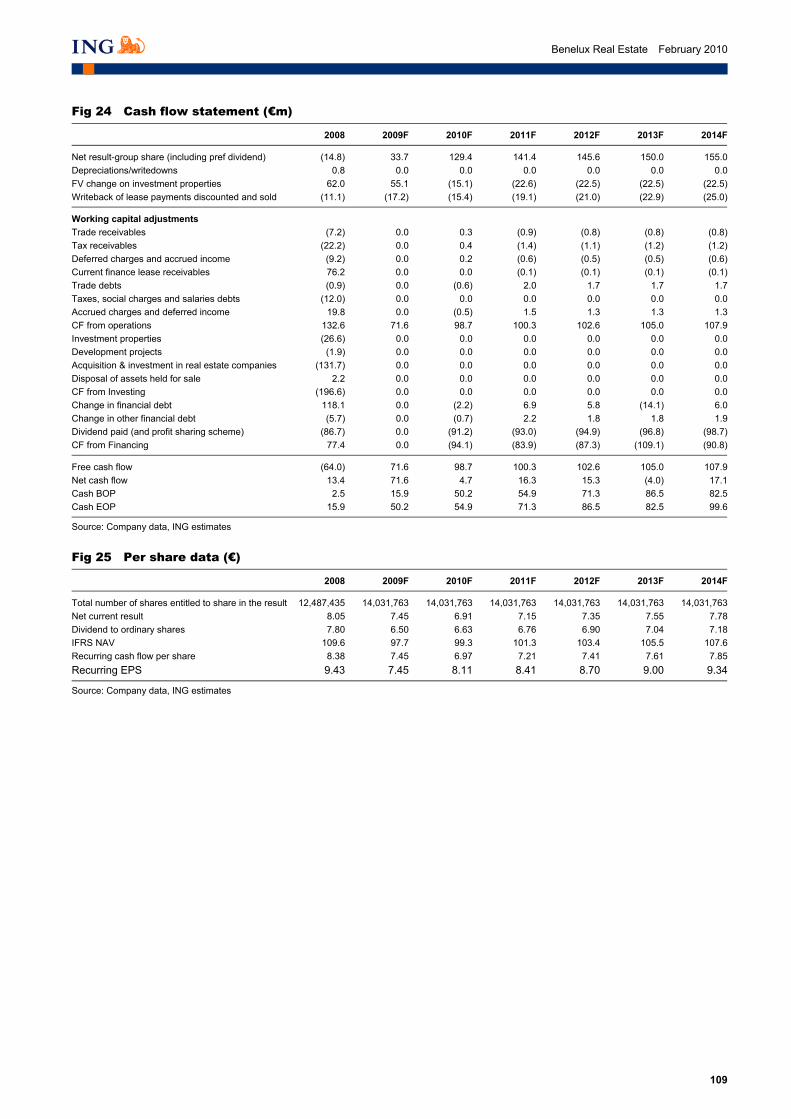
109
Benelux Real Estate February 2010
Fig 24 Cash flow statement (€m)
2008 2009F 2010F 2011F 2012F 2013F 2014F
Net result-group share (including pref dividend) (14.8) 33.7 129.4 141.4 145.6 150.0 155.0Depreciations/writedowns 0.8 0.0 0.0 0.0 0.0 0.0 0.0FV change on investment properties 62.0 55.1 (15.1) (22.6) (22.5) (22.5) (22.5)Writeback of lease payments discounted and sold (11.1) (17.2) (15.4) (19.1) (21.0) (22.9) (25.0)
Working capital adjustments Trade receivables (7.2) 0.0 0.3 (0.9) (0.8) (0.8) (0.8)Tax receivables (22.2) 0.0 0.4 (1.4) (1.1) (1.2) (1.2)Deferred charges and accrued income (9.2) 0.0 0.2 (0.6) (0.5) (0.5) (0.6)Current finance lease receivables 76.2 0.0 0.0 (0.1) (0.1) (0.1) (0.1)Trade debts (0.9) 0.0 (0.6) 2.0 1.7 1.7 1.7Taxes, social charges and salaries debts (12.0) 0.0 0.0 0.0 0.0 0.0 0.0Accrued charges and deferred income 19.8 0.0 (0.5) 1.5 1.3 1.3 1.3CF from operations 132.6 71.6 98.7 100.3 102.6 105.0 107.9Investment properties (26.6) 0.0 0.0 0.0 0.0 0.0 0.0Development projects (1.9) 0.0 0.0 0.0 0.0 0.0 0.0Acquisition & investment in real estate companies (131.7) 0.0 0.0 0.0 0.0 0.0 0.0Disposal of assets held for sale 2.2 0.0 0.0 0.0 0.0 0.0 0.0CF from Investing (196.6) 0.0 0.0 0.0 0.0 0.0 0.0Change in financial debt 118.1 0.0 (2.2) 6.9 5.8 (14.1) 6.0Change in other financial debt (5.7) 0.0 (0.7) 2.2 1.8 1.8 1.9Dividend paid (and profit sharing scheme) (86.7) 0.0 (91.2) (93.0) (94.9) (96.8) (98.7)CF from Financing 77.4 0.0 (94.1) (83.9) (87.3) (109.1) (90.8)
Free cash flow (64.0) 71.6 98.7 100.3 102.6 105.0 107.9Net cash flow 13.4 71.6 4.7 16.3 15.3 (4.0) 17.1Cash BOP 2.5 15.9 50.2 54.9 71.3 86.5 82.5Cash EOP 15.9 50.2 54.9 71.3 86.5 82.5 99.6
Source: Company data, ING estimates _
Fig 25 Per share data (€)
2008 2009F 2010F 2011F 2012F 2013F 2014F
Total number of shares entitled to share in the result 12,487,435 14,031,763 14,031,763 14,031,763 14,031,763 14,031,763 14,031,763Net current result 8.05 7.45 6.91 7.15 7.35 7.55 7.78Dividend to ordinary shares 7.80 6.50 6.63 6.76 6.90 7.04 7.18IFRS NAV 109.6 97.7 99.3 101.3 103.4 105.5 107.6Recurring cash flow per share 8.38 7.45 6.97 7.21 7.41 7.61 7.85Recurring EPS 9.43 7.45 8.11 8.41 8.70 9.00 9.34
Source: Company data, ING estimates
_

110
Benelux Real Estate February 2010
Fig 26 Quarterly profit and loss (€m)
1Q09 2Q09 3Q09 4Q09F 1Q10F 2Q10F 3Q10F 4Q10F
Rental income 49.3 50.4 51.4 51.7 51.8 50.8 51.3 51.5Writeback of lease payments sold and discounted (rent part-NG) 4.4 4.5 4.4 3.7 3.4 4.0 3.4 3.4Writeback of lease payments sold and discounted (rent part-Egmont) 0.0 0.0 0.0 0.0 0.0 0.0 0.0 0.0Rental related expenses (0.8) (0.6) (0.6) (0.7) (0.7) (0.7) (0.6) (0.7)Net rental income 52.9 54.3 55.2 54.7 54.5 54.2 54.0 54.3Subtotal recoveries etc. (0.7) (0.4) (0.2) (0.4) (0.4) (0.4) (0.4) (0.4)Property result 52.2 53.9 55.0 54.4 54.1 53.8 53.6 53.9Technical costs (0.5) (0.9) (1.0) (1.0) (1.0) (1.0) (1.0) (1.0)Commercial costs (0.2) (0.2) (0.2) (0.2) (0.2) (0.2) (0.2) (0.2)Taxes and charges on unlet properties (0.2) (0.4) (0.7) (0.7) (0.7) (0.7) (0.7) (0.7)Property result after direct property costs 51.4 52.4 53.0 52.4 52.1 51.9 51.7 51.9Property management costs (4.0) (4.2) (3.4) (3.4) (3.4) (3.4) (3.3) (3.4)Property operating result 47.4 48.1 49.6 49.0 48.8 48.5 48.3 48.6Corporate management costs (1.7) (1.5) (1.6) (1.6) (1.6) (1.6) (1.6) (1.6)Operating result before result on the portfolio 45.7 46.7 48.0 47.4 47.2 46.9 46.8 47.0Gains or losses on disposals 0.5 (0.3) 0.5 0.0 0.0 0.0 0.0 0.0FV changes on portfolio (incl NG and Egmont revaluation) (20.6) (19.7) (15.4) (1.8) 2.3 2.7 5.0 5.0Operating result 25.5 26.7 33.1 45.6 49.5 49.7 51.8 52.0Financial income 1.3 3.6 3.6 0.1 0.2 0.2 0.2 0.2Interest income related to NG 0.0 0.0 0.0 0.3 0.3 0.3 0.3 0.3Interest income related to Egmont 0.0 0.0 0.0 0.0 0.0 0.0 0.0 0.0Interest charges (19.2) (20.1) (23.4) (18.1) (16.9) (17.2) (17.4) (17.2)Total interest (17.9) (16.6) (19.8) (17.7) (16.4) (16.7) (16.9) (16.6)Financial result (29.5) (13.2) (30.0) (18.3) (17.0) (17.3) (17.5) (17.2)Pre tax result (4.0) 13.5 3.2 27.3 32.5 32.4 34.3 34.8Total taxes (1.4) (1.7) (1.2) (1.2) (1.1) (1.1) (1.1) (1.1)Net result (5.4) 11.7 2.0 26.1 31.3 31.3 33.1 33.6Minority interests (0.1) 0.4 (0.2) 0.5 0.6 0.6 0.7 0.7Direct part 0.0 0.0 0.0 0.4 0.5 0.5 0.5 0.5Indirect part 0.0 0.0 0.0 0.1 0.1 0.1 0.2 0.2Total result-group share (32.6) 17.0 4.8 25.6 30.7 30.7 32.5 33.0
Source: Company data, ING estimates _
Fig 27 Quarterly cash flow statement (€m)
1Q09 2Q09 3Q09 4Q09F 1Q10F 2Q10F 3Q10F 4Q10F
(5.5) 12.1 0.0 26.1 31.3 31.3 33.1 33.6FV change on investment properties 0.0 0.0 0.0 1.8 (2.3) (2.7) (5.0) (5.0)Writeback of lease payments sold and discounted (rent and int part) 0.0 0.0 0.0 (4.0) (3.7) (4.4) (3.7) (3.7)Others 0.0 0.0 0.0 0.0 0.0 0.0 0.0 0.0
Working capital adjustments Trade receivables 0.0 0.0 0.0 0.3 0.2 0.2 0.1 (0.2)Tax receivables 0.0 0.0 0.0 0.4 0.2 0.2 0.2 (0.2)Deferred charges and accrued income 0.0 0.0 0.0 0.2 0.1 0.1 0.1 (0.1)Trade debts 0.0 0.0 0.0 (0.6) (0.3) (0.3) (0.3) 0.3Taxes, social charges and salaries debts 0.0 0.0 0.0 0.0 0.0 0.0 0.0 0.0Accrued charges and deferred income 0.0 0.0 0.0 (0.4) (0.3) (0.3) (0.2) 0.3CF from Operations (5.5) 12.1 0.0 27.8 25.2 24.1 24.4 25.0
Investment properties 0.0 0.0 0.0 0.0 0.0 0.0 0.0 0.0Development projects 0.0 0.0 0.0 0.0 0.0 0.0 0.0 0.0Acquisition & investment in real estate companies 0.0 0.0 0.0 0.0 0.0 0.0 0.0 0.0Disposal of assets held for sale 0.0 0.0 0.0 194.0 0.0 0.0 0.0 0.0CF from Investing 0.0 0.0 0.0 194.0 0.0 0.0 0.0 0.0
Change in financial debt 0.0 0.0 0.0 (172.2) (51.2) 98.8 (51.0) 1.2Change in other financial debt 0.0 0.0 0.0 (0.6) (0.4) (0.4) (0.3) 0.4Dividend paid (and profit sharing scheme) 0.0 0.0 0.0 0.0 0.0 (91.2) 0.0 0.0CF from Financing 0.0 0.0 0.0 (172.8) (51.6) 7.2 (51.2) 1.5
Free cash flow (5.5) 12.1 0.0 221.8 25.2 24.1 24.4 25.0Net cash flow (5.5) 12.1 0.0 48.9 (26.3) 31.4 (26.9) 26.5Cash BOP 0.0 0.0 1.4 1.3 50.2 23.9 55.3 28.4Cash EOP 2.9 1.4 1.4 50.2 23.9 55.3 28.4 54.9
Source: Company data, ING estimates
_

111
Benelux Real Estate February 2010
Fig 28 Quarterly per share data (€)
1Q09 2Q09 3Q09 4Q09F 1Q10F 2Q10F 3Q10F 4Q10F
Total number of shares entitled to share in the result 13,454,422 13,784,422 13,784,422 13,784,422 14,031,763 14,031,763 14,031,763 14,031,763Net current result 1.84 1.92 1.64 1.73 1.77 1.69 1.71 1.74Dividend to ordinary shares 0 7.8 0 0 0 6.5 0 0IFRS NAV 104.5 97.7 97.9 99.5 99.7 95.2 97.2 99.3Recurring cash flow per share 2.21 2.24 1.98 1.72 1.79 1.71 1.72 1.75
Source: Company data, ING estimates

112
Benelux Real Estate February 2010
This page is left blank intentionally

113
Benelux Real Estate February 2010
Netherlands
Corio Transforming at bottom of the cycle?
We investigate the impact of a potential Multi deal. EPS could rise by €0.20 if portfolio size is above €1.5bn and the yield is >6%. We upgrade to BUY; our TP of €49.6 is based on a target premium of 10% to IFRS NAV 2010F.
€44.35 February 2010
Buy
Key ratios (%)
2008 2009F
Rental growth 22.5 7.1Operating margin 90.8 79.4Occupancy rate 97.7 96.0
Share data No. of shares (m) 76.4Daily turnover (shares, 3M) 225,000Free float (%) 100Enterprise value (€m) 5,737.1Market cap (€m) 3,379.1
12-month forecast returns (%) Share price 12.0Dividend 6.012m f'cst total return 18.0
Real Estate
€49.6 Target price (12 mth)
COR.AS Reuters
Share price performance
20
30
40
50
60
70
1/08 7/08 1/09 7/09 1/10Price
AEX All Share (rebased)
Source: ING
Arjan Knibbe Amsterdam (31) 20 563 8780 [email protected]
Jean-Yves Devloo Amsterdam (31) 20 563 8745 [email protected]
Sensitivity of our 2010F EPS adj to vacancy rates and LFL (€)
Vacancy rate (%) 0 1 2 3 4 5 6 7 -1 0.09 0.05 0.00 -0.05 -0.09 -0.14 -0.18 -0.23 0 0.14 0.09 0.04 0.00 -0.05 -0.09 -0.14 -0.19 1 0.18 0.13 0.09 0.04 0.00 -0.05 -0.10 -0.14LFL (%) 2 0.22 0.18 0.13 0.09 0.04 -0.01 -0.05 -0.10 3 0.27 0.22 0.18 0.13 0.08 0.04 -0.01 -0.05 4 0.31 0.27 0.22 0.17 0.13 0.08 0.04 -0.01 5 0.36 0.31 0.26 0.22 0.17 0.13 0.08 0.03 6 0.40 0.35 0.31 0.26 0.22 0.17 0.12 0.08
Source: ING _
EPS sensitivity. Our 2010F EPS estimate is based on a vacancy rate of 4% and a like-for-like excluding vacancy impact of 1.1%. The table above illustrates the sensitivity of our 2010F EPS to those drivers.
We upgrade Corio to a BUY as our target price of €49.6 now gives total upside of 18%. Detail on the Multi deal is lacking. Our target price is based on a 10% target premium on our 2010F IFRS NAVE of €50. We believe this is conservative as this does not reflect any value for the pipeline.
Key ratios and forecasts
2008 2009F 2010F 2011F 2012F
EPS adj (€) 3.08 3.02 2.73 2.79 3.15IFRS NAV (€) 52.2 44.8 45.1 46.2 48.1EPRA NNNAV per share (€) 57.9 49.7 50.0 51.0 52.6P/EPRA NNNAV (%) 0.76 0.89 0.89 0.87 0.84DPS (€) 2.64 2.64 2.69 2.75 2.80Dividend yield (%) 6.0% 6.0% 6.1% 6.2% 6.3%LTV (%) 40.6 38.3 42.2 43.0 42.5
Source: Company data, ING estimates
Previously: Hold

114
Benelux Real Estate February 2010
Investment case
Corio is a leading retail property investor and developer in Europe. The group owns a €6bn portfolio of investments in its five home markets: the Netherlands, France, Italy, Spain and Turkey. In addition, Corio has a €2.4bn development pipeline, €784m of which is committed.
Highlights Corio has announced it is in exclusive talks with one of the largest retail developers in Europe, Multi Development. In this report we investigate the impact of an acquisition of Multi‘s assets on the profitability of Corio.
We believe that Multi Development has an impressive track record and owns very attractive assets. If Corio can acquire assets at liquidation prices, this could be very attractive. If Corio were to acquire a large proportion of the assets, this could be a company-transforming deal. Corio primarily wants to add Germany as a sixth home market with this deal and stated it is focused on Multi’s Western European assets. In addition, Multi has very substantial exposure to Turkey and Italy that offer attractive opportunities for Corio as it strengthens its existing clusters of centres.
The earnings impact will be bigger than the NAV impact. The impact of a potential deal is primarily dependent on the size and yield of the acquired investment portfolio. We believe that the 413,600m² German portfolio of investments and developments is likely to be valued at above €1.6bn. The acquisition of such a portfolio, at a net yield of 6%, when financed with debt, would add more then €0.20 per share to 2010F EPS, even based on a 5% cost of debt (Corio currently pays c.4.0%).
We believe the market fails to appreciate the quality of Multi’s assets and has not fully priced in this once-in-a-lifetime growth opportunity. On the other hand, investors may fear that Corio will overpay. We believe that Corio has excellent pure property skills and is well positioned to make sure it does not overpay. In addition earn-out constructions and JV’s can further secure a good outcome for Corio. Lastly, Corio does not have to do a deal; if it does not consider the deal to be attractive it can walk away and wait for another portfolio.
We have also stress tested EPS for vacancy rates and like-for-like rental growth. Our findings are shown on the front page of this report. In a worst case scenario, with vacancies rising from our estimate of c.4% to 7% and like-for-like rents dropping from our estimate of 1.1% to -1%, we forecast that 2010F EPS would fall by €0.23 to €2.50.
Corio is unlikely to overpay
If a deal takes place EPS could increase by
as much as €0.20
We investigate the impact of a Multi deal
Deal could be attractive and the company is
transforming
Stress testing for vacancy and LFL rental
growth
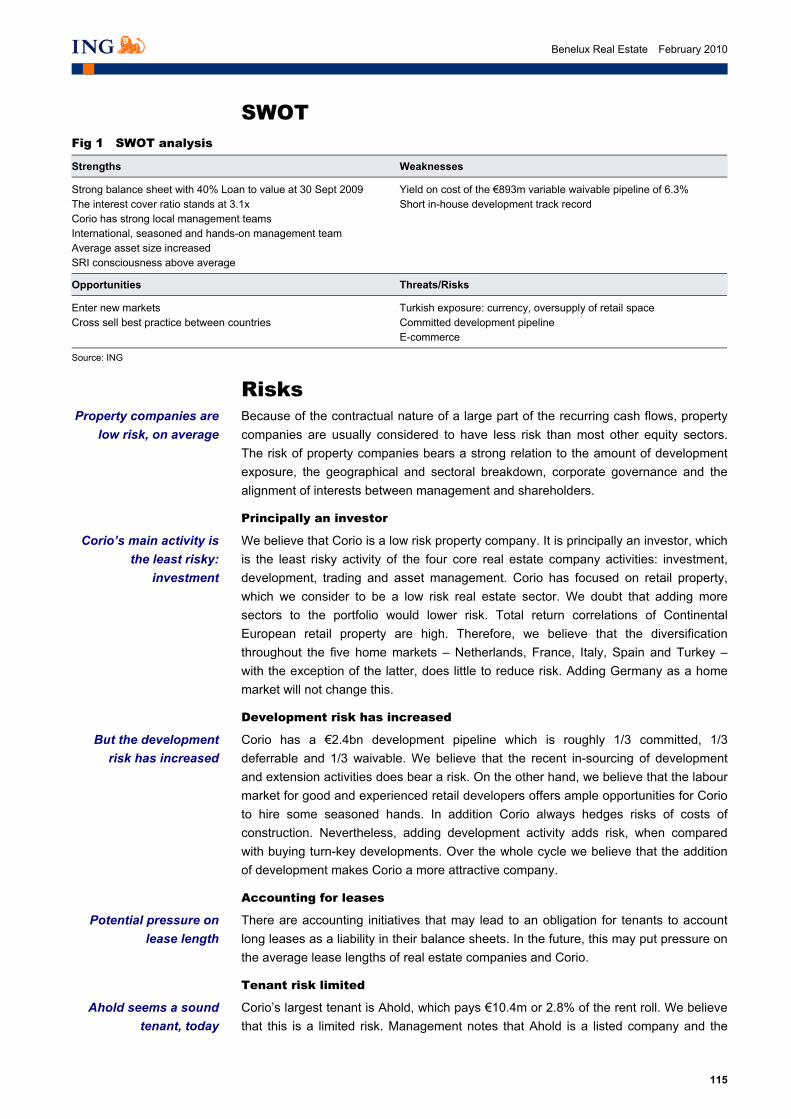
115
Benelux Real Estate February 2010
SWOT Fig 1 SWOT analysis
Strengths Weaknesses
Strong balance sheet with 40% Loan to value at 30 Sept 2009 Yield on cost of the €893m variable waivable pipeline of 6.3% The interest cover ratio stands at 3.1x Short in-house development track record Corio has strong local management teams International, seasoned and hands-on management team Average asset size increased SRI consciousness above average
Opportunities Threats/Risks
Enter new markets Turkish exposure: currency, oversupply of retail space Cross sell best practice between countries Committed development pipeline E-commerce
Source: ING _
Risks Because of the contractual nature of a large part of the recurring cash flows, property companies are usually considered to have less risk than most other equity sectors. The risk of property companies bears a strong relation to the amount of development exposure, the geographical and sectoral breakdown, corporate governance and the alignment of interests between management and shareholders.
Principally an investor
We believe that Corio is a low risk property company. It is principally an investor, which is the least risky activity of the four core real estate company activities: investment, development, trading and asset management. Corio has focused on retail property, which we consider to be a low risk real estate sector. We doubt that adding more sectors to the portfolio would lower risk. Total return correlations of Continental European retail property are high. Therefore, we believe that the diversification throughout the five home markets – Netherlands, France, Italy, Spain and Turkey – with the exception of the latter, does little to reduce risk. Adding Germany as a home market will not change this.
Development risk has increased
Corio has a €2.4bn development pipeline which is roughly 1/3 committed, 1/3 deferrable and 1/3 waivable. We believe that the recent in-sourcing of development and extension activities does bear a risk. On the other hand, we believe that the labour market for good and experienced retail developers offers ample opportunities for Corio to hire some seasoned hands. In addition Corio always hedges risks of costs of construction. Nevertheless, adding development activity adds risk, when compared with buying turn-key developments. Over the whole cycle we believe that the addition of development makes Corio a more attractive company.
Accounting for leases
There are accounting initiatives that may lead to an obligation for tenants to account long leases as a liability in their balance sheets. In the future, this may put pressure on the average lease lengths of real estate companies and Corio.
Tenant risk limited
Corio’s largest tenant is Ahold, which pays €10.4m or 2.8% of the rent roll. We believe that this is a limited risk. Management notes that Ahold is a listed company and the
Ahold seems a sound tenant, today
Property companies are low risk, on average
Potential pressure on lease length
Corio’s main activity is the least risky:
investment
But the development risk has increased

116
Benelux Real Estate February 2010
consequent transparency should in principle lead to early warning signs if there is a possibility that Ahold is unable to pay its rent. Ahold’s credit rating is BBB.
Currency risks are manageable
Corio has a c.€397m gross exposure to the Turkish lira, excluding the c.€380m planned Turkish developments, after the cancelation of the Akozza and Akasya developments in December. Although rents are paid in hard currencies (Euro and US dollars) we believe that the value component of the Turkish exposure bears currency risk. These currency risks are not removed by the US dollar borrowings.
E-commerce
We believe e-commerce will continue to change consumer shopping patterns. The importance of a physical shop in the total distribution will diminish further. As a result, footfall may fall in shopping centres. In addition consumer-to-consumer trading has dramatically increased with E-Bay and similar sites. To a large extent, consumer-to-consumer trading comes at the expense of retail turnover. Lastly, virtual social networks are more likely to decrease than to increase the social function of a shopping centre.
Catalysts We see five potential short-term catalysts.
• A Multi Development deal
• Succession of the CFO Jan Haars
• Full-year results on 18 February
• Other acquisitions and disposals
• Further trimming of the development pipeline
We believe the outcome of announced negotiations with Multi Development is by far the most important catalyst for Corio.
The Multi announcement Corio has announced that it has entered into exclusive negotiations about a part of the Multi Development portfolio. According to the press release there can be no assurance that a transaction of any kind will take place. This deal could turn out to be company transforming if Corio carves out a large proportion of Multi’s assets.
Multi is a leading developer of shopping centres in Europe. Multi operates in 14 European countries and Corio announced it is in talks about its Western European operations, in particular Germany, with the aim of opening a new sixth home market. Financial disclosure of Multi is not up to listed standards. In 2006 Multi changed its strategy to become a developer-investor. We would not be surprised if the financing banks are pushing Multi to cash in on recent shopping centre completions.
This deal could be substantial as Multi has a multi billion euro portfolio. In Germany alone we would estimate the portfolio to be valued at above €1.5bn. Corio currently has a €6bn portfolio and has virtually no German presence. As Multi is also a very important developer in Turkey, a market where Corio is also a pioneer, these negotiations could be seen as the opening move of a longer game.
Dollar loans do not remove Turkish Lira risk
This deal could be company
transforming
Germany as sixth home market…
…and very substantial Turkish, French and
Italian potential

117
Benelux Real Estate February 2010
Multi opened a very large shopping centre in Palermo in November 2009 and Corio will feel they are well positioned to assess the risk of southern Italian centres, after their Naples experience with La Marcianise shopping centre. Multi is also the developer of the largest mall in Europe – the 175,000m² Forum Istanbul – which opened a few months ago.
Figure 2 illustrates the breakdown of Multi Development’s German portfolio. Over half of the m² have been delivered and are in operation.
Fig 2 Multi's German portfolio by status
Under construction30%
Completed55%
In development15%
Source: Multi Development, ING estimates, based on m²
Figure 3 provides a full overview of the German portfolio. Bear in mind that not all of the centres are 100% owned and Multi does not disclose its holdings. We believe the centres are generally well located. The regional spread of the portfolio also gives no reason for concern. In the appendix we have included a full list of Multi Development’s completions.
Fig 3 Multi's German portfolio
City Name GLA (m²) Completion Comment
Under construction 122,500 - Hildesheim Arneken Galerie 26,500 2011 Mixed - Berlin Boulevard Berlin 76,000 3Q11 Mixed - Duisburg Konings Allee 20,000 3Q10 3,500 office space
Completed 227,100 - Dresden Centrum Galerie 62,000 Sep 09 4 floors, 1,000 parkings - Duisburg Forum Duisburg 57,000 Sep 08 Very good according to Breaam - Osnabruck Kamp Promenade 16,300 Sep 04 3,200m² offices - Wiesbaden Lilien Carre 36,000 Mar 07 10,000m² office - Pforzheim Schlossle Galerie 22,400 Mar 05 2,400m² office - Hagen Volme-Galerie am Rathaus 33,400 Mar 03 2,400m² office
In development 64,000 - Recklinghausen Quartier am Markt 42,000 2H12 12,000m² Karstadt - Bamberg Quartier an der Stadtmauer 11,000 1H12 Construction start 2010 - Duisburg Stadtfenster 11,000 4Q11 Mixed incl 1,200m² retail Total 413,600
Source: Multi development, ING estimates
_
Not all investors will be happy with Corio gaining a strong German presence, unless the company manages to buy at a low price. Dresden and Duisburg have only recently been delivered so the performance has not reached ‘cruising speed’. The opening of a
Not all centres have reached ‘cruising
speed’
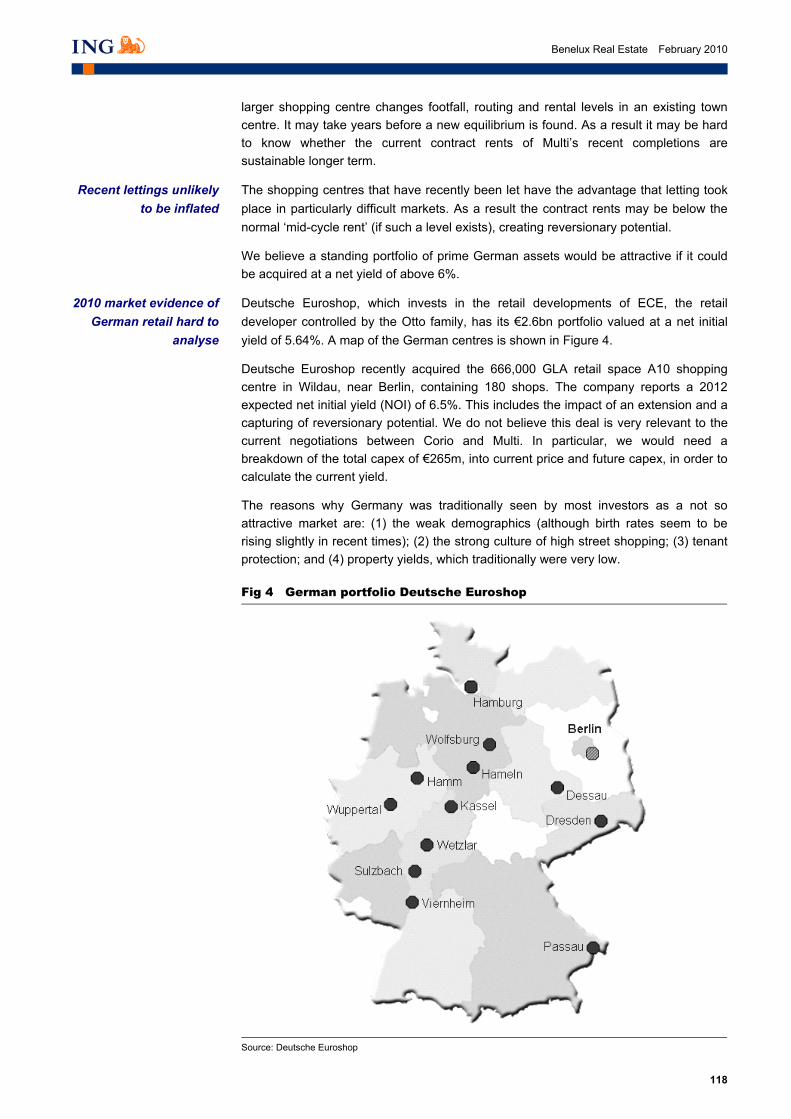
118
Benelux Real Estate February 2010
larger shopping centre changes footfall, routing and rental levels in an existing town centre. It may take years before a new equilibrium is found. As a result it may be hard to know whether the current contract rents of Multi’s recent completions are sustainable longer term.
The shopping centres that have recently been let have the advantage that letting took place in particularly difficult markets. As a result the contract rents may be below the normal ‘mid-cycle rent’ (if such a level exists), creating reversionary potential.
We believe a standing portfolio of prime German assets would be attractive if it could be acquired at a net yield of above 6%.
Deutsche Euroshop, which invests in the retail developments of ECE, the retail developer controlled by the Otto family, has its €2.6bn portfolio valued at a net initial yield of 5.64%. A map of the German centres is shown in Figure 4.
Deutsche Euroshop recently acquired the 666,000 GLA retail space A10 shopping centre in Wildau, near Berlin, containing 180 shops. The company reports a 2012 expected net initial yield (NOI) of 6.5%. This includes the impact of an extension and a capturing of reversionary potential. We do not believe this deal is very relevant to the current negotiations between Corio and Multi. In particular, we would need a breakdown of the total capex of €265m, into current price and future capex, in order to calculate the current yield.
The reasons why Germany was traditionally seen by most investors as a not so attractive market are: (1) the weak demographics (although birth rates seem to be rising slightly in recent times); (2) the strong culture of high street shopping; (3) tenant protection; and (4) property yields, which traditionally were very low.
Fig 4 German portfolio Deutsche Euroshop
Source: Deutsche Euroshop _
Recent lettings unlikely to be inflated
2010 market evidence of German retail hard to
analyse
119
Benelux Real Estate February 2010
One of the attractions of German retail investment is the high barrier to entry, as planning is very strict.
Sensitivity analysis of a potential Multi deal We believe the acquisition impact would be two-fold.
1) Firstly there would be an immediate positive earnings impact as cost of debt would be below yield on property. This would have a positive effect on direct investment result (DIR) per share.
2) Secondly we believe that as the assets would no longer be in the hands of a semi-distressed seller, valuers would adjust the property yield downward. This would have a positive impact on NAV.
1) Earnings impact sensitivity In our analysis we have calculated the impact on recurring EPS or direct investment result (DIR) for a deal size of €600m to €2bn and property portfolio yields of 5.4% to 6.6%. The average cost of debt in 3Q09 dropped to 4.0%. We have calculated the earnings sensitivity using a cost of debt of 4.5% and 5.0%. Our findings are shown in Figures 5 and 6.

120
Benelux Real Estate February 2010
Fig 5 Earnings sensitivity with cost of debt at 5.0% (€ per share)
Deal size (€m) 600 800 1,000 1,200 1,400 1,600 1,800 2,000 6.60 0.13 0.17 0.21 0.25 0.29 0.34 0.38 0.42 6.40 0.11 0.15 0.18 0.22 0.26 0.29 0.33 0.37 6.20 0.09 0.13 0.16 0.19 0.22 0.25 0.28 0.31Yield (%) 6.00 0.08 0.10 0.13 0.16 0.18 0.21 0.24 0.26 5.80 0.06 0.08 0.10 0.13 0.15 0.17 0.19 0.21 5.60 0.05 0.06 0.08 0.09 0.11 0.13 0.14 0.16 5.40 0.03 0.04 0.05 0.06 0.07 0.08 0.09 0.10
Source: ING estimates
_
If Corio does a smaller deal, this is likely to lead to a lower cost of additional debt. Figure 6 illustrates the earnings impact when cost of debt is 4.5%. We believe that if Corio acquires a portfolio of €1.2bn, at a yield of 6.2% and a cost of debt of 4.5%, the recurring impact on earnings would be €0.27 per share (10% of our 2010F EPS of €2.73).
Fig 6 Earnings sensitivity with cost of debt at 4.5% (€ per share)
Deal size (€m) 600 800 1,000 1,200 1,400 1,600 1,800 2,000 6.60 0.16 0.22 0.27 0.33 0.38 0.44 0.49 0.55 6.40 0.15 0.20 0.25 0.30 0.35 0.40 0.45 0.50 6.20 0.13 0.18 0.22 0.27 0.31 0.36 0.40 0.45Yield (%) 6.00 0.12 0.16 0.20 0.24 0.27 0.31 0.35 0.39 5.80 0.10 0.14 0.17 0.20 0.24 0.27 0.31 0.34 5.60 0.09 0.12 0.14 0.17 0.20 0.23 0.26 0.29 5.40 0.07 0.09 0.12 0.14 0.16 0.19 0.21 0.24
Source: ING estimates
_
2) NAV impact sensitivity We believe that valuers will put a non-distressed yield on the portfolio after acquisition and we expect that yield to be below the acquisition yield. Figure 7 shows the impact of this effect on the NAV per share for scenarios of 5bp to 50bp and deal values of between €600m and €2bn. If Corio makes a €1.2bn acquisition on a yield of 6.0% and the valuers lower the yield by 30bp, NAV per share will rise by €0.83. As long as equity is issued around NAV, dilution will be limited.
Fig 7 Impact on NAV per share based on 6.0% property yield for 5-50bp yield adjustment (€)
Deal size (€m) 600 800 1,000 1,200 1,400 1,600 1,800 2,000 5 0.07 0.09 0.11 0.13 0.15 0.18 0.20 0.22 10 0.13 0.18 0.22 0.27 0.31 0.35 0.40 0.44Yield (bp) 20 0.27 0.36 0.45 0.54 0.63 0.72 0.81 0.90 30 0.41 0.55 0.69 0.83 0.96 1.10 1.24 1.38 40 0.56 0.75 0.93 1.12 1.31 1.50 1.68 1.87 50 0.71 0.95 1.19 1.43 1.67 1.90 2.14 2.38
Source: ING estimates
_
Another NAV impact could come from equity issuance. If Corio decides to issue equity below NAV then this will clearly have a dilutive effect. Currently the share price trades above the IFRS NAV. If the share price were to drop significantly, the discount to NAV at which the issue takes place would widen with a negative effect on the NAV per share.

121
Benelux Real Estate February 2010
Financing an acquisition Corio’s current firepower is reported to be €550m. Corio raised €258m this summer in an equity raising. We believe that Corio could easily raise more equity if they are able to explain that Multi is offering its assets at semi-distressed prices.
Figure 8 gives an overview of the capital raising in the real estate sector in the Benelux. The sector raised a total of €832m in nine deals. Corio made the largest deal with its €258m issue in June 2009.
Fig 8 Equity issuance in Benelux real estate sector 2009
Issuer Country Pricing date Size (€m)
Cofinimmo SA/NV Belgium 26 Mar 2009 72Warehouses De Pauw Sicafi – WDP Belgium 1 Apr 2009 20Befimmo SCA Belgium 22 Jun 2009 166Warehouses De Pauw Sicafi – WDP Belgium 26 Jun 2009 76Nieuwe Steen Investments NV Netherlands 2 Jun 2009 39Corio NV Netherlands 4 Jun 2009 258Cofinimmo SA/NV Belgium 9 Jun 2009 26VastNed Retail NV Netherlands 11 Sep 2009 76Eurocommercial Properties NV Netherlands 17 Nov 2009 99Total Benelux 2009 832
Source: ING estimates, Dealogic
_
Outlook Management has stated it will improve its direct investment result modestly. Note this is not a per share statement. Were a deal to actually take place, then it is likely to be immediately earnings enhancing. We expect the property yield of the Multi portfolio to run at above 6% net. In addition, the distressed selling price may be corrected upwards when the assets have stabilised and are in the hands of a non-distressed owner such as Corio.
Corio has repeatedly indicated it wants to sell its French offices. We believe the disposal of the €322m portfolio that is valued at a net yield of 7.7% and almost fully (99.6% at 30 September 2009) occupied, would lead to a loss of earnings of between €8.5m and €5.2m. This is based on the repayment of debt at interest rates of 4.0-5.0%. As a result the disposal would decrease EPS by €0.11-0.16.
Valuation Corio trades just below its recently reported IFRS NAV per share of €44.24 and is slightly more expensive compared to its Continental European peers. The reported so-called EPRA triple net asset value (NNNAV) of €47.21 (-19% YoY) adds back c.85% of the deferred capital gains tax (c.€300m or €c.2.60 per share), that must be deducted in IFRS and it adds back the increase in the market value of the debt, (€0.39 per share), which leads to a lower IFRS NAV. Dividend yield 6.0%, slightly above the Continental European average of 5.5%.
French office disposal will reduce earnings by
€0.11-0.16 per share

122
Benelux Real Estate February 2010
Fig 9 European REIT overview
Company
Share price
(€)
Mkt cap (€m)
Discount to last reported
NAV(%)
Latest reported net yield
(%)
Reference date
Implied net yield (%)
LTV calculated(1)
(%)
Implied LTV(2)
(%)
Prospective dividend
(€)
Div yield
(%)
Netherlands Corio (Buy) 44.25 3,379 -6 6.7 30/06/09 7.0 42.4 41.8 2.64 6.0 Eurocommercial
properties (Buy) 28.81 1,165 -9 5.6 30/06/09 5.9 37.1 44.9 1.82 6.2
VastNed Retail (Buy) 46.61 851 -9 6.7 30/09/09 7.0 28.2 38.8 3.84 8.7 Wereldhave (Buy) 64.96 1,382 -11 6.6 30/09/09 7.1 37.3 30.3 4.70 7.1France Unibail Rodamco (NR) 156.25 1,426 19 6.1 30/06/08 5.5 37.3 33.7 8.31 5.3 Klepierre (NR) 27.10 4,931 3 6.9 30/06/09 6.8 66.3 65.5 1.25 4.6 Mercialys (NR) 24.98 2,297 -5 6.3 30/06/09 6.8 0.6 0.6 1.03 4.1Germany Deutsche Euroshop (NR) 22.41 989 -19 5.6 31/12/08 6.3 42.7 47.6 1.10 4.9Finland Citycon (NR) 3.00 663 -18 6.6 30/09/09 7.1 58.3 62.4 0.14 4.7Italy IGD (NR) 1.51 466 -37 7.5 30/09/09 9.4 66.0 82.9 0.05 3.3
Average -9 6.5 6.9 41.6 44.9 5.5Min -37 5.6 5.5 0.6 0.6 3.3Max 19 7.5 9.4 66.3 82.9 8.7
1 Total net debt divided by total real estate assets, (2) Total net debt divided by real estate portfolio value corrected for discount implied by stock exchange. Pricing date: 5 February 2010 Source: Datastream
_
Consensus The market expects falling earnings from Corio, both in 2009 and 2010, before earnings rise again in 2011. We have not factored in the potential Multi deal in our estimates.
Fig 10 EPS consensus estimates (€)
2008 2009F 2010F 2011F
Consensus 3.08 3.00 2.73 3.01ING 3.08 3.02 2.73 2.79Difference N/A 0.02 0 -0.22Difference (%) N/A 1 0 -7
Source: Reuters, ING Estimates
_
Surprise history
Figure 11 illustrates the size of the deviations of the earnings estimates from the reported number. It increased from 2% for the full year number to 7% on the 3Q number in September 2009. This may be a coincidence or the result of the equity issue in June, which was not included in the numbers for all models.
Fig 11 Surprise history of quarterly earnings (EPS, €)
Dec 2008 Mar 2009 Jun 2009 Sep 2009
Mean consensus 0.744 0.715 0.726 0.735Actual 0.730 0.750 0.767 0.790Difference (0.014) 0.035 0.041 0.055As a percentage (%) -2 5 5 7
Source: Reuters
_
Difference between estimates and reported
EPS widened

123
Benelux Real Estate February 2010
Our estimates and assumptions Our earnings and valuation estimates are based on the following assumptions:
1) We have not factored in any Multi deal. We expect that the earnings impact of a €1bn plus deal may be above €0.20 per share, depending on the entry yield. See our sensitivity analysis elsewhere in the report.
2) We have not factored in the French office disposal. We believe this would decrease 2010F EPS by c.€0.11-0.16.
3) Vacancies will edge up by one percent to 5% in 2010 and then come back down again. We expect the highest vacancy in Spain on the back of the economic situation and its effect on retail sales.
Fig 12 Our vacancy assumptions overview (%)
2009F 2010F 2011F 2012F
Netherlands 1.8 2.0 2.0 1.5France 5.3 6.0 4.0 2.0Italy 0.8 1.0 1.0 1.0Spain 7.1 9.0 7.0 4.0Turkey 8.2 6.0 4.0 2.0
Source: ING estimates
_
4) Other like-for-like rental growth is likely to slow down in 2010 and pick up thereafter. Adjusting for account incentives, renegotiations and re-lettings, we expect Spain to be worst hit in 2009 and 2010.
Fig 13 Our like-for-like rental growth assumptions (%)
2009F 2010F 2011F 2012F
Netherlands 1.8 2.0 3.0 3.0France 3.4 1.0 3.0 3.0Italy 2.7 3.0 3.0 3.0Spain -7.8 -4.0 0.0 3.0Turkey 0.0 0.0 2.0 4.0
Source: ING estimates
_
5) We have only taken the €533m committed developments into account. Development gains are pencilled in at on average 10% of capital expenditure. That means we have not calculated margins over the €251m already spent.
6) Portfolio valuations are assumed to come out at 0.3% in 2010 and 1.7% in 2011. Full details are provided in Figure 14.
Fig 14 Our valuation estimates 2009-12 (%)
2009F 2010F 2011F 2012F
Netherlands -4.6 1.0 2.0 2.0France -6.6 1.0 2.0 2.0Italy -5.7 0.0 1.0 2.0Spain -12.4 -4.0 0.0 2.0Turkey -25.6 0.0 2.0 4.1Other -1.6 0.0 0.0 0.5Total -6.5 0.3 1.7 2.0
Source: ING estimates
_

124
Benelux Real Estate February 2010
Risks to our recommendation Our scenario is not based on a deep second dip in the economy. If such an eventuality were to occur then vacancies would rise further and like-for-like rents might decline further as retailers slow down expansion plans and demand-pull inflation partly disappears.
Our development gains are still positive. That may prove to be too optimistic in certain cases. Factored in development gains are c.€53m or €0.70 per share over the next few years. The net yield on cost, which we estimate to be 7.24%, gives us confidence that we are not too optimistic.
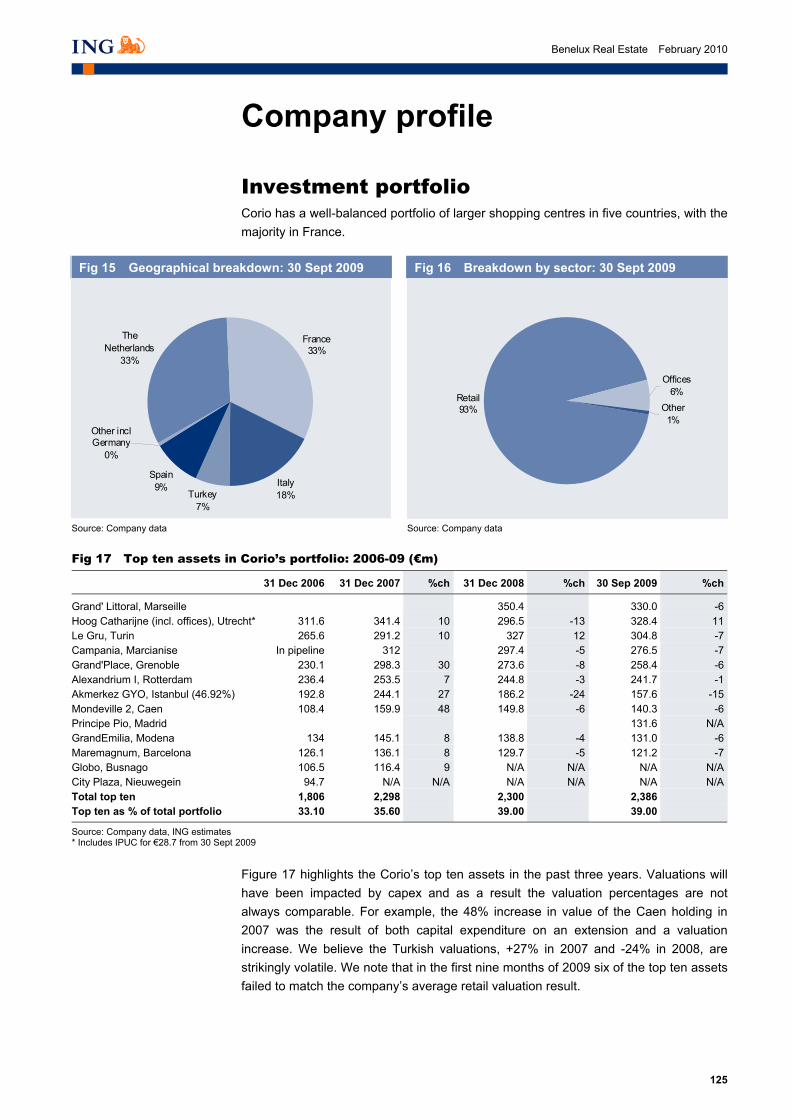
125
Benelux Real Estate February 2010
Company profile
Investment portfolio Corio has a well-balanced portfolio of larger shopping centres in five countries, with the majority in France.
Fig 15 Geographical breakdown: 30 Sept 2009
Fig 16 Breakdown by sector: 30 Sept 2009
The Netherlands
33%
France33%
Italy18%Turkey
7%
Spain9%
Other incl Germany
0%
Retail93%
Offices6%
Other1%
Source: Company data Source: Company data
Fig 17 Top ten assets in Corio’s portfolio: 2006-09 (€m)
31 Dec 2006 31 Dec 2007 %ch 31 Dec 2008 %ch 30 Sep 2009 %ch
Grand' Littoral, Marseille 350.4 330.0 -6Hoog Catharijne (incl. offices), Utrecht* 311.6 341.4 10 296.5 -13 328.4 11Le Gru, Turin 265.6 291.2 10 327 12 304.8 -7Campania, Marcianise In pipeline 312 297.4 -5 276.5 -7Grand'Place, Grenoble 230.1 298.3 30 273.6 -8 258.4 -6Alexandrium I, Rotterdam 236.4 253.5 7 244.8 -3 241.7 -1Akmerkez GYO, Istanbul (46.92%) 192.8 244.1 27 186.2 -24 157.6 -15Mondeville 2, Caen 108.4 159.9 48 149.8 -6 140.3 -6Principe Pio, Madrid 131.6 N/AGrandEmilia, Modena 134 145.1 8 138.8 -4 131.0 -6Maremagnum, Barcelona 126.1 136.1 8 129.7 -5 121.2 -7Globo, Busnago 106.5 116.4 9 N/A N/A N/A N/ACity Plaza, Nieuwegein 94.7 N/A N/A N/A N/A N/A N/ATotal top ten 1,806 2,298 2,300 2,386Top ten as % of total portfolio 33.10 35.60 39.00 39.00
Source: Company data, ING estimates * Includes IPUC for €28.7 from 30 Sept 2009
_
Figure 17 highlights the Corio’s top ten assets in the past three years. Valuations will have been impacted by capex and as a result the valuation percentages are not always comparable. For example, the 48% increase in value of the Caen holding in 2007 was the result of both capital expenditure on an extension and a valuation increase. We believe the Turkish valuations, +27% in 2007 and -24% in 2008, are strikingly volatile. We note that in the first nine months of 2009 six of the top ten assets failed to match the company’s average retail valuation result.
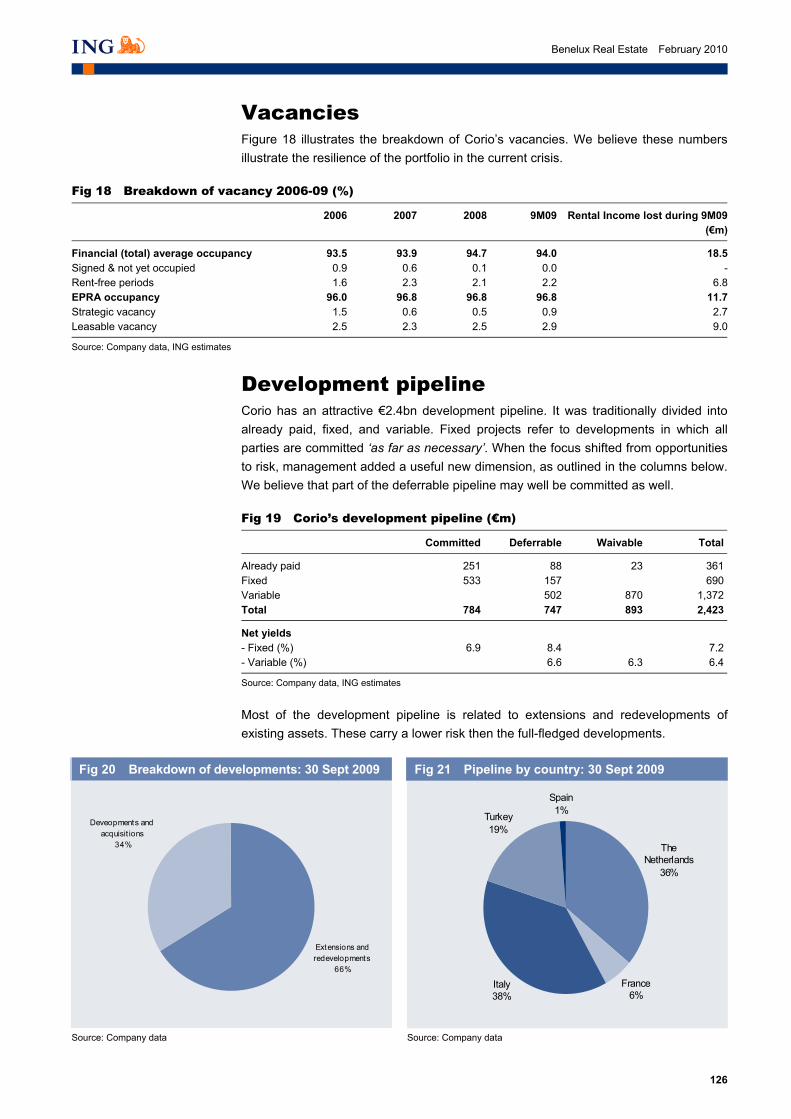
126
Benelux Real Estate February 2010
Vacancies Figure 18 illustrates the breakdown of Corio’s vacancies. We believe these numbers illustrate the resilience of the portfolio in the current crisis.
Fig 18 Breakdown of vacancy 2006-09 (%)
2006 2007 2008 9M09 Rental Income lost during 9M09 (€m)
Financial (total) average occupancy 93.5 93.9 94.7 94.0 18.5 Signed & not yet occupied 0.9 0.6 0.1 0.0 -Rent-free periods 1.6 2.3 2.1 2.2 6.8 EPRA occupancy 96.0 96.8 96.8 96.8 11.7 Strategic vacancy 1.5 0.6 0.5 0.9 2.7 Leasable vacancy 2.5 2.3 2.5 2.9 9.0
Source: Company data, ING estimates
_
Development pipeline Corio has an attractive €2.4bn development pipeline. It was traditionally divided into already paid, fixed, and variable. Fixed projects refer to developments in which all parties are committed ‘as far as necessary’. When the focus shifted from opportunities to risk, management added a useful new dimension, as outlined in the columns below. We believe that part of the deferrable pipeline may well be committed as well.
Fig 19 Corio’s development pipeline (€m)
Committed Deferrable Waivable Total
Already paid 251 88 23 361Fixed 533 157 690Variable 502 870 1,372Total 784 747 893 2,423
Net yields - Fixed (%) 6.9 8.4 7.2- Variable (%) 6.6 6.3 6.4
Source: Company data, ING estimates
_
Most of the development pipeline is related to extensions and redevelopments of existing assets. These carry a lower risk then the full-fledged developments.
Fig 20 Breakdown of developments: 30 Sept 2009
Fig 21 Pipeline by country: 30 Sept 2009
Extensions and redevelopments
66%
Deveopments and acquisit ions
34%
The Netherlands
36%
France6%
Italy38%
Turkey19%
Spain1%
Source: Company data Source: Company data _
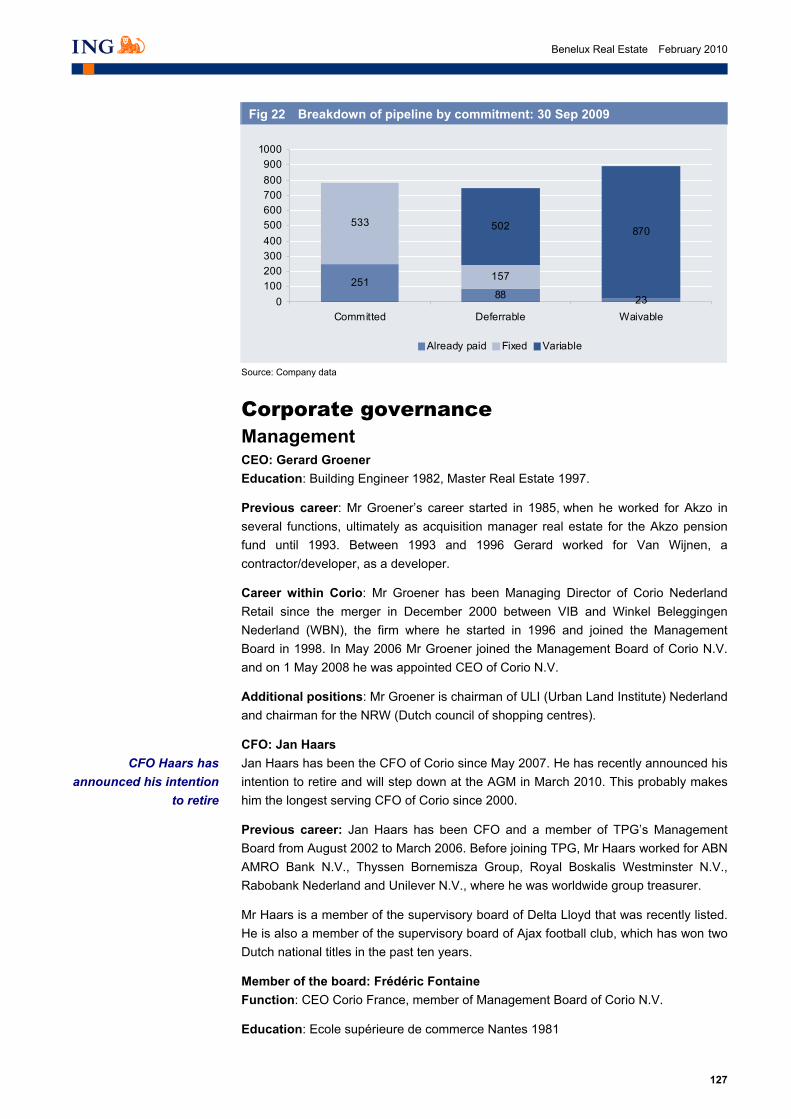
127
Benelux Real Estate February 2010
Fig 22 Breakdown of pipeline by commitment: 30 Sep 2009
25188 23
533
157
502 870
0100200300400500600700800900
1000
Committed Deferrable Waivable
Already paid Fixed Variable
Source: Company data
_
Corporate governance Management CEO: Gerard Groener Education: Building Engineer 1982, Master Real Estate 1997.
Previous career: Mr Groener’s career started in 1985, when he worked for Akzo in several functions, ultimately as acquisition manager real estate for the Akzo pension fund until 1993. Between 1993 and 1996 Gerard worked for Van Wijnen, a contractor/developer, as a developer.
Career within Corio: Mr Groener has been Managing Director of Corio Nederland Retail since the merger in December 2000 between VIB and Winkel Beleggingen Nederland (WBN), the firm where he started in 1996 and joined the Management Board in 1998. In May 2006 Mr Groener joined the Management Board of Corio N.V. and on 1 May 2008 he was appointed CEO of Corio N.V.
Additional positions: Mr Groener is chairman of ULI (Urban Land Institute) Nederland and chairman for the NRW (Dutch council of shopping centres).
CFO: Jan Haars Jan Haars has been the CFO of Corio since May 2007. He has recently announced his intention to retire and will step down at the AGM in March 2010. This probably makes him the longest serving CFO of Corio since 2000.
Previous career: Jan Haars has been CFO and a member of TPG’s Management Board from August 2002 to March 2006. Before joining TPG, Mr Haars worked for ABN AMRO Bank N.V., Thyssen Bornemisza Group, Royal Boskalis Westminster N.V., Rabobank Nederland and Unilever N.V., where he was worldwide group treasurer.
Mr Haars is a member of the supervisory board of Delta Lloyd that was recently listed. He is also a member of the supervisory board of Ajax football club, which has won two Dutch national titles in the past ten years.
Member of the board: Frédéric Fontaine Function: CEO Corio France, member of Management Board of Corio N.V.
Education: Ecole supérieure de commerce Nantes 1981
CFO Haars has announced his intention
to retire

128
Benelux Real Estate February 2010
Previous career: Mr Fontaine started his professional career in France Construction (Bouygues) in 1983. In 1985 he joined COPRA, a multi products developer, where he spent nine years until 1993. In 1994 Mr Fontaine joined Trema where he specialised in retail development. In 1998 he joined Hammerson France in the position of retail development director, where he stayed until May 2003.
Career within Corio: Mr Fontaine was appointed Managing Director of Corio France in May 2003. He joined the Management Board of Corio N.V. in May 2006.
129
Benelux Real Estate February 2010
Financials
Recent 9M09 results IFRS NAV per share came in at €44.24 (-15.2% ytd) and NNNAV was €47.21 (-18.6% YTD). Recurring EPS per share was down €0.07 to €2.29 as a result of the recent €254m net equity issue. Like-for-like rental growth fell to just 1.8% as Spanish rents fell 7.8%, like for like (Netherlands 0.7%, France 7.9%, Italy 2.7%, Turkey N/A). Average occupancy stands at 96.2%, including c.1% tactical vacancy for upgrades etc. 3Q09 valuations were only €17m or below 0.3%. 3Q revaluations were done internally and management has consulted its valuers for input on recent yield movements. Management expects yields to stabilise in the near future in its home countries. We agree with this view for all home countries except Turkey. We trust the internal valuations of Corio. YTD retail valuations are -5.7%.
Net theoretical (with vacant space let at market rents) retail yields now stand at 6.6% up 60bp from 31 Dec 2008 and seem to be close to their peak. In the UK, where the decline started earlier and values have fallen more, yields are falling again. We believe that consumer spending may very well take another hit. Vacancies seem to be fairly stable but we would like to see the spot vacancy numbers and not just the averages.
Corio has good disclosure on its €2.4bn development portfolio, which is divided into three parts: (1) a committed pipeline of €783m with a yield on cost of 6.9%, which seems rather meagre to us in the current market and given Corio’s standing theoretical net yield of 6.6%. A 30bp development margin is not sufficient, but we agree that in particular Hoog Catarijne should be valued at a significantly lower yield than Corio’s average; (2) a deferrable pipeline of €747m at a yield on cost of 8.4% for the fixed part and only 6.6% for the variable part; and (3) a waivable development pipeline of €870m, which is not very valuable in current markets given its 6.3% yield on cost.
Full year results are due out on 18 February 2010 after market close.

130
Benelux Real Estate February 2010
Annual results and forecasts Fig 23 Balance sheet (€m)
2008 2009F 2010F 2011F 2012F 2013F 2014F
Investment property 5,563 5,512 5,529 5,962 6,412 6,535 6,660Investment property under development 248 219 629 429 129 129 129Investments in associates 221 166 168 171 175 178 182Total investment property 6,032 5,898 6,326 6,562 6,716 6,842 6,971Total non-current assets 125 139 139 139 139 139 139Other receivables 241 200 201 219 236 244 251Cash and cash equivalents 11 90 36 31 53 59 62Total current assets 252 290 237 250 288 302 313Assets of discontinued operations 0 0 0 0 0 0 0Total assets 6,409 6,326 6,702 6,950 7,143 7,283 7,423
Shareholders equity-group share 3,459 3,423 3,447 3,536 3,673 3,821 3,979Shareholders equity-minorities 0 34 34 34 34 34 34Total shareholders equity 3,459 3,457 3,481 3,570 3,707 3,855 4,013Interest-bearing long-term loans and borrowings 2,363 2,347 2,700 2,850 2,900 2,900 2,890Employee benefits 1 1 1 1 1 1 1Provisions 2 3 3 3 3 3 3Deferred tax liabilities 288 250 248 234 216 198 179Financial lease 0 1 1 1 1 1 1Total non-current liabilities 2,654 2,601 2,952 3,088 3,120 3,102 3,073Interest-bearing short-term loans and borrowings 97 3 3 3 4 4 4Other payables 199 265 266 290 312 323 333Total current liabilities 296 268 269 293 316 326 337Liabilities of discontinued operations 0 0 0 0 0 0 0Total liabilities 2,950 2,869 3,221 3,381 3,436 3,428 3,409Total equity and liabilities 6,409 6,326 6,702 6,950 7,143 7,283 7,423
Source: Company data, ING estimates _
Fig 24 Profit and loss (€m)
2008 2009F 2010F 2011F 2012F 2013F 2014F
Gross rental income 365 391 400 422 464 482 497Property operating expenses (47) (54) (56) (60) (68) (70) (73)Net rental income 318 337 345 362 397 411 424Administrative expenses (30) (36) (36) (38) (42) (43) (45)Operating income 288 301 309 324 355 368 379Share of profit of associates (direct) 15 9 7 7 7 7 8EBIT continuing operations 303 310 315 331 362 375 387Operating income discontinued operations 29 0 0 0 0 0 0EBIT 331 310 315 331 362 375 387Net financing expenses (127) (95) (106) (117) (120) (121) (120)Corporate income tax 0 3 0 0 0 0 0Direct result 204 218 209 214 241 254 266Minority share (direct) 0 0 0 0 0 1 1Direct result (excluding minority share) 204 218 208 213 241 254 266
Net valuation on investment property (337) (359) 17 91 120 123 126Profit on disposal of investment property (3) 0 0 0 0 0 0Share of profit of associates (indirect) (97) (15) 2 3 3 4 4Deferred tax expense 22 63 (3) (14) (18) (18) (19)Net other income (13) 0 0 0 0 0 0Indirect result continuing operations (428) (311) 16 81 106 108 110Indirect result discontinued operations (16) 0 0 0 0 0 0Indirect result (444) (311) 16 81 106 108 110Minority share (indirect) 0 (3) 0 1 1 1 1Indirect results (excluding minority share) (444) (309) 16 80 105 107 109Net profit (including minority) (240) (93) 225 295 347 362 377Net profit (excluding minority) (240) (91) 224 294 346 361 375
Source: Company data, ING estimates
_
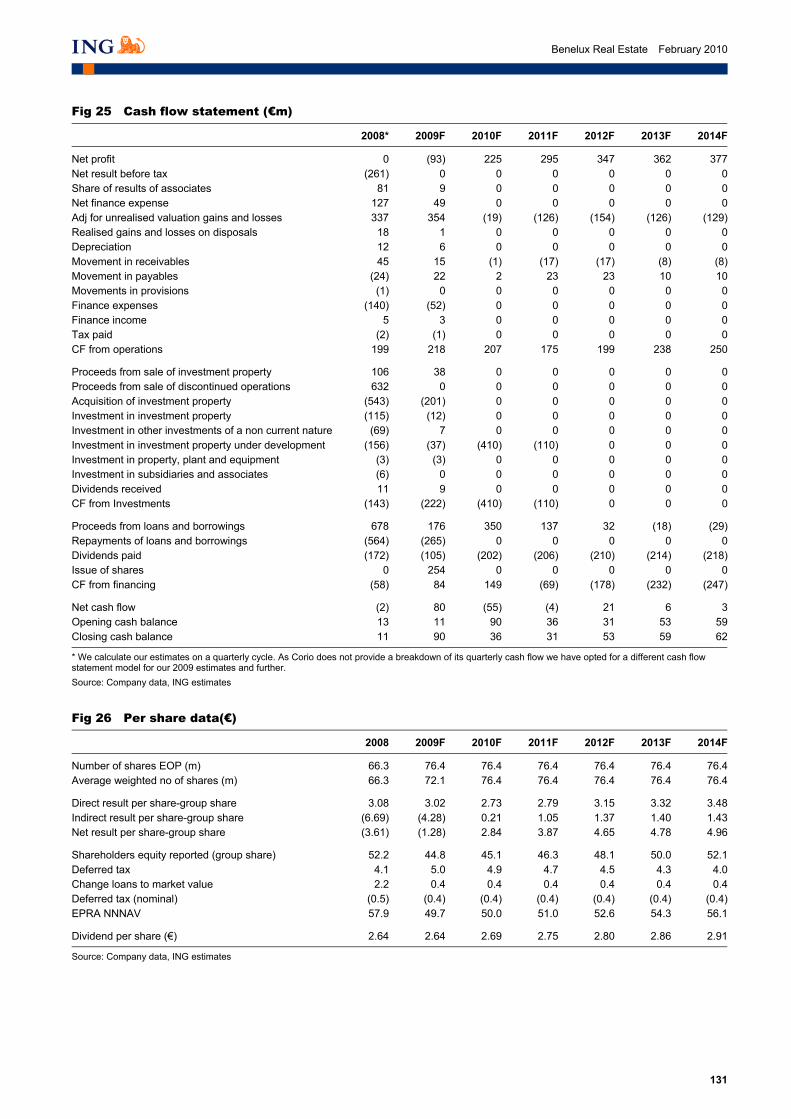
131
Benelux Real Estate February 2010
Fig 25 Cash flow statement (€m)
2008* 2009F 2010F 2011F 2012F 2013F 2014F
Net profit 0 (93) 225 295 347 362 377Net result before tax (261) 0 0 0 0 0 0Share of results of associates 81 9 0 0 0 0 0Net finance expense 127 49 0 0 0 0 0Adj for unrealised valuation gains and losses 337 354 (19) (126) (154) (126) (129)Realised gains and losses on disposals 18 1 0 0 0 0 0Depreciation 12 6 0 0 0 0 0Movement in receivables 45 15 (1) (17) (17) (8) (8)Movement in payables (24) 22 2 23 23 10 10Movements in provisions (1) 0 0 0 0 0 0Finance expenses (140) (52) 0 0 0 0 0Finance income 5 3 0 0 0 0 0Tax paid (2) (1) 0 0 0 0 0CF from operations 199 218 207 175 199 238 250
Proceeds from sale of investment property 106 38 0 0 0 0 0Proceeds from sale of discontinued operations 632 0 0 0 0 0 0Acquisition of investment property (543) (201) 0 0 0 0 0Investment in investment property (115) (12) 0 0 0 0 0Investment in other investments of a non current nature (69) 7 0 0 0 0 0Investment in investment property under development (156) (37) (410) (110) 0 0 0Investment in property, plant and equipment (3) (3) 0 0 0 0 0Investment in subsidiaries and associates (6) 0 0 0 0 0 0Dividends received 11 9 0 0 0 0 0CF from Investments (143) (222) (410) (110) 0 0 0
Proceeds from loans and borrowings 678 176 350 137 32 (18) (29)Repayments of loans and borrowings (564) (265) 0 0 0 0 0Dividends paid (172) (105) (202) (206) (210) (214) (218)Issue of shares 0 254 0 0 0 0 0CF from financing (58) 84 149 (69) (178) (232) (247)
Net cash flow (2) 80 (55) (4) 21 6 3Opening cash balance 13 11 90 36 31 53 59Closing cash balance 11 90 36 31 53 59 62
* We calculate our estimates on a quarterly cycle. As Corio does not provide a breakdown of its quarterly cash flow we have opted for a different cash flow statement model for our 2009 estimates and further. Source: Company data, ING estimates
_
Fig 26 Per share data(€)
2008 2009F 2010F 2011F 2012F 2013F 2014F
Number of shares EOP (m) 66.3 76.4 76.4 76.4 76.4 76.4 76.4Average weighted no of shares (m) 66.3 72.1 76.4 76.4 76.4 76.4 76.4
Direct result per share-group share 3.08 3.02 2.73 2.79 3.15 3.32 3.48Indirect result per share-group share (6.69) (4.28) 0.21 1.05 1.37 1.40 1.43Net result per share-group share (3.61) (1.28) 2.84 3.87 4.65 4.78 4.96
Shareholders equity reported (group share) 52.2 44.8 45.1 46.3 48.1 50.0 52.1Deferred tax 4.1 5.0 4.9 4.7 4.5 4.3 4.0Change loans to market value 2.2 0.4 0.4 0.4 0.4 0.4 0.4Deferred tax (nominal) (0.5) (0.4) (0.4) (0.4) (0.4) (0.4) (0.4)EPRA NNNAV 57.9 49.7 50.0 51.0 52.6 54.3 56.1
Dividend per share (€) 2.64 2.64 2.69 2.75 2.80 2.86 2.91
Source: Company data, ING estimates
_

132
Benelux Real Estate February 2010
Fig 27 Quarterly profit and loss (€m)
4Q08 1Q09 2Q09 3Q09 4Q09F 1Q10F 2Q10F 3Q10F 4Q10F
Gross rental income 109 96 95 100 100 100 100 100 101Property operating expenses (12) (14) (13) (14) (14) (14) (14) (14) (14)Net rental income 98 82 83 86 86 86 86 86 87Administrative expenses (8) (10) (9) (8) (9) (9) (9) (9) (9)Operating income 90 72 74 78 77 77 77 77 77Share of profit of associates (direct) 4 2 3 2 2 2 2 2 2EBIT continuing operations 93 74 77 80 79 78 79 79 79Operating income discontinued operations (15) 0 0 0 0 0 0 0 0EBIT 78 74 77 80 79 78 79 79 79Interest income 0 0 0 0 0 0 0 0 0Interest expense 0 0 0 0 0 0 0 0 0Interest capitalized 0 0 0 0 0 0 0 0 0Net financing expenses (31) (22) (27) (23) (23) (24) (26) (28) (28)Corporate income tax 1 0 0 4 0 0 0 0 0Direct result 48 52 50 61 56 54 53 51 51Minority share (direct) 0 0 0 0 0 0 0 0 0Direct result (excluding minority share) 48 52 50 60 56 54 52 51 51
Net valuation on investment property (274) (171) (170) (16) (12) (10) (10) 18 18Profit on disposal of investment property (3) (1) 0 (1) 0 0 0 0 0Share of profit of associates (indirect) (73) (15) 0 0 0 0 0 1 1Deferred tax expense 24 43 17 1 2 1 1 (3) (3)Net other income (18) 0 (3) (1) 0 0 0 0 0Indirect result continuing operations (346) (143) (156) (17) (11) (8) (8) 16 16Indirect result discontinued operations 26 0 0 0 0 0 0 0 0Indirect result (320) (143) (156) (17) (11) (8) (8) 16 16Minority share (indirect) 0 0 (2) (1) 0 0 0 0 0Indirect results (excluding minority share) (320) (143) (155) (16) (11) (8) (8) 16 16Net profit (including minority) (272) (91) (107) 44 45 46 44 67 67Net profit (excluding minority) (272) (91) (105) 45 45 46 44 67 67
Source: Company data, ING estimates
_

133
Benelux Real Estate February 2010
Fig 28 Quarterly cash flow statement (€m)
4Q08 1Q09 2Q09 3Q09 4Q09F 1Q10F 2Q10F 3Q10F 4Q10F
Net profit 0 0 0 0 45 46 44 67 67Net result before tax 0 0 0 0 0 0 0 0 0Share of results of associates 0 0 0 0 0 0 0 0 0Net finance expense 0 0 0 0 0 0 0 0 0Adj for unrealised valuation gains and losses 0 0 0 0 13 10 10 (19) (19)Realised gains and losses on disposals 0 0 0 0 0 0 0 0 0Depreciation 0 0 0 0 0 0 0 0 0Movement in receivables 0 0 0 0 5 0 (1) (1) (1)Movement in payables 0 0 0 0 (1) (1) 1 1 1Movements in provisions 0 0 0 0 0 0 0 0 0Finance expenses 0 0 0 0 0 0 0 0 0Finance income 0 0 0 0 0 0 0 0 0Tax paid 0 0 0 0 0 0 0 0 0CF from operations 0 67 0 0 62 56 54 49 48
Proceeds from sale of investment property 0 0 0 0 0 0 0 0 0Proceeds from sale of discontinued operations 0 0 0 0 0 0 0 0 0Acquisition of investment property 0 0 0 0 0 0 0 0 0Investment in investment property 0 0 0 0 0 0 0 0 0Investment in other investments of a non current nature 0 0 0 0 0 0 0 0 0Investment in investment property under development 0 0 0 0 0 (150) (110) (110) (40)Investment in property, plant and equipment 0 0 0 0 0 0 0 0 0Investment in subsidiaries and associates 0 0 0 0 0 0 0 0 0Dividends received 0 0 0 0 0 0 0 0 0CF from Investments 0 (77) 0 0 0 (150) (110) (110) (40)
Proceeds from loans and borrowings 0 0 0 0 2 54 251 47 (3)Repayments of loans and borrowings 0 0 0 0 0 0 0 0 0Dividends paid 0 0 0 0 0 0 (202) 0 0Issue of shares 0 0 0 0 0 0 0 0 0CF from financing 0 0 0 0 2 54 50 47 (3)
Net cash flow 0 (10) 0 0 64 (40) (6) (14) 6Opening cash balance 0 11 0 0 27 90 50 44 30Closing cash balance 0 1 0 0 90 50 44 30 36
Note: Corio does not disclose detailed quarterly cash flow statement figures, hence the missing figures in the historical period. Source: Company data, ING estimates
_
Fig 29 Quarterly per share data (€m)
4Q08 1Q09 2Q09 3Q09 4Q09F 1Q10F 2Q10F 3Q10F 4Q10F
Number of shares EOP (m) 66.3 66.3 66.3 76.4 76.4 76.4 76.4 76.4 76.4Average weighted no of shares (m) 66.3 66.3 69.2 76.4 76.4 76.4 76.4 76.4 76.4
Direct result per share-group share (€) 0.73 0.79 0.71 0.79 0.73 0.71 0.69 0.67 0.67Indirect result per share-group share (€) (4.83) (2.16) (2.23) (0.21) (0.14) (0.11) (0.11) 0.21 0.21Net result per share-group share (€) (4.10) (1.38) (1.51) 0.58 0.59 0.60 0.58 0.88 0.88
Shareholders equity reported (group share) 52.2 50.2 0.0 44.2 44.8 45.4 43.3 44.2 45.1Deferred tax 4.1 4.0 0.0 3.0 3.0 5.0 5.0 5.0 4.9Change loans to market value 2.2 2.7 0.0 0.4 0.4 0.4 0.4 0.4 0.4Deferred tax (nominal) (0.5) (0.5) 0.0 (0.4) (0.4) (0.4) (0.4) (0.4) (0.4)EPRA NNNAV 57.9 56.5 0.0 47.2 47.8 50.4 48.3 49.2 50.0
Dividend per share (€) 0 0 2.64 0 0 0 2.64 0 0
Source: Company data, ING estimates
_

134
Benelux Real Estate February 2010
Fig 30 Multi development completions in the Netherlands
Project name City Country GLA offices GLA shopping GLA other No of houses Completion
Beverwaard Rotterdam Netherlands 5,500 1/1/84Zevenkamp Rotterdam Netherlands 9,000 111 1/2/93Bloeijendaal Utrecht Netherlands 10,000 1/2/93Lambertushof Hengelo Netherlands 1,100 1/2/93Osdorpplein Amsterdam Netherlands 4,000 56 1/3/93Paradijs Hoofddorp Netherlands 5,000 56 1/1/94Kopspijker Spijkenisse Netherlands 5,300 80 1/2/94Jacobsweerd Utrecht Netherlands 16,000 1/2/94Johan de Witt Den Haag Netherlands 14,000 1/2/94Multi Veste Gouda Netherlands 5,500 1/1/95Toshiba Gouda Netherlands 4,800 1/2/95Circus Almere Netherlands 6,700 1/2/95NDU Oosterflank Rotterdam Netherlands 18,500 1/7/96Middenhoven Amstelveen Netherlands 3,300 1/7/96Vitel Gouda Netherlands 5,100 1/7/96Achterveld IJsselstein Netherlands 2,000 39 1/9/96KPMG Den Haag Netherlands 15,000 8,000 1/9/96DDD Rotterdam Netherlands 12,500 7,100 1/9/96de Breul oudbouw Zeist Netherlands 2,200 1/9/96Westerhage Breda Netherlands 3,450 1/10/96T+T Rijnsweerd Utrecht Netherlands 10,000 5,900 1/10/96Zwarts Utrecht Netherlands 6,400 3,900 1/8/97Piazza Gouda Netherlands 5,300 3,500 1/9/97de Coener Amsterdam Netherlands 6,500 2,500 1/9/97Westblaak Rotterdam Netherlands 8,400 2,900 1/10/97de Ster Rotterdam Netherlands 12,500 6,100 1/10/97Plaza Rotterdam Netherlands 26,000 3,400 11,700 102 1/3/98Terminal Den Haag Netherlands 18,500 5,900 1/9/98Haagse Arc Den Haag Netherlands 22,500 9,000 1/9/98Rokkeveen I Zoetermeer Netherlands 3,900 76 1/9/99Tandem Hoofddorp Netherlands 10,000 3,600 1/10/99Compaq Gouda Netherlands 4,300 1,800 1/10/99Dam Utrecht Netherlands 7,700 1,000 1/11/99Bonnema Utrecht Netherlands 4,700 1/2/00Goverwelle Gouda Netherlands 6,200 84 1/3/00Rokkeveen II Zoetermeer Netherlands 4,000 77 1/3/00Almericain Almere Netherlands 3,130 12 1/4/00de Breul nieuwbouw Zeist Netherlands 12,000 8,000 1/6/00AH Hoofdkantoor Zaandam Netherlands 40,000 10,800 1/7/00Pal. v Justitie Den Haag Netherlands 22,000 1,230 1/10/00WC de Vlinder Emmen Netherlands 10,500 10 1/3/01Beursplein Rotterdam Netherlands 30,000 7,000 104 1/3/01Roodbeen Rijnsweerd Utrecht Netherlands 7,600 1/8/01Stadshart/Liesveld Vlaardingen Netherlands 11,900 24 1/8/01Utrechtsebaan Den Haag Netherlands 18,300 6,800 1/9/01Arthur Andersen Amstelveen Netherlands 7,400 1,900 1/10/01V&D Beursplein Rotterdam Netherlands 30,000 1/10/01Bruggebouw A Den Haag Netherlands 7,100 1/12/01Adelheidstraat Den Haag Netherlands 37 1/6/02Kalvertoren Amsterdam Netherlands 750 13,000 3,300 26 1/7/02Douanekantoor Rotterdam Netherlands 5,100 1/9/02Stationsplein Den Bosch Netherlands 5,700 1,600 2,000 16 1/9/02Loeffplein Den Bosch Netherlands 13,500 6,500 40 1/9/02Iglo / Ola Den Bosch Netherlands 5,700 1,200 1/1/03In de Boogaard Rijswijk Netherlands 700 3,500 7,000 36 1/4/03NIKE Hoofdkantoor Hilversum Netherlands 36,000 8,800 1/4/03Bruggebouw B Den Haag Netherlands 11,700 2,900 1/4/03Arthur Andersen Amstelveen Netherlands 6,500 1/5/03Stadshart St. Jorisplein Amersfoort Netherlands 15,500 9,000 70 1/9/03Blaak Rotterdam Netherlands 22,000 1/1/04Maanplein Den Haag Netherlands 95,000 34,000 1/2/04

135
Benelux Real Estate February 2010
Fig 30 Multi development completions in the Netherlands (cont’d)
Project name City Country GLA offices GLA shopping GLA other No of houses Completion
Lampenier Den Bosch Netherlands 1,500 18 1/3/04Origin Groningen Netherlands 5,000 1/4/04SVB/EDS Utrecht Netherlands 21,000 2,300 1/6/04Origin Rijswijk Netherlands 11,500 2,400 1/7/04Statenplein Dordrecht Netherlands 10,000 29 1/9/04AXA Utrecht Netherlands 32,000 3,400 1/9/04Schaerweijderbossen Zeist Netherlands 59 1/10/04Kolfstraatblok Dordrecht Netherlands 3,400 8 1/3/05Van Heekplein Enschede Netherlands 10,350 10,300 31 1/7/05A10 Bridgebuilding North Amsterdam Netherlands 8,500 600 2,200 1/8/05Papendorp Origin Utrecht Netherlands 41,300 15,000 1/9/05Cap Gemini Utrecht Netherlands 50,000 31,800 1/9/05IBM Amsterdam Netherlands 34,000 6,000 1/10/05Trade Parc Westland Naaldwijk Netherlands 5,900 1/11/05HP Papendorp Utrecht Netherlands 38,700 21,100 1/4/06Gulden Winckelplantsoen Amsterdam Netherlands 11,800 12,000 1/4/06A10 overbouwing Zuid Amsterdam Netherlands 11,500 2,700 1/5/06Inter Access Hilversum Netherlands 11,200 2,500 1/6/06Boompjes Kantoortoren Rotterdam Netherlands 16,300 1/6/06Boompjes Parkeergarage Rotterdam Netherlands 1/8/06Ren. E&Y M. Meesweg Rotterdam Netherlands 8,500 25/9/06Spuimarkt Den Haag Netherlands 2,000 79 1/10/06Musiskwartier Arnhem Netherlands 21,700 75 1/10/06Hoochwoert Woerden Netherlands 8,201 86 1/11/06Entre Deux Maastricht Netherlands 11,800 19 1/11/06Brouwershof Offices Amersfoort Netherlands 14,250 1/11/06Entreegebouw A Arena Hilversum Netherlands 7,300 182 1/12/06Computer Associates Utrecht Netherlands 3,250 1/2/07KPN Papendorp Utrecht Netherlands 14,500 1/2/07De Leesten Zutphen Netherlands 3,100 58 1/3/07Spuimarkt Levi Lasse, C&A Den Haag Netherlands 21,400 1/5/07Veranda 16/17 Rotterdam Netherlands 5,000 1/9/07Centrumplan Hardenberg Hardenberg Netherlands 9,000 113 1/9/07Amstelwijck Looije Dordrecht Netherlands 3,000 1/9/07BDU gebouw Barneveld Netherlands 1,000 1/9/07Brouwershof Hotel Amersfoort Netherlands 6,100 1/10/07Cegelec Dordrecht Netherlands 3,800 1/10/07Veranda 14/15 Rotterdam Netherlands 4,000 1/10/07Amstelwijck Delta Dordrecht Netherlands 4,200 1/11/07
Source: ING Research, Multi development
_

136
Benelux Real Estate February 2010
Fig 31 Multi development completions outside of the Netherlands
Project name City Country GLA offices GLA shopping GLA other No of houses Completion
Victoria Square Belfast United Kingdom 54,000 10,000 106 Feb-84Forum Bornova Izmir Turkey 58,600 3,200 Jan-85Forum Mersin Mersin Turkey 68,000 3,300 Feb-85Forum Camlik Denizli Turkey 27,500 4,500 Jan-86Forum Trabzon Trabzon Turkey 46,000 3,000 Feb-86Forum Ankara Ankara Turkey 48,000 31,000 Jan-87Forum Aydin Aydin Turkey 24,000 5,100 Jan-88Expo Sevilla Sevilla Spain Pavillion Feb-88Forum Leon Leon Spain 37,000 34,000 Mar-88Forum Girones Gerona Spain 39,900 47,800 Jan-89Espacio Torrelodones Madrid Spain 32,000 2,000 Feb-89Espacio Mediterraneo Cartagena Spain 29,500 8,500 Mar-89Espacio Buenavista Oviedo Spain 36,000 3,000 Apr-89Miraflores 1 / Arquiparque Lissabon Portugal 5,342 2,903 May-89Miraflores 3 / Arquiparque Lissabon Portugal 7,585 4,450 Jan-90Miraflores 8 / Arquiparque Lissabon Portugal 5,342 2,877 Feb-90Miraflores 2 / Arquiparque Lissabon Portugal 3,528 250 2,300 Mar-90Miraflores 4 / Arquiparque Lissabon Portugal 7,325 3,291 Apr-90Miraflores 9 / Arquiparque Lissabon Portugal 5,268 536 3,323 May-90Forum Aveiro Aveiro Portugal 700 18,220 30,000 56 Jan-91Miraflores 5 / Arquiparque Lissabon Portugal 11,800 3,300 Feb-91Chiado Lissabon Portugal 2,000 12,000 4,000 Mar-91Forum Algarve Faro Portugal 33,000 6,600 Apr-91Almada Lissabon Portugal 78,800 127,000 May-91Coimbra Retail Park Coimbra Portugal 25,000 Jan-92Forum Montijo Montijo Portugal 58,000 105,000 Feb-92Forum Madeira Madeira Portugal 19,700 23,000 Feb-92Forum Viseu Viseu Portugal 20,000 Mar-92Forum Coimbra Coimbra Portugal 900 30,000 5,000 Apr-92Forum Castelo Branco Castelo Branco Portugal 10,000 3,400 May-92Media Markt Gaia Portugal 6,000 Jun-92Forum Barreiro Barreiro Portugal 16,000 1,300 Jul-92Arquiparque II- building A Lisbon Portugal 4,800 350 Jan-93Forum Koszalin Koszalin Poland 49,000 5,000 Feb-93I Petali Di Reggio Reggio Emilia Italy 3,000 14,300 12,000 Mar-08Retail Parc Mestre Mestre Italy 9,500 800 Mar-08Kennedypark Dusseldorf Germany 14,100 5,900 Mar-08Clemens Galerien Solingen Germany 7,500 15,800 19,000 Apr-08Neutor Bocholt Germany 6,000 8,700 1,300 Apr-08Volme Galerie am Rathaus Hagen Germany 15,000 30,000 16,000 May-08Kamp Promenade Osnabruck Germany 2,300 13,400 5,000 Jun-08Schlossel Galerie Pforzheim Germany 2,400 17,500 Jun-08Liliencarre Wiesbaden Germany 3,500 23,600 3,279 Sep-08Forum Duisburg Duisburg Germany 800 56,000 1,700 Sep-08Les Quatre Chemins Vichy France 14,000 13,500 42 Sep-08La Vache Noire Arcueil France 35,900 4,000 Oct-08Plzn Phase II Plzen Czech Republic 8,000 Oct-08Olympia Plzen Czech Rep 32,400 Nov-08Olympia Olomouc Czech Rep 30,000 Nov-08Chodov Prague Czech Rep 52,800 Dec-08Parking Martinus Genk Belgium 5,900 Dec-08Abdijstraat Antwerp Belgium 13,100 8,500 Dec-08Multifunctioneel Centrum Oostende Belgium 16,500 Jan-09Stadsfeestzaal Antwerp Belgium 19,000 23 Sep-09
Source: ING Research, Multi development
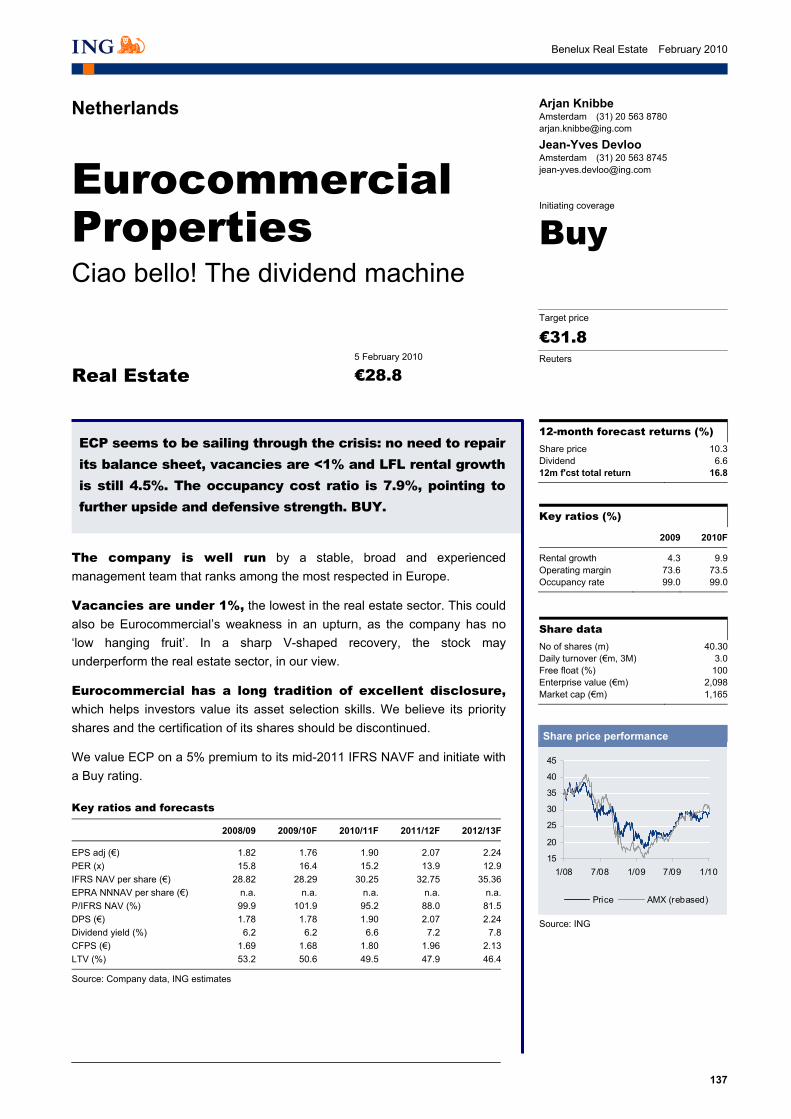
137
Benelux Real Estate February 2010
Netherlands
Eurocommercial Properties Ciao bello! The dividend machine
Key ratios (%)
2009 2010F
Rental growth 4.3 9.9Operating margin 73.6 73.5Occupancy rate 99.0 99.0
Share data No of shares (m) 40.30Daily turnover (€m, 3M) 3.0Free float (%) 100Enterprise value (€m) 2,098 Market cap (€m) 1,165
12-month forecast returns (%) Share price 10.3Dividend 6.612m f'cst total return 16.8
Share price performance
15
20
25
30
35
40
45
1/08 7/08 1/09 7/09 1/10
Price AMX (rebased)
Source: ING
ECP seems to be sailing through the crisis: no need to repair its balance sheet, vacancies are <1% and LFL rental growth is still 4.5%. The occupancy cost ratio is 7.9%, pointing to further upside and defensive strength. BUY.
Initiating coverage
€28.85 February 2010
Buy
Real Estate
€31.8 Target price
Reuters
Arjan Knibbe Amsterdam (31) 20 563 8780 [email protected]
Jean-Yves Devloo Amsterdam (31) 20 563 8745 [email protected]
The company is well run by a stable, broad and experienced management team that ranks among the most respected in Europe.
Vacancies are under 1%, the lowest in the real estate sector. This could also be Eurocommercial’s weakness in an upturn, as the company has no ‘low hanging fruit’. In a sharp V-shaped recovery, the stock may underperform the real estate sector, in our view.
Eurocommercial has a long tradition of excellent disclosure, which helps investors value its asset selection skills. We believe its priority shares and the certification of its shares should be discontinued.
We value ECP on a 5% premium to its mid-2011 IFRS NAVF and initiate with a Buy rating.
Key ratios and forecasts
2008/09 2009/10F 2010/11F 2011/12F 2012/13F
EPS adj (€) 1.82 1.76 1.90 2.07 2.24PER (x) 15.8 16.4 15.2 13.9 12.9IFRS NAV per share (€) 28.82 28.29 30.25 32.75 35.36EPRA NNNAV per share (€) n.a. n.a. n.a. n.a. n.a.P/IFRS NAV (%) 99.9 101.9 95.2 88.0 81.5DPS (€) 1.78 1.78 1.90 2.07 2.24Dividend yield (%) 6.2 6.2 6.6 7.2 7.8CFPS (€) 1.69 1.68 1.80 1.96 2.13LTV (%) 53.2 50.6 49.5 47.9 46.4
Source: Company data, ING estimates _

138
Benelux Real Estate February 2010
Investment case
Eurocommercial is a retail property company with a strong focus on medium-sized and large shopping centres in France, Italy and Sweden. The asset selection process of Eurocommercial has often struck us as slightly more detailed and refined than that of its peers, perhaps because of its long tradition of excellent disclosure. Eurocommercial has no greenfield developments and focuses on extensions. The portfolio has tripled in ten years through acquisitions, extensions and valuation results to its current value of €2.3bn. Focus has been sharpened from a 74% retail weighting to 100% in 2009.
Highlights At Eurocommercial, investors can still see the rent yield and valuation result per asset. We would appreciate a return to this disclosure at all property companies. Such openness, and the quality of the assets (that can be checked), is rewarded by investors by a premium for the shares.
One of the recurrent themes of management is its apparent obsession with occupancy cost ratios. These low percentages are often brought forward when new markets including the UK are discussed. Wereldhave, which has recently chosen to go to UK retail from a virtual zero weighting in the past, may want to double-check those ratios at the UK retail assets it is eyeing.
Fig 1 Occupancy cost ratios and reversionary potential (%)
Occupancy cost ratios Reversionary potential
France 7.6 8Italy 8.2 5Sweden 7.6 1Total 7.9
Source: Company data
_
If ECP included hypermarkets, occupancy costs would fall to 7.2%. The occupancy cost ratios in Figure 1 are not comparable with the 11.3% that was reported by Unibail-Rodamco at its 1H results. The ECP number excludes hypermarkets, whereas Unibail-Rodamco includes hypermarkets and supermarkets, which have a lower occupancy cost ratio than the boutiques in the Eurocommercial results. Unibail has also included cinemas, fitness centres, supermarkets and department stores, but it excludes banks, pharmacies, travel agencies and tobacco stores. Eurocommercial has also excluded these tenants.
Eurocommercial has raised its dividend per share for ten years in a row, and EPS has grown from €1.31 to 1.82 in the past ten years. These are impressive numbers, in our opinion. We think that even when there is a temporary dip in recurring EPS in the current book year, Eurocommercial will maintain its dividend per share.
We believe that the secret behind this lies in the combination of sound and stable financial management, and a thorough asset selection and extension process. This management team has done an excellent job. Quarterly cash flow statements are normal procedure.
Apparent obsession with occupancy cost
rates
Ten DPS rises in a row
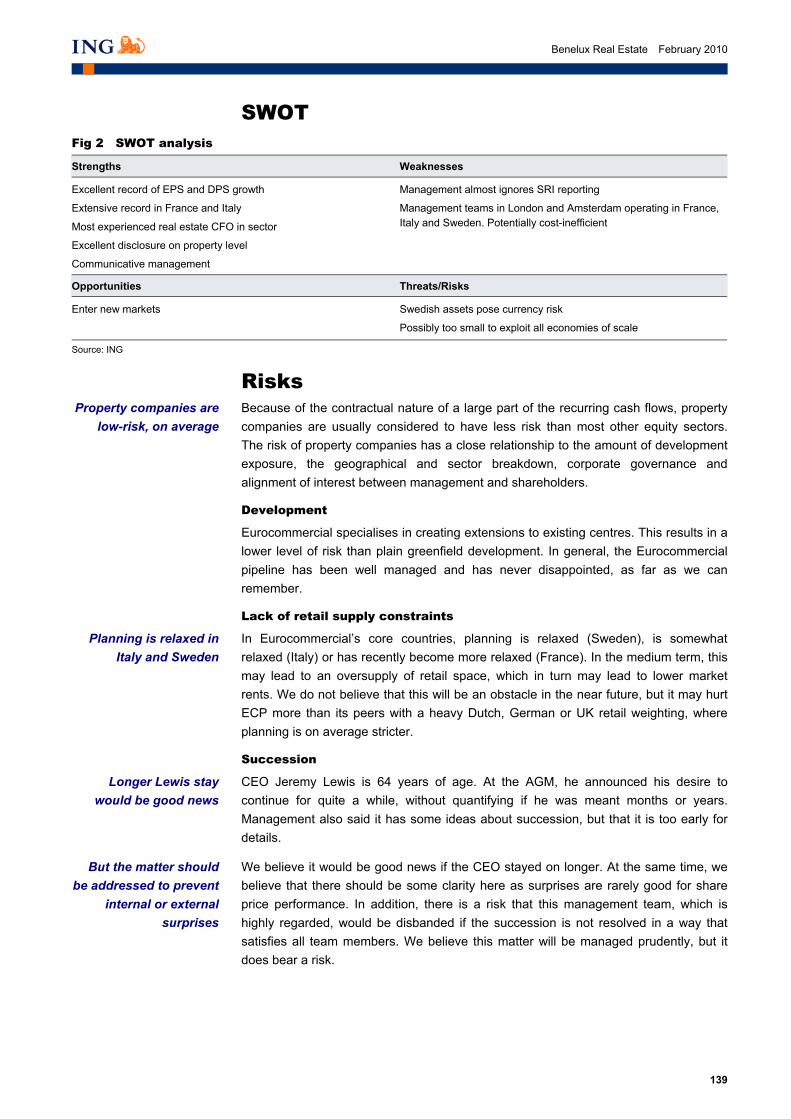
139
Benelux Real Estate February 2010
SWOT Fig 2 SWOT analysis
Strengths Weaknesses
Excellent record of EPS and DPS growth
Extensive record in France and Italy
Most experienced real estate CFO in sector
Excellent disclosure on property level
Communicative management
Management almost ignores SRI reporting
Management teams in London and Amsterdam operating in France, Italy and Sweden. Potentially cost-inefficient
Opportunities Threats/Risks
Enter new markets Swedish assets pose currency risk
Possibly too small to exploit all economies of scale
Source: ING _
Risks Because of the contractual nature of a large part of the recurring cash flows, property companies are usually considered to have less risk than most other equity sectors. The risk of property companies has a close relationship to the amount of development exposure, the geographical and sector breakdown, corporate governance and alignment of interest between management and shareholders.
Development
Eurocommercial specialises in creating extensions to existing centres. This results in a lower level of risk than plain greenfield development. In general, the Eurocommercial pipeline has been well managed and has never disappointed, as far as we can remember.
Lack of retail supply constraints
In Eurocommercial’s core countries, planning is relaxed (Sweden), is somewhat relaxed (Italy) or has recently become more relaxed (France). In the medium term, this may lead to an oversupply of retail space, which in turn may lead to lower market rents. We do not believe that this will be an obstacle in the near future, but it may hurt ECP more than its peers with a heavy Dutch, German or UK retail weighting, where planning is on average stricter.
Succession
CEO Jeremy Lewis is 64 years of age. At the AGM, he announced his desire to continue for quite a while, without quantifying if he was meant months or years. Management also said it has some ideas about succession, but that it is too early for details.
We believe it would be good news if the CEO stayed on longer. At the same time, we believe that there should be some clarity here as surprises are rarely good for share price performance. In addition, there is a risk that this management team, which is highly regarded, would be disbanded if the succession is not resolved in a way that satisfies all team members. We believe this matter will be managed prudently, but it does bear a risk.
Property companies are low-risk, on average
Longer Lewis stay would be good news
But the matter should be addressed to prevent
internal or external surprises
Planning is relaxed in Italy and Sweden
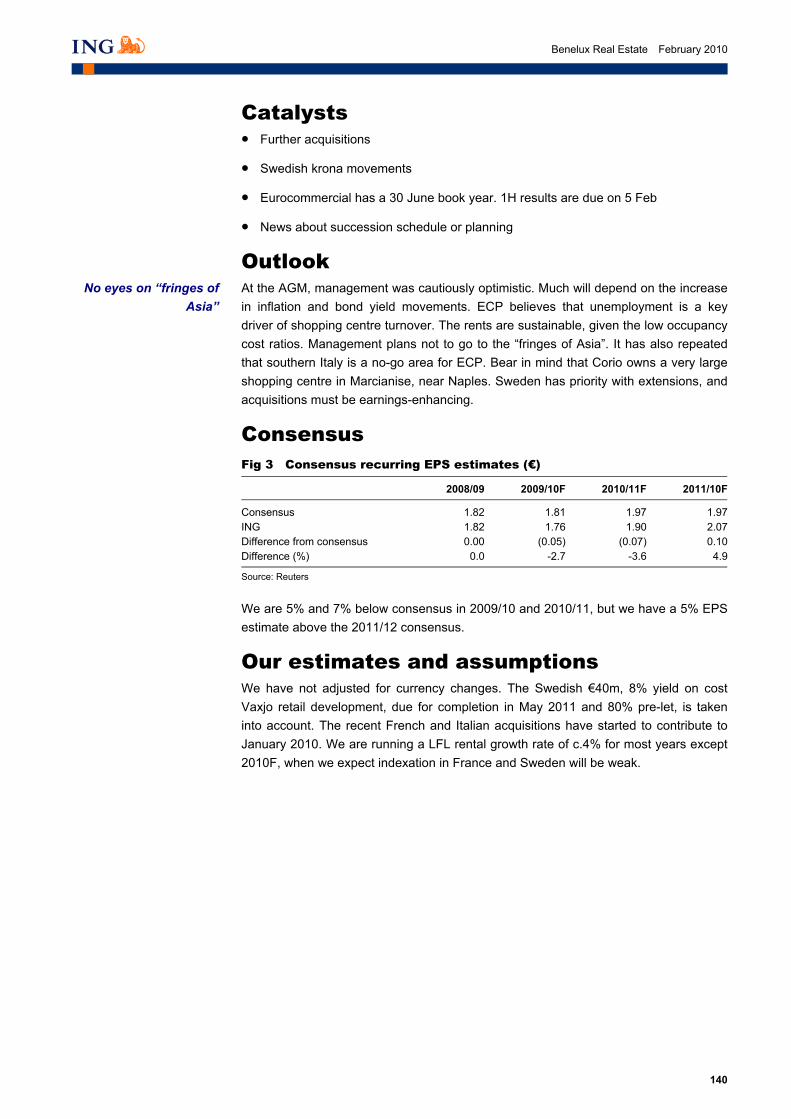
140
Benelux Real Estate February 2010
Catalysts • Further acquisitions
• Swedish krona movements
• Eurocommercial has a 30 June book year. 1H results are due on 5 Feb
• News about succession schedule or planning
Outlook At the AGM, management was cautiously optimistic. Much will depend on the increase in inflation and bond yield movements. ECP believes that unemployment is a key driver of shopping centre turnover. The rents are sustainable, given the low occupancy cost ratios. Management plans not to go to the “fringes of Asia”. It has also repeated that southern Italy is a no-go area for ECP. Bear in mind that Corio owns a very large shopping centre in Marcianise, near Naples. Sweden has priority with extensions, and acquisitions must be earnings-enhancing.
Consensus Fig 3 Consensus recurring EPS estimates (€)
2008/09 2009/10F 2010/11F 2011/10F
Consensus 1.82 1.81 1.97 1.97ING 1.82 1.76 1.90 2.07Difference from consensus 0.00 (0.05) (0.07) 0.10Difference (%) 0.0 -2.7 -3.6 4.9
Source: Reuters
_
We are 5% and 7% below consensus in 2009/10 and 2010/11, but we have a 5% EPS estimate above the 2011/12 consensus.
Our estimates and assumptions We have not adjusted for currency changes. The Swedish €40m, 8% yield on cost Vaxjo retail development, due for completion in May 2011 and 80% pre-let, is taken into account. The recent French and Italian acquisitions have started to contribute to January 2010. We are running a LFL rental growth rate of c.4% for most years except 2010F, when we expect indexation in France and Sweden will be weak.
No eyes on “fringes of Asia”

141
Benelux Real Estate February 2010
Company profile
Investment portfolio Fig 4 Portfolio breakdown by country including Dec 2009 acquisitions
30 June 2009 Acquisitions Total (%)
France 780 59 839 38Italy 882 40 922 41Sweden 471 471 21Total 2,133 99 2,232 100
Source: Company data, ING estimates
_
Figure 4 gives the breakdown of the portfolio as of 30 June and includes the December 2009 acquisitions.
Fig 5 Portfolio breakdown by type of retail
Fig 6 Portfolio breakdown by country
Suburban centres
75%
City centre galleries &
shops21%
Retail parks4%
France38%
Italy41%
Sweden21%
Source: Company data, ING estimates Source: Company data, ING estimates
_
Type of retail Eurocommercial has most of its portfolio in suburban centres. After the inclusion of the recent acquisition, this exposure amounts to 76%. Given this breakdown and the fact that prime high street retail on average shows fewer vacancies than suburban centres, the 1% vacancy rate is all the more remarkable, and shows the very strong asset selection skills of this management team. One could also argue that it does not push the tenants hard enough, but the fact that ECP has not made a single rent reduction in the past year proves that this is untrue.
Fig 7 Portfolio breakdown by type of retail, incl. recent acquisitions
(%) Value (€m) Acquisitions Value (€m) (%)
Suburban centres 75 1,599.75 99 1,698.75 76City centre galleries & shops 21 447.93 447.93 20Retail parks 4 85.32 85.32 4Total 2,133 2,232
Source: Company data, ING estimates
_
Recent acquisitions were done at yields of 6.5% in Moisselles, 15km north of St Denis, Paris, and 6.4% in Modena, Italy. Figure 6 illustrates the yield used for ECP’s leading centres, which range between 5.3% and 5.9%. ECP’s largest assets are Centro Carosello, just outside Milan, with a value of €265m, and Passage du Havre, in central Paris, valued at €243m.

142
Benelux Real Estate February 2010
Fig 8 Eurocommercial’s top ten assets
Name City Value (€m)
Valuation result(%)
Net yield incl. purch. cost (%)
Passage du Havre Paris 243 -11.9 5.3Passy Plaza Paris 117 -7.7 5.6Les Atlantes Tours Tours 111 -8.6 5.5Il Castello Ferrara 101 7.4 5.8I Gigli Firenze 225 -10.5 5.7Carosello Carugate, MI 265 10.1 5.3Burlov Center Malmo 105 -6.5 5.6Curno Bergamo 97 -5.5 5.4421 Goteborg 70 -9.5 5.7Ingelsta Shopping Center Norrkoping 83 21.2 5.9Total top ten 1,418
Source: Company data
_
Breakdown by tenant Figure 9 shows the top ten tenants. We believe this is a solid list of tenants, who are unlikely to go bust.
Fig 9 Top-ten tenants and turnover by country and sector
Tenant % of rent Sales turnover 30 June 2008-30 June 2009 (%)
Carrefour 4.2 Overall -1.1ICA Sverige 4.2 France -2.6H&M 4.1 Italy -0.8Groupe Casino 3.6 Sweden 0.1Mediamarkt 3.3 Fashion -0.8Fnac 3.2 Gifts and jewellery 3.9Coin Spa 2.0 Health and beauty 2.1Inditex 1.7 Home goods -2.0Vis Pathé 1.7 Restaurants 1.1Co-op Sverige AB 1.6 Electricals -6.9 Hyper/supermarkets 1.1
Source: Company data
_
Like-for-like rental growth Eurocommercial posted LFL rental growth of 4.5% in the 12 months preceding 30 September 2009. This compares with 4.5% for Unibail Retail, 1.8% for the retail portfolio of Corio and c.0.6% for VastNed Retail.
Fig 10 Like-for-like rental growth (%)
Like-for-like 12m preceding
Eurocommercial 4.50 30-Sep-09Eurocommercial France 4.10 30-Sep-09Eurocommercial Italy 5.00 30-Sep-09Eurocommercial Sweden 4.20 30-Sep-09Corio Retail 1.80 30-Sep-09VastNed Retail 0.60 30-Sep-09Unibail Retail 4.50 30-Jun-09Unibail Retail France 5.80 30-Jun-09Unibail Retail Nordic 1.90 30-Jun-09
Source: Company data, ING estimates
_
We believe that LFL rental growth is still not the mathematical formula it should be. In particular, a company can take centres in and out of the sample, in order to obtain a better growth figure.

143
Benelux Real Estate February 2010
Corporate governance Eurocommercial shares convert into certificates authorised by the Stichting Administratiekantoor regulatory body, and these trade at one certificate to 10 shares. As a result, it would be difficult but not impossible to engineer a takeover of the company. We have not noticed any trading discount so far, probably because investors are fairly happy with the performance of the management team. When shareholders do not take up their voting rights, in effect they are transferred automatically to management. As a result, the power of a small minority remains limited. The Tabaksblatt Commission of Dutch corporate governance supports this structure.
We do not advocate a monopoly of shareholders on corporate governance. Nevertheless, in principle we oppose the certification of shares and we would demand a discount for it, because it transfers power from shareholders to management and not to other stakeholders.
In addition to the certification, Eurocommercial has priority shares outstanding, which is not in line with Dutch best practice corporate governance.
Management Chief executive, Jeremy Lewis • By profession a chartered surveyor, Mr Lewis was a founding director of the
company in 1991. He has more than 30 years’ international experience running quoted property investment vehicles.
Finance director. Evert Jan van Garderen • Evert Jan van Garderen, a Dutch national and graduate of Erasmus University
Rotterdam, joined the company in 1994. He is a qualified lawyer and chartered accountant.
Director, Peter Mills • Peter Mills joined Eurocommercial in 1993 and is the director responsible for the
company's investments in the Netherlands and Sweden. Before joining Eurocommercial, he worked for major international property consultants covering the UK and European investment markets. Mr Mills is a chartered surveyor, having read land economy at Cambridge University.
Director, Tom Newton • Having acquired experience in the property markets of the UK, Australia and
France, Tom Newton joined Eurocommercial in 1992. Since then he has been involved in the acquisition programme in France and Italy, and is now responsible for the French portfolio. Tom Newton has a degree in modern languages from Durham University, and is a chartered surveyor.
Director, Tim Santini • Tim Santini joined Eurocommercial in 1994 and is the director responsible for the
Italian activities of the company. Before joining Eurocommercial, he was with the retail team of a major international property consultant in London, working on projects in the UK and continental Europe. Mr Santini speaks French and Italian, and is a chartered surveyor.
Shares have been converted into
certificates, removing power from
shareholders
Priority shares

144
Benelux Real Estate February 2010
Financials
Fig 11 Profit and loss accounts (€m)
Yr to June 2008/09 2009/10F 2010/11F 2011/12F 2012/13F 2013/14F 2014/15F
Rental income 134.2 140.0 153.8 163.1 171.8 181.1 190.9Service charges income 21.1 22.9 24.3 25.8 27.0 28.3 29.7Service charges expenses (24.2) (26.1) (27.7) (29.4) (30.8) (32.3) (33.8)Property expenses (16.7) (17.0) (19.1) (20.2) (21.4) (22.6) (23.8)Net property income 114.4 119.8 131.3 139.2 146.6 154.6 163.0Disposal of investment properties (0.3) 0.0 0.0 0.0 0.0 0.0 0.0Investment revaluation (208.1) 4.5 92.2 120.3 126.4 106.1 54.9Interest income 0.4 (0.1) (0.3) (0.3) (0.2) (0.1) 0.0Interest expenses (44.7) (43.5) (45.5) (45.9) (46.0) (46.1) (46.1)Interest capitalised 3.4 1.3 1.8 1.8 1.8 1.8 1.8Total interest (40.8) (42.3) (44.0) (44.4) (44.4) (44.4) (44.3)Fair value movement derivatives (86.7) (8.8) 0.0 0.0 0.0 0.0 0.0Net financing cost (127.5) (51.1) (44.0) (44.4) (44.4) (44.4) (44.3)Company expenses (8.5) (9.5) (10.8) (11.4) (12.0) (12.7) (13.4)Investment expenses (1.3) (1.7) (2.3) (2.4) (2.6) (2.7) (2.9)Result before taxation (231.2) 62.0 166.4 201.2 214.1 200.9 157.4Corporate income tax 0.0 0.0 0.0 0.0 0.0 0.0 0.0Deferred tax 50.5 (1.7) (18.4) (24.1) (25.3) (21.2) (11.0)Result after taxation (180.7) 60.3 148.0 177.1 188.8 179.7 146.4Total direct result 65.1 68.0 76.6 83.3 90.2 97.5 105.3Total indirect result (245.8) (7.7) 71.4 93.8 98.6 82.1 41.1Recurring cash flow 60.4 64.9 72.5 79.1 85.9 93.0 100.6Recurring net profit 63.8 66.3 74.3 80.9 87.6 94.8 102.4
Source: ING estimates _
Fig 12 Per share data (€)
Yr to June 2008/09 2009/10F 2010/11F 2011/12F 2012/13F 2013/14F 2014/15F
No. of depositary receipts representing shares after deduction of depositary receipts brought back
35,840,442 40,303,499 40,303,499 40,303,499 40,303,499 40,303,499 40,303,499
Average number of depositary receipts 35,797,301 38,629,853 40,303,499 40,303,499 40,303,499 40,303,499 40,303,499Direct result per depositary receipt 1.82 1.76 1.90 2.07 2.24 2.42 2.61Indirect result per depositary receipt (6.87) (0.20) 1.77 2.33 2.45 2.04 1.02Total result per depositary receipt (5.05) 1.56 3.67 4.40 4.68 4.46 3.63
IFRS NAV per depositary receipt 28.82 28.29 30.25 32.75 35.36 37.58 38.80Adjusted NAV per depositary receipt 33.05 32.33 34.76 37.85 41.09 43.84 45.32
Dividend (€) 1.78 1.78 1.90 2.07 2.24 2.42 2.61
Source: ING estimates _

145
Benelux Real Estate February 2010
Fig 13 Balance sheet (€m)
As at 30 June 2008/09 2009/10F 2010/11F 2011/12F 2012/13F 2013/14F 2014/15F
Property investments 2,125.1 2,277.1 2,380.7 2,501.0 2,627.5 2,733.5 2,788.5Property investments under development 11.7 12.0 12.0 12.0 12.0 12.0 12.0Tangible fixed assets 1.6 1.5 1.5 1.5 1.5 1.5 1.5Receivables 1.4 1.3 1.3 1.3 1.3 1.3 1.3Derivative financial instruments 1.0 0.2 0.2 0.2 0.2 0.2 0.2Total fixed assets 2,140.8 2,292.0 2,395.6 2,516.0 2,642.4 2,748.5 2,803.4Property held for sale 0.0 0.0 0.0 0.0 0.0 0.0 0.0Receivables 23.4 1.7 1.8 1.9 2.0 2.1 2.2Cash and deposits 7.8 37.2 68.6 80.4 92.8 105.8 119.7Total current assets 31.2 38.8 70.4 82.3 94.8 107.9 121.9Total assets 2,172.0 2,330.8 2,466.0 2,598.3 2,737.2 2,856.4 2,925.3Corporate tax payable 0.0 0.0 0.0 0.0 0.0 0.0 0.0Creditors 63.7 69.8 75.4 79.4 83.7 88.2 93.0Borrowings 55.8 54.8 67.5 71.1 74.9 78.9 83.2Total current liabilities 119.6 124.6 142.8 150.5 158.6 167.2 176.3Creditors 10.0 9.8 9.8 9.8 9.8 9.8 9.8Borrowings 857.3 892.8 912.0 912.0 912.0 912.0 912.0Derivative financial instruments 60.6 68.3 68.3 68.3 68.3 68.3 68.3Deferred tax liabilities 90.9 94.9 113.4 137.4 162.7 183.9 194.9Provision for pensions 0.4 0.4 0.4 0.4 0.4 0.4 0.4Total fixed liabilities 1,019.4 1,066.3 1,103.9 1,128.0 1,153.3 1,174.5 1,185.5Total liabilities 1,139.0 1,190.9 1,246.7 1,278.5 1,311.9 1,341.6 1,361.7Issued share capital 179.9 0.0 0.0 0.0 0.0 0.0 0.0Share premium reserve 324.8 0.0 0.0 0.0 0.0 0.0 0.0Other reserves 709.1 0.0 0.0 0.0 0.0 0.0 0.0Undistributed income (180.7) 0.0 0.0 0.0 0.0 0.0 0.0Equity 1,033.1 1,140.0 1,219.2 1,319.8 1,425.3 1,514.7 1,563.6Total equity and liabilities 2,172.0 2,330.8 2,466.0 2,598.3 2,737.2 2,856.4 2,925.3IFRS net equity per balance sheet 1,033.1 1,140.0 1,219.2 1,319.8 1,425.3 1,514.7 1,563.6Deferred tax liabilities 90.9 94.9 113.4 137.4 162.7 183.9 194.9Derivative financial instruments 60.6 68.2 68.2 68.2 68.2 68.2 68.2Adjusted net equity 1,184.6 1,303.1 1,400.8 1,525.4 1,656.2 1,766.9 1,826.7
Source: ING estimates _
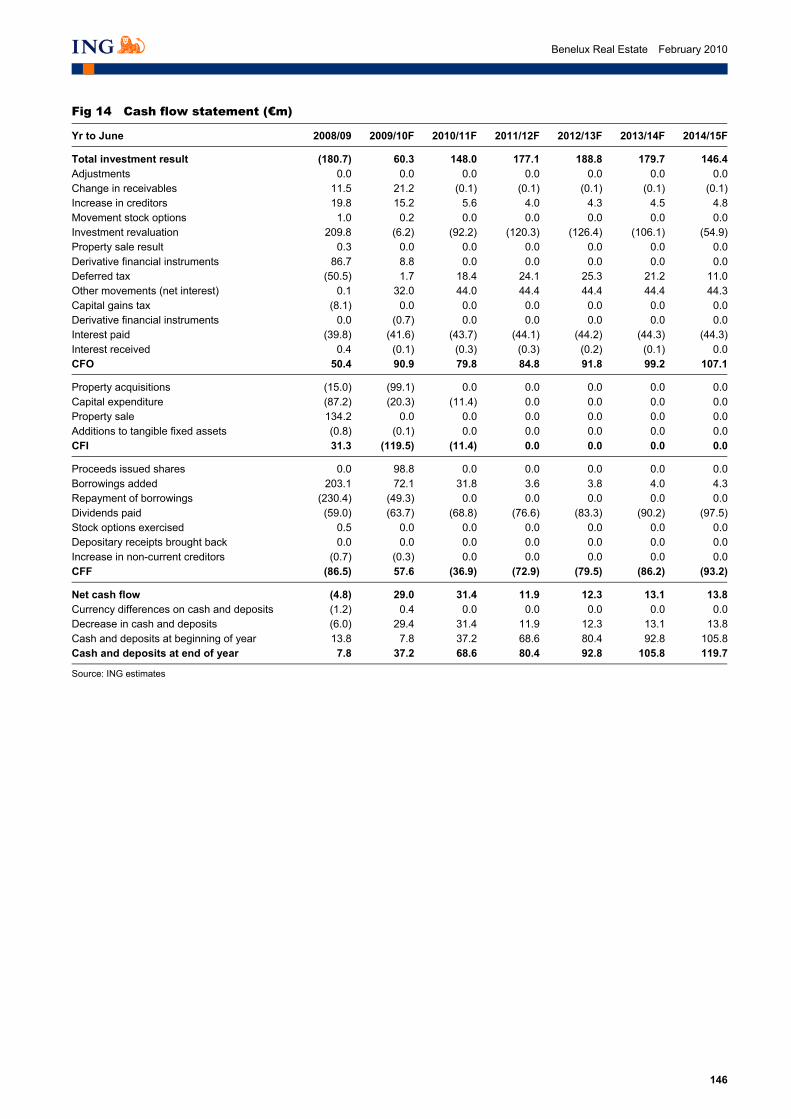
146
Benelux Real Estate February 2010
Fig 14 Cash flow statement (€m)
Yr to June 2008/09 2009/10F 2010/11F 2011/12F 2012/13F 2013/14F 2014/15F
Total investment result (180.7) 60.3 148.0 177.1 188.8 179.7 146.4Adjustments 0.0 0.0 0.0 0.0 0.0 0.0 0.0Change in receivables 11.5 21.2 (0.1) (0.1) (0.1) (0.1) (0.1)Increase in creditors 19.8 15.2 5.6 4.0 4.3 4.5 4.8Movement stock options 1.0 0.2 0.0 0.0 0.0 0.0 0.0Investment revaluation 209.8 (6.2) (92.2) (120.3) (126.4) (106.1) (54.9)Property sale result 0.3 0.0 0.0 0.0 0.0 0.0 0.0Derivative financial instruments 86.7 8.8 0.0 0.0 0.0 0.0 0.0Deferred tax (50.5) 1.7 18.4 24.1 25.3 21.2 11.0Other movements (net interest) 0.1 32.0 44.0 44.4 44.4 44.4 44.3Capital gains tax (8.1) 0.0 0.0 0.0 0.0 0.0 0.0Derivative financial instruments 0.0 (0.7) 0.0 0.0 0.0 0.0 0.0Interest paid (39.8) (41.6) (43.7) (44.1) (44.2) (44.3) (44.3)Interest received 0.4 (0.1) (0.3) (0.3) (0.2) (0.1) 0.0CFO 50.4 90.9 79.8 84.8 91.8 99.2 107.1
Property acquisitions (15.0) (99.1) 0.0 0.0 0.0 0.0 0.0Capital expenditure (87.2) (20.3) (11.4) 0.0 0.0 0.0 0.0Property sale 134.2 0.0 0.0 0.0 0.0 0.0 0.0Additions to tangible fixed assets (0.8) (0.1) 0.0 0.0 0.0 0.0 0.0CFI 31.3 (119.5) (11.4) 0.0 0.0 0.0 0.0
Proceeds issued shares 0.0 98.8 0.0 0.0 0.0 0.0 0.0Borrowings added 203.1 72.1 31.8 3.6 3.8 4.0 4.3Repayment of borrowings (230.4) (49.3) 0.0 0.0 0.0 0.0 0.0Dividends paid (59.0) (63.7) (68.8) (76.6) (83.3) (90.2) (97.5)Stock options exercised 0.5 0.0 0.0 0.0 0.0 0.0 0.0Depositary receipts brought back 0.0 0.0 0.0 0.0 0.0 0.0 0.0Increase in non-current creditors (0.7) (0.3) 0.0 0.0 0.0 0.0 0.0CFF (86.5) 57.6 (36.9) (72.9) (79.5) (86.2) (93.2)
Net cash flow (4.8) 29.0 31.4 11.9 12.3 13.1 13.8Currency differences on cash and deposits (1.2) 0.4 0.0 0.0 0.0 0.0 0.0Decrease in cash and deposits (6.0) 29.4 31.4 11.9 12.3 13.1 13.8Cash and deposits at beginning of year 13.8 7.8 37.2 68.6 80.4 92.8 105.8Cash and deposits at end of year 7.8 37.2 68.6 80.4 92.8 105.8 119.7
Source: ING estimates
_

147
Benelux Real Estate February 2010
Fig 15 Quarterly profit and loss account (€m)
Yr to June 2008/09 1Q09/10 2Q09/10F 1H09/10F 3Q09/10F 9M09/10F 4Q09/10F 2009/10F
Rental income 134.2 33.3 33.8 67.1 36.2 103.3 36.7 140.0Service charges income 21.1 6.3 5.3 11.6 5.6 17.3 5.7 22.9Service charges expenses (24.2) (7.1) (6.1) (13.2) (6.4) (19.6) (6.5) (26.1)Property expenses (16.7) (3.8) (4.2) (8.0) (4.5) (12.5) (4.5) (17.0)Net property income 114.4 28.7 28.9 57.6 30.9 88.5 31.4 119.8Disposal of investment properties (0.3) 0.0 0.0 0.0 0.0 0.0 0.0 0.0Investment revaluation (208.1) (1.7) (38.3) (40.0) 0.0 (40.0) 44.5 4.5Interest income 0.4 0.0 0.0 0.0 (0.1) (0.1) 0.0 (0.1)Interest expenses (44.7) (10.3) (10.8) (21.1) (11.1) (32.4) (11.1) (43.5)Interest capitalised 3.4 0.0 0.4 0.4 0.4 0.9 0.4 1.3Total interest (40.8) (10.3) (10.4) (20.7) (10.8) (31.6) (10.7) (42.3)Fair value movement derivatives (86.7) (8.8) 0.0 (8.8) 0.0 (8.8) 0.0 (8.8)Net financing cost (127.5) (19.1) (10.4) (29.5) (10.8) (40.4) (10.7) (51.1)Company expenses (8.5) (2.0) (2.4) (4.4) (2.5) (6.9) (2.6) (9.5)Investment expenses (1.3) (0.1) (0.5) (0.6) (0.5) (1.2) (0.6) (1.7)Result before taxation (231.2) 5.7 (22.6) (16.9) 17.0 0.0 62.0 62.0Corporate income tax 0.0 0.0 0.0 0.0 0.0 0.0 0.0 0.0Deferred tax 50.5 (0.5) 7.7 7.2 0.0 7.2 (8.9) (1.7)Result after taxation (180.7) 5.2 (15.0) (9.7) 17.0 7.2 53.1 60.3Total direct result 65.1 16.4 16.1 32.5 17.6 49.9 18.1 68.0Total indirect result (245.8) (11.1) (31.1) (42.2) (0.5) (42.7) 35.0 (7.7)Recurring cash flow 60.4 16.2 15.2 31.4 16.6 47.8 17.1 64.9Recurring net profit 63.8 16.2 15.6 31.9 17.0 48.7 17.6 66.3
Source: Company data, ING estimates _
Fig 16 Quarterly per share data (€)
Yr to June 2008/09 1Q09/10 2Q09/10F 1H09/10F 3Q09/10F 9M09/10F 4Q09/10F 2009/10F
No of depositary receipts representing shares after deduction of depositary receipts brought back
35,840,442 35,840,442 40,303,499 40,303,499 40,303,499 40,303,499 40,303,499 40,303,499
Average number of depositary receipts 35,797,301 35,840,442 38,071,971 36,956,206 40,303,499 38,071,971 40,303,499 38,629,853Direct result per depositary receipt 1.82 0.46 0.42 0.88 0.44 1.31 0.45 1.76Indirect result per depositary receipt (6.87) (0.31) (0.82) (1.14) (0.01) (1.12) 0.87 (0.20)Total result per depositary receipt (5.05) 0.15 (0.39) (0.26) 0.42 0.19 1.32 1.56
IFRS NAV per depositary receipt 28.82 29.29 26.55 26.55 26.97 26.97 28.29 28.29Adjusted NAV per depositary receipt 33.05 33.81 30.37 30.37 30.80 30.79 32.34 32.33
Dividend 1.78 0 0 0 0 0 0 1.78
Source: Company data, ING estimates _

148
Benelux Real Estate February 2010
Fig 17 Quarterly balance sheet (€m)
2008/09 1Q09/10 2Q09/10F 1H09/10F 3Q09/10F 9M09/10F 4Q09/10F 2009/10F
Property investments 2,125.1 2,154.6 2,221.2 2,221.2 2,226.9 2,226.9 2,277.1 2,277.1Property investments under development 11.7 12.0 12.0 12.0 12.0 12.0 12.0 12.0Tangible fixed assets 1.6 1.5 1.5 1.5 1.5 1.5 1.5 1.5Receivables 1.4 1.3 1.3 1.3 1.3 1.3 1.3 1.3Derivative financial instruments 1.0 0.2 0.2 0.2 0.2 0.2 0.2 0.2Total fixed assets 2,140.8 2,169.5 2,236.1 2,236.1 2,241.8 2,241.8 2,292.0 2,292.0Property held for sale 0.0 0.0 0.0 0.0 0.0 0.0 0.0 0.0Receivables 23.4 25.9 1.5 1.5 1.5 1.5 1.6 1.6Cash and deposits 7.8 12.6 8.5 8.5 19.2 19.2 30.2 30.3Total current assets 31.2 38.5 10.0 10.0 20.7 20.7 31.8 31.8Total assets 2,172.0 2,208.0 2,246.1 2,246.1 2,262.5 2,262.6 2,323.8 2,323.8Corporate tax payable 0.0 0.0 0.0 0.0 0.0 0.0 0.0 0.0Creditors 63.7 68.3 64.0 64.0 64.7 64.7 65.4 65.4Borrowings 55.8 54.8 54.8 54.8 54.8 54.8 54.8 54.8Total current liabilities 119.6 123.1 118.9 118.9 119.6 119.6 120.3 120.3Creditors 10.0 9.8 9.8 9.8 9.8 9.8 9.8 9.8Borrowings 857.3 862.8 892.8 892.8 892.8 892.8 892.8 892.8Derivative financial instruments 60.6 68.3 68.3 68.3 68.3 68.3 68.3 68.3Deferred tax liabilities 90.9 93.7 93.7 93.7 93.7 93.7 93.7 93.7Provision for pensions 0.4 0.4 0.4 0.4 0.4 0.4 0.4 0.4Total fixed liabilities 1,019.4 1,035.0 1,065.0 1,065.0 1,065.0 1,065.0 1,065.0 1,065.0Total liabilities 1,139.0 1,158.2 1,183.9 1,183.9 1,184.6 1,184.6 1,185.3 1,185.3Equity 1,033.1 1,049.9 1,063.4 1,063.4 1,079.1 1,079.2 1,139.7 1,139.7Total equity and liabilities 2,172.0 2,208.0 2,247.3 2,247.3 2,263.7 2,263.8 2,325.0 2,325.0IFRS net equity per balance sheet 1,033.1 1,049.9 1,063.4 1,063.4 1,079.1 1,079.2 1,139.7 1,139.7Deferred tax liabilities 90.9 93.7 93.7 93.7 93.7 93.7 93.7 93.7Derivative financial instruments 60.6 68.2 68.2 68.2 68.2 68.2 68.2 68.2Adjusted net equity 1,184.6 1,211.7 1,225.3 1,225.3 1,241.0 1,241.0 1,301.6 1,301.6
Source: ING estimates _

149
Benelux Real Estate February 2010
Fig 18 Quarterly cash flow statement (€m)
Yr to June 2008/09 1Q09/10 2Q09/10F 1H09/10F 3Q09/10F 9M09/10F 4Q09/10F 2009/10F
Total investment result (180.7) 5.2 (15.0) (9.7) 17.0 7.2 53.1 60.3Adjustments 0.0 0.0 0.0 0.0 0.0 0.0 0.0 0.0Change in receivables 11.5 (3.0) 24.4 21.4 (0.1) 21.3 0.0 21.2Increase in creditors 19.8 13.7 (4.0) 9.7 4.5 14.2 1.0 15.2Movement stock options 1.0 0.2 0.0 0.2 0.0 0.2 0.0 0.2Investment revaluation 209.8 0.0 38.3 38.3 0.0 38.3 (44.5) (6.2)Property sale result 0.3 0.0 0.0 0.0 0.0 0.0 0.0 0.0Derivative financial instruments 86.7 8.8 0.0 8.8 0.0 8.8 0.0 8.8Deferred tax (50.5) 0.5 (7.7) (7.2) 0.0 (7.2) 8.9 1.7Other movements (net interest) 0.1 0.2 10.4 10.6 10.8 21.4 10.7 32.0Capital gains tax (8.1) 0.0 0.0 0.0 0.0 0.0 0.0 0.0Derivative financial instruments 0.0 (0.7) 0.0 (0.7) 0.0 (0.7) 0.0 (0.7)Interest paid (39.8) (9.8) (10.3) (20.2) (10.7) (30.9) (10.7) (41.6)Interest received 0.4 0.0 0.0 0.0 (0.1) (0.1) 0.0 (0.1)CFO 50.4 15.1 36.0 51.1 21.4 72.4 18.5 90.9
Property acquisitions (15.0) 0.0 (99.1) (99.1) 0.0 (99.1) 0.0 (99.1)Capital expenditure (87.2) (3.2) (5.7) (8.9) (5.7) (14.6) (5.7) (20.3)Property sale 134.2 0.0 0.0 0.0 0.0 0.0 0.0 0.0Additions to tangible fixed assets (0.8) (0.1) 0.0 (0.1) 0.0 (0.1) 0.0 (0.1)CFI 31.3 (3.2) (104.8) (108.0) (5.7) (113.8) (5.7) (119.5)
Proceeds issued shares 0.0 0.0 98.8 98.8 0.0 98.8 0.0 98.8Borrowings added 203.1 42.1 30.0 72.1 0.0 72.1 0.0 72.1Repayment of borrowings (230.4) (49.3) 0.0 (49.3) 0.0 (49.3) 0.0 (49.3)Dividends paid (59.0) 0.0 (63.7) (63.7) 0.0 (63.7) 0.0 (63.7)Stock options exercised 0.5 0.0 0.0 0.0 0.0 0.0 0.0 0.0Depositary receipts brought back 0.0 0.0 0.0 0.0 0.0 0.0 0.0 0.0Increase in non-current creditors (0.7) (0.3) 0.0 (0.3) 0.0 (0.3) 0.0 (0.3)CFF (86.5) (7.5) 65.1 57.6 0.0 57.6 0.0 57.6
Net cash flow (4.8) 4.3 (3.7) 0.6 15.7 16.2 12.8 29.0Currency differences on cash and deposits (1.2) 0.4 0.0 0.4 0.0 0.4 0.0 0.4Decrease in cash and deposits (6.0) 4.7 (3.7) 1.0 15.7 16.5 12.8 29.4Cash and deposits at beginning of year 13.8 7.8 12.6 7.8 8.8 7.8 24.5 7.8Cash and deposits at end of year 7.8 12.6 8.8 8.8 24.5 24.4 37.3 37.2
Source: ING estimates
_

150
Benelux Real Estate February 2010
This page is left blank intentionally

151
Benelux Real Estate February 2010
Belgium
Home Invest Belgium Brussels residential play
Key ratios (%)
2008 2009F
Rental growth 14.7 1.0Operating margin 65.7 65.7Occupancy rate 96.0 96.0
Share data No of shares (€m) 2.8Daily turnover (shares, 3M) 800Free float (%) 62.4Enterprise value (€m) 215.4Market cap (€m) 154.9
12-month forecast returns (%) Share price -11.4Dividend 4.612m f'cst total return -6.8
Share price performance
15
25
35
45
55
65
1/08 7/08 1/09 7/09 1/10
Price BEL 20 (rebased)
Source: ING
HIB focuses on the Brussels residential market. With a 9% average total return over ten years, it outperforms our Belgian universe, except WDP. We believe lot-for-lot disposals offer attractive returns. We initiate with a SELL and €48 TP based on a 5% discount to 2010F IFRS NAV.
Initiating coverage
€54.25 February 2010
Sell
Real estate
€48.0 Target price (12 month)
Reuters
Jean-Yves Devloo Amsterdam (31) 20 563 8745 [email protected]
Arjan Knibbe Amsterdam (31) 20 563 8780 [email protected]
We believe that Home Invest Belgium should try to grow in order to get on investors’ radar screens and reel in the economies of scale that are possible with a larger portfolio. We would also like to see HIB publish its results in English.
Key ratios and forecasts
2008 2009F 2010F 2011F 2012F
EPS adj (€) 2.33 2.06 2.11 2.16 2.20PER (x) 23.3 26.4 25.7 25.1 24.6Net yield (%) 5.9 6.0 6.2 6.3 6.5IFRS NAV (€) 52.7 51.4 50.5 50.3 50.0EPRA NNNAV (€) N/A N/A N/A N/A N/AP/IFRS NAV (€) 1.0 1.1 1.1 1.1 1.1DPS (€) 2.36 2.43 2.48 2.53 2.58Dividend yield (%) 4.4 4.5 4.6 4.7 4.8CFPS (€) 2.37 2.06 2.11 2.16 2.20LTV (%) 28.9 29.7 30.4 30.8 31.2
Source: Company data, ING estimates _

152
Benelux Real Estate February 2010
Investment case
Home Invest Belgium is a property investor in Brussels, specialising in furnished and unfurnished rental apartments. The company owns a €210m portfolio, 70% of which are apartments; 76% of the portfolio is located in Brussels. The portfolio is relatively new, with 66% less then 10 years old. The company’s largest single property asset is the 8,152m2 Lambermont building in Schaerbeek, northern Brussels, worth c.9% of the portfolio.
Highlights We believe that HIB is overvalued: the current price does not reflect the low liquidity of the shares and this company is probably operating significantly below its most efficient scale.
We have no reason to believe management is not doing a good job. We believe it is responsive and straightforward, and well connected to the right networks of residential developers, investors and tenants. We believe HIB’s focus on the middle segment makes sense, as re-letting is a core activity in this market.
Our price target of €48 is based on a 5% discount to 2010F IFRS NAV of €50.50. The dividend yield of 4.4% is lower than that of its office peers, Cofinimmo and Befimmo, which also offer a relatively secure income as leases have significantly longer durations.
We believe that at its inception, HIB would fit an SRI profile well, but with the company at its current size it probably makes little sense to spend time on this issue.
SRI potential
Dividend yield low and lease lengths short
Overvalued
Good network, well chosen sub-markets

153
Benelux Real Estate February 2010
Fig 1 SWOT analysis
Strengths Weaknesses
Upper midmarket segment focus limits exposure to troubled tenants. In 2008, total rent defaults were 1.2% of total rents received
Lot-for-lot sales have become possible over the last couple of years
Strong track record: an annual average IRR of 13% since creation (1999) has been realised (assuming reinvestment of dividends)
Large and diversified tenant base: most important tenant accounted for a mere 2.7% of FY08 rents
Fully internalised asset management and portfolio management
Economic crisis has hurt the residential buyers’ market, driving more people to rent houses
Recently started developing for own account (apartment site in Sint Gillis)
Simple contract structure, resulting in absence of significant incentives
Portfolio is too small in relation to management expenses, resulting in a low operating margin Low stock liquidity and limited free float
Corporate reports not in English
Limited EPRA reporting compliance
Opportunities Threats/Risks
Very low debt ratio enables large capacity for leveraged acquisitions when opportunities arise.
Asset management for third parties
Because of the crisis, fewer people are willing to step into the residential transactional market and are placing their focus on the letting market.
Public private partnership that foresees in social housing, a market that is c.50% undersupplied in Brussels
Add more developments
Weak outlook for the furnished apartments segment (substantial decrease in number of expats) likely to hurt the occupancy rate of this part of the portfolio (11%)
Source: ING _
Risks Because of the contractual nature of a large part of the recurring cash flows, property companies are usually considered to have less risk than most other equity sectors. The risk to property companies bears a strong relation to the amount of development exposure, the geographical and sectoral breakdown, corporate governance and alignment of interest between management and shareholders.
Tenant risk
HIB’s largest tenant pays only 2.7% of total rental income. This risk seems limited, in our view.
Catalysts • Acquisitions, paid in shares or cash
• Letting market developments
• Year-end results on 6 March 2010
• Delivery of the Brussels developments
• Merger of takeover transactions
Property companies are low-risk, on average

154
Benelux Real Estate February 2010
Company profile
Home Invest Belgium (HIB) was created and quoted by ING and Fortis in 1999, with a mission to create an upper midmarket residential real estate portfolio, located primarily in the Brussels region (mainly in the centre and east). In mid-2009, HIB had a portfolio worth €210m, totalling 918 individual units, with an area of c.105,000m² let to almost 1,000 tenants. HIB carries the status of “residential Sicafi” (a requirement of having >60% of assets invested in residential real estate), resulting in a dividend withholding tax exemption at the shareholder level, which is meant to be compensation for the residential registration tax that is payable by the owner instead of the tenant.
Fig 2 Geographical spread of assets (%)
Fig 3 Typological spread of assets (%)
Brussels region74%
Flanders region
9%
Walloon region17%
Unfurnished appartments
59%Retail assets14%
Furnished appartments
11%
Offices7%
Houses7% Senior homes
2%
Source: Company data Source: Company data
_
HIB’s investment strategy is multi-faceted:
• Investment in residential assets resulting in an immediate yield accretion or future fair value gain potential, among others by lot for lot disposals
• Assets with a minimum size of €3m for buildings and €5m for portfolios
• Liquidate individual apartment units in order to facilitate future lot-for-lot disposals
• Preferably located in the Brussels region, Antwerp, Ghent, Leuven and Namur. A minimum number of inhabitants of 50,000 is required.
Since 2006, HIB has searched for arbitration possibilities that consist of the disposal of smaller buildings, ground lots destined for construction of upmarket assets and buildings that can be sold at a large fair value gain. In terms of acquisitions, HIB says it will invest only in assets with a maximum age of 10 years, unless the assets in question have recently been renovated. At end-2008, almost 67% of total buildings were less than 10 years old. This strategy has been chosen in order to optimise future gains from active lot-for-lot disposals. In the long term, these lot-for-lot sales are targeted at an average of c.5% of the total portfolio per year.
Belgium’s focused apartment REIT
Increased focus on arbitration
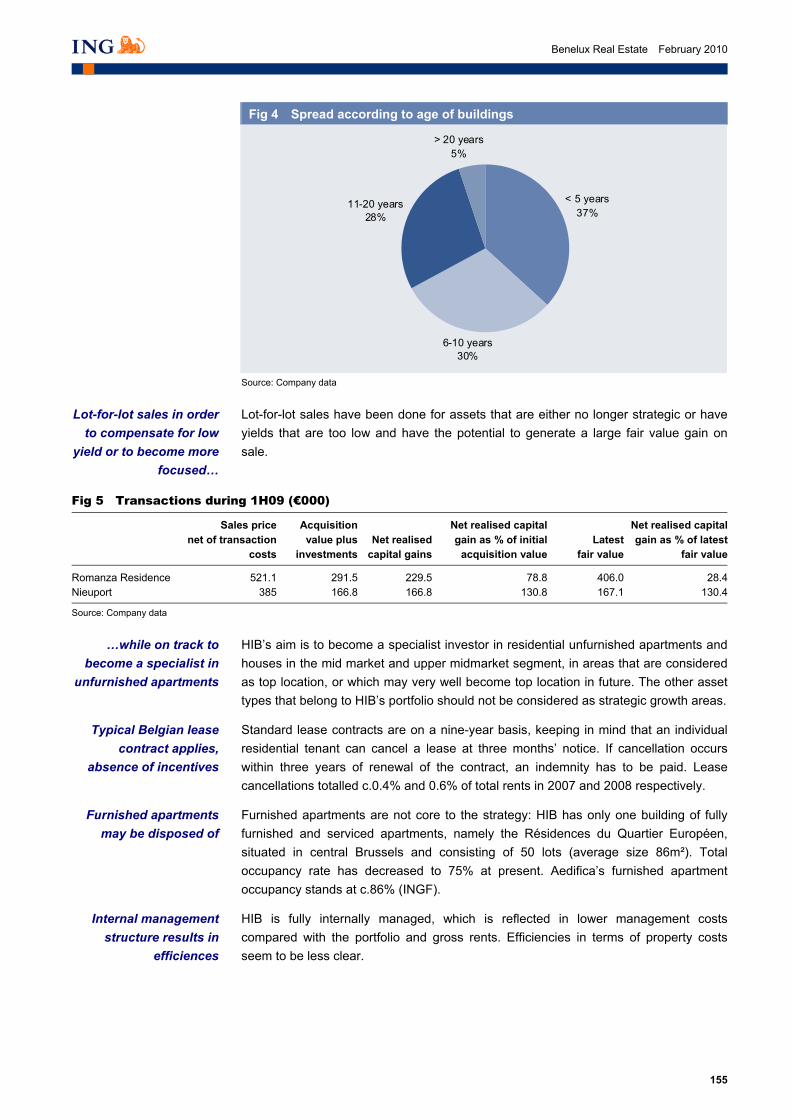
155
Benelux Real Estate February 2010
Fig 4 Spread according to age of buildings
< 5 years37%
6-10 years30%
11-20 years28%
> 20 years5%
Source: Company data
_
Lot-for-lot sales have been done for assets that are either no longer strategic or have yields that are too low and have the potential to generate a large fair value gain on sale.
Fig 5 Transactions during 1H09 (€000)
Sales price net of transaction
costs
Acquisitionvalue plus
investmentsNet realised
capital gains
Net realised capital gain as % of initial
acquisition valueLatest
fair value
Net realised capital gain as % of latest
fair value
Romanza Residence 521.1 291.5 229.5 78.8 406.0 28.4Nieuport 385 166.8 166.8 130.8 167.1 130.4
Source: Company data
_
HIB’s aim is to become a specialist investor in residential unfurnished apartments and houses in the mid market and upper midmarket segment, in areas that are considered as top location, or which may very well become top location in future. The other asset types that belong to HIB’s portfolio should not be considered as strategic growth areas.
Standard lease contracts are on a nine-year basis, keeping in mind that an individual residential tenant can cancel a lease at three months’ notice. If cancellation occurs within three years of renewal of the contract, an indemnity has to be paid. Lease cancellations totalled c.0.4% and 0.6% of total rents in 2007 and 2008 respectively.
Furnished apartments are not core to the strategy: HIB has only one building of fully furnished and serviced apartments, namely the Résidences du Quartier Européen, situated in central Brussels and consisting of 50 lots (average size 86m²). Total occupancy rate has decreased to 75% at present. Aedifica’s furnished apartment occupancy stands at c.86% (INGF).
HIB is fully internally managed, which is reflected in lower management costs compared with the portfolio and gross rents. Efficiencies in terms of property costs seem to be less clear.
…while on track to become a specialist in
unfurnished apartments
Typical Belgian lease contract applies,
absence of incentives
Furnished apartments may be disposed of
Lot-for-lot sales in order to compensate for low
yield or to become more focused…
Internal management structure results in
efficiences

156
Benelux Real Estate February 2010
Figure 6 illustrates that the smaller assets are more management-intensive than the larger assets. As a consequence, an increased focus on lot-for-lot sales of these smaller assets may result in improved efficiency and better operating margins.
Fig 6 Operating charges versus gross rents (%)
0
5
10
1520
25
30
35
40
2007 2008 2007 2008 2007 2008 2007 2008
total portfolio small buildings buildings < €2,5m Buildings > €2,5m
%
Operating charges/gross rents (LH)
Source: Company data
_
Corporate governance Management CEO Xavier Mertens • 54 years old
• CEO since 2002
• Previous experience at Fortis AG real estate asset management and at Anhyp Bank (manager, lending department)
• Former Brussels lawyer
• Masters degrees in law, business analysis and executive education in management
CFO Jean-Luc Colson • 35 years old
• CFO since 2004
• Previous experience at ING Real Estate (Belgium), financial management and at AXA (real estate asset management)
• Degree in accounting
Low operating margins are caused partly by
smaller assets

157
Benelux Real Estate February 2010
Shareholders
Fig 7 Shareholder structure
VOP Group22%
Axa Belgium15%
Assurance Fédérales
4%
Free Float55%
ARCO Group4%
Source: Bloomberg
_
VOP Group has been a shareholder since the contribution in kind related to the Lambermont building (2008). Axa, Assurances Fédérales and Arco Group are also long-term shareholders. The free float is 55%.

158
Benelux Real Estate February 2010
Financials
Fig 8 Profit and loss account (€m)
2008 2009F 2010F 2011F 2012F 2013F 2014F
Gross rents 11.9 12.0 12.2 12.5 12.8 13.1 13.4Rental expenses (0.2) (0.2) (0.2) (0.2) (0.2) (0.2) (0.2)Net rents 11.7 11.8 12.0 12.3 12.6 12.9 13.2Recuperation of costs (0.7) (0.7) (0.7) (0.7) (0.7) (0.7) (0.8)Property result 11.0 11.1 11.3 11.6 11.9 12.2 12.5Total property costs (2.8) (2.8) (2.8) (2.9) (2.9) (3.0) (3.1)Operational result 8.3 8.4 8.5 8.7 8.9 9.1 9.4General costs (0.5) (0.5) (0.5) (0.5) (0.5) (0.5) (0.5)Operational result before portfolio result 7.8 7.9 8.0 8.2 8.4 8.6 8.8FV on investment properties (1.3) (2.8) (1.5) 0.1 0.2 0.4 0.4Operational result after portfolio result 7.3 5.1 6.6 8.3 8.7 9.0 9.2Financial revenues 0.5 0.5 0.5 0.5 0.5 0.4 0.4Interest expenses (2.5) (2.6) (2.6) (2.7) (2.7) (2.8) (2.8)Net interest (1.9) (2.1) (2.1) (2.2) (2.2) (2.3) (2.4)Other financial expenses (0.1) 0.0 0.0 0.0 0.0 0.0 0.0Total financial result (2.0) (2.1) (2.1) (2.2) (2.2) (2.3) (2.4)Result before taxes 5.3 2.9 4.4 6.1 6.4 6.7 6.8Corporate tax 0.0 0.0 0.0 0.0 0.0 0.0 0.0Exit tax 0.0 0.0 0.0 0.0 0.0 0.0 0.0Net result 5.3 2.9 4.4 6.1 6.4 6.7 6.8
Source: Company data, ING estimates _
Fig 9 Per share data (€)
2008 2009F 2010F 2011F 2012F 2013F 2014F
Avg. no. of shares with full entitlement (m) 2,475,725 2,790,465 2,790,465 2,790,465 2,790,465 2,790,465 2,790,465
Net result per share 2.13003 1.045872 1.580321 2.192052 2.290238 2.384668 2.422997Net recurring result per share 2.327739 2.055973 2.108044 2.157634 2.203507 2.245518 2.283569Result on the portfolio per share (0.197709) (1.010101) (0.527724) 0.034418 0.086732 0.13915 0.139428
Proposed dividend 2.36 2.43 2.4786 2.528172 2.578735 2.63031 2.682916
IFRS NAVPS 52.7 51.4 50.5 50.3 50.0 49.8 49.6
Recurring CFPS 2.37 2.06 2.11 2.16 2.20 2.25 2.28Recurring EPS 2.37 2.06 2.11 2.16 2.20 2.25 2.28
Source: Company data, ING estimates
_

159
Benelux Real Estate February 2010
Fig 10 Balance sheet (€m)
2008 2009F 2010F 2011F 2012F 2013F 2014F
Intangible fixed assets 0.0 0.0 0.0 0.0 0.0 0.0 0.0Investment properties 198.1 195.3 193.8 193.9 194.1 194.5 194.9Developments 9.6 9.6 9.6 9.6 9.6 9.6 9.6Other fixed assets 0.1 0.1 0.1 0.1 0.1 0.1 0.1Financial fixed assets 0.1 0.1 0.1 0.1 0.1 0.1 0.1Financial lease receivables 1.5 1.5 1.5 1.5 1.5 1.5 1.5Total fixed assets 209.3 206.5 205.0 205.1 205.4 205.8 206.1Assets held for sale 0.6 0.7 0.7 0.7 0.7 0.7 0.7Financial lease receivables 0.1 0.1 0.1 0.1 0.1 0.1 0.1Trade receivables 0.8 0.8 0.8 0.8 0.8 0.9 0.9Tax receivables and other current assets 2.0 2.0 2.1 2.1 2.2 2.2 2.3Cash and equivalent 1.5 3.1 2.2 3.3 2.4 3.5 2.5Deferred charges and accrued income 0.1 0.1 0.1 0.1 0.1 0.1 0.1Total current assets 5.1 6.8 5.9 7.1 6.3 7.5 6.6Total assets 214.4 213.3 211.0 212.2 211.7 213.2 212.7
Total equity 147.1 143.4 141.1 140.3 139.6 139.0 138.5Long-term financial debt 61.5 64.0 64.0 66.0 66.0 68.0 68.0Other long-term debt 2.1 2.1 2.1 2.1 2.1 2.1 2.1Total long-term debt 63.7 66.1 66.1 68.1 68.1 70.1 70.1Short-term financial debt 0.5 0.5 0.5 0.5 0.5 0.5 0.5Trade debt and other debt 1.6 1.7 1.7 1.8 1.8 1.8 1.9Other short-term obligations 1.3 1.3 1.3 1.4 1.4 1.4 1.5Accrued charges and deferred income 0.2 0.2 0.2 0.3 0.3 0.3 0.3Total short-term debt 3.7 3.7 3.8 3.9 4.0 4.1 4.2Total liabilities 67.3 69.8 69.9 72.0 72.1 74.2 74.3Total equity and liabilities 214.4 213.3 211.0 212.2 211.7 213.2 212.7
Source: Company data, ING estimates _

160
Benelux Real Estate February 2010
Fig 11 Cash flow statements (€m)
2008 2009F 2010F 2011F 2012F 2013F 2014F
Operational result after portfolio result 7.3 5.1 6.6 8.3 8.7 9.0 9.2Interest received 0.5 0.5 0.5 0.5 0.5 0.4 0.4Interest paid (2.5) (2.6) (2.6) (2.7) (2.7) (2.8) (2.8)Taxes 0.0 0.0 0.0 0.0 0.0 0.0 0.0Non-cash adjustments 0.0 0.0 0.0 0.0 0.0 0.0 0.0Depreciations and write-downs on fixed assets 0.0 0.0 0.0 0.0 0.0 0.0 0.0FV change in investment properties 1.3 2.8 1.5 (0.1) (0.2) (0.4) (0.4)Gain on sales on fixed assets 0.0 0.0 0.0 0.0 0.0 0.0 0.0Gain on sales on investment properties (0.8) 0.0 0.0 0.0 0.0 0.0 0.0Total non-cash adjustments 0.5 2.8 1.5 (0.1) (0.2) (0.4) (0.4)Working capital changes 0.0 0.0 0.0 0.0 0.0 0.0 0.0Asset items 0.7 (0.1) (0.1) (0.1) (0.1) (0.1) (0.1)Liability items 0.3 0.0 0.1 0.1 0.1 0.1 0.1Total 1.0 0.0 0.0 0.0 0.0 0.0 0.0
CF from operations 6.8 5.7 5.9 6.0 6.2 6.3 6.4Cash to investments (0.2) 0.0 0.0 0.0 0.0 0.0 0.0Cash to acquisitions 0.0 0.0 0.0 0.0 0.0 0.0 0.0Cash from sales 2.1 0.0 0.0 0.0 0.0 0.0 0.0Project developments (6.4) 0.0 0.0 0.0 0.0 0.0 0.0Other fixed assets 0.0 0.0 0.0 0.0 0.0 0.0 0.0Long-term financial assets 0.0 0.0 0.0 0.0 0.0 0.0 0.0Acquisition of subsidiaries (5.0) 0.0 0.0 0.0 0.0 0.0 0.0CF from investing (9.6) 0.0 0.0 0.0 0.0 0.0 0.0
Change in financial debt 8.8 2.5 0.0 2.0 0.0 2.0 0.0Change in capital (0.1) 0.0 0.0 0.0 0.0 0.0 0.0Dividend previous year (5.0) (6.6) (6.8) (6.9) (7.1) (7.2) (7.3)Change in FV of financial assets and liabilities 0.0 0.0 0.0 0.0 0.0 0.0 0.0CF from financing 3.8 (4.1) (6.8) (4.9) (7.1) (5.2) (7.3)
Net cash movement 0.9 1.6 (0.9) 1.1 (0.9) 1.1 (1.0)Cash BOP 0.6 1.5 3.1 2.2 3.3 2.4 3.5Cash EOP 1.5 3.1 2.2 3.3 2.4 3.5 2.5
Source: Company data, ING estimates
_

161
Benelux Real Estate February 2010
Belgium
Leasinvest Real Estate Diversifying into Luxembourg
Key ratios (%)
2008 2009F
Rental growth 11.0 4.3Operating margin 80.1 79.5Occupancy rate 97.2 96.5
Share data No of shares (m) 4.1Daily turnover (shares, 3M) 1,600Free float (%) 34Enterprise value (€m) 499.2Market cap (€m) 252.5
12-month forecast returns (%) Share price -4.6Dividend 6.612m f'cst total return 2.0
Share price performance
2030405060708090
1/08 7/08 1/09 7/09 1/10
Price BEL 20 (rebased)
Source: ING
LRE is Belgium’s diversified offices, retail and logistics company that has recently shown strong stability. We see little upside potential given its already high occupancy rate, over-rented portfolio and rising cost of financing. HOLD.
Initiating coverage
€62.35 February 2010
Hold
Real Estate
€60.0 Target price (12 month)
LNRE.BR Reuters
Jean-Yves Devloo Amsterdam (31) 20 563 8745 [email protected]
Arjan Knibbe Amsterdam (31) 20 563 8780 [email protected]
LRE is looking to underweight its offices portfolio and increase its weight in retail, achieving a balanced portfolio between Belgium and Luxembourg. The increased development exposure has added stability to the portfolio, but we see a low likelihood of LRE catching near-term positive rent reversion.
Sensitivity of our 2010F EPS to vacancy rate and total LFL
Vacancy rate (%)
2.5 3.5 4.5 5.5 6.5 7.5 8.5 9.5 -3 5.41 5.30 5.20 5.09 4.99 4.88 4.78 4.67 -2 5.51 5.40 5.30 5.19 5.09 4.98 4.88 4.77LFL (%) -1 5.61 5.51 5.40 5.30 5.19 5.09 4.98 4.88 1 5.71 5.61 5.50 5.40 5.29 5.19 5.08 4.98 2 5.82 5.71 5.61 5.50 5.40 5.29 5.19 5.08 3 5.92 5.81 5.71 5.60 5.50 5.39 5.29 5.18 4 6.02 5.91 5.81 5.70 5.60 5.49 5.39 5.28 5 6.12 6.02 5.91 5.81 5.70 5.60 5.49 5.39
Source: ING estimates _
Key ratios and forecasts
2008 (18m) 2009F 2010F 2011F 2012F
EPS adj (€) 6.6 5.0 5.4 5.5 5.6PER (x) 14.1 12.4 11.6 11.4 11.1Net yield (%) 7.1 7.5 7.9 8.0 8.1IFRS NAV per share (€) 65.9 63.7 63.2 65.3 67.7EPRA NNNAV per share (€) N/A N/A N/A N/A N/AP/IFRS NAV (%) 0.94 0.98 0.98 0.95 0.92DPS (€) 3.9 4.0 4.1 4.2 4.3Dividend yield (%) 6.2 6.4 6.6 6.8 6.9LTV (%) 46.9 49.6 48.8 47.2 45.4
Source: Company data, ING estimates _

162
Benelux Real Estate February 2010
Investment case
Leasinvest Real Estate is looking to divest its Belgian offices portfolio (valued at c.€160m), which we rate as secondary, and it wants to invest the proceeds in retail assets spread over Belgium and Luxembourg, becoming a balanced participant between Belgium and Luxembourg. LRE has walked a successful path during the crisis by: (1) making opportunistic acquisitions; and (2) (re)developing assets supporting portfolio resilience and optimal occupancy rates. LRE is looking for acquisition opportunities that allow it to become more diversified in offices and retail in Belgium and Luxembourg. It is considering selling its Belgian secondary offices portfolio and investing the proceeds in retail assets. Looking at an already high occupancy rate and a slightly over-rented portfolio, we believe it is unlikely LRE will reap any fruits from its cyclical exposure.
SWOT Fig 1 SWOT analysis
Strengths Weaknesses
(Re)developments have brought c.€30m of realised and unrealised capital gains over the last two years, supporting occupancy and portfolio valuation. Developments are capped at 10% of the portfolio.Exposure to the troubled financial sector in Luxembourg remains limited thanks to a favourable diversification into retail and logistics
Short debt duration will force refinancing at higher margins. Externally managed. Limited free float at 34%. Complex corporate governance structure (CV instead of NV). Large influence of Ackermans & van Haaren on management. Quality of financial reporting, not in accordance with EPRA best practices recommendations.
Opportunities Threats/risks
Disposal of secondary Belgian offices portfolio and acquire a large retail portfolio with the proceeds. Acquisition of assets in Luxembourg with considerable (re)development potential.
Further deterioration of the real estate market will primarily affect the secondary Belgian offices portfolio, lowering the probability of a near-term sale.
Source: ING _
Risks Because of the contractual nature of a large part of the recurring cash flows, property companies are usually considered to have less risk than most other equity sectors. The risk of property companies bears a strong relation to the amount of development exposure, geographical and sector breakdown, corporate governance and alignment of interest between management and shareholders.
Principally an investor
We believe that LRE is a low-risk property company. It is principally an investor, which is the least risky activity of the four core real estate company activities: investment, development, trading and asset management. LRE’s secondary offices and industrial portfolio add some risk that is to be compensated by the diversification into Luxembourg and into retail assets.
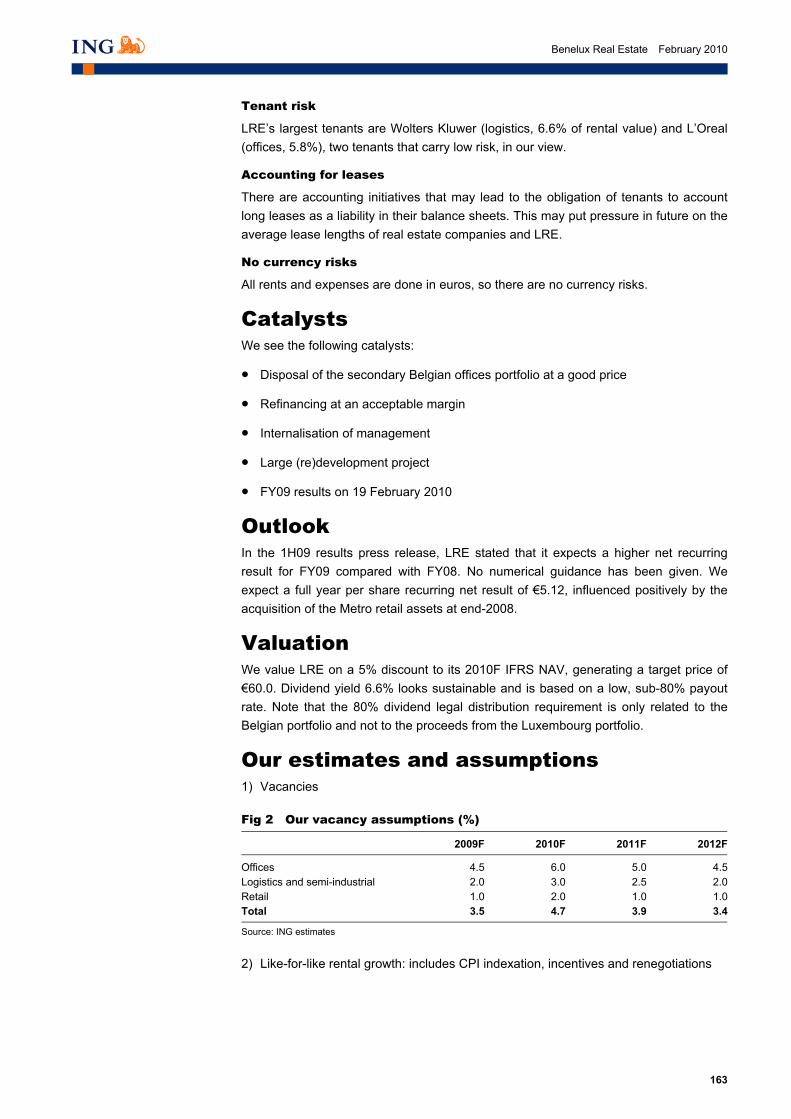
163
Benelux Real Estate February 2010
Tenant risk
LRE’s largest tenants are Wolters Kluwer (logistics, 6.6% of rental value) and L’Oreal (offices, 5.8%), two tenants that carry low risk, in our view.
Accounting for leases
There are accounting initiatives that may lead to the obligation of tenants to account long leases as a liability in their balance sheets. This may put pressure in future on the average lease lengths of real estate companies and LRE.
No currency risks
All rents and expenses are done in euros, so there are no currency risks.
Catalysts We see the following catalysts:
• Disposal of the secondary Belgian offices portfolio at a good price
• Refinancing at an acceptable margin
• Internalisation of management
• Large (re)development project
• FY09 results on 19 February 2010
Outlook In the 1H09 results press release, LRE stated that it expects a higher net recurring result for FY09 compared with FY08. No numerical guidance has been given. We expect a full year per share recurring net result of €5.12, influenced positively by the acquisition of the Metro retail assets at end-2008.
Valuation We value LRE on a 5% discount to its 2010F IFRS NAV, generating a target price of €60.0. Dividend yield 6.6% looks sustainable and is based on a low, sub-80% payout rate. Note that the 80% dividend legal distribution requirement is only related to the Belgian portfolio and not to the proceeds from the Luxembourg portfolio.
Our estimates and assumptions 1) Vacancies
Fig 2 Our vacancy assumptions (%)
2009F 2010F 2011F 2012F
Offices 4.5 6.0 5.0 4.5Logistics and semi-industrial 2.0 3.0 2.5 2.0Retail 1.0 2.0 1.0 1.0Total 3.5 4.7 3.9 3.4
Source: ING estimates
2) Like-for-like rental growth: includes CPI indexation, incentives and renegotiations

164
Benelux Real Estate February 2010
Fig 3 Our total LFL assumptions (%)
2009F 2010F 2011F 2012F
Offices -1.5 -1.0 -0.5 0.0Logistics and semi-industrial -0.8 0.0 1.5 2.0Retail -1.5 1.5 2.0 2.0Total -1.3 -0.5 0.3 0.8
Source: ING estimates
_
3) Portfolio valuation
Fig 4 Our portfolio valuation assumptions (%)
2009F 2010F 2011F 2012F
Belgium -3.0 -2.0 0.0 0.0Luxembourg -2.0 -1.0 0.5 0.5Total -2.6 -1.6 0.2 0.2
Source: ING estimates
_
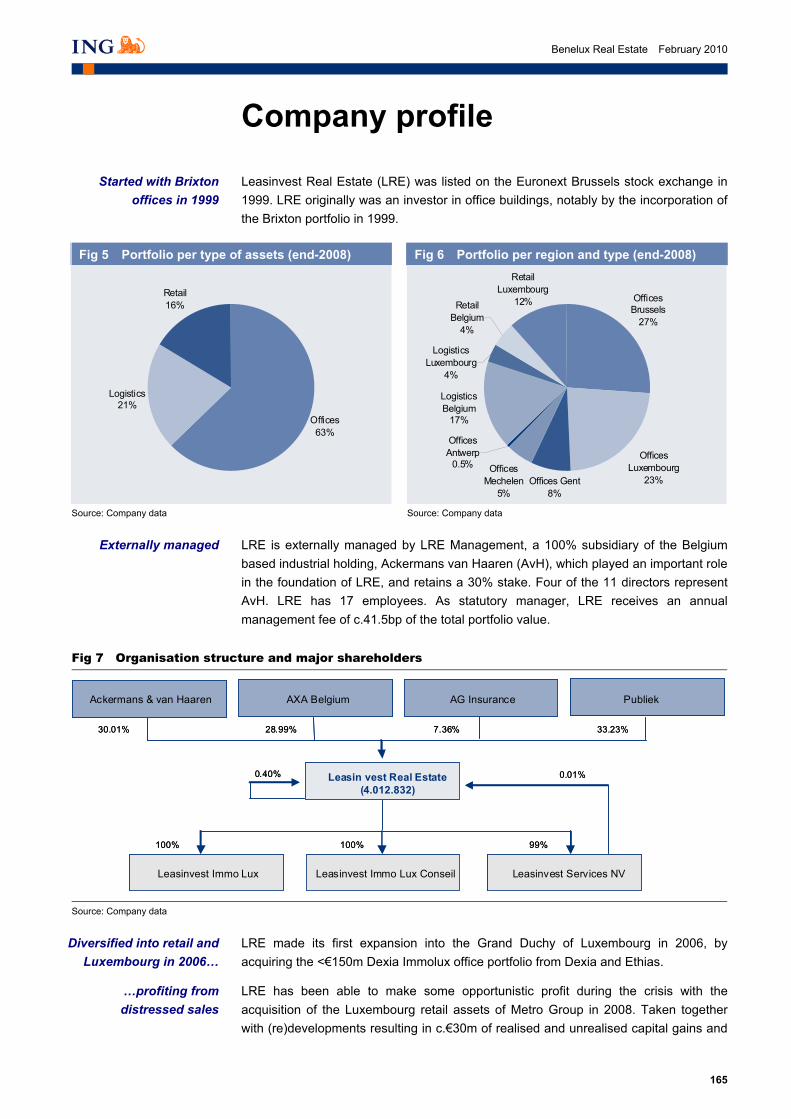
165
Benelux Real Estate February 2010
Company profile
Leasinvest Real Estate (LRE) was listed on the Euronext Brussels stock exchange in 1999. LRE originally was an investor in office buildings, notably by the incorporation of the Brixton portfolio in 1999.
Fig 5 Portfolio per type of assets (end-2008)
Fig 6 Portfolio per region and type (end-2008)
Offices63%
Logistics21%
Retail16%
Offices Brussels
27%
Offices Luxembourg
23%
Logistics Belgium
17%
Retail Luxembourg
12%Retail Belgium
4%
Logistics Luxembourg
4%
Offices Mechelen
5%
Offices Antwerp
0.5%
Offices Gent8%
Source: Company data Source: Company data
LRE is externally managed by LRE Management, a 100% subsidiary of the Belgium based industrial holding, Ackermans van Haaren (AvH), which played an important role in the foundation of LRE, and retains a 30% stake. Four of the 11 directors represent AvH. LRE has 17 employees. As statutory manager, LRE receives an annual management fee of c.41.5bp of the total portfolio value. _
Fig 7 Organisation structure and major shareholders
Ackermans & van Haaren AXA Belgium AG Insurance Publiek
Leasin vest Real Estate(4.012.832)
Leasinvest Immo Lux Leasinvest Immo Lux Conseil Leasinvest Services NV
30.01% 28.99% 7.36% 33.23%
0.01%
100% 100% 99%
0.40%
Ackermans & van Haaren AXA Belgium AG Insurance Publiek
Leasin vest Real Estate(4.012.832)
Leasinvest Immo Lux Leasinvest Immo Lux Conseil Leasinvest Services NV
30.01% 28.99% 7.36% 33.23%
0.01%
100% 100% 99%
0.40%
Source: Company data
_
LRE made its first expansion into the Grand Duchy of Luxembourg in 2006, by acquiring the <€150m Dexia Immolux office portfolio from Dexia and Ethias.
LRE has been able to make some opportunistic profit during the crisis with the acquisition of the Luxembourg retail assets of Metro Group in 2008. Taken together with (re)developments resulting in c.€30m of realised and unrealised capital gains and
Started with Brixton offices in 1999
Diversified into retail and Luxembourg in 2006…
…profiting from distressed sales
Externally managed

166
Benelux Real Estate February 2010
a relatively high occupancy rate of c.96.5%, LRE has showed solid performance recently.
LRE recently decided to decrease its weight in offices to the advantage of retail assets, more specifically, retail parks (LRE has retail warehouses in Luxembourg and Zaventem and the Brussels decentralised area), among others in order to lower overall capex requirements. LRE wants to manage its €200m portfolio of Belgian offices dynamically (of which €130m are in the Brussels decentralised area and periphery) and, if possible, it will divest a substantial part of the offices in future.
Fig 8 Portfolio overview (Brussels)
Source: Company data
_
LRE’s business model has been resilient during the crisis thanks to the realisation of c.€40m in gains at four different development projects in Belgium and Luxembourg (average yield on cost 12-13%). _
Fig 9 Recent (re)developments
Name Cost/investment (€m)
Gain(%)
Gain (€m)
Date Yield on cost (%)
Description
CFM site 6.6 (extension investment)
14.4 (unrealised) 1H08 12-13 Luxembourg office and warehouse extension for tenant, still in portfolio
Bian 11.8 15.2 (realised) 1H09 12-13 Extension and redevelopment of an office in Luxembourg, sold to the Luxembourg Post
Montimmo 12.8 >2.0, unrealised (ING estimate, to be
confirmed)
2H09 6.5 Redevelopment of an office in Luxembourg, fully leased since December 2009
Source: Company data, ING estimates
LRE’s main peers were Cofinimmo and Befimmo. Since the recent diversification into retail assets, a comparison with both Intervest offices and Intervest Retail (the two Belgian REIT subsidiaries of Dutch funds VastNed Offices and VastNed Retail) makes
Stepping away from offices to retail in order to become a diversified
participant…
Small peer group
…creating additional value with c.5-10%
developments
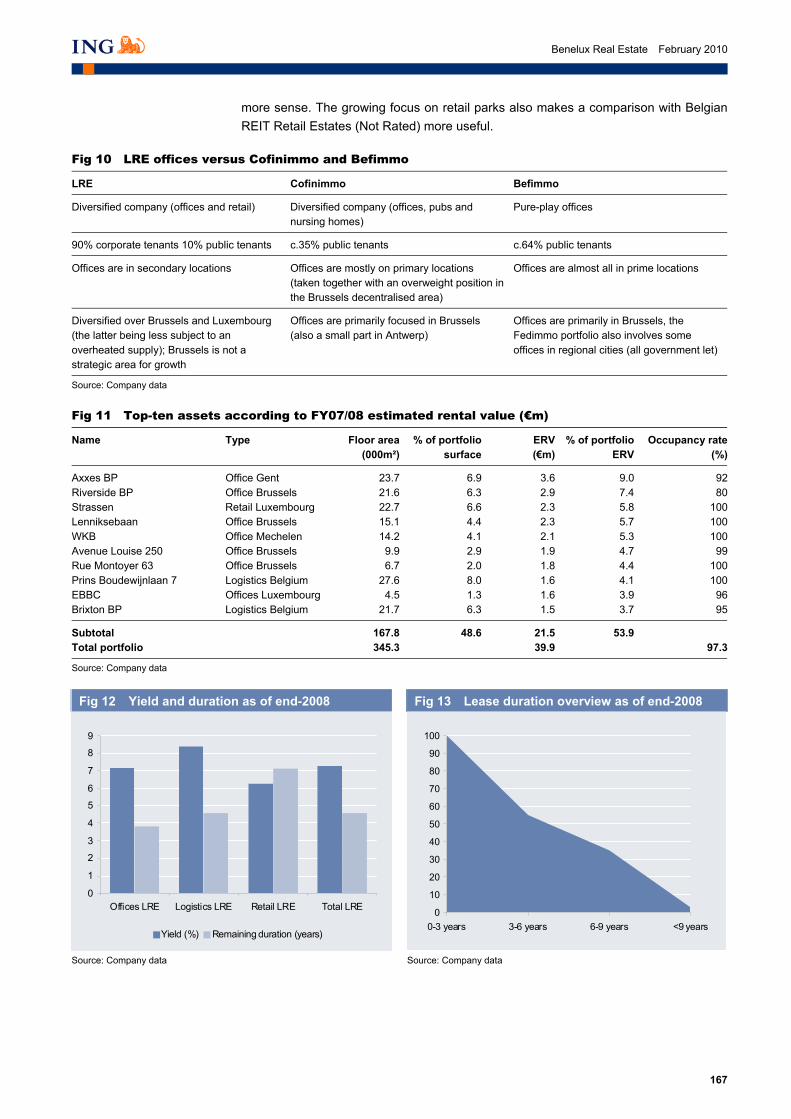
167
Benelux Real Estate February 2010
more sense. The growing focus on retail parks also makes a comparison with Belgian REIT Retail Estates (Not Rated) more useful.
Fig 10 LRE offices versus Cofinimmo and Befimmo
LRE Cofinimmo Befimmo
Diversified company (offices and retail) Diversified company (offices, pubs and nursing homes)
Pure-play offices
90% corporate tenants 10% public tenants c.35% public tenants c.64% public tenants
Offices are in secondary locations Offices are mostly on primary locations (taken together with an overweight position in the Brussels decentralised area)
Offices are almost all in prime locations
Diversified over Brussels and Luxembourg (the latter being less subject to an overheated supply); Brussels is not a strategic area for growth
Offices are primarily focused in Brussels (also a small part in Antwerp)
Offices are primarily in Brussels, the Fedimmo portfolio also involves some offices in regional cities (all government let)
Source: Company data
Fig 11 Top-ten assets according to FY07/08 estimated rental value (€m)
Name Type Floor area(000m²)
% of portfolio surface
ERV (€m)
% of portfolio ERV
Occupancy rate(%)
Axxes BP Office Gent 23.7 6.9 3.6 9.0 92Riverside BP Office Brussels 21.6 6.3 2.9 7.4 80Strassen Retail Luxembourg 22.7 6.6 2.3 5.8 100Lenniksebaan Office Brussels 15.1 4.4 2.3 5.7 100WKB Office Mechelen 14.2 4.1 2.1 5.3 100Avenue Louise 250 Office Brussels 9.9 2.9 1.9 4.7 99Rue Montoyer 63 Office Brussels 6.7 2.0 1.8 4.4 100Prins Boudewijnlaan 7 Logistics Belgium 27.6 8.0 1.6 4.1 100EBBC Offices Luxembourg 4.5 1.3 1.6 3.9 96Brixton BP Logistics Belgium 21.7 6.3 1.5 3.7 95
Subtotal 167.8 48.6 21.5 53.9Total portfolio 345.3 39.9 97.3
Source: Company data _
Fig 12 Yield and duration as of end-2008
Fig 13 Lease duration overview as of end-2008
0
1
2
3
4
5
6
7
8
9
Offices LRE Logistics LRE Retail LRE Total LRE
Yield (%) Remaining duration (years)
0
10
20
30
40
50
60
70
80
90
100
0-3 years 3-6 years 6-9 years <9 years
Source: Company data Source: Company data
_
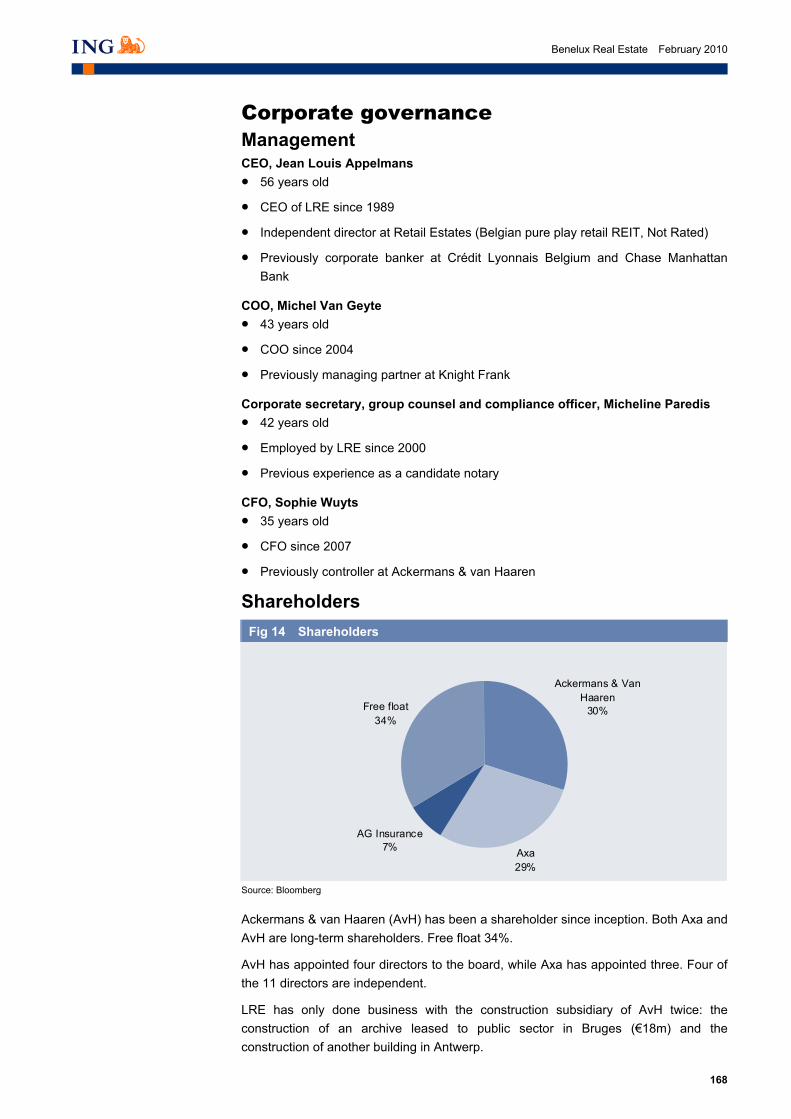
168
Benelux Real Estate February 2010
Corporate governance Management CEO, Jean Louis Appelmans • 56 years old
• CEO of LRE since 1989
• Independent director at Retail Estates (Belgian pure play retail REIT, Not Rated)
• Previously corporate banker at Crédit Lyonnais Belgium and Chase Manhattan Bank
COO, Michel Van Geyte • 43 years old
• COO since 2004
• Previously managing partner at Knight Frank
Corporate secretary, group counsel and compliance officer, Micheline Paredis • 42 years old
• Employed by LRE since 2000
• Previous experience as a candidate notary
CFO, Sophie Wuyts • 35 years old
• CFO since 2007
• Previously controller at Ackermans & van Haaren
Shareholders
Fig 14 Shareholders
Ackermans & Van Haaren
30%
Axa29%
AG Insurance7%
Free float34%
Source: Bloomberg _
Ackermans & van Haaren (AvH) has been a shareholder since inception. Both Axa and AvH are long-term shareholders. Free float 34%.
AvH has appointed four directors to the board, while Axa has appointed three. Four of the 11 directors are independent.
LRE has only done business with the construction subsidiary of AvH twice: the construction of an archive leased to public sector in Bruges (€18m) and the construction of another building in Antwerp.
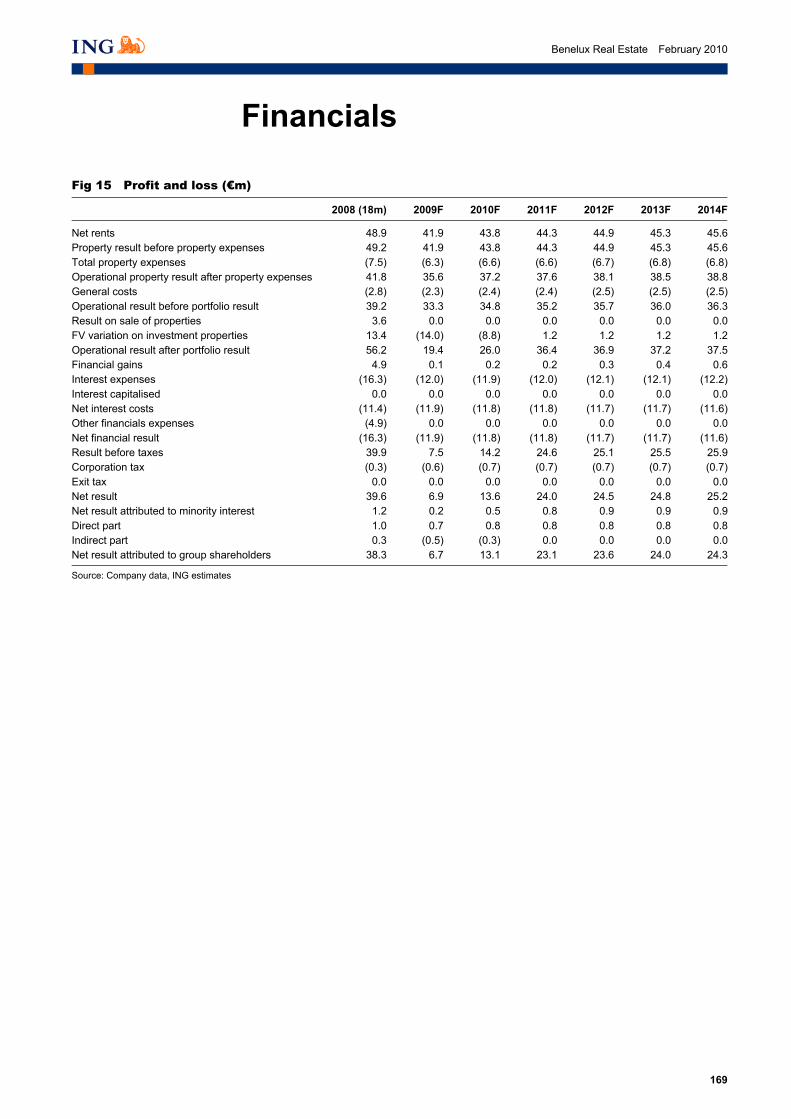
169
Benelux Real Estate February 2010
Financials
Fig 15 Profit and loss (€m)
2008 (18m) 2009F 2010F 2011F 2012F 2013F 2014F
Net rents 48.9 41.9 43.8 44.3 44.9 45.3 45.6Property result before property expenses 49.2 41.9 43.8 44.3 44.9 45.3 45.6Total property expenses (7.5) (6.3) (6.6) (6.6) (6.7) (6.8) (6.8)Operational property result after property expenses 41.8 35.6 37.2 37.6 38.1 38.5 38.8General costs (2.8) (2.3) (2.4) (2.4) (2.5) (2.5) (2.5)Operational result before portfolio result 39.2 33.3 34.8 35.2 35.7 36.0 36.3Result on sale of properties 3.6 0.0 0.0 0.0 0.0 0.0 0.0FV variation on investment properties 13.4 (14.0) (8.8) 1.2 1.2 1.2 1.2Operational result after portfolio result 56.2 19.4 26.0 36.4 36.9 37.2 37.5Financial gains 4.9 0.1 0.2 0.2 0.3 0.4 0.6Interest expenses (16.3) (12.0) (11.9) (12.0) (12.1) (12.1) (12.2)Interest capitalised 0.0 0.0 0.0 0.0 0.0 0.0 0.0Net interest costs (11.4) (11.9) (11.8) (11.8) (11.7) (11.7) (11.6)Other financials expenses (4.9) 0.0 0.0 0.0 0.0 0.0 0.0Net financial result (16.3) (11.9) (11.8) (11.8) (11.7) (11.7) (11.6)Result before taxes 39.9 7.5 14.2 24.6 25.1 25.5 25.9Corporation tax (0.3) (0.6) (0.7) (0.7) (0.7) (0.7) (0.7)Exit tax 0.0 0.0 0.0 0.0 0.0 0.0 0.0Net result 39.6 6.9 13.6 24.0 24.5 24.8 25.2Net result attributed to minority interest 1.2 0.2 0.5 0.8 0.9 0.9 0.9Direct part 1.0 0.7 0.8 0.8 0.8 0.8 0.8Indirect part 0.3 (0.5) (0.3) 0.0 0.0 0.0 0.0Net result attributed to group shareholders 38.3 6.7 13.1 23.1 23.6 24.0 24.3
Source: Company data, ING estimates _
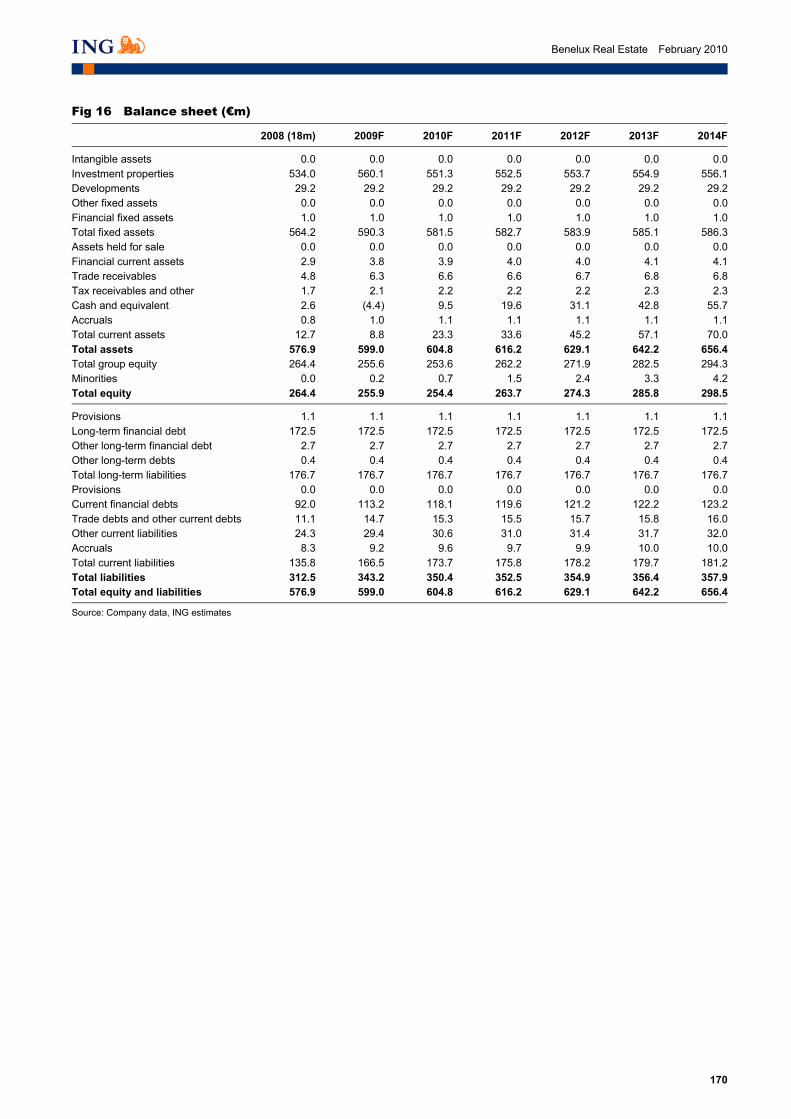
170
Benelux Real Estate February 2010
Fig 16 Balance sheet (€m)
2008 (18m) 2009F 2010F 2011F 2012F 2013F 2014F
Intangible assets 0.0 0.0 0.0 0.0 0.0 0.0 0.0Investment properties 534.0 560.1 551.3 552.5 553.7 554.9 556.1Developments 29.2 29.2 29.2 29.2 29.2 29.2 29.2Other fixed assets 0.0 0.0 0.0 0.0 0.0 0.0 0.0Financial fixed assets 1.0 1.0 1.0 1.0 1.0 1.0 1.0Total fixed assets 564.2 590.3 581.5 582.7 583.9 585.1 586.3Assets held for sale 0.0 0.0 0.0 0.0 0.0 0.0 0.0Financial current assets 2.9 3.8 3.9 4.0 4.0 4.1 4.1Trade receivables 4.8 6.3 6.6 6.6 6.7 6.8 6.8Tax receivables and other 1.7 2.1 2.2 2.2 2.2 2.3 2.3Cash and equivalent 2.6 (4.4) 9.5 19.6 31.1 42.8 55.7Accruals 0.8 1.0 1.1 1.1 1.1 1.1 1.1Total current assets 12.7 8.8 23.3 33.6 45.2 57.1 70.0Total assets 576.9 599.0 604.8 616.2 629.1 642.2 656.4Total group equity 264.4 255.6 253.6 262.2 271.9 282.5 294.3Minorities 0.0 0.2 0.7 1.5 2.4 3.3 4.2Total equity 264.4 255.9 254.4 263.7 274.3 285.8 298.5
Provisions 1.1 1.1 1.1 1.1 1.1 1.1 1.1Long-term financial debt 172.5 172.5 172.5 172.5 172.5 172.5 172.5Other long-term financial debt 2.7 2.7 2.7 2.7 2.7 2.7 2.7Other long-term debts 0.4 0.4 0.4 0.4 0.4 0.4 0.4Total long-term liabilities 176.7 176.7 176.7 176.7 176.7 176.7 176.7Provisions 0.0 0.0 0.0 0.0 0.0 0.0 0.0Current financial debts 92.0 113.2 118.1 119.6 121.2 122.2 123.2Trade debts and other current debts 11.1 14.7 15.3 15.5 15.7 15.8 16.0Other current liabilities 24.3 29.4 30.6 31.0 31.4 31.7 32.0Accruals 8.3 9.2 9.6 9.7 9.9 10.0 10.0Total current liabilities 135.8 166.5 173.7 175.8 178.2 179.7 181.2Total liabilities 312.5 343.2 350.4 352.5 354.9 356.4 357.9Total equity and liabilities 576.9 599.0 604.8 616.2 629.1 642.2 656.4
Source: Company data, ING estimates _

171
Benelux Real Estate February 2010
Fig 17 Cash flow statement (€m)
2008 (18m) 2009F 2010F 2011F 2012F 2013F 2014F
Net result 39.6 6.9 13.6 24.0 24.5 24.8 25.2Non-cash adjustments 0.0 0.0 0.0 0.0 0.0 0.0 0.0Depreciations and amortizations 0.1 0.0 0.0 0.0 0.0 0.0 0.0FV on investment properties (13.4) 14.0 8.8 (1.2) (1.2) (1.2) (1.2)Provisions (0.6) 0.0 0.0 0.0 0.0 0.0 0.0Gratuities spreading (0.6) 0.0 0.0 0.0 0.0 0.0 0.0FV on financial derivatives 4.4 0.0 0.0 0.0 0.0 0.0 0.0Other non-recurring transactions (0.3) 0.0 1.0 2.0 3.0 4.0 5.0Gain on sale of fixed assets (3.6) 0.0 0.0 0.0 0.0 0.0 0.0Working capital items 0.0 0.0 0.0 0.0 0.0 0.0 0.0Asset items Financial current assets 6.3 (0.9) (0.2) 0.0 (0.1) 0.0 0.0Trade debtors (0.7) (1.5) (0.3) (0.1) (0.1) (0.1) (0.1)Tax debtors and other current assets (1.2) (0.4) (0.1) 0.0 0.0 0.0 0.0Accruals 0.5 (0.3) 0.0 0.0 0.0 0.0 0.0Liability items Trade debts and other current liabilities (0.2) 3.5 0.6 0.2 0.2 0.1 0.1Other current liabilities 22.0 5.1 1.3 0.4 0.4 0.3 0.3Accruals 0.1 0.9 0.4 0.1 0.1 0.1 0.1CF from operations 52.4 27.2 25.1 25.3 26.8 28.0 29.4
Investment properties (51.9) (40.0) 0.0 0.0 0.0 0.0 0.0Project developments (18.1) 0.0 0.0 0.0 0.0 0.0 0.0Intangible fixed assets and other fixed assets 0.0 0.0 0.0 0.0 0.0 0.0 0.0Financial fixed assets (35.3) 0.0 0.0 0.0 0.0 0.0 0.0Assets held for sale 13.1 0.0 0.0 0.0 0.0 0.0 0.0Consolidation of new participations 0.1 0.0 0.0 0.0 0.0 0.0 0.0CF from Investing (92.2) (40.0) 0.0 0.0 0.0 0.0 0.0
Change in financial debt 72.8 21.2 4.9 1.4 1.6 1.0 1.0Change in other financial debts 0.0 0.0 0.0 0.0 0.0 0.0 0.0Change in other liabilities 0.0 0.0 0.0 0.0 0.0 0.0 0.0Change in capital and premium accounts 0.0 0.0 0.0 0.0 0.0 0.0 0.0Change in own shares (1.0) 0.0 0.0 0.0 0.0 0.0 0.0Last year dividend (15.5) (15.4) (16.1) (16.6) (16.9) (17.3) (17.5)Current year interim dividend (15.4) 0.0 0.0 0.0 0.0 0.0 0.0Increase (+) decrease (-) of fair value of fin derivatives 0.0 0.0 0.0 0.0 0.0 0.0 0.0Mutation expenses increase (+) or decrease (-) 0.0 0.0 0.0 0.0 0.0 0.0 0.0CF from financing 40.9 5.7 (11.2) (15.2) (15.3) (16.3) (16.5)
Net CF 1.1 (7.0) 13.9 10.1 11.5 11.7 12.9Cash BOP 1.5 2.6 (4.4) 9.5 19.6 31.1 42.8Cash EOP 2.6 (4.4) 9.5 19.6 31.1 42.8 55.7
Source: Company data, ING estimates _
Fig 18 Per share data (€)
2008 (18m) 2009F 2010F 2011F 2012F 2013F 2014F
Shares 4,012,832 4,012,832 4,012,832 4,012,832 4,012,832 4,012,832 4,012,832
Net result per share 9.55 1.66 3.26 5.77 5.88 5.97 6.06Recurring result per share 6.62 5.01 5.38 5.48 5.59 5.68 5.77Indirect result per share 2.93 (3.36) (2.11) 0.29 0.29 0.29 0.29
Dividend per share 3.85 4.010886 4.139126 4.217301 4.307491 4.372318 4.442832
IFRS NAVPS 65.9 63.7 63.2 65.3 67.7 70.4 73.3
Source: Company data, ING estimates
_

172
Benelux Real Estate February 2010
This page is left blank intentionally
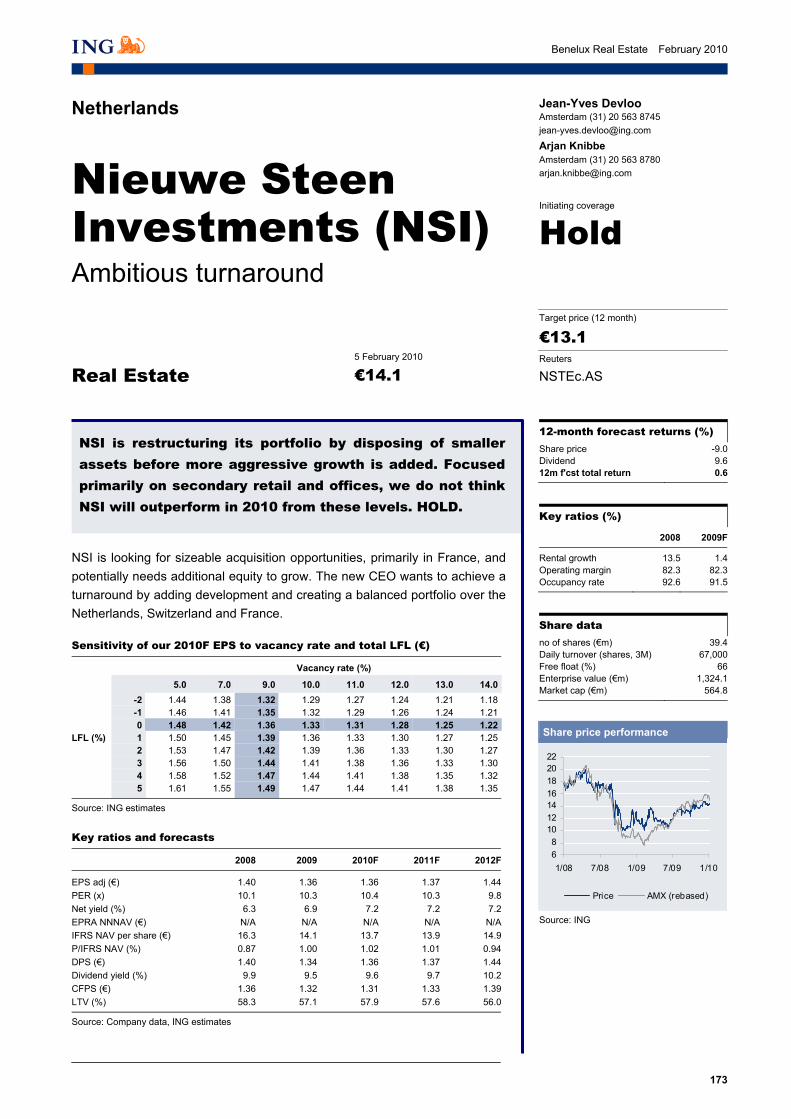
173
Benelux Real Estate February 2010
Netherlands
Nieuwe Steen Investments (NSI) Ambitious turnaround
Key ratios (%)
2008 2009F
Rental growth 13.5 1.4Operating margin 82.3 82.3Occupancy rate 92.6 91.5
Share data no of shares (€m) 39.4Daily turnover (shares, 3M) 67,000Free float (%) 66Enterprise value (€m) 1,324.1Market cap (€m) 564.8
12-month forecast returns (%) Share price -9.0Dividend 9.612m f'cst total return 0.6
Share price performance
68
10121416182022
1/08 7/08 1/09 7/09 1/10
Price AMX (rebased)
Source: ING
NSI is restructuring its portfolio by disposing of smaller assets before more aggressive growth is added. Focused primarily on secondary retail and offices, we do not think NSI will outperform in 2010 from these levels. HOLD.
Initiating coverage
€14.15 February 2010
Hold
Real Estate
€13.1 Target price (12 month)
NSTEc.AS Reuters
Jean-Yves Devloo Amsterdam (31) 20 563 8745 [email protected]
Arjan Knibbe Amsterdam (31) 20 563 8780 [email protected]
NSI is looking for sizeable acquisition opportunities, primarily in France, and potentially needs additional equity to grow. The new CEO wants to achieve a turnaround by adding development and creating a balanced portfolio over the Netherlands, Switzerland and France.
Sensitivity of our 2010F EPS to vacancy rate and total LFL (€)
Vacancy rate (%)
5.0 7.0 9.0 10.0 11.0 12.0 13.0 14.0 -2 1.44 1.38 1.32 1.29 1.27 1.24 1.21 1.18 -1 1.46 1.41 1.35 1.32 1.29 1.26 1.24 1.21 0 1.48 1.42 1.36 1.33 1.31 1.28 1.25 1.22LFL (%) 1 1.50 1.45 1.39 1.36 1.33 1.30 1.27 1.25 2 1.53 1.47 1.42 1.39 1.36 1.33 1.30 1.27 3 1.56 1.50 1.44 1.41 1.38 1.36 1.33 1.30 4 1.58 1.52 1.47 1.44 1.41 1.38 1.35 1.32 5 1.61 1.55 1.49 1.47 1.44 1.41 1.38 1.35
Source: ING estimates _
Key ratios and forecasts
2008 2009 2010F 2011F 2012F
EPS adj (€) 1.40 1.36 1.36 1.37 1.44PER (x) 10.1 10.3 10.4 10.3 9.8Net yield (%) 6.3 6.9 7.2 7.2 7.2EPRA NNNAV (€) N/A N/A N/A N/A N/AIFRS NAV per share (€) 16.3 14.1 13.7 13.9 14.9P/IFRS NAV (%) 0.87 1.00 1.02 1.01 0.94DPS (€) 1.40 1.34 1.36 1.37 1.44Dividend yield (%) 9.9 9.5 9.6 9.7 10.2CFPS (€) 1.36 1.32 1.31 1.33 1.39LTV (%) 58.3 57.1 57.9 57.6 56.0
Source: Company data, ING estimates _

174
Benelux Real Estate February 2010
Investment case
Nieuwe Steen Investment has completely restructured its board. A former Wereldhave board member, Johan Buijs, started as CEO in 2008, and in 2009 a new CFO, Daniel van Dongen, joined the management. NSI wants to achieve a turnaround by: (1) spicing up its operational gearing by adding more development; (2) disposing of smaller, management-intensive assets; (3) fully internalising property management; (4) doubling the size of the portfolio by c.2012, spread evenly over quality secondary retail and office assets.
Highlights Timing and financing of the above turnaround will drive the share price on NSI over the next few years. The growth is potentially to be financed by an equity issue to enable rapid entry into France. We believe the restructuring of the portfolio, by further disposal of smaller assets, should have a higher priority than the acquisition of a French portfolio or Swiss growth. However, we understand that the markets will not remain attractive to enter for years, and if financing is available 2010 could turn out to be a good entry point for France.
The focus on daily shopping in the retail portfolio should support earnings, however the secondary offices portfolio will probably suffer from increasing vacancies and will require significant incentives, adding cyclicality to the business model. We like the idea of refocusing the office portfolio towards the edges of the central business districts of larger towns in the west of the Netherlands. We find that the theoretical net yield of 7.6%, with a 9% vacancy rewards risks appropriately.
The development pipeline will be expanded and management has a refreshing cost awareness that has resulted in a small pipeline at a yield of cost of 10%. In addition, management has identified a further €75m of extensions. A lot of the above new elements seem to be priced in and the risks of execution of the international expansion seem underestimated, in our view.
We estimate a cut in DPS from €1.36 to €1.25 in 2010. After this cut, the dividend yield of above 9% seems sustainable, unless vacancy rates rise steeply. We show the sensitivities of recurring EPS to vacancy rates on the cover of this company report. A 2% increase from 9% to 11% vacancy would knock €0.05 off our 2010F EPS of €1.36. We initiate on Nieuwe Steen Investments with a HOLD.
As a part of its restructuring strategy, NSI is likely to move its head office from Hoorn to Amsterdam.
Grocery anchored small and medium-sized retail and edge-of-CBD multi-
tenant offices
Beefing up development at a 10% yield on cost
Dividend cut ahead, but yield 9% post-cut
Turnaround financing and timing will be key
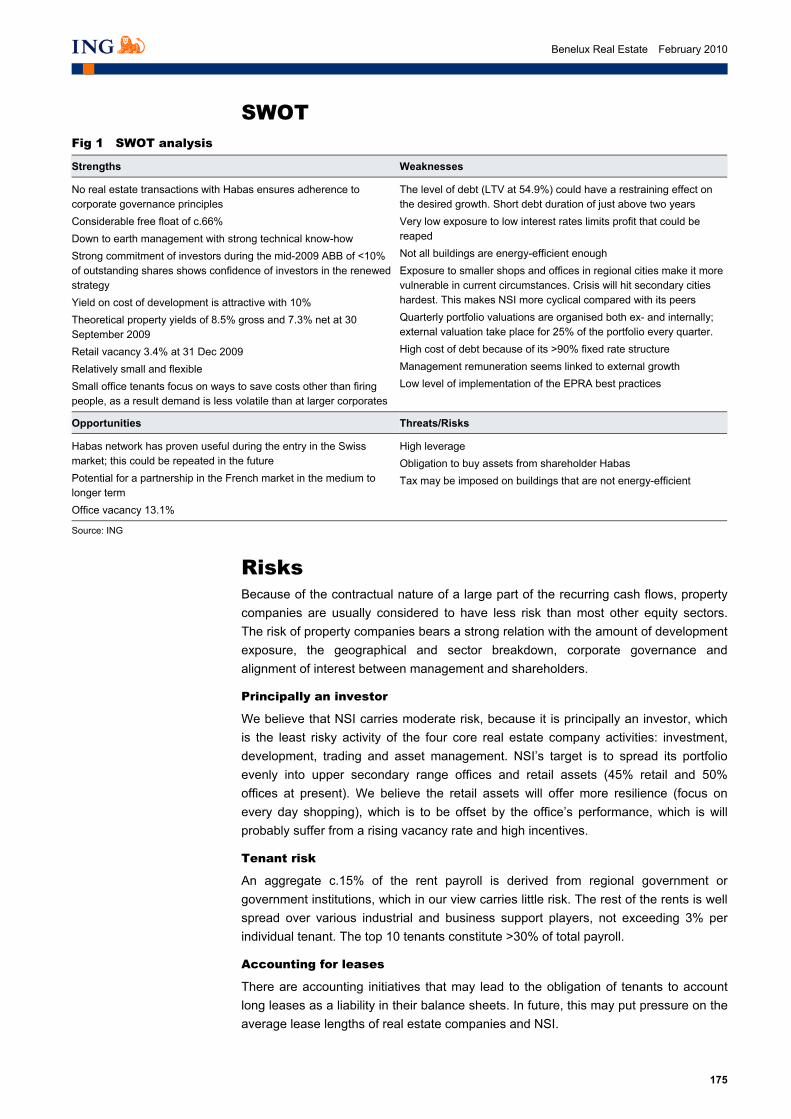
175
Benelux Real Estate February 2010
SWOT Fig 1 SWOT analysis
Strengths Weaknesses
No real estate transactions with Habas ensures adherence to corporate governance principles Considerable free float of c.66% Down to earth management with strong technical know-how Strong commitment of investors during the mid-2009 ABB of <10% of outstanding shares shows confidence of investors in the renewed strategy Yield on cost of development is attractive with 10% Theoretical property yields of 8.5% gross and 7.3% net at 30 September 2009 Retail vacancy 3.4% at 31 Dec 2009 Relatively small and flexible Small office tenants focus on ways to save costs other than firing people, as a result demand is less volatile than at larger corporates
The level of debt (LTV at 54.9%) could have a restraining effect on the desired growth. Short debt duration of just above two years Very low exposure to low interest rates limits profit that could be reaped Not all buildings are energy-efficient enough Exposure to smaller shops and offices in regional cities make it more vulnerable in current circumstances. Crisis will hit secondary cities hardest. This makes NSI more cyclical compared with its peers Quarterly portfolio valuations are organised both ex- and internally; external valuation take place for 25% of the portfolio every quarter. High cost of debt because of its >90% fixed rate structure Management remuneration seems linked to external growth Low level of implementation of the EPRA best practices
Opportunities Threats/Risks
Habas network has proven useful during the entry in the Swiss market; this could be repeated in the future Potential for a partnership in the French market in the medium to longer term Office vacancy 13.1%
High leverage Obligation to buy assets from shareholder Habas Tax may be imposed on buildings that are not energy-efficient
Source: ING
_
Risks Because of the contractual nature of a large part of the recurring cash flows, property companies are usually considered to have less risk than most other equity sectors. The risk of property companies bears a strong relation with the amount of development exposure, the geographical and sector breakdown, corporate governance and alignment of interest between management and shareholders.
Principally an investor
We believe that NSI carries moderate risk, because it is principally an investor, which is the least risky activity of the four core real estate company activities: investment, development, trading and asset management. NSI’s target is to spread its portfolio evenly into upper secondary range offices and retail assets (45% retail and 50% offices at present). We believe the retail assets will offer more resilience (focus on every day shopping), which is to be offset by the office’s performance, which is will probably suffer from a rising vacancy rate and high incentives.
Tenant risk
An aggregate c.15% of the rent payroll is derived from regional government or government institutions, which in our view carries little risk. The rest of the rents is well spread over various industrial and business support players, not exceeding 3% per individual tenant. The top 10 tenants constitute >30% of total payroll.
Accounting for leases
There are accounting initiatives that may lead to the obligation of tenants to account long leases as a liability in their balance sheets. In future, this may put pressure on the average lease lengths of real estate companies and NSI.

176
Benelux Real Estate February 2010
International expansion
We believe that the international growth of NS bears some risk, as traditionally the NSI organisation has been very domestically focused. Although new management added an international perspective, it takes time for this perspective to be understood and supported in a company.
Catalysts In our view, the major catalysts involve:
• Successful deleveraging at low cost
• Limit vacancy increase, especially in the offices portfolio, where we expect vacancies to top 14% in mid-2010, compared with 5% for the retail portfolio)
• Successful disposal of the smaller assets (>€5m) portfolio
• Attraction of a partner to enter the French market
• Adding developments with attractive yield on cost
• 1Q results are due on 29 April
• The potential improvement of the valuation methodology moving more in line with EPRA recommendations (25% externally each quarter, 100% internally every quarter)
Outlook In the longer run, NSI said it wants to grow further in Switzerland and enter the French market. Given the uncertain situation on the French market, and the low likelihood of an establishment of an immediate French real estate partnership, we do not expect any major French transactions to occur before 2H10 or even 2011.
Instead, we favour a fully professional and internalised Swiss portfolio, along with a redevelopment of the existing portfolio (in order to increase like-for-like and to decrease incentives on lease renewals), subject to the favourable attraction of new financing.
We also expect the sale of the smaller assets (<€5m) will continue during 2010. As opposed to the larger assets, management reported there will still be a market for smaller assets.
Valuation We value NSI in line with its 2010F IFRS NAV, on the back of the risk and quality associated with the offices portfolio and with the execution risk of the international expansion strategy, which, up to now, has only resulted in a relatively small Swiss portfolio (8% of the September 2009 portfolio). The dividend yield looks attractive at 9.6%, assuming full distribution of the FY09 direct result.
We would prioritise restructuring over
growth…
…redevelopments should improve LFL and
vacancy levels…
…and a continued focus on disposal of smaller
assets
International expansion bears risk

177
Benelux Real Estate February 2010
Consensus overview Fig 2 Consensus EPS overview (€)
2008 2009 2010F 2011F
Consensus 1.4 1.36 1.30 1.32ING 1.40 1.36 1.36 1.37Difference 0.00 0.00 0.06 0.05Difference (%) 0.0 0.0 4.3 3.9
Source: Reuters, ING estimates
_
Our estimates and assumptions 1) Vacancies: we assume vacancies peak in mid-2010, with the office portfolio
underperforming the retail portfolio on the back of higher cyclical exposure.
Fig 3 Our vacancy assumptions (%)
2010F 2011F 2012F
Offices 12.0 9.0 7.0Retail 3.8 3.0 3.0Other 8.5 6.3 6.0Total 8.6 6.5 5.4
Source: ING estimates
_
2) Total LFL rental growth: includes incentives and renegotiations. While NSI is trying to replace incentives by capital expenditure and small consulting favours, we do not expect this to prevent more incentives, especially for the offices portfolio.
Fig 4 Total LFL assumptions (%)
2010F 2011F 2012F
Offices 0.4 2.0 2.0Retail -0.6 2.0 2.0Other 0.5 1.8 1.8Total 1.4 2.0 2.0
Source: ING estimates
_
3) Portfolio valuation: we expect value adjustments for the portfolio to flatten out, but assume 0.9% further downward adjustments into 2010. We believe our 2011 and 2012 zero estimates for portfolio value increases are conservative.
Fig 5 Our portfolio valuation assumptions (%)
2010F 2011F 2012F
Offices -1.4 -0.5 3.0Retail -0.5 2.0 3.0Other 0.0 0.0 2.5Total -0.9 0.6 3.0
Source: ING estimates
_
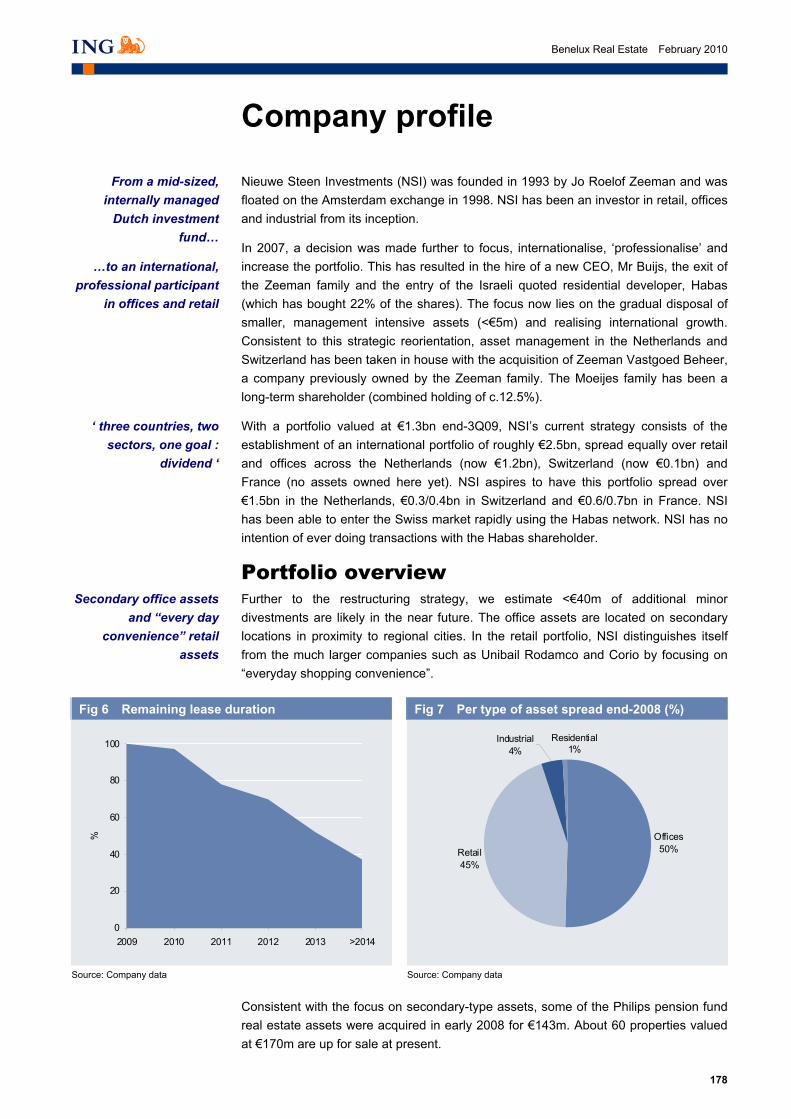
178
Benelux Real Estate February 2010
Company profile
Nieuwe Steen Investments (NSI) was founded in 1993 by Jo Roelof Zeeman and was floated on the Amsterdam exchange in 1998. NSI has been an investor in retail, offices and industrial from its inception.
In 2007, a decision was made further to focus, internationalise, ‘professionalise’ and increase the portfolio. This has resulted in the hire of a new CEO, Mr Buijs, the exit of the Zeeman family and the entry of the Israeli quoted residential developer, Habas (which has bought 22% of the shares). The focus now lies on the gradual disposal of smaller, management intensive assets (<€5m) and realising international growth. Consistent to this strategic reorientation, asset management in the Netherlands and Switzerland has been taken in house with the acquisition of Zeeman Vastgoed Beheer, a company previously owned by the Zeeman family. The Moeijes family has been a long-term shareholder (combined holding of c.12.5%).
With a portfolio valued at €1.3bn end-3Q09, NSI’s current strategy consists of the establishment of an international portfolio of roughly €2.5bn, spread equally over retail and offices across the Netherlands (now €1.2bn), Switzerland (now €0.1bn) and France (no assets owned here yet). NSI aspires to have this portfolio spread over €1.5bn in the Netherlands, €0.3/0.4bn in Switzerland and €0.6/0.7bn in France. NSI has been able to enter the Swiss market rapidly using the Habas network. NSI has no intention of ever doing transactions with the Habas shareholder.
Portfolio overview Further to the restructuring strategy, we estimate <€40m of additional minor divestments are likely in the near future. The office assets are located on secondary locations in proximity to regional cities. In the retail portfolio, NSI distinguishes itself from the much larger companies such as Unibail Rodamco and Corio by focusing on “everyday shopping convenience”.
Fig 6 Remaining lease duration
Fig 7 Per type of asset spread end-2008 (%)
0
20
40
60
80
100
2009 2010 2011 2012 2013 >2014
%
Offices 50%Retail
45%
Residential1%
Industrial 4%
Source: Company data Source: Company data
_
Consistent with the focus on secondary-type assets, some of the Philips pension fund real estate assets were acquired in early 2008 for €143m. About 60 properties valued at €170m are up for sale at present.
Secondary office assets and “every day
convenience” retail assets
From a mid-sized, internally managed
Dutch investment fund…
‘ three countries, two sectors, one goal :
dividend ‘
…to an international,
professional participant in offices and retail

179
Benelux Real Estate February 2010
In 2008, NSI abandoned its interest in Austria (too small and too isolated) and Germany (unfavourable tax reforms), and said it was only interested in Switzerland, France and the Netherlands.
Fig 8 Current portfolio composition (€1.3bn end-September 2009)
Fig 9 Target portfolio composition (2010F, c.€2.5bn)
Netherlands92%
Switzerland8%
Netherlands60%Switzerland
14%
France26%
Source: Company data Source: ING estimates
_
NSI’s main presence in Switzerland is in Zug and Thalwil (offices, c.€50m end-2008), and Fribourg (retail, c.€51m end-2008). The remaining industrial and residential assets make up part of the disposal programme. The Swiss growth is focused on retail, with a maximum asset size of €50m, which means asset sizes of 8,000-20,000m2. Management has stated that it could decide to hold the Swiss portfolio in a fund which it could invite others to enter, in order to have critical mass without the capital requirement. The company has even said that the duration of such a fund would be five years.
Tenants
Fig 10 Top office tenants according to FY08 rent revenues
Name Sector FY08 rent revenues (€m)
% of total FY08 offices rents
Rijksgebouwendienst Public 4.5 7.5Gemeente Rotterdam Public 2.9 4.7Stichting de Thuiszorg Icare Public 2.0 3.3Getronics Pink Roccade Nederland B.V. ICT 1.8 2.9Imtech Industry/trade 1.7 2.9Ziggo Industry/trade 1.7 2.8Gemeente Heerlen Public 1.5 2.4Ernst & Young Accountants Business support 1.2 1.9Stichting ROC Amsterdam Business support 1.0 1.7Friesland Coberco Dairy Foods B.V. Industry/trade 0.8 1.4Total 19.1 31.5
Source: Company data
_
NSI stated that with the home furnishing tenants, who feel the crisis severely, management is discussing the incorporation of turnover rents. This is very unusual in the Netherlands.
Geographical focus determined by political,
legal and tax similarities to the Netherlands
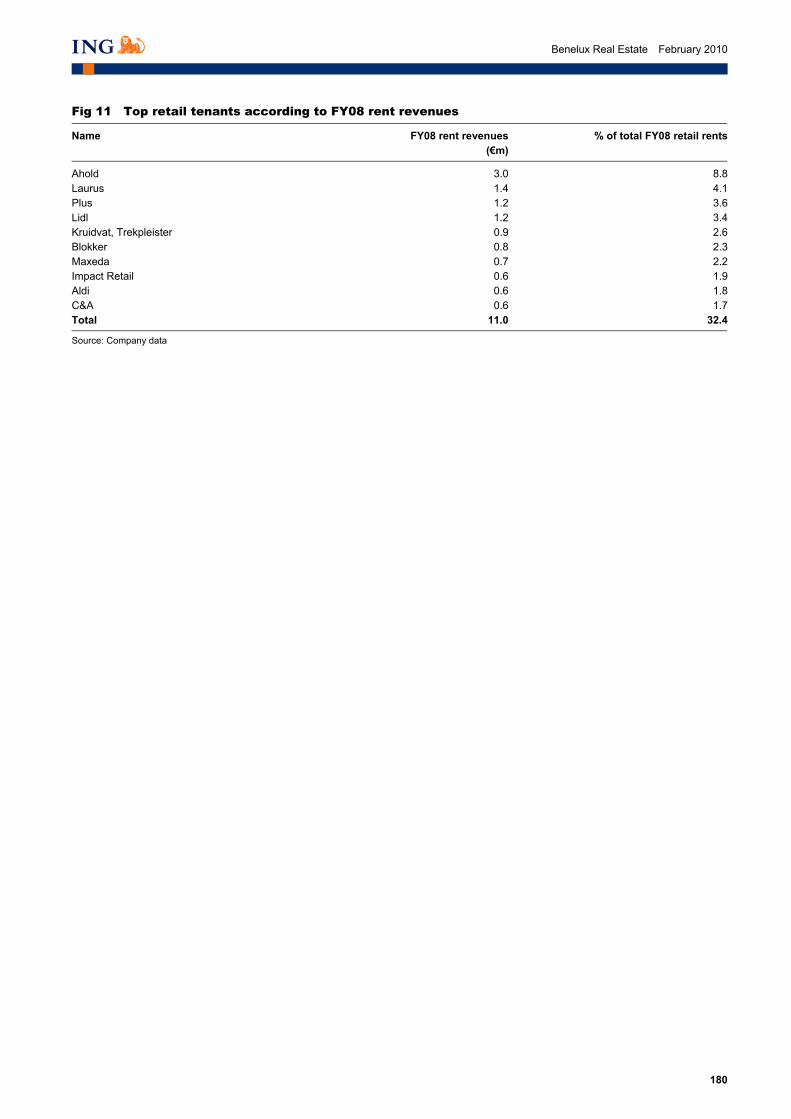
180
Benelux Real Estate February 2010
Fig 11 Top retail tenants according to FY08 rent revenues
Name FY08 rent revenues (€m)
% of total FY08 retail rents
Ahold 3.0 8.8Laurus 1.4 4.1Plus 1.2 3.6Lidl 1.2 3.4Kruidvat, Trekpleister 0.9 2.6Blokker 0.8 2.3Maxeda 0.7 2.2Impact Retail 0.6 1.9Aldi 0.6 1.8C&A 0.6 1.7Total 11.0 32.4
Source: Company data
_

181
Benelux Real Estate February 2010
Corporate governance Management CEO Johan Buijs (1965) • Johan Buijs was formerly a member of the board of Wereldhave NV. Before he
joined Wereldhave in 2000, he held a number of positions at various technical consultants.
CFO Daniel van Dongen (1971) • Daniel van Dongen was formerly a group controller at Wereldhave NV. He is a
chartered controller and has international experience.
We believe that some of the elements of the remuneration of Mr Buijs are focused too much on acquisition targets. The sizes of the Swiss and French portfolios have a combined 40% weighting in the long-term variable remuneration of the CEO. Too much pressure on acquisition targets can lead to a misalignment of interest with shareholders who are likely to be more interested in returns than the size of the balance sheet. We also believe that Mr Buijs and the new strategy will appeal to investors. This may well be one of the reasons why the shares are trading at or above NAV.
Shareholders Early in 2007, the Israel-based quoted real estate developer, Habas Investments, acquired a near 22% stake in NSI. It is not NSI’s intention to engage in any operational transactions with this investor. Another 12.5% is in the hands of the Moeijes family, an historical shareholder from West Friesland. The remaining 66% of the shares are free float.
Fig 12 Shareholder structure
Habas21%
Moeijes family13%
Free float 66%
Source: Bloomberg
_
Growth for growth’s sake is a potential
misalignment

182
Benelux Real Estate February 2010
Financials
Fig 13 Balance sheet (€m)
2008 2009 2010F 2011F 2012F 2013F 2014F
Real estate investments 1,411.5 1,303.2 1,291.2 1,299.5 1,338.8 1,392.9 1,449.4Intangible fixed assets 8.2 8.3 8.3 8.3 8.3 8.3 8.3Tangible fixed assets 4.1 3.9 3.9 3.9 3.9 3.9 3.9Financial derivatives 0.0 0.0 0.0 0.0 0.0 0.0 0.0Pre-payments and accrued inc. in relation to rent incentives 1.8 2.4 2.4 2.4 2.4 2.4 2.4Total fixed assets 1,425.7 1,317.9 1,305.8 1,314.1 1,353.4 1,407.5 1,464.1Debtors and receivables incl. derivs 3.6 2.4 3.9 4.0 4.1 4.2 4.4Cash 0.0 0.0 50.7 49.5 53.2 51.7 50.3Total current assets 3.6 2.4 54.6 53.5 57.3 56.0 54.7Total assets 1,429.3 1,320.3 1,360.4 1,367.6 1,410.7 1,463.5 1,518.8
Total shareholders’ equity 582.2 554.8 541.0 548.3 586.4 639.1 694.4Mortgage loans 747.2 661.1 715.0 715.0 720.0 720.0 720.0Financial derivatives 16.3 28.1 28.1 28.1 28.1 28.1 28.1Deferred tax liabilities 0.3 0.5 0.5 0.5 0.5 0.5 0.5Total long-term liabilities 763.8 689.6 743.6 743.6 748.6 748.6 748.6Redemption requirement long-term debt 0.1 30.0 30.0 30.0 30.0 30.0 30.0Debts to credit institutions incl. derivs 59.5 25.1 25.1 25.1 25.1 25.1 25.1Other accounts payables and accruals and deferred income 23.7 20.8 20.8 20.8 20.8 20.8 20.8Total current liabilities 83.3 75.8 75.8 75.8 75.8 75.8 75.8Total liabilities 847.1 765.5 819.4 819.4 824.4 824.4 824.4Total shareholders’ equity and liabilities 1,429.3 1,320.3 1,360.4 1,367.6 1,410.7 1,463.5 1,518.8
Source: Company data, ING estimates
_
Fig 14 Profit and loss (€m)
2008 2009 2010F 2011F 2012F 2013F 2014F
Gross rents 101.7 103.8 104.9 105.7 108.9 111.7 115.0Operating costs (13.4) (14.2) (12.1) (12.2) (12.5) (12.8) (13.2)Net rents 88.3 89.6 92.8 93.5 96.4 98.8 101.7Total revaluation of investments (42.7) (52.3) (12.1) 8.3 39.3 54.1 56.6Total net income from investments 45.3 37.4 80.8 101.9 135.7 153.0 158.3Interest cost (34.9) (34.7) (35.1) (35.1) (35.1) (35.1) (35.1)Interest income 0.1 0.2 0.1 0.1 0.0 0.0 0.0Total interest (34.8) (34.5) (35.0) (35.0) (35.1) (35.1) (35.1)Net financing expenses (61.7) (46.9) (35.0) (35.0) (35.1) (35.1) (35.1)General expenses (4.6) (4.7) (5.8) (5.8) (6.0) (6.1) (6.3)Direct share (exploitation and portfolio mgt) (3.3) (3.3) (4.3) (4.4) (4.5) (4.6) (4.7)Indirect share (centralised asset mgt) (1.2) (1.4) (1.4) (1.5) (1.5) (1.5) (1.6)Result before tax (20.9) (14.2) 40.0 61.0 94.6 111.7 116.9Corporate income tax (0.4) (0.3) (0.5) (0.5) (0.5) (0.6) (0.6)Direct share (payable current fiscal year) (0.1) (0.2) (0.2) (0.2) (0.2) (0.2) (0.2)Indirect share (tax effect of subs falling under other tax regimes) (0.3) (0.2) (0.4) (0.4) (0.4) (0.4) (0.4)Result after tax (21.3) (14.4) 39.5 60.5 94.1 111.2 116.3
Total direct result 50.0 51.6 53.3 54.0 56.7 59.0 61.7Total indirect result (71.4) (66.2) (13.9) 6.5 37.4 52.2 54.6
Source: Company data, ING estimates
_

183
Benelux Real Estate February 2010
Fig 15 Cash flow statement (€m)
2008 2009 2010F 2011F 2012F 2013F 2014F
Total investment result (21.3) (14.6) 39.5 60.5 94.1 111.2 116.3Adjustments for 0.0 0.0 0.0 0.0 0.0 0.0 0.0Revaluation of investments 42.7 52.3 12.1 (8.3) (39.3) (54.1) (56.6)Realised result on sales of investments 0.2 (0.1) 0.0 0.0 0.0 0.0 0.0Net financing expenses 61.7 46.9 0.0 0.0 0.0 0.0 0.0Movements in debtors and other payables 3.0 1.2 (1.4) (0.1) (0.1) (0.1) (0.1)Movements in account payables 2.0 (2.9) 0.0 0.0 0.0 0.0 0.0Interest paid (35.0) 0.0 0.0 0.0 0.0 0.0 0.0CF from operations 53.6 84.0 50.1 52.0 54.7 56.9 59.6CF from investments (237.6) 54.7 0.0 0.0 0.0 0.0 0.0Dividend paid (49.7) (51.4) (53.3) (53.3) (56.0) (58.4) (61.0)Share issue 0.0 38.5 0.0 0.0 0.0 0.0 0.0Drawdown on loans 225.7 30.0 53.9 0.0 5.0 0.0 0.0Redemption of loans (14.9) (121.0) 0.0 0.0 0.0 0.0 0.0CF from financing 161.1 (103.9) 0.6 (53.3) (51.0) (58.4) (61.0)Net cash flow (22.9) 34.8 50.7 (1.2) 3.7 (1.5) (1.4)Exchange rate differences 1.5 0.2 0.0 0.0 0.0 0.0 0.0Cash and accounts payable to banks EOP (59.5) (24.5) 50.7 49.5 53.2 51.7 50.3
Source: Company data, ING estimates _
Fig 16 Per share data (€)
2008 2009 2010F 2011F 2012F 2013F 2014F
Year-end number of shares (basic) 35,774,117 39,351,527 39,351,527 39,351,527 39,351,527 39,351,527 39,351,527
Direct result per share 1.40 1.36 1.36 1.37 1.44 1.50 1.57Indirect result per share (2.00) (1.75) (0.35) 0.17 0.95 1.33 1.39Total investment result (0.60) (0.39) 1.00 1.54 2.39 2.82 2.95
Dividend per share attributed (€) 1.40 1.34 1.36 1.37 1.44 1.50 1.57
IFRS NAV per share 16.3 14.1 13.7 13.9 14.9 16.2 17.6
Recurring CFPS 1.36 1.32 1.31 1.33 1.39 1.45 1.52Recurring EPS 1.36 1.32 1.31 1.33 1.39 1.45 1.52
Source: Company data, ING estimates
_

184
Benelux Real Estate February 2010
Fig 17 Quarterly profit and loss (€m)
1Q09 2Q09 3Q09 4Q09 1Q10F 2Q10F 3Q10F 4Q10F
Gross rents 26.1 26.3 25.6 25.7 28.1 25.5 25.6 25.7Operating charges (4.0) (3.4) (2.9) (3.9) (3.2) (2.9) (2.9) (3.0)Net rents 22.1 22.9 22.7 21.8 24.8 22.6 22.6 22.8Total net income from investments (7.2) 18.1 17.9 8.5 20.1 18.5 20.7 21.5Interest cost (8.9) (8.8) (8.5) (8.6) (8.8) (8.8) (8.8) (8.8)Interest income 0.0 0.1 (0.1) 0.2 0.0 0.0 0.0 0.0Total interest (8.8) (8.7) (8.6) (8.4) (8.7) (8.7) (8.8) (8.8)Revaluation of financial derivatives (11.1) 3.1 (3.9) (0.4) 0.0 0.0 0.0 0.0Exchange rate differences (0.1) 0.0 0.2 (0.3) 0.0 0.0 0.0 0.0Net financing expenses (20.0) (5.6) (12.3) (9.0) (8.7) (8.7) (8.8) (8.8)General expenses (1.0) (1.5) (1.1) (1.0) (1.5) (1.4) (1.4) (1.4)Direct share (exploitation and portfolio mgt) (0.8) (1.2) (0.7) (0.6) (1.2) (1.1) (1.1) (1.1)Indirect share (centralised asset mgt) (0.3) (0.4) (0.4) (0.4) (0.4) (0.4) (0.4) (0.4)Result before tax (28.3) 11.0 4.4 (1.4) 9.8 8.4 10.5 11.3Corporate income tax (0.3) (0.1) (0.2) 0.3 (0.1) (0.1) (0.1) (0.1)Direct share (payable current fiscal year) (0.1) 0.0 (0.2) 0.0 0.0 0.0 0.0 0.0Indirect share (tax effect of subsids falling under other tax regimes) (0.2) (0.1) (0.5) 0.3 (0.1) (0.1) (0.1) (0.1)Result after tax (28.5) 11.0 4.2 (1.1) 9.7 8.3 10.4 11.2
Total direct result 12.4 13.1 13.2 12.8 14.9 12.8 12.8 12.9Total indirect result (41.0) (2.0) (9.5) (14.0) (5.2) (4.5) (2.4) (1.7)
Source: Company data, ING estimates _
Fig 18 Quarterly cash flow statement (€m)
1Q09 2Q09 3Q09 4Q09 1Q10F 2Q10F 3Q10F 4Q10F
Total investment result (28.5) 10.9 4.1 (1.1) 9.7 8.3 10.4 11.2Adjustments for 0.0 0.0 0.0 0.0 0.0 0.0 0.0 0.0Revaluation of investments 29.5 4.8 4.7 13.3 4.7 4.1 2.0 1.3Realised result on sales of investments (0.2) (0.1) 0.2 0.0 0.0 0.0 0.0 0.0Net financing expenses 20.0 5.6 12.4 9.0 0.0 0.0 0.0 0.0Deferred tax liabilities 0.2 0.1 0.2 (0.3) 0.0 0.0 0.0 0.0Movements in debtors and other payables (7.8) 7.4 (3.1) 4.6 (1.8) 0.4 0.0 0.0Movements in account payables 15.8 (15.4) (1.5) 35.0 0.0 0.0 0.0 0.0Interest paid (8.8) (8.7) (8.5) 0.0 0.0 0.0 0.0 0.0CF from operations 20.2 4.6 8.4 60.5 12.6 12.7 12.3 12.4Purchases of real estate and investments in existing properties (0.2) (0.4) (8.2) 0.0 0.0 0.0 0.0 0.0Sales of real estate investments 24.9 7.7 16.9 0.0 0.0 0.0 0.0 0.0Mmts in pre-payments and accrued income relating to rent incentives (0.3) (0.2) 0.0 0.0 0.0 0.0 0.0 0.0Movements in tangible fixed assets 0.1 0.0 (0.2) (0.1) 0.0 0.0 0.0 0.0CF from Investments 24.5 7.1 8.5 (0.1) 0.0 0.0 0.0 0.0Dividend paid (12.5) (12.5) (13.0) (13.2) 0.0 (27.7) (12.8) (12.8)Share issue 0.0 38.5 0.0 0.0 0.0 0.0 0.0 0.0Drawdown on loans 30.0 0.0 0.0 (52.3) 0.0 53.9 0.0 0.0Redemption of loans (10.3) (34.5) (17.4) 0.0 0.0 0.0 0.0 0.0CF from financing 7.2 (8.6) (30.4) (65.5) 0.0 26.2 (12.8) (12.8)Net cash flow 51.9 3.1 (13.5) (5.1) 12.6 38.9 (0.4) (0.3)Exchange rate differences 0.1 (0.1) 0.1 0.0 0.0 0.0 0.0 0.0Cash and accounts payable EOP (7.5) (56.4) (13.4) (5.1) 12.6 51.5 51.1 50.7
Source: Company data, ING estimates
_
Fig 19 Quarterly per share data (€)
1Q09 2Q09 3Q09 4Q09 1Q10F 2Q10F 3Q10F 4Q10F
Year-end number of shares (basic) 35,774,117 39,351,527 39,351,527 39,351,527 39,351,527 39,351,527 39,351,527 39,351,527
Direct result per share 0.35 0.35 0.34 0.33 0.38 0.32 0.32 0.33Indirect result per share (1.15) (0.05) (0.24) (0.36) (0.13) (0.11) (0.06) (0.04)Total investment result (0.80) 0.30 0.10 (0.03) 0.25 0.21 0.26 0.28
Dividend per share attributed (€) 0.35 0.35 0.34 0.33 0.38 0.32 0.32 0.33
IFRS NAV per share 15.1 14.7 14.5 14.1 14.3 13.9 13.8 13.7
Recurring CFPS 0.33 0.34 0.32 0.33 0.37 0.31 0.31 0.32Recurring EPS 0.33 0.34 0.32 0.33 0.37 0.31 0.31 0.32
Source: Company data, ING estimates _
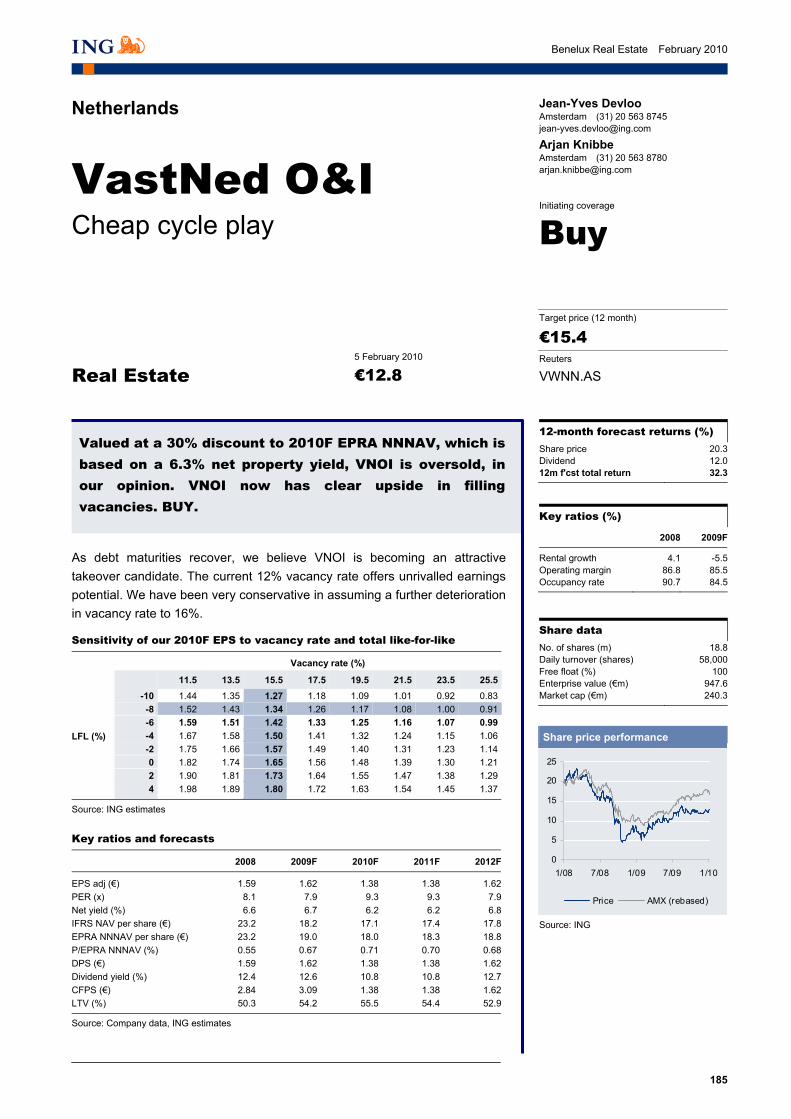
185
Benelux Real Estate February 2010
Netherlands
VastNed O&I Cheap cycle play
Key ratios (%)
2008 2009F
Rental growth 4.1 -5.5Operating margin 86.8 85.5Occupancy rate 90.7 84.5
Share data No. of shares (m) 18.8Daily turnover (shares) 58,000Free float (%) 100Enterprise value (€m) 947.6Market cap (€m) 240.3
12-month forecast returns (%) Share price 20.3Dividend 12.012m f'cst total return 32.3
Share price performance
0
5
10
15
20
25
1/08 7/08 1/09 7/09 1/10
Price AMX (rebased)
Source: ING
Valued at a 30% discount to 2010F EPRA NNNAV, which is based on a 6.3% net property yield, VNOI is oversold, in our opinion. VNOI now has clear upside in filling vacancies. BUY.
Initiating coverage
€12.85 February 2010
Buy
Real Estate
€15.4 Target price (12 month)
VWNN.AS Reuters
Jean-Yves Devloo Amsterdam (31) 20 563 8745 [email protected]
Arjan Knibbe Amsterdam (31) 20 563 8780 [email protected]
As debt maturities recover, we believe VNOI is becoming an attractive takeover candidate. The current 12% vacancy rate offers unrivalled earnings potential. We have been very conservative in assuming a further deterioration in vacancy rate to 16%.
Sensitivity of our 2010F EPS to vacancy rate and total like-for-like
Vacancy rate (%)
11.5 13.5 15.5 17.5 19.5 21.5 23.5 25.5
-10 1.44 1.35 1.27 1.18 1.09 1.01 0.92 0.83 -8 1.52 1.43 1.34 1.26 1.17 1.08 1.00 0.91 -6 1.59 1.51 1.42 1.33 1.25 1.16 1.07 0.99LFL (%) -4 1.67 1.58 1.50 1.41 1.32 1.24 1.15 1.06 -2 1.75 1.66 1.57 1.49 1.40 1.31 1.23 1.14 0 1.82 1.74 1.65 1.56 1.48 1.39 1.30 1.21 2 1.90 1.81 1.73 1.64 1.55 1.47 1.38 1.29 4 1.98 1.89 1.80 1.72 1.63 1.54 1.45 1.37
Source: ING estimates _
Key ratios and forecasts
2008 2009F 2010F 2011F 2012F
EPS adj (€) 1.59 1.62 1.38 1.38 1.62PER (x) 8.1 7.9 9.3 9.3 7.9Net yield (%) 6.6 6.7 6.2 6.2 6.8IFRS NAV per share (€) 23.2 18.2 17.1 17.4 17.8EPRA NNNAV per share (€) 23.2 19.0 18.0 18.3 18.8P/EPRA NNNAV (%) 0.55 0.67 0.71 0.70 0.68DPS (€) 1.59 1.62 1.38 1.38 1.62Dividend yield (%) 12.4 12.6 10.8 10.8 12.7CFPS (€) 2.84 3.09 1.38 1.38 1.62LTV (%) 50.3 54.2 55.5 54.4 52.9
Source: Company data, ING estimates _
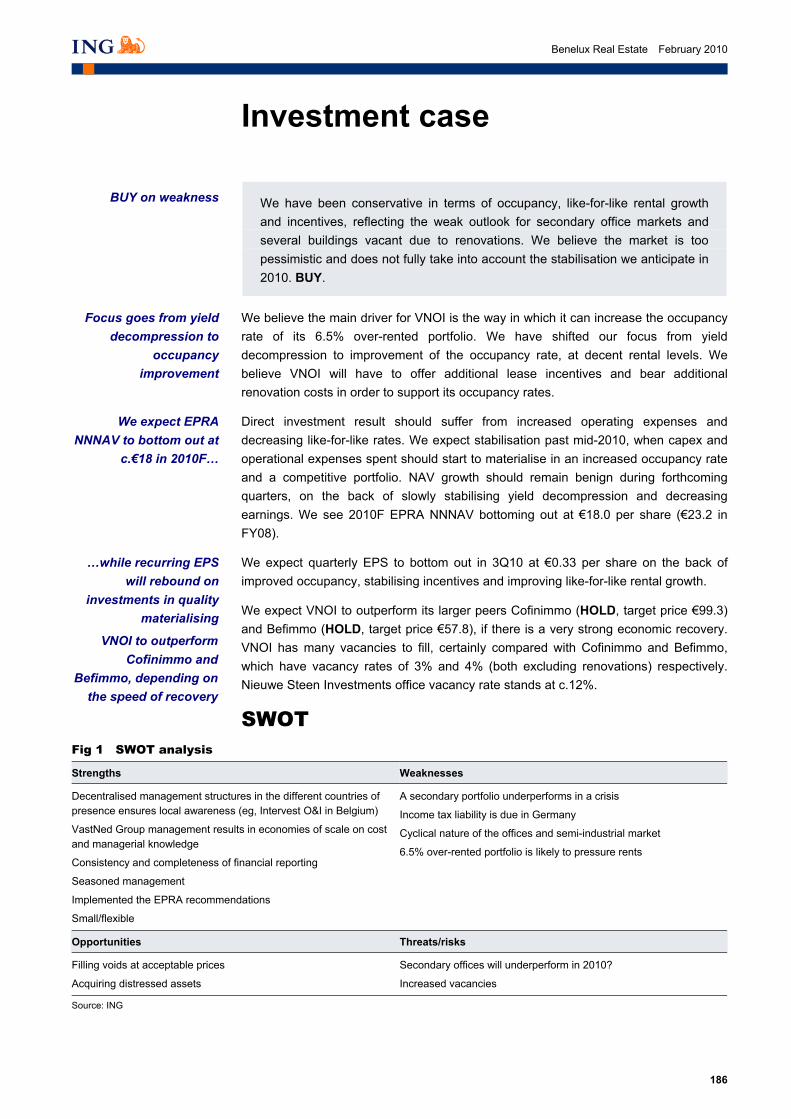
186
Benelux Real Estate February 2010
Investment case
We have been conservative in terms of occupancy, like-for-like rental growth and incentives, reflecting the weak outlook for secondary office markets and several buildings vacant due to renovations. We believe the market is too pessimistic and does not fully take into account the stabilisation we anticipate in 2010. BUY.
We believe the main driver for VNOI is the way in which it can increase the occupancy rate of its 6.5% over-rented portfolio. We have shifted our focus from yield decompression to improvement of the occupancy rate, at decent rental levels. We believe VNOI will have to offer additional lease incentives and bear additional renovation costs in order to support its occupancy rates.
Direct investment result should suffer from increased operating expenses and decreasing like-for-like rates. We expect stabilisation past mid-2010, when capex and operational expenses spent should start to materialise in an increased occupancy rate and a competitive portfolio. NAV growth should remain benign during forthcoming quarters, on the back of slowly stabilising yield decompression and decreasing earnings. We see 2010F EPRA NNNAV bottoming out at €18.0 per share (€23.2 in FY08).
We expect quarterly EPS to bottom out in 3Q10 at €0.33 per share on the back of improved occupancy, stabilising incentives and improving like-for-like rental growth.
We expect VNOI to outperform its larger peers Cofinimmo (HOLD, target price €99.3) and Befimmo (HOLD, target price €57.8), if there is a very strong economic recovery. VNOI has many vacancies to fill, certainly compared with Cofinimmo and Befimmo, which have vacancy rates of 3% and 4% (both excluding renovations) respectively. Nieuwe Steen Investments office vacancy rate stands at c.12%.
SWOT Fig 1 SWOT analysis
Strengths Weaknesses
Decentralised management structures in the different countries of presence ensures local awareness (eg, Intervest O&I in Belgium)
VastNed Group management results in economies of scale on cost and managerial knowledge
Consistency and completeness of financial reporting
Seasoned management
Implemented the EPRA recommendations
Small/flexible
A secondary portfolio underperforms in a crisis
Income tax liability is due in Germany
Cyclical nature of the offices and semi-industrial market
6.5% over-rented portfolio is likely to pressure rents
Opportunities Threats/risks
Filling voids at acceptable prices
Acquiring distressed assets
Secondary offices will underperform in 2010?
Increased vacancies
Source: ING _
BUY on weakness
Focus goes from yield decompression to
occupancy improvement
We expect EPRA NNNAV to bottom out at
c.€18 in 2010F…
…while recurring EPS will rebound on
investments in quality materialising
VNOI to outperform Cofinimmo and
Befimmo, depending on the speed of recovery
187
Benelux Real Estate February 2010
Risks Because of the contractual nature of a large part of the recurring cash flows, property companies are usually considered to be less of a risk than most other equity sectors. The risks of property companies bear a strong relation to the amount of development exposure, geographical and sector breakdown, corporate governance and the alignment of interests between management and shareholders.
Principally an investor, but in relatively cyclical secondary property assets
In our view, VNOI carries low risk because its main activity is investing in property, and has limited developments. This limited development exposure must be compensated by VNOI’s exposure to offices in secondary locations, which we rate as more cyclical compared with retail. We believe this sector will underperform in 2010, but not as much as is priced in now.
Tenant risk is not limited
VNOI’s top three tenants in terms of FY08 total rental revenues are PWC (10.4%, business services, Belgian portfolio), Tibotec (7.5%, pharmaceutical, Belgian portfolio) and Deloitte (7.2%, business services, Belgian portfolio). While to date we have not recorded any sizeable rent payment delays or pressure, we believe this exposure to the same tenants remains considerable.
Mid-2009, Tibotec, part of Johnson&Johnson, reported relocating its activities from Mechelen to the mother company Janssen Pharmaceutica in Beerse (both in Belgium). This has involved moving 450 employees and will affect VNOI in a decrease in its occupancy rate. The total rent roll of Tibotec is €3.2m, of which 50% will leave in 2H10, 20% in 2H13 and 30% in 2H14.
Vacancy risk
At end-September 2009, VNOI had a rent weighted vacancy of c.12%, which we assume to increase to 16% in mid-2010, after which we expect VNOI should be able to increase its occupancy to normal levels. We have factored in significant rent incentives which will certainly pressure 2010F EPS (see Outlook section), which we believe makes us conservative. A more drastic evolution in rent incentives is not excluded.
Accounting for leases
There are accounting initiatives that may lead to an obligation for tenants to account long leases as a liability in their balance sheets. In future, this may put pressure on the average lease lengths of real estate companies and VNOI.
No currency risks
VNOI receives all its rents and makes all its costs in euros, which implies there is no currency risk.
Catalysts Taking into account a potential underperformance of secondary offices in 2010, we believe we have been conservative in terms of like-for-like rental growth, vacancy and lease incentives. An outperformance of any of these metrics would clearly benefit the share price. More specific factors involve:
• Letting the ‘Red Elephant’ (largest asset in the Dutch portfolio) at acceptable rental levels.
Property companies are low-risk, on average
Potential pressure on lease length
Considerable concentration of
tenants at c.25% of total theoretical rent payroll
Principal activity is investing, limited
development exposure
VNOI has to improve its occupation, but at what
cost?
Monitor vacancy, LFL and lease incentives
closely

188
Benelux Real Estate February 2010
• We do not expect any major acquisitions or disposals in the near future.
Outlook After posting its 3Q09 results, VNOI increased its dividend per share outlook from €1.55 to a value of between €1.55 and €1.60 per share. We expect VNOI to be able to meet the €1.60 threshold (we expect €1.62), but it should dip to €1.38 during 2010F, based on our assumptions below (see Estimates and assumptions section). VNOI aims fully to distribute its direct investment result.
Valuation We value VNOI on a 10% discount to 2010F EPRA NNNAV. The 2010F dividend yield stands at +10%, and is not necessarily sustainable, in our view.
Consensus The market clearly expects falling earnings for VNOI, driven by increased vacancy and incentives. Applying stringently conservative vacancy, like-for-like and portfolio valuation assumptions (see Figure 3), we are still well ahead of consensus.
Fig 2 EPS consensus estimates (€)
2008 2009F 2010F 2011F
Consensus 1.59 1.57 1.30 1.25ING 1.59 1.62 1.38 1.38Difference 0.00 0.05 0.08 0.13Difference (%) 0 3 6 10
Source: Reuters, ING estimates
_
Our estimates and assumptions • Vacancies should increase from the current 12% level to 16% in mid-2010, after
which we expect it to improve again well below 10% through 2012F. The sharpest increase in vacancy is expected in the Netherlands (vacancies touching 25% in mid-2010F).
Fig 3 Our vacancy assumptions (%)
2009F 2010F 2011F 2012F
Netherlands 17.6 23.3 19.3 10.0Belgium 8.9 9.8 9.5 5.0Germany 11.6 14.8 11.8 6.0Total 15.5 15.2 13.2 6.9
Source: ING estimates
_
• Like-for-like rental growth should be negative during 2009F, mainly owing to the combination of low indexation and high lease incentives. This trend is expected to continue in 2010F, especially in the Netherlands, and should return to normal levels thereafter.
Dividend expectations between €1.55 and €1.60
are conservative
Conservative assumptions for
vacancies, LFL and valuation result
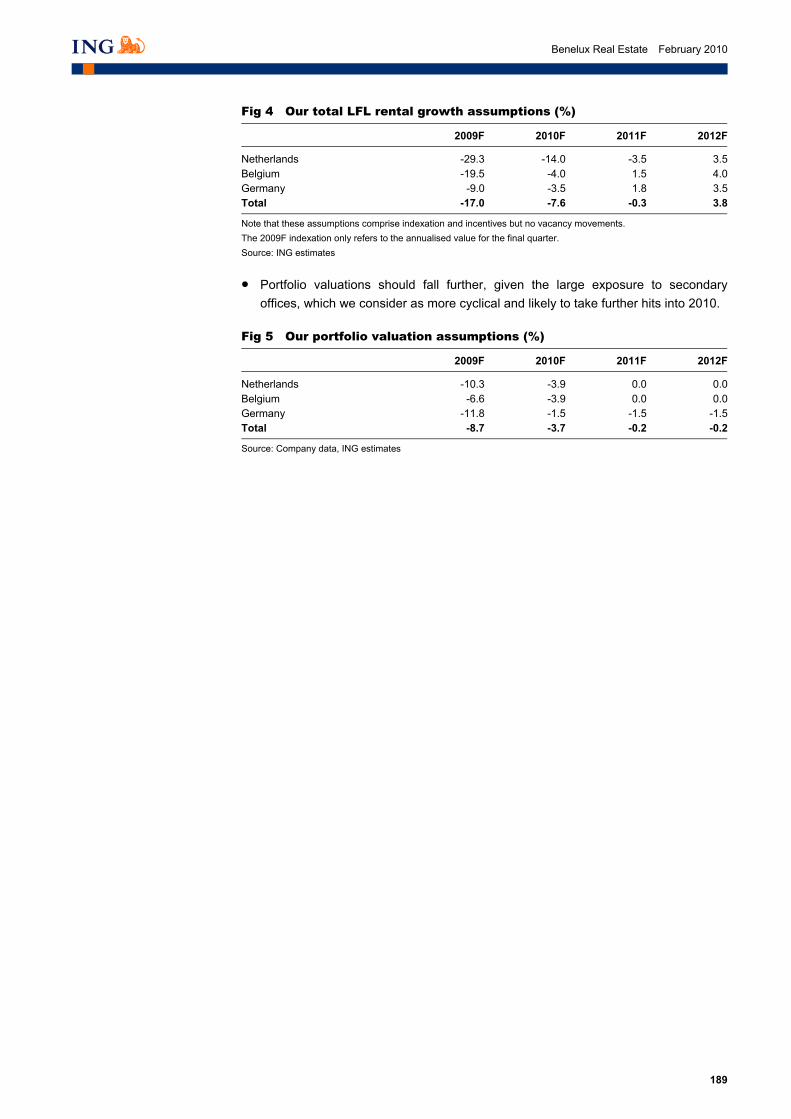
189
Benelux Real Estate February 2010
Fig 4 Our total LFL rental growth assumptions (%)
2009F 2010F 2011F 2012F
Netherlands -29.3 -14.0 -3.5 3.5Belgium -19.5 -4.0 1.5 4.0Germany -9.0 -3.5 1.8 3.5Total -17.0 -7.6 -0.3 3.8
Note that these assumptions comprise indexation and incentives but no vacancy movements. The 2009F indexation only refers to the annualised value for the final quarter. Source: ING estimates
_
• Portfolio valuations should fall further, given the large exposure to secondary offices, which we consider as more cyclical and likely to take further hits into 2010.
Fig 5 Our portfolio valuation assumptions (%)
2009F 2010F 2011F 2012F
Netherlands -10.3 -3.9 0.0 0.0Belgium -6.6 -3.9 0.0 0.0Germany -11.8 -1.5 -1.5 -1.5Total -8.7 -3.7 -0.2 -0.2
Source: Company data, ING estimates
_

190
Benelux Real Estate February 2010
Company profile
VastNed O&I (VNOI) was founded in 1984 as VWN (Vaste Waarden Nederland) and qualifies as a closed end property investment fund with variable capital. It has been quoted on the Euronext Amsterdam stock exchange since 1989. Its mission is to invest 80-100% in offices and 20-0% in semi-industrial real estate assets spread across the Netherlands (42%), Belgium (47%) and Germany (10%). The Dutch and Belgian portfolios qualify as FBI (Fiscale Belegingsinstelling) and Bevak (Beleggingsvennootschap met vast kapitaal), which are the respective national REIT-like implementations, resulting in zero corporate income tax liability. The Belgian portfolio is held through a 55% stake in Intervest Offices/Industrial, quoted on Euronext Brussels. Income from the German portfolio is fully subject to corporate income tax. See Figure 8 for a full overview of the organisational structure.
Fig 6 Portfolio overview, end-September 2009
Fig 7 Portfolio overview, end-2008
NL42%
Belgium48%
Germany10%
Offices81%
Semi industrial
19%
Source: Company data Source: Company data
_
VNOI is part of the VastNed Group and is the sister company of VastNed Retail (VNR). Both companies are managed internally by their own country management teams (the Belgian subsidiaries Intervest O/I and Intervest Retail are managed by the same country management and are majority owned by VastNed O/I and VastNed Retail), which are in turn supervised by their respective mother company, located in Rotterdam. VNR and VNOI own 66.7% and 33.3% respectively of the shares of VastNed Management, and the group’s management costs are spread proportionally. There is no profit being allocated to VastNed Management. We are positive on the cost efficiencies (some millions of euros) and knowledge efficiencies that are realised on the back of this shared management structure. There are 108 employees in the VastNed group who are on the payroll of VastNed Management and the related management companies (see Figure 8).
Primarily offices REIT in the Netherlands,
Belgium and Germany
Part of the VastNed Group, internal
management

191
Benelux Real Estate February 2010
Fig 8 Organisational structure of VastNed Group
Note 1: Intervest Retail and Intervest O/I are Belgian majority-owned subsidiaries of VNR and VNOI respectively. They enjoy the Belgian REIT benefits (Bevak) and are quoted on Euronext Brussels. Apart from the VastNed participation, their shares are free float. Note 2: Intervest Retail and Intervest O/I have the same country management board (CEO and CFO), headed by Jean-Paul Sols. Note 3: The management of the Portuguese retail portfolio is located in Madrid. Source: ING
_
Disposals of smaller and secondary assets combined with investments in prime assets have been key in VNOI’s strategy in the last few years. In 2007, VNOI acquired the single-tenant “Red Elephant” building in The Hague, the largest building in the Dutch portfolio (7% and 5% of Dutch portfolio appraisal value and rents end-2008 respectively). Mid-2009, the tenant of the “Red Elephant” left after lease expiration, leading to a 400bp drop in the occupancy rate of the Dutch portfolio to almost 20%. When the first problems in the financial sector became clear at end-2007, VNOI’s strategy shifted to (re)letting and improving the overall quality and marketability of the portfolio among others by investing in the sustainability of the portfolio. Consistent with this strategy, the “Red Elephant” building has been subject to a considerable renovation. We believe there is a low likelihood of considerable acquisitions in the future.
The start of the problems in the financial sector, the yield decompression and decreasing rents have led to an early and comprehensive refinancing and covenant revision during 4Q08 of the loan portfolio relating to the Dutch and German portfolio, totalling c.€370m. The current financial debt totals c.€590m, of which 69% is floating. Average interest rate 9M09 was 3.8%, and should increase on the larger margins related to recent refinancing. Unused facilities are estimated at c.€30m. Loan to value (LTV) is considerable at 54%.
Focus on (re)letting by improving quality of the portfolio. Low likelihood
of major acquisitions
Sound financing structure; considerable
LTV at 54%
VastNed Retail VastNed Offices/Industrial
Intervest Retail(Antwerp, Belgium)
VastNed RetailNetherlands(Rotterdam)
VastNed Istanbul
VastNed ManagementEspańa(Madrid)
VastNed Management France(Paris)
VastNed OfficesNetherlands(Rotterdam)
VastNed Deutschland(Frankfurt)
VastNed Management(Rotterdam, NDL)
IntervestOffices/Industrial
(Antwerp, Belgium)66.7% 33.3% 55%
100%
100%
77%
100%
100%
100%
100%

192
Benelux Real Estate February 2010
Fig 9 Financial debt overview, end-Sept 2009
Fig 10 Financial debt overview, end-Sept 2009
Fixed69%
Floating31%
Long term91%
Short term9%
Source: Company data, ING estimates Source: Company data, ING estimates
_
Portfolio In Figure 11, some major metrics are presented per geographical segment. With NVOI being over-rented and confronted with considerable lease expiries (18% INGF) during 2010, we believe the company is likely to pay a price in the form of capex, lease incentives and temporary increase operational expenses in order to increase its rental level.
Fig 11 Key portfolio indicators
Netherlands Belgium Germany
Total portfolio
Over/under-rented, end-2008 (%) -2.2 -11.4 -3.0 -6.5Occupancy, September 2009 (%) 80 90 84 88Avg. lease duration to first break, end-2008 (yrs) 3.4 3.7 3.7 3.6No. of properties, end-2008 103 61 5 169Average gross rent/property (€m) 0.4 0.7 1.3 0.5Number of tenants, end-2008 299 209 38 546Average gross rent/tenant (€m) 0.13 0.21 0.17 0.16Net theoretical yield, 2008 7.7 8.6 6.3 7.8Lease incentives (% of FY08 theoretical gross rent) 19 15 13 17Estimated lease expiries FY10 (% of gross rents) 15 20 8 18
Source: Company data, ING estimates _
Fig 12 Average rent (€/m²/year) during FY08
0
50
100
150
200
250
Offices SemiIndustrial
Total Offices SemiIndustrial
Total Offices
The Netherlands Belgium Germany
€/m
²/yea
r
Super cities Large cities Medium sized cities Small cities
Note: Super cities >500,000 inhabitants; large cities 150,000 to 500,000 inhabitants; medium cities 50,000-150,000 inhabitants and small cities <50,000 inhabitants. Source: Company data
_
Over-rented portfolio and lease expiries force
VNOI to focus on occupancy rates at decent conditions

193
Benelux Real Estate February 2010
VNOI’s portfolio is allocated primarily to small and medium-sized cities (<50,000 and 50,000-150,000 inhabitants respectively). There is a smaller allocation of 35% to large and super cities (150,000-500,000 and >500,000 inhabitants respectively). This is in contrast with Cofinimmo and Befimmo, which are present primarily in Brussels (Cofinimmo also has nursing homes and pubs, which are spread throughout Belgium and France, and Belgium and the Netherlands).
Fig 13 Regional spread (% of FY08 appraisal value)
Small cities33%
Super cities19%
Large cities16%
Medium sized cities32%
Source: Company data
_
Figures 14-16 illustrate the largest assets in the Dutch and the Belgian portfolio.
Fig 14 Top ten assets according to appraisal value in the Netherlands, end-2008
Name
City
FY08 appraisal
value (€m)
% of Dutch portfolio
end-2008
FY08 grosstheoretical
rent (€m)% of Dutch
portfolioOccupancy
end-2008No. of
tenants
‘Red Elephant’, Zuid Hollandlaan* The Hague 30 7 2.1 5 100 1Schendelstraat Utrecht 25 5 1.8 5 100 6Stramanweg Amsterdam 20 4 1.9 5 77 28Jardinstraat Amsterdam 14 3 1.1 3 100 1van der Mandelelaan Rotterdam 13 3 1.4 4 28 1Europalaan s'Hertogenbosch 11 2 1.2 3 86 4Europaweg Zoetermeer 11 2 1 3 100 1Cessnalaan Schiphol 9 2 0.7 2 100 1Fokkerweg Amsterdam 9 2 0.8 2 90 14Weg der Verenigde Naties Utrecht 8 2 0.6 2 100 2Total 150.6 33 12.6 32 59
Note: the ‘Red Elephant’ building in the Hague has been fully vacant since mid July 2009. It is undergoing considerable renovation and at the time of writing we have not had any news on reletting. Source: Company data
_
Mid-2009, the departure of the tenant of the ‘Red Elephant’ building in The Hague contributed to a drop in occupancy rate of the Dutch portfolio of c.4% to <20%. In order to find a new tenant, VNOI will have to do considerable renovations and probably take into account lease incentives.
‘Red Elephant’ in The Hague is still vacant
Primary exposure to small and medium-sized
cities
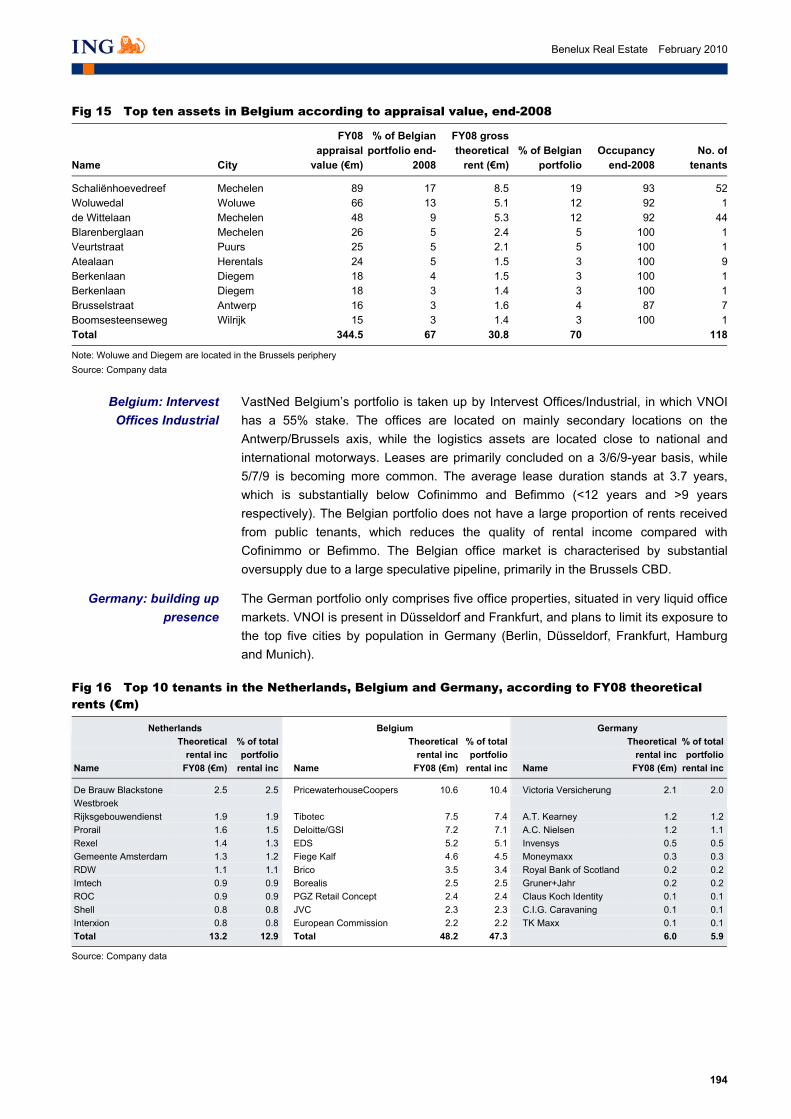
194
Benelux Real Estate February 2010
Fig 15 Top ten assets in Belgium according to appraisal value, end-2008
Name
City
FY08 appraisal
value (€m)
% of Belgian portfolio end-
2008
FY08 gross theoretical
rent (€m)
% of Belgian
portfolio Occupancy
end-2008No. of
tenants
Schaliënhoevedreef Mechelen 89 17 8.5 19 93 52Woluwedal Woluwe 66 13 5.1 12 92 1de Wittelaan Mechelen 48 9 5.3 12 92 44Blarenberglaan Mechelen 26 5 2.4 5 100 1Veurtstraat Puurs 25 5 2.1 5 100 1Atealaan Herentals 24 5 1.5 3 100 9Berkenlaan Diegem 18 4 1.5 3 100 1Berkenlaan Diegem 18 3 1.4 3 100 1Brusselstraat Antwerp 16 3 1.6 4 87 7Boomsesteenseweg Wilrijk 15 3 1.4 3 100 1Total 344.5 67 30.8 70 118
Note: Woluwe and Diegem are located in the Brussels periphery Source: Company data
_
VastNed Belgium’s portfolio is taken up by Intervest Offices/Industrial, in which VNOI has a 55% stake. The offices are located on mainly secondary locations on the Antwerp/Brussels axis, while the logistics assets are located close to national and international motorways. Leases are primarily concluded on a 3/6/9-year basis, while 5/7/9 is becoming more common. The average lease duration stands at 3.7 years, which is substantially below Cofinimmo and Befimmo (<12 years and >9 years respectively). The Belgian portfolio does not have a large proportion of rents received from public tenants, which reduces the quality of rental income compared with Cofinimmo or Befimmo. The Belgian office market is characterised by substantial oversupply due to a large speculative pipeline, primarily in the Brussels CBD.
The German portfolio only comprises five office properties, situated in very liquid office markets. VNOI is present in Düsseldorf and Frankfurt, and plans to limit its exposure to the top five cities by population in Germany (Berlin, Düsseldorf, Frankfurt, Hamburg and Munich).
Fig 16 Top 10 tenants in the Netherlands, Belgium and Germany, according to FY08 theoretical rents (€m)
Netherlands Belgium Germany Name
Theoretical rental inc
FY08 (€m)
% of total portfolio
rental inc
Name
Theoretical rental inc
FY08 (€m)
% of total portfolio
rental inc
Name
Theoretical rental inc
FY08 (€m)
% of total portfolio
rental inc
De Brauw Blackstone Westbroek
2.5 2.5 PricewaterhouseCoopers 10.6 10.4 Victoria Versicherung 2.1 2.0
Rijksgebouwendienst 1.9 1.9 Tibotec 7.5 7.4 A.T. Kearney 1.2 1.2Prorail 1.6 1.5 Deloitte/GSI 7.2 7.1 A.C. Nielsen 1.2 1.1Rexel 1.4 1.3 EDS 5.2 5.1 Invensys 0.5 0.5Gemeente Amsterdam 1.3 1.2 Fiege Kalf 4.6 4.5 Moneymaxx 0.3 0.3RDW 1.1 1.1 Brico 3.5 3.4 Royal Bank of Scotland 0.2 0.2Imtech 0.9 0.9 Borealis 2.5 2.5 Gruner+Jahr 0.2 0.2ROC 0.9 0.9 PGZ Retail Concept 2.4 2.4 Claus Koch Identity 0.1 0.1Shell 0.8 0.8 JVC 2.3 2.3 C.I.G. Caravaning 0.1 0.1Interxion 0.8 0.8 European Commission 2.2 2.2 TK Maxx 0.1 0.1Total 13.2 12.9 Total 48.2 47.3 6.0 5.9
Source: Company data
_
Belgium: Intervest Offices Industrial
Germany: building up presence

195
Benelux Real Estate February 2010
Corporate governance Top management CEO Reinier van Gerrevink, statutory director • CEO of VastNed Group since 2002
• Previously several management functions at ABN AMRO, Rodamco and Robeco
• Degree in Dutch law from the University of Utrecht
CFO Tom de Witte • CFO of VastNed Group since 2003
• Previously an accountant at Deloitte
• Degrees in business economics, Dutch law and accounting, Erasmus University of Rotterdam
COO: replaced by top management Hans Pars, former CIO of VNR and VNOI, decided to leave the company mid-2009 in order to accept a new challenge as the CEO of Wereldhave NV. His function is shared temporarily between the other members of top management.
General counsel and director, investor relations, Arnaud du Pont • General counsel and director of investor relations since 2000
• Previously tax adviser with BDO and PricewaterhouseCoopers
• Degree in tax law, Erasmus University Rotterdam
Director, Wim Fieggen • Director, strategy and planning since 2003
• Previously with Robeco, Rodamco, Roproperty and Altera
• Degree in economics, Erasmus University Rotterdam
Shareholder structure
Figure 17 presents the main shareholders with more than 5% of the shares of VNOI. There is no shareholding agreement between any of these shareholders. As a result, the shares are 100% free float.
VastNed Group is searching for a new CIO
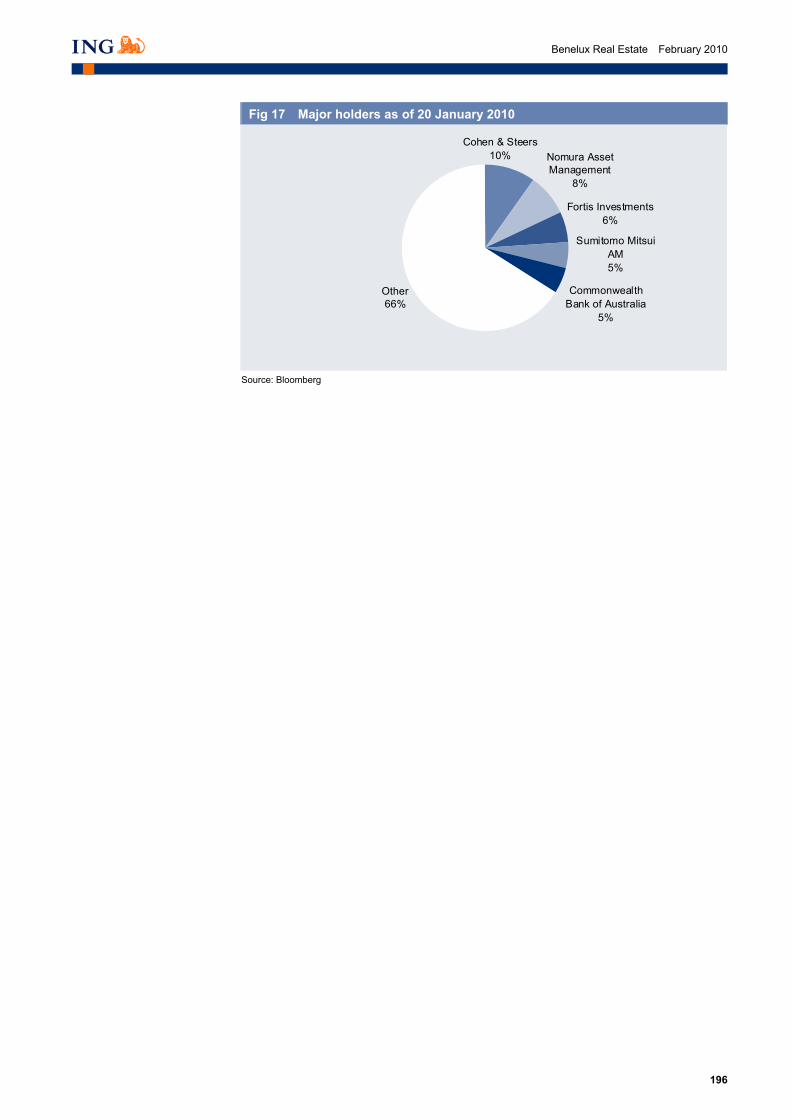
196
Benelux Real Estate February 2010
Fig 17 Major holders as of 20 January 2010
Other66%
Commonwealth Bank of Australia
5%
Sumitomo Mitsui AM5%
Fortis Investments 6%
Nomura Asset Management
8%
Cohen & Steers10%
Source: Bloomberg
_
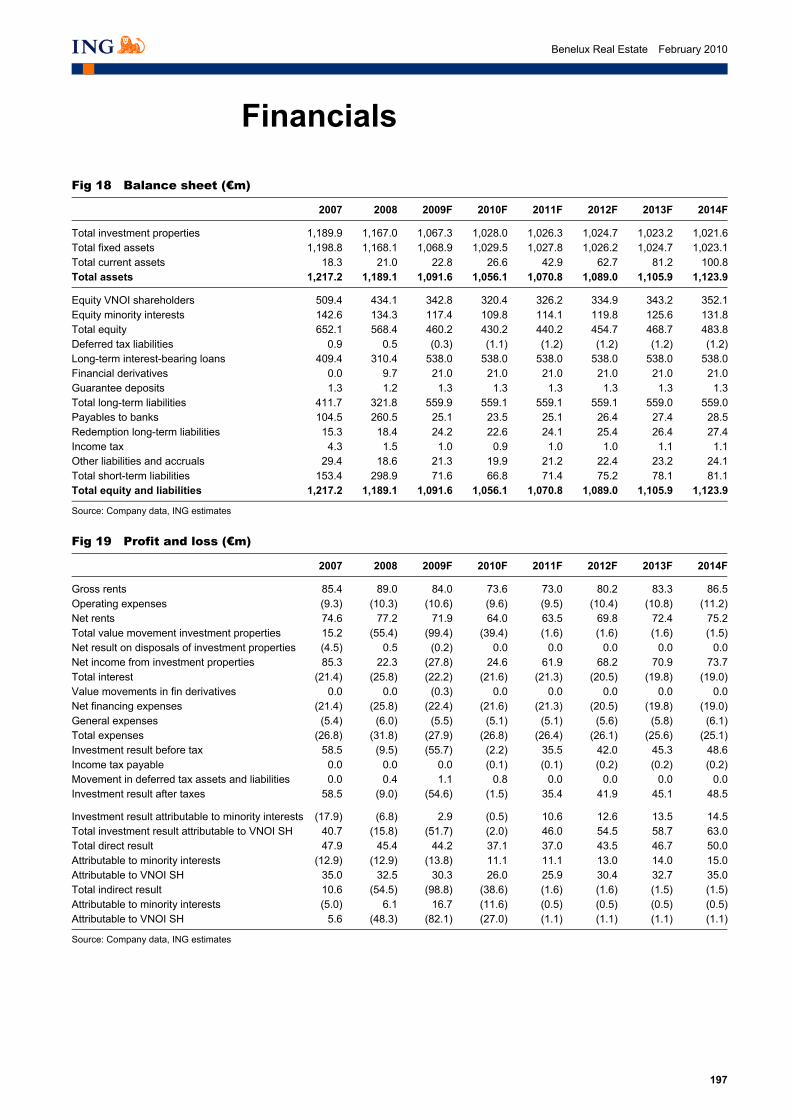
197
Benelux Real Estate February 2010
Financials
Fig 18 Balance sheet (€m)
2007 2008 2009F 2010F 2011F 2012F 2013F 2014F
Total investment properties 1,189.9 1,167.0 1,067.3 1,028.0 1,026.3 1,024.7 1,023.2 1,021.6Total fixed assets 1,198.8 1,168.1 1,068.9 1,029.5 1,027.8 1,026.2 1,024.7 1,023.1Total current assets 18.3 21.0 22.8 26.6 42.9 62.7 81.2 100.8Total assets 1,217.2 1,189.1 1,091.6 1,056.1 1,070.8 1,089.0 1,105.9 1,123.9
Equity VNOI shareholders 509.4 434.1 342.8 320.4 326.2 334.9 343.2 352.1Equity minority interests 142.6 134.3 117.4 109.8 114.1 119.8 125.6 131.8Total equity 652.1 568.4 460.2 430.2 440.2 454.7 468.7 483.8Deferred tax liabilities 0.9 0.5 (0.3) (1.1) (1.2) (1.2) (1.2) (1.2)Long-term interest-bearing loans 409.4 310.4 538.0 538.0 538.0 538.0 538.0 538.0Financial derivatives 0.0 9.7 21.0 21.0 21.0 21.0 21.0 21.0Guarantee deposits 1.3 1.2 1.3 1.3 1.3 1.3 1.3 1.3Total long-term liabilities 411.7 321.8 559.9 559.1 559.1 559.1 559.0 559.0Payables to banks 104.5 260.5 25.1 23.5 25.1 26.4 27.4 28.5Redemption long-term liabilities 15.3 18.4 24.2 22.6 24.1 25.4 26.4 27.4Income tax 4.3 1.5 1.0 0.9 1.0 1.0 1.1 1.1Other liabilities and accruals 29.4 18.6 21.3 19.9 21.2 22.4 23.2 24.1Total short-term liabilities 153.4 298.9 71.6 66.8 71.4 75.2 78.1 81.1Total equity and liabilities 1,217.2 1,189.1 1,091.6 1,056.1 1,070.8 1,089.0 1,105.9 1,123.9
Source: Company data, ING estimates _
Fig 19 Profit and loss (€m)
2007 2008 2009F 2010F 2011F 2012F 2013F 2014F
Gross rents 85.4 89.0 84.0 73.6 73.0 80.2 83.3 86.5Operating expenses (9.3) (10.3) (10.6) (9.6) (9.5) (10.4) (10.8) (11.2)Net rents 74.6 77.2 71.9 64.0 63.5 69.8 72.4 75.2Total value movement investment properties 15.2 (55.4) (99.4) (39.4) (1.6) (1.6) (1.6) (1.5)Net result on disposals of investment properties (4.5) 0.5 (0.2) 0.0 0.0 0.0 0.0 0.0Net income from investment properties 85.3 22.3 (27.8) 24.6 61.9 68.2 70.9 73.7Total interest (21.4) (25.8) (22.2) (21.6) (21.3) (20.5) (19.8) (19.0)Value movements in fin derivatives 0.0 0.0 (0.3) 0.0 0.0 0.0 0.0 0.0Net financing expenses (21.4) (25.8) (22.4) (21.6) (21.3) (20.5) (19.8) (19.0)General expenses (5.4) (6.0) (5.5) (5.1) (5.1) (5.6) (5.8) (6.1)Total expenses (26.8) (31.8) (27.9) (26.8) (26.4) (26.1) (25.6) (25.1)Investment result before tax 58.5 (9.5) (55.7) (2.2) 35.5 42.0 45.3 48.6Income tax payable 0.0 0.0 0.0 (0.1) (0.1) (0.2) (0.2) (0.2)Movement in deferred tax assets and liabilities 0.0 0.4 1.1 0.8 0.0 0.0 0.0 0.0Investment result after taxes 58.5 (9.0) (54.6) (1.5) 35.4 41.9 45.1 48.5
Investment result attributable to minority interests (17.9) (6.8) 2.9 (0.5) 10.6 12.6 13.5 14.5Total investment result attributable to VNOI SH 40.7 (15.8) (51.7) (2.0) 46.0 54.5 58.7 63.0Total direct result 47.9 45.4 44.2 37.1 37.0 43.5 46.7 50.0Attributable to minority interests (12.9) (12.9) (13.8) 11.1 11.1 13.0 14.0 15.0Attributable to VNOI SH 35.0 32.5 30.3 26.0 25.9 30.4 32.7 35.0Total indirect result 10.6 (54.5) (98.8) (38.6) (1.6) (1.6) (1.5) (1.5)Attributable to minority interests (5.0) 6.1 16.7 (11.6) (0.5) (0.5) (0.5) (0.5)Attributable to VNOI SH 5.6 (48.3) (82.1) (27.0) (1.1) (1.1) (1.1) (1.1)
Source: Company data, ING estimates _
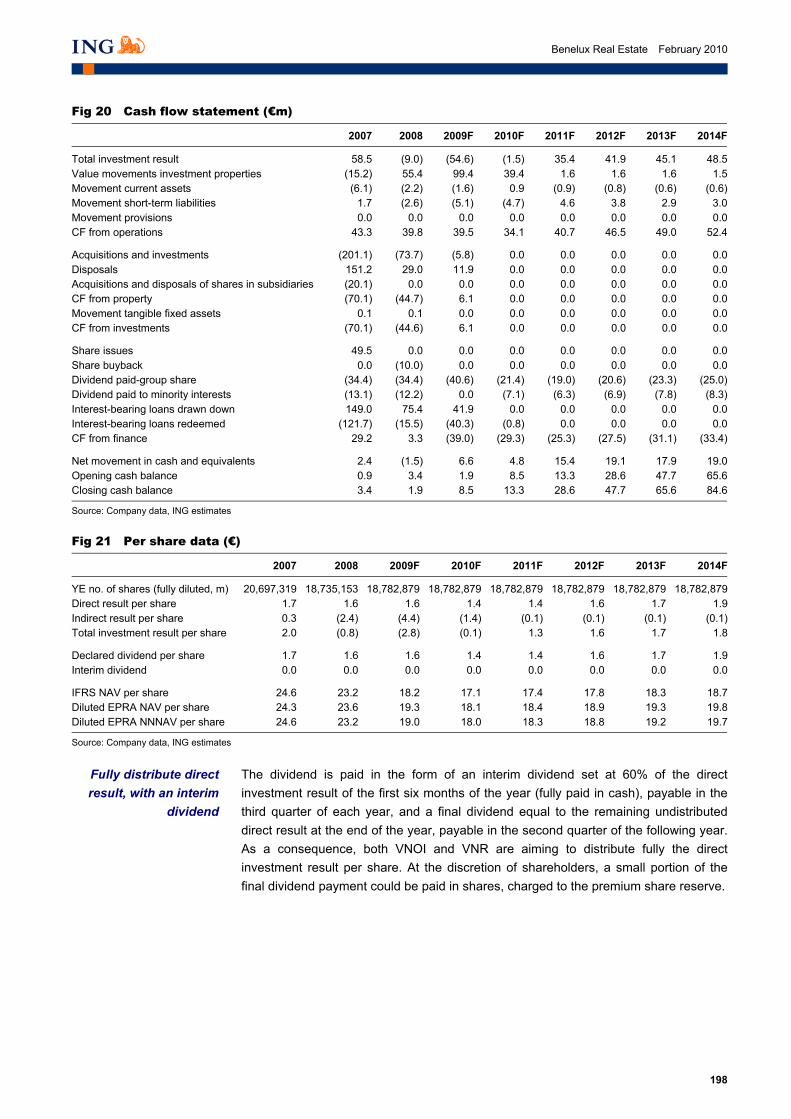
198
Benelux Real Estate February 2010
Fig 20 Cash flow statement (€m)
2007 2008 2009F 2010F 2011F 2012F 2013F 2014F
Total investment result 58.5 (9.0) (54.6) (1.5) 35.4 41.9 45.1 48.5Value movements investment properties (15.2) 55.4 99.4 39.4 1.6 1.6 1.6 1.5Movement current assets (6.1) (2.2) (1.6) 0.9 (0.9) (0.8) (0.6) (0.6)Movement short-term liabilities 1.7 (2.6) (5.1) (4.7) 4.6 3.8 2.9 3.0Movement provisions 0.0 0.0 0.0 0.0 0.0 0.0 0.0 0.0CF from operations 43.3 39.8 39.5 34.1 40.7 46.5 49.0 52.4
Acquisitions and investments (201.1) (73.7) (5.8) 0.0 0.0 0.0 0.0 0.0Disposals 151.2 29.0 11.9 0.0 0.0 0.0 0.0 0.0Acquisitions and disposals of shares in subsidiaries (20.1) 0.0 0.0 0.0 0.0 0.0 0.0 0.0CF from property (70.1) (44.7) 6.1 0.0 0.0 0.0 0.0 0.0Movement tangible fixed assets 0.1 0.1 0.0 0.0 0.0 0.0 0.0 0.0CF from investments (70.1) (44.6) 6.1 0.0 0.0 0.0 0.0 0.0
Share issues 49.5 0.0 0.0 0.0 0.0 0.0 0.0 0.0Share buyback 0.0 (10.0) 0.0 0.0 0.0 0.0 0.0 0.0Dividend paid-group share (34.4) (34.4) (40.6) (21.4) (19.0) (20.6) (23.3) (25.0)Dividend paid to minority interests (13.1) (12.2) 0.0 (7.1) (6.3) (6.9) (7.8) (8.3)Interest-bearing loans drawn down 149.0 75.4 41.9 0.0 0.0 0.0 0.0 0.0Interest-bearing loans redeemed (121.7) (15.5) (40.3) (0.8) 0.0 0.0 0.0 0.0CF from finance 29.2 3.3 (39.0) (29.3) (25.3) (27.5) (31.1) (33.4)
Net movement in cash and equivalents 2.4 (1.5) 6.6 4.8 15.4 19.1 17.9 19.0Opening cash balance 0.9 3.4 1.9 8.5 13.3 28.6 47.7 65.6Closing cash balance 3.4 1.9 8.5 13.3 28.6 47.7 65.6 84.6
Source: Company data, ING estimates _
Fig 21 Per share data (€)
2007 2008 2009F 2010F 2011F 2012F 2013F 2014F
YE no. of shares (fully diluted, m) 20,697,319 18,735,153 18,782,879 18,782,879 18,782,879 18,782,879 18,782,879 18,782,879Direct result per share 1.7 1.6 1.6 1.4 1.4 1.6 1.7 1.9Indirect result per share 0.3 (2.4) (4.4) (1.4) (0.1) (0.1) (0.1) (0.1)Total investment result per share 2.0 (0.8) (2.8) (0.1) 1.3 1.6 1.7 1.8
Declared dividend per share 1.7 1.6 1.6 1.4 1.4 1.6 1.7 1.9Interim dividend 0.0 0.0 0.0 0.0 0.0 0.0 0.0 0.0
IFRS NAV per share 24.6 23.2 18.2 17.1 17.4 17.8 18.3 18.7Diluted EPRA NAV per share 24.3 23.6 19.3 18.1 18.4 18.9 19.3 19.8Diluted EPRA NNNAV per share 24.6 23.2 19.0 18.0 18.3 18.8 19.2 19.7
Source: Company data, ING estimates
_
The dividend is paid in the form of an interim dividend set at 60% of the direct investment result of the first six months of the year (fully paid in cash), payable in the third quarter of each year, and a final dividend equal to the remaining undistributed direct result at the end of the year, payable in the second quarter of the following year. As a consequence, both VNOI and VNR are aiming to distribute fully the direct investment result per share. At the discretion of shareholders, a small portion of the final dividend payment could be paid in shares, charged to the premium share reserve.
Fully distribute direct result, with an interim
dividend

199
Benelux Real Estate February 2010
Fig 22 Quarterly profit and loss (€m)
4Q08 1Q09 2Q09 3Q09 4Q09F 1Q10F 2Q10F 3Q10F 4Q10F
Gross rents 22.4 22.1 21.7 20.9 19.3 19.0 18.5 18.0 18.1Operating expenses (2.9) (2.8) (2.8) (2.5) (2.5) (2.5) (2.4) (2.3) (2.3)Net rents 18.9 18.9 18.4 17.7 16.8 16.5 16.1 15.7 15.7Total value movement investment properties (47.2) (40.4) (21.7) (14.3) (22.9) (15.5) (10.0) (9.3) (4.6)Net result on disposals of investment properties (0.1) 0.1 (0.2) (0.1) 0.0 0.0 0.0 0.0 0.0Net income from investment properties (28.4) (21.4) (3.5) 3.3 (6.1) 1.1 6.1 6.3 11.1Total interest (6.6) (5.7) (5.0) (6.2) (5.3) (5.3) (5.3) (5.5) (5.4)Value movements in fin derivatives 0.0 0.0 0.0 (0.3) 0.0 0.0 0.0 0.0 0.0Exchange rate differences 0.0 0.0 0.0 0.0 0.0 0.0 0.0 0.0 0.0Net financing expenses (6.6) (5.7) (5.0) (6.4) (5.3) (5.3) (5.3) (5.5) (5.4)General expenses (1.6) (1.4) (1.5) (1.3) (1.4) (1.3) (1.3) (1.3) (1.3)Total expenses (8.2) (7.0) (6.5) (7.8) (6.6) (6.7) (6.6) (6.8) (6.7)Investment result before tax (36.6) (28.5) (10.0) (4.5) (12.8) (5.6) (0.5) (0.4) 4.4Income tax payable 0.2 0.0 0.1 0.0 0.0 0.0 0.0 0.0 0.0Movement in deferred tax assets and liabilities 0.4 0.3 0.1 0.2 0.5 0.3 0.2 0.2 0.1Investment result after taxes (36.1) (28.2) (9.9) (4.2) (12.3) (5.3) (0.4) (0.3) 4.4
Investment result attributable to minority interests 2.6 2.9 (1.8) 0.0 1.8 (1.6) (0.1) (0.1) 1.3Total investment result attributable to VNOI SH (33.4) (25.3) (11.7) (4.3) (10.5) (6.9) (0.5) (0.4) 5.8Total direct result 10.8 11.8 12.0 10.2 10.1 9.9 9.4 8.9 9.0Attributable to minority interests (3.3) (3.5) (3.5) (3.4) (3.4) 3.0 2.8 2.7 2.7Attributable to VNOI SH 7.5 8.3 8.5 6.8 6.8 6.9 6.6 6.2 6.3Total indirect result (46.9) (40.0) (21.9) (14.5) (22.5) (15.2) (9.8) (9.1) (4.5)Attributable to minority interests 6.0 6.4 1.7 3.4 5.2 (4.5) (2.9) (2.7) (1.4)Attributable to VNOI SH (40.9) (33.6) (20.1) (11.1) (17.3) (10.6) (6.8) (6.4) (3.2)
Source: Company data, ING estimates _
Fig 23 Quarterly cash flow statement (€m)
4Q08 1Q09 2Q09 3Q09 4Q09F 1Q10F 2Q10F 3Q10F 4Q10F
Total investment result (36.1) (28.2) (9.9) (4.2) (12.3) (5.3) (0.4) (0.3) 4.4Value movements investment properties 47.2 40.4 21.7 14.3 22.9 15.5 10.0 9.3 4.6Net result on disposals investment properties 0.1 (0.1) 0.2 0.1 0.0 0.0 0.0 0.0 0.0Movement current assets (2.4) (2.4) 0.0 (0.2) 0.9 0.2 0.4 0.3 0.0Movement short-term liabilities (4.4) 3.9 (2.5) (0.6) (5.8) (1.2) (2.1) (1.6) 0.2CF from operations 5.1 13.9 8.7 11.3 5.7 9.2 8.0 7.7 9.2
Acquisitions and investments (3.5) (3.2) (1.0) (1.6) 0.0 0.0 0.0 0.0 0.0Disposals 0.8 5.1 3.4 3.3 0.0 0.0 0.0 0.0 0.0CF from property (2.6) 1.9 2.4 1.7 0.0 0.0 0.0 0.0 0.0Movement tangible fixed assets 0.1 0.0 0.0 0.0 0.0 0.0 0.0 0.0 0.0CF from Investments (2.6) 1.8 2.5 1.8 0.0 0.0 0.0 0.0 0.0
Share issues 0.0 0.0 0.0 0.0 0.0 0.0 0.0 0.0 0.0Share buyback (10.0) 0.0 0.0 0.0 0.0 0.0 0.0 0.0 0.0Dividend paid-group share 9.6 0.0 (20.0) (20.6) 0.0 0.0 (15.3) (6.1) 0.0Dividend paid to minority interests (12.2) 0.0 (7.2) 7.2 0.0 0.0 (5.1) (2.0) 0.0Interest-bearing loans drawn down 8.8 38.7 (17.3) 20.5 0.0 0.0 0.0 0.0 0.0Interest-bearing loans redeemed (3.9) (53.6) 38.7 (24.8) (0.5) (0.3) (0.2) (0.2) (0.1)CF from finance (7.7) (14.9) (5.8) (17.8) (0.5) (0.3) (20.6) (8.3) (0.1)
Net movement in cash and equivalents (5.3) 0.8 5.3 (4.7) 5.3 8.9 (12.6) (0.5) 9.1Opening cash balance 7.1 1.9 2.7 8.0 3.2 8.5 17.3 4.7 4.2Closing cash balance 1.9 2.7 8.0 3.2 8.5 17.3 4.7 4.2 13.3
Source: Company data, ING estimates
_

200
Benelux Real Estate February 2010
Fig 24 Quarterly per share data (€)
4Q08 1Q09 2Q09 3Q09 4Q09F 1Q10F 2Q10F 3Q10F 4Q10F
YE no. of shares (fully diluted, m) 18,735,153 18,735,053 18,782,879 18,782,879 18,782,879 18,782,879 18,782,879 18,782,879 18,782,879Direct result per share 0.40 0.44 0.45 0.36 0.36 0.37 0.35 0.33 0.33Indirect result per share (2.18) (1.79) (1.07) (0.59) (0.92) (0.56) (0.36) (0.34) (0.17)Total investment result per share (1.78) (1.35) (0.62) (0.23) (0.56) (0.20) (0.01) (0.01) 0.17
Declared dividend per share 0.00 0.00 0.00 0.00 0.00 0.00 0.00 0.00 0.00Interim dividend 0.00 0.00 0.00 0.53 0.00 0.00 0.00 0.43 0.00
IFRS NAV per share 23.17 21.41 19.74 18.81 18.25 18.05 17.22 16.89 17.06Diluted EPRA NAV per share 23.63 22.28 20.54 19.80 19.26 19.08 18.26 17.94 18.11Diluted EPRA NNNAV per share 23.17 21.84 20.10 19.39 18.91 18.80 18.00 17.71 17.92
Recurring CFPS 0.76 0.82 0.83 0.73 0.72 0.37 0.35 0.33 0.33
Source: Company data, ING estimates
_

201
Benelux Real Estate February 2010
Netherlands
VastNed Retail Pan-euro high street property fund
Key ratios
2008 2009F
Turnover growth (%) 9.5 -0.9EBITDA margin (%) 88.5 88.5Operating margin (%) 97.8 96.1
Share data No. of shares (m) 18.3Daily turnover (shares) 58,000Free float (%) 100Enterprise value (€m) 851.25Market cap (€m) 1,746.34
12-month forecast returns (%) Share price 8.7Dividend 8.112m f'cst total return 16.8
Share price performance
20
30
40
50
60
70
80
1/08 7/08 1/09 7/09 1/10
Price AMX (rebased)
Source: ING
VNR has performed strongly since its March 2009 lows. Trading at an attractive 0.9x 2010F IFRS NAV, we believe VNR still has upside. VNR will profit from favourable rent reversion and quality acquisitions. We initiate with Buy.
Initiating coverage
€46.65 February 2010
Buy
Real Estate
€50.7 Target price (12 month)
VASN.AS Reuters
Jean-Yves Devloo Amsterdam (31) 20 563 8745 [email protected]
Arjan Knibbe Amsterdam (31) 20 563 8780 [email protected]
We are conservative on occupancy levels and total like for like, assuming vacancy levels reach 5% by mid 2010 and additional incentives. We expect secondary retail to continue to underperform prime retail. VNR has c.45% of its portfolio in high street retail and is currently cheap, in our view.
Sensitivity of our 2010F EPS to vacancy and total like-for-like (€)
Vacancy rate (%) 2.5 3.5 4.5 5.5 6.5 7.5 8.5 9.5 -2 3.79 3.72 3.66 3.59 3.53 3.46 3.39 3.33 -1 3.85 3.79 3.72 3.66 3.59 3.52 3.46 3.39 0 3.89 3.82 3.75 3.69 3.62 3.56 3.49 3.42LFL (%) 1 3.95 3.88 3.82 3.75 3.69 3.62 3.55 3.49 2 4.01 3.95 3.88 3.81 3.75 3.68 3.62 3.55 3 4.08 4.01 3.94 3.88 3.81 3.75 3.68 3.61 4 4.14 4.07 4.01 3.94 3.88 3.81 3.74 3.68 5 4.20 4.14 4.07 4.00 3.94 3.87 3.81 3.74
Source: ING estimates _
Key ratios and forecasts
2008 2009F 2010F 2011F 2012F
EPS adj (€) 3.71 4.05 3.77 3.85 3.93PER (x) 12.6 11.5 12.4 12.1 11.9Net yield (%) 5.8 6.2 6.1 6.1 6.2IFRS NAV per share (€) 60.8 51.6 50.7 51.4 52.2EPRA NAV per share (€) 64.3 54.9 54.0 54.7 55.5P/IFRS NAV (%) 0.77 0.90 0.92 0.91 0.89DPS (€) 3.85 4.05 3.77 3.85 3.93Dividend yield (%) 8.3 8.7 8.1 8.3 8.4CFPS (€) 4.23 4.78 3.77 3.85 3.93LTV (%) 42.1 41.3 41.7 41.2 40.6
Source: Company data, ING estimates _
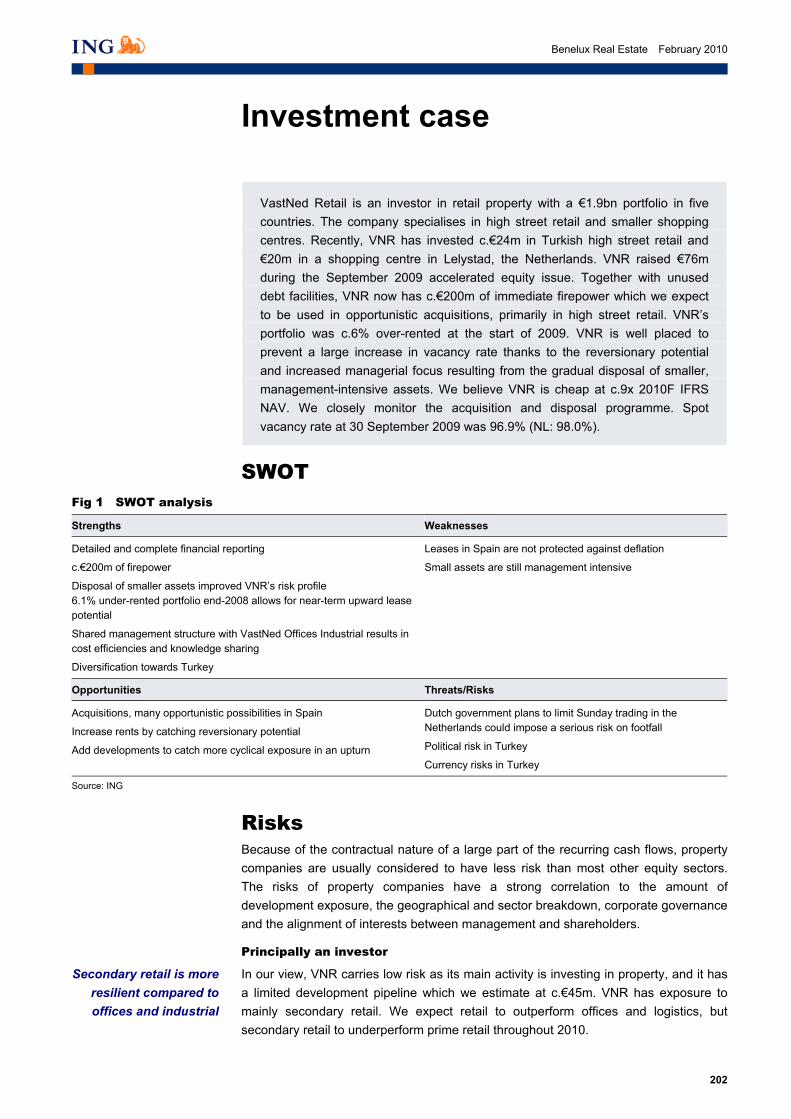
202
Benelux Real Estate February 2010
Investment case
VastNed Retail is an investor in retail property with a €1.9bn portfolio in five countries. The company specialises in high street retail and smaller shopping centres. Recently, VNR has invested c.€24m in Turkish high street retail and €20m in a shopping centre in Lelystad, the Netherlands. VNR raised €76m during the September 2009 accelerated equity issue. Together with unused debt facilities, VNR now has c.€200m of immediate firepower which we expect to be used in opportunistic acquisitions, primarily in high street retail. VNR’s portfolio was c.6% over-rented at the start of 2009. VNR is well placed to prevent a large increase in vacancy rate thanks to the reversionary potential and increased managerial focus resulting from the gradual disposal of smaller, management-intensive assets. We believe VNR is cheap at c.9x 2010F IFRS NAV. We closely monitor the acquisition and disposal programme. Spot vacancy rate at 30 September 2009 was 96.9% (NL: 98.0%).
SWOT Fig 1 SWOT analysis
Strengths Weaknesses
Detailed and complete financial reporting
c.€200m of firepower
Disposal of smaller assets improved VNR’s risk profile 6.1% under-rented portfolio end-2008 allows for near-term upward lease potential
Shared management structure with VastNed Offices Industrial results in cost efficiencies and knowledge sharing
Diversification towards Turkey
Leases in Spain are not protected against deflation
Small assets are still management intensive
Opportunities Threats/Risks
Acquisitions, many opportunistic possibilities in Spain
Increase rents by catching reversionary potential
Add developments to catch more cyclical exposure in an upturn
Dutch government plans to limit Sunday trading in the Netherlands could impose a serious risk on footfall
Political risk in Turkey
Currency risks in Turkey
Source: ING
_
Risks Because of the contractual nature of a large part of the recurring cash flows, property companies are usually considered to have less risk than most other equity sectors. The risks of property companies have a strong correlation to the amount of development exposure, the geographical and sector breakdown, corporate governance and the alignment of interests between management and shareholders.
Principally an investor
In our view, VNR carries low risk as its main activity is investing in property, and it has a limited development pipeline which we estimate at c.€45m. VNR has exposure to mainly secondary retail. We expect retail to outperform offices and logistics, but secondary retail to underperform prime retail throughout 2010.
Secondary retail is more resilient compared to offices and industrial

203
Benelux Real Estate February 2010
Tenant risk is not limited
VNR’s top two tenants were H&M and Inditex, taking c.4% and 2% of FY08 total rent-roll, respectively. We find the business models of both retailers fairly comparable and expect them to hold up well in the current economic circumstances.
Vacancy risk
At end-September 2009, VNR had a vacancy rate of c.3%, which we assume will increase only slightly taking into account additional incentives on new leases and renewals, which are primarily expected in Spain. The portfolio, which is currently c.6% under-rented, has benefited from higher rental levels on new lettings and renewals (especially in Belgium), a trend which we expect to continue into 2010.
Accounting for leases
Accounting initiatives may oblige tenants to account for long leases as a liability in their balance sheets. In future, this may put pressure on the average lease lengths of real estate companies and VNR.
No currency risks
VNR receives nearly all its rents and incurs all its costs in euro. VNR tries to realise Turkish rents mostly in euro, but this remains a small risk.
Catalysts Major catalysts for VNR include:
1) Accretive acquisitions at fire sale prices (taking into account the current firepower of c.€200m)
2) Lease renewals and new lettings at significantly higher rental levels (e.g. as observed in Belgium during 9M09), catching the reversionary potential
3) Increase of pre-let developments at attractive yield on cost levels
4) A further deterioration of retail vacancy rates in the Netherlands
5) FY09 results on 5 March 2010.
Outlook VNR confirmed its FY09 direct result EPS outlook of €4.00 in its 9M09 results communication. We expect a slightly higher full year result at €4.05, this being slightly positively influenced by the €20m Lelystad shopping centre acquisition of late December 2009. As VNR intends to fully distribute its direct result, dividend per share is expected to be €4.05. We do not expect this dividend to be sustainable into 2010 as we forecast a 7% decrease in EPS on the back of conservative vacancy and like-for-like assumptions.
Valuation We value VNR in line with its 2010F IFRS NAV, reaching a price target of €50.7. Dividend yield is solid at 8.1%, among the highest in the sector, although we do not expect this will be sustainable into 2010.
H&M and Inditex do not represent major risk, in
our view
Under-rented portfolio should support good
occupancy levels
Potential pressure on lease length
We expect VNR to beat the €4.00 direct result
per share forecast

204
Benelux Real Estate February 2010
Consensus Fig 2 Consensus estimates (€)
2008 2009F 2010F 2011F
Consensus 3.71 3.95 3.75 3.71ING 3.71 4.05 3.77 3.85Difference 0.00 0.10 0.02 0.14Difference (%) 0 2.5 0.6 3.7
Source: Reuters, ING estimates
_
We expect VNR to slightly outperform its 2009F EPS guidance, as opposed to consensus estimates.
Our estimates and assumptions 1) Development pipeline: we have not factored any future developments into our
forecasts.
2) Vacancies: we expect total vacancies to edge up to 5% by mid-2010, and gradually fall thereafter.
Fig 3 Vacancy assumptions overview (%)
2009F 2010F 2011F 2012F
Netherlands 2.5 2.8 2.0 2.0Spain 4.0 4.4 4.0 4.0France 1.0 1.6 1.5 1.5Belgium 1.0 1.6 1.5 1.5Turkey 32.6 12.5 10.0 10.0Portugal 1.0 1.8 1.0 1.0Total 3.9 4.3 3.4 3.4
Source: ING estimates
_
3) Like-for-like rental growth: note that this figure includes indexation, but also incentives and rent renegotiations. We believe we are conservative taking into account the under-rented portfolio, which is demonstrated by recent re-lettings at significantly higher rental levels (e.g. in Belgium).
Fig 4 Total like-for-like rental growth assumptions (%)
2009F 2010F 2011F 2012F
Netherlands -1.5 1.3 1.5 2.5Spain -2.0 0.5 0.9 1.9France -2.5 0.2 1.0 2.0Belgium -2.5 0.2 1.0 2.0Turkey 0.0 7.0 7.0 7.0Portugal -7.0 -2.0 -2.0 -2.0Total -2.5 0.5 0.7 1.6
Source: ING estimates
_
4) Portfolio valuations: we believe the portfolio will have been hit hardest during FY09, and some minor adjustments will probably follow in Spain, where the underlying fundamentals are weakest.

205
Benelux Real Estate February 2010
Fig 5 Portfolio valuation estimates (%)
2009F 2010F 2011F 2012F
Netherlands -3.1 -1.0 0.0 0.0Spain -17.9 -4.4 0.0 0.0France -6.2 0.0 0.0 0.0Belgium -0.2 0.0 2.0 2.0Turkey 1.9 0.0 2.0 2.0Portugal -6.8 0.0 0.0 0.0Total -7.5 -1.4 0.4 0.4
Source: ING estimates
_

206
Benelux Real Estate February 2010
Company profile
VastNed Retail (VNR) was founded in 1986 and invests in three types of retail assets: high street retail shops (€907m), shopping centres (€826m) and retail warehouses (€262m). Assets are located in its four home markets (the Netherlands, France, Spain and Belgium) and recently less than €50 million emerging market exposure was built up in Turkey, where VNR decided to (temporarily) limit its exposure to 10% of the total portfolio (current exposure is limited at c.1%). There is also a limited presence in Portugal (€13m, fully let), but there is no intention to grow further in this country. VNR was floated on the NYSE Euronext Amsterdam and Paris exchanges in 1987 and 2004, respectively. The portfolio value totalled €1.9bn at end-3Q09. The Dutch and Belgian portfolio qualify as a FBI (“Fiscale Belegingsinstelling”) and a Bevak (“Beleggingsvennootschap met vast kapitaal”), which are the respective national REIT-like implementations, resulting in zero corporate income tax liability. The Belgian portfolio is held through a 71% stake in Intervest Retail, quoted on Euronext Brussels. See Figure 8 for a full overview of the organisational structure.
Fig 6 Geographic overview end-September 2009
Fig 7 Overview by type of asset end-2008
Netherlands37%
France22%
Belgium16%
Spain23%
Turkey1%
Portugal1%
High street shops45%
Shopping centres
41%
Other1%Retail
warehouses13%
Source: Company data Source: Company data
_
VNR is part of the VastNed Group and is the sister company of VastNed Offices/Industrial (VNOI). Both companies are internally managed by their own country management teams. The Belgium-listed subsidiaries, Intervest O/I and Intervest Retail, are managed by the same country management and are majority owned by VastNed O/I and VastNed Retail. The local teams are supervised by their respective mother company, located in Rotterdam, the Netherlands. VNR and VNOI respectively own 66.7% and 33.3% of the shares of VastNed Management, and the group management costs are spread proportionally. There is no profit being allocated to VastNed Management. We are positive on the cost efficiencies (some millions of Euros) and knowledge efficiencies that are realised on the back of this shared management structure. There are 108 employees in the VastNed group, which are on the payroll of VastNed Management and related companies (see organisation chart).
Mid-sized retail investor in developed Europe
and Turkey
Part of the VastNed Group, internal
management

207
Benelux Real Estate February 2010
Fig 8 Organisational structure of VastNed Group
(Paris)
71%
100%
VastNed Retails VastNed Offices/Industrial
Intervest Retails(Antwerp, Belgium)
VastNed RetailsNetherlands(Rotterdam)
VastNed Istanbul
VastNed ManagementEspaña(Madrid)
VastNed ManagementFrance(Paris)
VastNed Deutschland(Franfurt)
VastNed OfficesNetherlands(Rotterdam)
IntervestOffices/Industrial(Antwerp, Belgium)
VastNed Management
(Rotterdam, NDL)
100%
100%
66.7% 33.3%
100%
100%
55%
Note 1: Intervest Retail and Intervest O/I are Belgian majority owned subsidiaries of VNR and VNOI, respectively. They enjoy the Belgian REIT benefits (Bevak) and are quoted on Euronext Brussels. Apart from the VastNed participation, their shares are free float. Note 2: Intervest Retail and Intervest O/I have the same country management board, headed by Jean-Paul Sols Note 3: the management of the Portuguese retail portfolio is located in Madrid Source: ING
_
In November 2007, VNR received an indicative public takeover bid from IEF Capital, a venture between Dutch investment companies Inflation Index Fund and Bouwfonds Asset Management and a leading investor in Dutch real estate and inflation-linked products. IEF Capital made an indicative offer of €70 per VNR share in November 2007 (a premium of c.8% to the average share price prior to the bid). VNR initially rejected the primary offer, and a second exclusive round of negotiations during 1H08 was cancelled by IEF Capital because of the negative market outlook, particularly in Spain. In the course of this take-over process, VNR tried to increase its value through a break-up sale to a number of parties, but quickly abandoned this attempt due to worsened market conditions. In mid-2008, VNR reiterated its strategy of being a mid-sized European retail investor.
Portfolio At end-2008, 75% of VNR’s portfolio consisted of assets >€2.5m. During FY08, <70 smaller assets were divested at a price around book value (total proceeds c.€59m). VNR continuously monitors its portfolio with the idea that the lower end will be sold. It would like to double the size of its portfolio in c.5 years, diversified over high street shops (c.45%), shopping centres (c.35%) and retail warehouses (c.20%).
Failed takeover in 2007-08
Streamlining the portfolio for growth
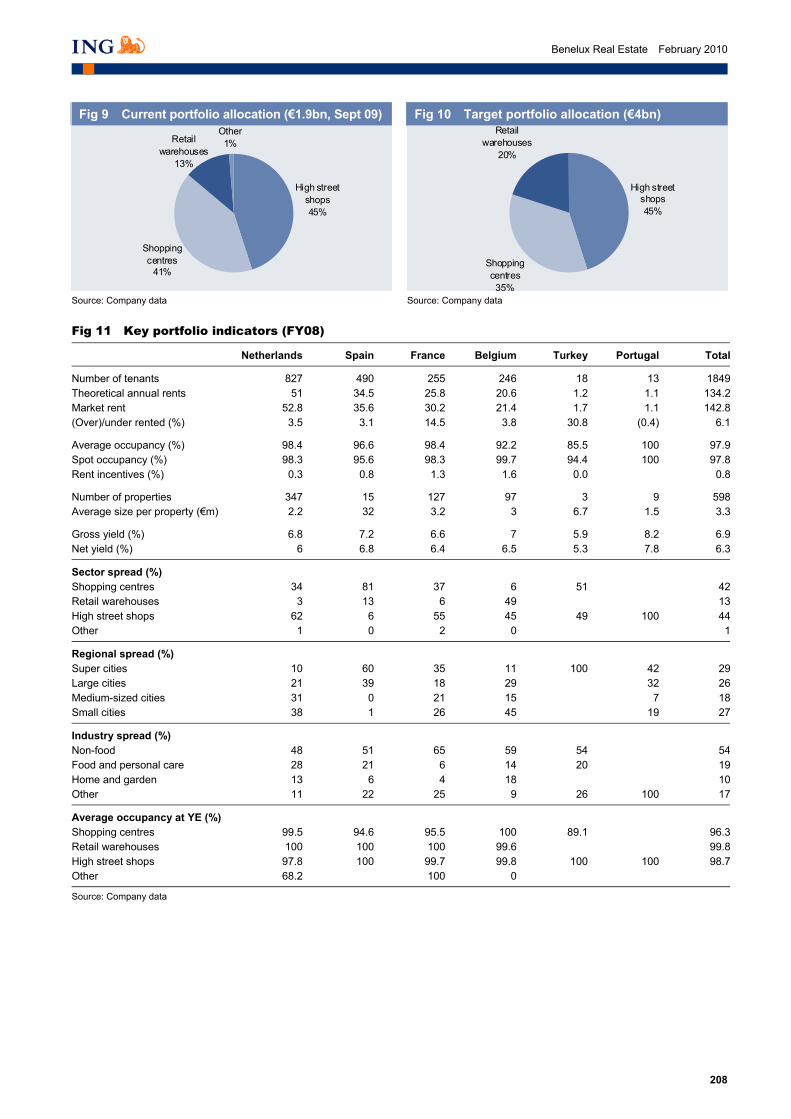
208
Benelux Real Estate February 2010
Fig 9 Current portfolio allocation (€1.9bn, Sept 09)
Fig 10 Target portfolio allocation (€4bn)
High street shops45%
Shopping centres
41%
Other1%Retail
warehouses13%
High street shops45%
Shopping centres35%
Retail warehouses
20%
Source: Company data Source: Company data
Fig 11 Key portfolio indicators (FY08)
Netherlands Spain France Belgium Turkey Portugal Total
Number of tenants 827 490 255 246 18 13 1849Theoretical annual rents 51 34.5 25.8 20.6 1.2 1.1 134.2Market rent 52.8 35.6 30.2 21.4 1.7 1.1 142.8(Over)/under rented (%) 3.5 3.1 14.5 3.8 30.8 (0.4) 6.1
Average occupancy (%) 98.4 96.6 98.4 92.2 85.5 100 97.9Spot occupancy (%) 98.3 95.6 98.3 99.7 94.4 100 97.8Rent incentives (%) 0.3 0.8 1.3 1.6 0.0 0.8
Number of properties 347 15 127 97 3 9 598Average size per property (€m) 2.2 32 3.2 3 6.7 1.5 3.3
Gross yield (%) 6.8 7.2 6.6 7 5.9 8.2 6.9Net yield (%) 6 6.8 6.4 6.5 5.3 7.8 6.3
Sector spread (%) Shopping centres 34 81 37 6 51 42Retail warehouses 3 13 6 49 13High street shops 62 6 55 45 49 100 44Other 1 0 2 0 1
Regional spread (%) Super cities 10 60 35 11 100 42 29Large cities 21 39 18 29 32 26Medium-sized cities 31 0 21 15 7 18Small cities 38 1 26 45 19 27
Industry spread (%) Non-food 48 51 65 59 54 54Food and personal care 28 21 6 14 20 19Home and garden 13 6 4 18 10Other 11 22 25 9 26 100 17
Average occupancy at YE (%) Shopping centres 99.5 94.6 95.5 100 89.1 96.3Retail warehouses 100 100 100 99.6 99.8High street shops 97.8 100 99.7 99.8 100 100 98.7Other 68.2 100 0
Source: Company data
_
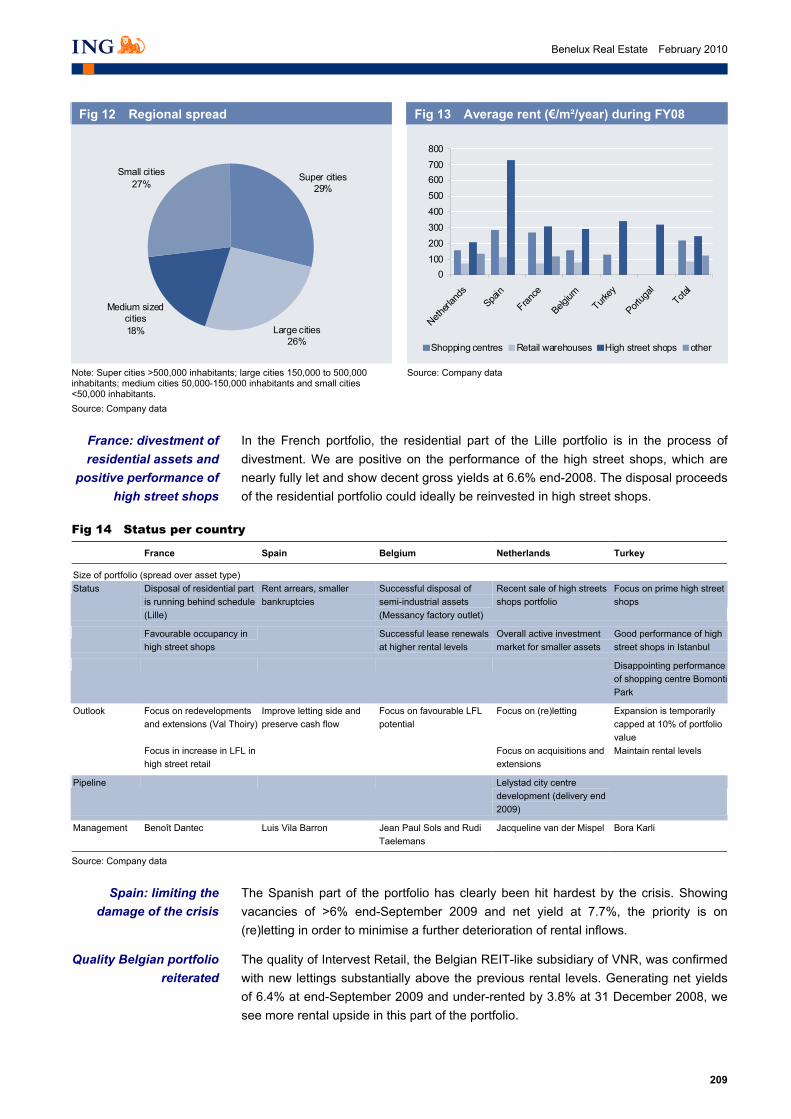
209
Benelux Real Estate February 2010
Fig 12 Regional spread
Fig 13 Average rent (€/m²/year) during FY08
Super cities29%
Large cities26%
Medium sized cities18%
Small cities27%
0100200300400500600700800
Netherl
ands
Spain
France
Belgium
Turkey
Portug
alTota
l
Shopping centres Retail warehouses High street shops other
Note: Super cities >500,000 inhabitants; large cities 150,000 to 500,000 inhabitants; medium cities 50,000-150,000 inhabitants and small cities <50,000 inhabitants. Source: Company data
Source: Company data
_
In the French portfolio, the residential part of the Lille portfolio is in the process of divestment. We are positive on the performance of the high street shops, which are nearly fully let and show decent gross yields at 6.6% end-2008. The disposal proceeds of the residential portfolio could ideally be reinvested in high street shops.
Fig 14 Status per country
France Spain Belgium Netherlands Turkey
Size of portfolio (spread over asset type) Status Disposal of residential part
is running behind schedule (Lille)
Rent arrears, smaller bankruptcies
Successful disposal of semi-industrial assets (Messancy factory outlet)
Recent sale of high streets shops portfolio
Focus on prime high street shops
Favourable occupancy in high street shops
Successful lease renewals at higher rental levels
Overall active investment market for smaller assets
Good performance of high street shops in Istanbul
Disappointing performance of shopping centre Bomonti Park
Outlook Focus on redevelopments and extensions (Val Thoiry)
Improve letting side and preserve cash flow
Focus on favourable LFL potential
Focus on (re)letting Expansion is temporarily capped at 10% of portfolio value
Focus in increase in LFL in high street retail
Focus on acquisitions and extensions
Maintain rental levels
Pipeline Lelystad city centre development (delivery end 2009)
Management Benoît Dantec Luis Vila Barron Jean Paul Sols and Rudi Taelemans
Jacqueline van der Mispel Bora Karli
Source: Company data
_
The Spanish part of the portfolio has clearly been hit hardest by the crisis. Showing vacancies of >6% end-September 2009 and net yield at 7.7%, the priority is on (re)letting in order to minimise a further deterioration of rental inflows.
The quality of Intervest Retail, the Belgian REIT-like subsidiary of VNR, was confirmed with new lettings substantially above the previous rental levels. Generating net yields of 6.4% at end-September 2009 and under-rented by 3.8% at 31 December 2008, we see more rental upside in this part of the portfolio.
Spain: limiting the damage of the crisis
Quality Belgian portfolio reiterated
France: divestment of residential assets and
positive performance of high street shops
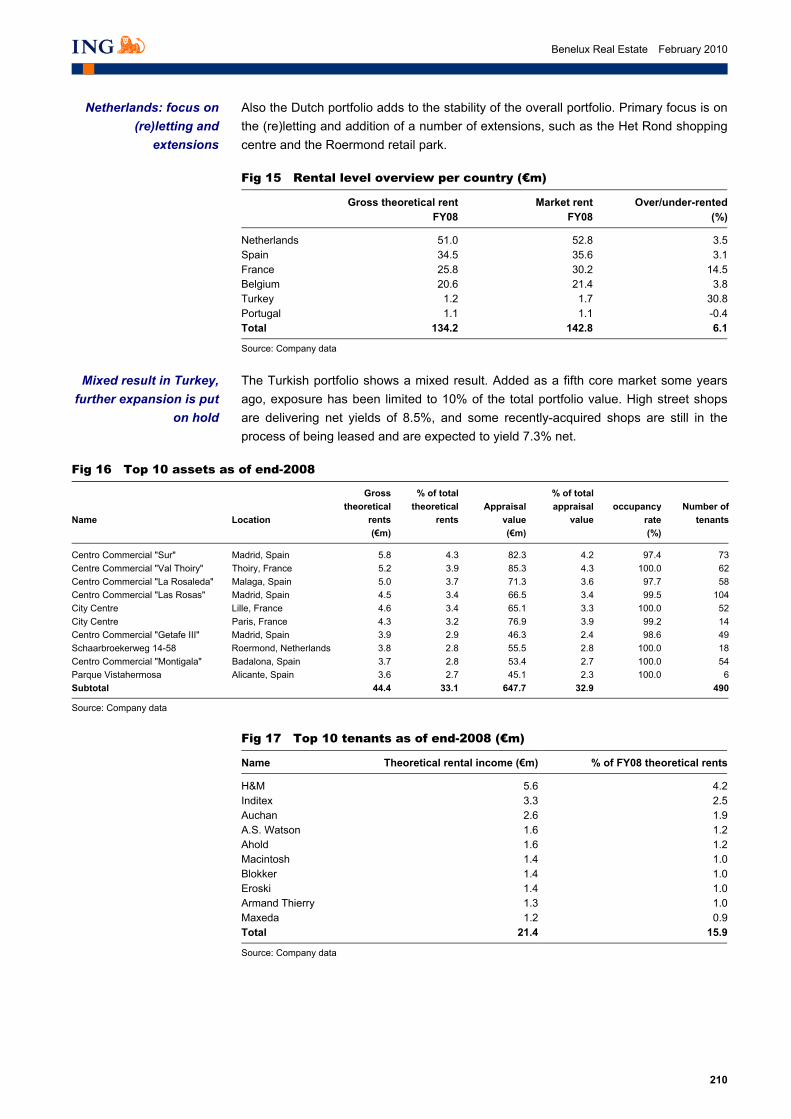
210
Benelux Real Estate February 2010
Also the Dutch portfolio adds to the stability of the overall portfolio. Primary focus is on the (re)letting and addition of a number of extensions, such as the Het Rond shopping centre and the Roermond retail park.
Fig 15 Rental level overview per country (€m)
Gross theoretical rent FY08
Market rentFY08
Over/under-rented(%)
Netherlands 51.0 52.8 3.5Spain 34.5 35.6 3.1France 25.8 30.2 14.5Belgium 20.6 21.4 3.8Turkey 1.2 1.7 30.8Portugal 1.1 1.1 -0.4Total 134.2 142.8 6.1
Source: Company data
_
The Turkish portfolio shows a mixed result. Added as a fifth core market some years ago, exposure has been limited to 10% of the total portfolio value. High street shops are delivering net yields of 8.5%, and some recently-acquired shops are still in the process of being leased and are expected to yield 7.3% net.
Fig 16 Top 10 assets as of end-2008
Name Location
Gross theoretical
rents
% of total theoretical
rentsAppraisal
value
% of total appraisal
valueoccupancy
rateNumber of
tenants (€m) (€m) (%)
Centro Commercial "Sur" Madrid, Spain 5.8 4.3 82.3 4.2 97.4 73Centre Commercial "Val Thoiry" Thoiry, France 5.2 3.9 85.3 4.3 100.0 62Centro Commercial "La Rosaleda" Malaga, Spain 5.0 3.7 71.3 3.6 97.7 58Centro Commercial "Las Rosas" Madrid, Spain 4.5 3.4 66.5 3.4 99.5 104City Centre Lille, France 4.6 3.4 65.1 3.3 100.0 52City Centre Paris, France 4.3 3.2 76.9 3.9 99.2 14Centro Commercial "Getafe III" Madrid, Spain 3.9 2.9 46.3 2.4 98.6 49Schaarbroekerweg 14-58 Roermond, Netherlands 3.8 2.8 55.5 2.8 100.0 18Centro Commercial "Montigala" Badalona, Spain 3.7 2.8 53.4 2.7 100.0 54Parque Vistahermosa Alicante, Spain 3.6 2.7 45.1 2.3 100.0 6Subtotal 44.4 33.1 647.7 32.9 490
Source: Company data _
Fig 17 Top 10 tenants as of end-2008 (€m)
Name Theoretical rental income (€m) % of FY08 theoretical rents
H&M 5.6 4.2Inditex 3.3 2.5Auchan 2.6 1.9A.S. Watson 1.6 1.2Ahold 1.6 1.2Macintosh 1.4 1.0Blokker 1.4 1.0Eroski 1.4 1.0Armand Thierry 1.3 1.0Maxeda 1.2 0.9Total 21.4 15.9
Source: Company data
_
Netherlands: focus on (re)letting and
extensions
Mixed result in Turkey, further expansion is put
on hold

211
Benelux Real Estate February 2010
Corporate governance Top management CEO Reinier van Gerrevink, statutory director • CEO of VastNed Group since 2002
• Previously several management functions at ABN AMRO, Rodamco and Robeco
• Degree in Dutch law from the University of Utrecht
CFO Tom de Witte, statutory director • CFO of VastNed Group since 2003
• Previously an accountant at Deloitte
• Degrees in business economics, Dutch law and accounting, Erasmus University of Rotterdam
COO: replaced by top management Hans Pars, former CIO of VNR and VNOI, decided to leave the company mid-2009 in order to accept a new challenge as the CEO of Wereldhave NV. His function is temporarily shared between the other members of the management board.
General counsel and director investor relations Arnaud du Pont • General counsel and director investor relations since 2000
• Previously tax adviser with BDO and Pricewaterhouse Coopers
• Degree in tax law, Erasmus University Rotterdam
Wim Fieggen, director • Director strategy and planning since 2003
• Previously with Robeco, Rodamco, Roproperty and Altera
• Degree in economics, Erasmus University Rotterdam
Shareholder structure The chart below illustrates the main shareholders holding more than 5% of the shares of VNR. There is no shareholding agreement between these shareholders. As a result, the shares are 100% free float.
Fig 18 Shareholder structure end-January 2009 (%)
Commonwealth Bank of Australia
6%
ABP5%
Other73%
Fortis Investments8%
ING Clarion8%
Source: Bloomberg _
VastNed Group is currently in search of a
new CIO
100% free float

212
Benelux Real Estate February 2010
Financials
Fig 19 Balance sheet (€m)
2008 2009F 2010F 2011F 2012F 2013F 2014F
Total investment properties 2,014.8 1,879.0 1,853.6 1,860.2 1,867.0 1,873.9 1,881.0Total fixed assets 2,017.1 1,881.3 1,855.8 1,862.5 1,869.3 1,876.2 1,883.2Total current assets 26.5 18.5 21.3 30.0 40.2 51.9 64.1Total assets 2,043.6 1,899.8 1,877.2 1,892.5 1,909.4 1,928.1 1,947.3
Equity VNR shareholders 998.2 943.4 925.2 939.0 953.2 968.1 983.5Equity minority interests 96.2 95.8 94.1 93.4 92.7 92.1 91.4Total equity 1,094.4 1,039.2 1,019.3 1,032.4 1,045.9 1,060.1 1,074.8Deferred tax liabilities 40.5 24.4 21.9 22.6 23.2 23.9 24.6Total long-term liabilities 690.5 684.3 681.8 682.4 683.1 683.8 684.5Payables to banks 183.4 96.8 96.6 97.5 99.0 101.1 103.2Redemption long-term liabilities 36.3 41.6 41.5 41.9 42.6 43.5 44.4Income tax 4.3 3.4 3.4 3.4 3.5 3.6 3.6Other debts, accruals and deferred income 34.6 34.5 34.5 34.8 35.3 36.1 36.8Total short-term liabilities 258.6 176.3 176.1 177.6 180.4 184.2 188.0Total equity and liabilities 2,043.6 1,899.8 1,877.2 1,892.5 1,909.4 1,928.1 1,947.3
Source: Company data, ING estimates _
Fig 20 Profit and loss (€m)
2008 2009F 2010F 2011F 2012F 2013F 2014F
Gross rents 132.0 131.0 128.2 129.7 131.3 133.8 136.6Total operating expenses (15.2) (15.1) (15.4) (15.6) (15.8) (16.1) (16.4)Net rents 116.9 115.9 112.8 114.1 115.6 117.8 120.2Total value movement investment properties (122.6) (140.7) (25.5) 6.6 6.8 6.9 7.1Net result on disposals of investment properties 0.9 2.3 0.0 0.0 0.0 0.0 0.0Net income from investment properties (4.8) (22.5) 87.3 120.8 122.4 124.7 127.3Total interest (38.8) (32.1) (29.3) (29.0) (28.7) (28.3) (27.9)Value movements in fin derivatives (0.5) (0.9) 0.0 0.0 0.0 0.0 0.0Exchange rate differences 0.0 0.0 0.0 0.0 0.0 0.0 0.0Net financing expenses (39.3) (32.9) (29.3) (29.0) (28.7) (28.3) (27.9)General expenses (10.2) (7.2) (7.0) (7.1) (7.2) (7.4) (7.5)Total expenses (49.5) (40.2) (36.3) (36.1) (35.9) (35.7) (35.4)Investment result before tax (54.4) (62.7) 51.0 84.6 86.5 89.0 91.8Current income tax expense (1.7) (1.5) (1.6) (1.6) (1.6) (1.6) (1.7)Movement in deferred tax assets and liabilities 12.3 14.0 2.5 (0.7) (0.7) (0.7) (0.7)Investment result after taxes (43.8) (50.3) 52.0 82.4 84.2 86.7 89.5
Investment result attributable to minority interests (7.2) (5.1) 5.5 6.2 6.4 6.6 6.8Direct part (5.2) (6.2) 6.0 6.1 6.2 6.4 6.6Indirect part (2.1) 1.1 (0.5) 0.1 0.1 0.1 0.1Total investment result attributable to VNR SH (51.1) (55.4) 57.5 88.6 90.5 93.2 96.2Total direct result 66.0 75.1 74.9 76.4 78.1 80.5 83.1Attributable to minority interests (5.2) (6.2) 6.0 6.1 6.2 6.4 6.6Attributable to VNR SH 60.9 68.9 68.9 70.3 71.8 74.0 76.5Total indirect result (109.9) (125.3) (22.9) 6.0 6.1 6.2 6.4Attributable to minority interests (2.1) 1.1 (0.5) 0.1 0.1 0.1 0.1Attributable to VNR SH (111.9) (124.2) (22.5) 5.9 6.0 6.1 6.2
Source: Company data, ING estimates
_
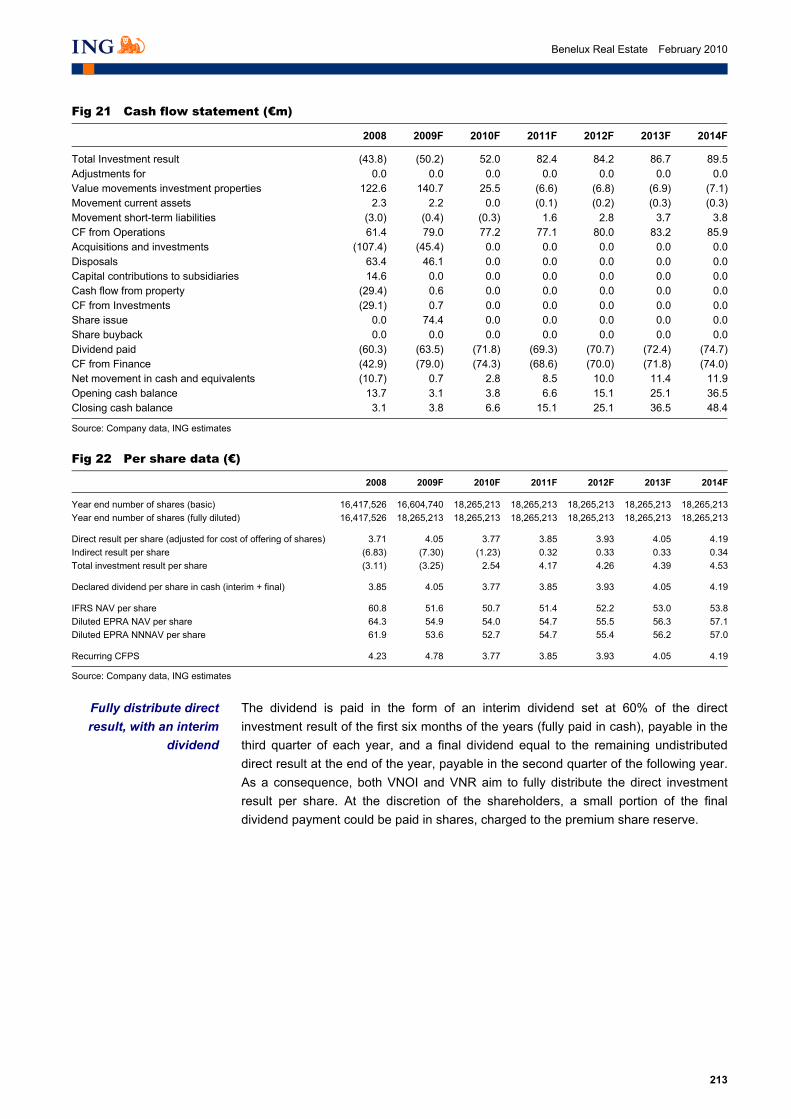
213
Benelux Real Estate February 2010
Fig 21 Cash flow statement (€m)
2008 2009F 2010F 2011F 2012F 2013F 2014F
Total Investment result (43.8) (50.2) 52.0 82.4 84.2 86.7 89.5Adjustments for 0.0 0.0 0.0 0.0 0.0 0.0 0.0Value movements investment properties 122.6 140.7 25.5 (6.6) (6.8) (6.9) (7.1)Movement current assets 2.3 2.2 0.0 (0.1) (0.2) (0.3) (0.3)Movement short-term liabilities (3.0) (0.4) (0.3) 1.6 2.8 3.7 3.8CF from Operations 61.4 79.0 77.2 77.1 80.0 83.2 85.9Acquisitions and investments (107.4) (45.4) 0.0 0.0 0.0 0.0 0.0Disposals 63.4 46.1 0.0 0.0 0.0 0.0 0.0Capital contributions to subsidiaries 14.6 0.0 0.0 0.0 0.0 0.0 0.0Cash flow from property (29.4) 0.6 0.0 0.0 0.0 0.0 0.0CF from Investments (29.1) 0.7 0.0 0.0 0.0 0.0 0.0Share issue 0.0 74.4 0.0 0.0 0.0 0.0 0.0Share buyback 0.0 0.0 0.0 0.0 0.0 0.0 0.0Dividend paid (60.3) (63.5) (71.8) (69.3) (70.7) (72.4) (74.7)CF from Finance (42.9) (79.0) (74.3) (68.6) (70.0) (71.8) (74.0)Net movement in cash and equivalents (10.7) 0.7 2.8 8.5 10.0 11.4 11.9Opening cash balance 13.7 3.1 3.8 6.6 15.1 25.1 36.5Closing cash balance 3.1 3.8 6.6 15.1 25.1 36.5 48.4
Source: Company data, ING estimates _
Fig 22 Per share data (€)
2008 2009F 2010F 2011F 2012F 2013F 2014F
Year end number of shares (basic) 16,417,526 16,604,740 18,265,213 18,265,213 18,265,213 18,265,213 18,265,213Year end number of shares (fully diluted) 16,417,526 18,265,213 18,265,213 18,265,213 18,265,213 18,265,213 18,265,213
Direct result per share (adjusted for cost of offering of shares) 3.71 4.05 3.77 3.85 3.93 4.05 4.19Indirect result per share (6.83) (7.30) (1.23) 0.32 0.33 0.33 0.34Total investment result per share (3.11) (3.25) 2.54 4.17 4.26 4.39 4.53
Declared dividend per share in cash (interim + final) 3.85 4.05 3.77 3.85 3.93 4.05 4.19
IFRS NAV per share 60.8 51.6 50.7 51.4 52.2 53.0 53.8Diluted EPRA NAV per share 64.3 54.9 54.0 54.7 55.5 56.3 57.1Diluted EPRA NNNAV per share 61.9 53.6 52.7 54.7 55.4 56.2 57.0
Recurring CFPS 4.23 4.78 3.77 3.85 3.93 4.05 4.19
Source: Company data, ING estimates
_
The dividend is paid in the form of an interim dividend set at 60% of the direct investment result of the first six months of the years (fully paid in cash), payable in the third quarter of each year, and a final dividend equal to the remaining undistributed direct result at the end of the year, payable in the second quarter of the following year. As a consequence, both VNOI and VNR aim to fully distribute the direct investment result per share. At the discretion of the shareholders, a small portion of the final dividend payment could be paid in shares, charged to the premium share reserve.
Fully distribute direct result, with an interim
dividend

214
Benelux Real Estate February 2010
Fig 23 Quarterly profit and loss (€m)
4Q08 1Q09 2Q09 3Q09 4Q09F 1Q10F 2Q10F 3Q10F 4Q10F
Gross rents 33.5 33.1 33.0 32.6 32.3 32.1 31.9 32.0 32.2Total operating expenses 0.0 (3.7) (3.8) (3.8) (3.9) (3.8) (3.8) (3.8) (3.9)Net rents 29.8 29.4 29.2 28.8 28.4 28.2 28.0 28.2 28.4Total value movement investment properties (91.1) (59.8) (54.4) (14.1) (12.4) (11.8) (7.6) (4.0) (2.0)Net result on disposals of investment properties (0.2) 0.1 2.2 0.0 0.0 0.0 0.0 0.0 0.0Net income from investment properties (61.5) (30.3) (22.9) 14.7 16.0 16.4 20.4 24.2 26.4Total interest (10.0) (8.9) (7.9) (7.9) (7.4) (7.2) (7.3) (7.4) (7.3)Value movements in fin derivatives (0.5) (0.2) (0.1) (0.5) 0.0 0.0 0.0 0.0 0.0Exchange rate differences 0.0 0.0 0.0 0.0 0.0 0.0 0.0 0.0 0.0Net financing expenses (10.5) (9.1) (8.0) (8.4) (7.4) (7.2) (7.3) (7.4) (7.3)General expenses (2.0) (1.9) (1.7) (1.8) (1.8) (1.8) (1.8) (1.8) (1.8)Total expenses (12.4) (11.1) (9.7) (10.2) (9.2) (9.0) (9.0) (9.2) (9.1)Investment result before tax (73.9) (41.4) (32.6) 4.5 6.9 7.4 11.4 14.9 17.3Current income tax expense (0.2) (0.3) (0.4) (0.4) (0.4) (0.4) (0.4) (0.4) (0.4)Movement in deferred tax assets and liabilities 5.0 4.5 6.7 1.5 1.2 1.2 0.8 0.4 0.2Investment result after taxes (69.1) (37.1) (26.4) 5.6 7.7 8.2 11.8 15.0 17.1
Investment result attributable to minority interests 2.2 (1.6) (0.1) (1.7) (1.7) 1.3 1.4 1.4 1.5Direct part (1.5) (1.6) (1.6) (1.5) (1.5) 1.5 1.5 1.5 1.5Indirect part 3.7 (0.1) 1.5 (0.2) (0.2) (0.2) (0.1) (0.1) 0.0Total investment result attributable to VNR SH (66.9) (38.7) (26.5) 3.8 6.0 9.5 13.1 16.4 18.5Total direct result 17.6 18.3 19.1 18.8 18.9 18.9 18.6 18.6 18.8Attributable to minority interests (1.5) (1.6) (1.6) (1.5) (1.5) 1.5 1.5 1.5 1.5Attributable to VNR SH 16.1 16.8 17.5 17.2 17.3 17.4 17.1 17.1 17.3Total indirect result (86.8) (55.4) (45.5) (13.2) (11.2) (10.7) (6.9) (3.6) (1.8)Attributable to minority interests 3.7 (0.1) 1.5 (0.2) (0.2) (0.2) (0.1) (0.1) 0.0Attributable to VNR SH (83.0) (55.5) (44.0) (13.4) (11.3) (10.5) (6.7) (3.5) (1.8)
Source: Company data, ING estimates _
Fig 24 Quarterly cash flow statement (€m)
4Q08 1Q09 2Q09 3Q09 4Q09F 1Q10F 2Q10F 3Q10F 4Q10F
Total Investment result (69.1) (37.1) (26.4) 5.6 7.7 8.2 11.8 15.0 17.1Adjustments for 0.0 0.0 0.0 0.0 0.0 0.0 0.0 0.0 0.0Value movements investment properties 91.1 59.8 54.4 14.1 12.4 11.8 7.6 4.0 2.0Net result on disposals investment properties 0.2 (0.1) (2.2) 0.0 0.0 0.0 0.0 0.0 0.0Movement current assets 0.6 0.1 2.6 (0.6) 0.2 0.1 0.1 (0.1) (0.1)Movement short-term liabilities 5.1 0.2 0.0 1.4 (1.9) (1.2) (1.2) 0.8 1.2Movement provisions (0.6) (0.6) 0.2 0.2 0.0 0.0 0.0 0.0 0.0CF from Operations 26.9 20.0 23.1 17.7 18.3 19.0 18.3 19.7 20.2
Acquisitions and investments (37.8) (7.7) (11.6) (6.0) (20.0) 0.0 0.0 0.0 0.0Disposals 34.0 6.6 37.1 2.5 0.0 0.0 0.0 0.0 0.0Capital contributions to subsidiaries 14.6 0.0 0.0 0.0 0.0 0.0 0.0 0.0 0.0Cash flow from property 10.8 (1.2) 25.4 (3.6) (20.0) 0.0 0.0 0.0 0.0Movement tangible fixed assets 0.1 0.1 (0.1) 0.0 0.0 0.0 0.0 0.0 0.0CF from Investments 10.9 (1.1) 25.4 (3.6) (20.0) 0.0 0.0 0.0 0.0
Share issue 0.0 0.0 0.0 74.4 0.0 0.0 0.0 0.0 0.0Share buyback 0.0 0.0 0.0 0.0 0.0 0.0 0.0 0.0 0.0Dividend paid 3.8 0.0 (37.8) (25.6) 0.0 0.0 (51.1) (20.7) 0.0Interest bearing loans redeemed (14.4) (42.6) (12.1) (74.5) (1.2) (1.2) (0.8) (0.4) (0.2)CF from Finance (36.6) (17.5) (46.8) (13.4) (1.2) (1.2) (51.9) (21.1) (0.2)
Net movement in cash and equivalents 1.1 1.3 1.6 0.7 (2.9) 17.8 (33.5) (1.4) 20.0Opening cash balance 1.9 3.1 4.4 6.0 6.7 3.8 21.6 (12.0) (13.4)Closing cash balance 3.1 4.4 6.0 6.7 3.8 21.6 (12.0) (13.4) 6.6
Source: Company data, ING estimates
_

215
Benelux Real Estate February 2010
Fig 25 Quarterly per share data (€)
4Q08 1Q09 2Q09 3Q09 4Q09F 1Q10F 2Q10F 3Q10F 4Q10F
Year end number of shares (basic) 16,417,526 16,417,526 16,604,740 16,604,740 16,604,740 18,265,213 18,265,213 18,265,213 18,265,213Year end number of shares (fully diluted) 16,417,526 16,417,526 16,417,526 16,417,526 18,265,213 18,265,213 18,265,213 18,265,213 18,265,213
Direct result per share 0.98 1.02 1.06 1.04 1.04 0.95 0.94 0.94 0.95Indirect result per share (5.06) (3.38) (2.67) (0.81) (0.68) (0.57) (0.37) (0.19) (0.10)Total investment result per share (4.08) (2.36) (1.61) 0.23 0.36 0.38 0.57 0.74 0.85
Final dividend declared 0.00 0.00 0.00 0.00 0.00 0.00 2.80 0.00 0.00Interim dividend 0.00 0.00 0.00 1.25 0.00 0.00 0.00 1.13 0.00
IFRS NAV per share 0.0 57.6 53.9 57.1 51.6 52.0 50.1 49.8 50.7diluted EPRA NAV per share 0.0 62.2 58.7 62.3 54.9 55.3 53.4 53.2 54.0diluted EPRA NNNAV per share 0.0 59.0 55.7 59.0 53.6 54.0 52.1 51.9 52.7
Recurring CFPS 0.00 1.21 1.26 1.22 1.23 0.95 0.94 0.94 0.95
Source: Company data, ING estimates
_

216
Benelux Real Estate February 2010
This page is left blank intentionally

217
Benelux Real Estate February 2010
Belgium
WDP Geared to seize opportunities?
Key ratios (%)
2008 2009F
Rental growth 21.6 17.9Operating margin 90.2 97.8Occupancy rate 99 94
Share data No. of shares (m) 12.5Daily turnover (shares) 13,000Free float (%) 68.6Enterprise value (€m) 873.2Market cap (€m) 408.9
12-month forecast returns (%) Share price -13.4Dividend 9.312m f'cst total return -4.1
Share price performance
1520253035404550
1/08 7/08 1/09 7/09 1/10
Price BEL 20 (rebased)
Source: ING
Currently valued at 1.2x 2010F IFRS NAV, we believe WDP is overbought. The dividend yield is still the highest in the sector at 9%. We downgrade to HOLD from Buy on the back of the meagre near-term development potential.
Previously: Buy
€32.65 February 2010
Hold
Real Estate
€28.2 Target price (12 month):
WDPP.BR Reuters
Jean-Yves Devloo Amsterdam (31) 20 563 8745 [email protected]
Arjan Knibbe Amsterdam (31) 20 563 8780 [email protected]
WDP’s balance sheet benefited from the recent rights issue and the sale and lease back transactions with DHL. EPS stability will be determined by the extent to which the remaining part of the speculative pipeline will be let and the lease expiries will be renegotiated.
Sensitivity of our 2010F EPS to vacancy rate and total like-for-like
Vacancy rate (%) 4 5 6 7 8 9 10 11 0 2.83 2.78 2.74 2.69 2.64 2.60 2.55 2.50 1 2.87 2.83 2.78 2.73 2.69 2.64 2.59 2.55LFL (%) 2 2.92 2.87 2.82 2.78 2.73 2.68 2.64 2.59 3 2.96 2.91 2.87 2.82 2.77 2.73 2.68 2.63 4 3.00 2.96 2.91 2.86 2.82 2.77 2.72 2.68 5 3.05 3.00 2.96 2.91 2.86 2.82 2.77 2.72 6 3.09 3.05 3.00 2.95 2.91 2.86 2.81 2.77 7 3.14 3.09 3.04 3.00 2.95 2.90 2.86 2.81
Source: ING estimates _
Key ratios and forecasts
2008 2009F 2010F 2011F 2012F
EPS adj (€) 3.64 2.94 2.81 2.93 3.05PER (x) 9.0 11.1 11.6 11.1 10.7Net yield (%) 7.0 6.9 7.5 7.7 7.9IFRS NAV per share (€) 30.4 27.5 26.9 26.8 26.7EPRA NNNAV per share (€) N/A N/A N/A N/A N/AP/IFRS NAV (%) 1.07 1.19 1.21 1.22 1.22DPS (€) 2.94 2.94 3.03 3.12 3.21Dividend yield (%) 9.0 9.0 9.3 9.6 9.8CFPS (€) 3.27 2.94 2.81 2.93 3.05LTV (%) 67.0 61.5 62.2 62.3 62.4
Source: Company data, ING estimates _

218
Benelux Real Estate February 2010
Investment case
WDP specialises in investing and developing logistics property across Europe. It owns an €804m portfolio, 70% of the rental value of which is in Belgium. At 30 September, management had already extended 72% of the leases that expire in 2010. Nevertheless, we feel WDP has become markedly expensive and do not see major upside in the coming months. WDP has executed a €74m rights issue and additional sale and lease back transactions in 2009. The confirmed dividend of €2.50 net per share is attractive as it results in a yield of 9%. Speculative developments have been halted, which limits the potential for near-term development gains.
We are confident WDP is going to be able to maintain the occupancy rate at current levels (if it was not able to lease current lease expiries and if recently delivered developed projects were not leased, vacancy would increase from the current level of 6% to 10%), thanks to its competitive price/quality and excellent reputation. We are positive on the development reputation WDP has established, together with the strategic land reserve built up in Romania, but do not see major opportunities occurring in the near future. HOLD.
SWOT Fig 1 SWOT analysis
Strengths Weaknesses
Thanks to its in-house development, WDP retains a development margin of c.10-15%. Consequently, it can afford the best price quality and the lowest cost of ownership compared to its peers.
Assets are of strategic importance to its tenants (eg, Belgian, Benelux or even European distribution centres).
Long-term duration of rental contracts (seven years).
Low rental reversion limits the risk of rents falling intensively in a downmarket.
Tenants have little exposure to the "risky" economic environment.
Strong commitment to pay out high and rising dividend each year.
Inflationary protected investment.
Virtually no corporate taxation thanks to SICAFI status.
Significant lease expiries (c.12% during 2009 and 4% in 2010F) have not all been replaced by new lets.
The final part of the speculative developments may further hurt the occupancy rate.
Still a high leverage.
Economic crisis probably will not allow any near term pre-let developments.
Quality of financial reporting (no quarterly cash flow statements and low level of compliance with EPRA best practice recommendations).
Legal form is a CV in stead of an NV (limited liability), resulting in the fact that shareholders may have less power compared to an NV.
Opportunities Threats
Acquisitions in foreign markets at fire sale prices.
Large strategic land reserve secures future potential.
Enough funding available to fund opportunities in the market?
Large fair value adjustments may hurt the leverage ratio.
Source: ING
Risks Because of the contractual nature of a large part of the recurring cash flows, property companies are usually considered to have less risk than most other equity sectors. The risk of property companies bears a strong correlation to the amount of
219
Benelux Real Estate February 2010
development exposure, the geographical and sector breakdown, corporate governance and alignment of interest between management and shareholders.
Investor, but also a developer
We believe that WDP is a medium-risk property company. It is principally an investor, which is the least risky activity of the four core real estate company activities: investment, development, trading and asset management. WDP has focused primarily on logistics property on important transport axes and intersections in the Netherlands, Belgium and France, and also has a 50% stake in a €50m land bank in Romania (but not yet any real estate assets). It develops on average 50,000-100,000m² of logistics surface per year, but since early 2009 has temporarily halted any further speculative developments.
Tenant risk
The largest tenant is the Univeg Group, representing c.14% of the rent payroll. This exposure is quite high, but is offset because (1) this part of rental income is derived from six different buildings spread over two different countries and three different activities; (2) the low economic risk of Univeg’s activities (distribution of fruit, vegetables and flowers and pre-prepared salads, etc); and (3) c.90% of Univeg’s rental contracts have a fixed duration of c.20 years.
Accounting for leases
There are accounting initiatives that may lead to tenants being required to account for long leases as a liability on their balance sheets. This may in future put pressure on the average lease lengths of real estate companies and WDP.
No currency risks
Nearly all rents and expenses are made in Euros. A minor proportion of the rents is derived from the Czech Republic (property value of c.€27m), but the exchange risk is negligible.
Catalysts We see the following catalysts:
• Negotiation of remaining upcoming lease expiries
• Leasing up the final phases of the speculative development pipeline
• Pre-lettings of developments either in Western Europe or in Romania
• Full year results on 17 February.
Outlook We forecast full year 2009F EPS of €2.94 per share, in line with the dividend of €2.94, which is composed of a dividend of €1.47 paid out to all existing shares prior to the rights issue and another €1.47 paid out to all shares after the rights issue. The dividend outlook was confirmed during the 3Q09 results communication.
Valuation We value WDP on a 5% premium to its 2010F IFRS NAV of €26.9. We note that a 10% premium may be justified in normal times given the lucrative development track record, however in the upcoming 12 months development gains will be low as WDP has temporarily paused any further speculative developments. Another reason for the
Speculative developments have
halted
Largest tenant Univeg pays 14% of rent-roll
Potential pressure on lease length

220
Benelux Real Estate February 2010
relatively high premium in current circumstances is the effect of derivatives value adjustments on equity, which is high compared to peers, and more than proportionally lowers IFRS per share (c.10%, in our view). EPRA NNNAV makes an adjustment for these flaws; however, WDP has not decided to implement significant EPRA Best Practices up to now. We would strongly appreciate greater adherence to the EPRA BPR and more complete financial reporting (quarterly cash flow statement).
Consensus Fig 2 Consensus EPS overview (€)
2009F 2010F 2011F
Consensus 2.97 2.94 3.18ING 2.94 2.81 2.94Difference (0.03) (0.13) (0.24)Difference (%) -0.9 -4.4 -7.4
Source: Reuters, ING estimates
_
Our EPS forecasts are modestly below consensus forecasts. This may be explained by a number of lease incentives that are in our model and a vacancy rate in line with current levels.
Our estimates and assumptions 1. Vacancies: we expect vacancies to edge up slightly above 6% into 2010 on the
back of lease expiries and speculative developments. We assume vacancies will normalise to 5% after a number of incentives should have materialised.
Fig 3 Vacancy assumptions (%)
Vacancy rate 2009F 2010F 2011F 2012F
Western Europe 5.9 6.5 5.5 5.0Czech republic 0.0 0.0 0.0 0.0Romania N/A N/A N/A N/ATotal 5.8 6.4 5.4 4.9
Source: ING estimates
_
2. Like-for-like rental growth: note that these estimates also take into account incentives, but not vacancy rates. We relied on ING macro economic estimates for the CPI forecasts and also took a number of incentives into account.
Fig 4 Total like-for-like rental growth assumptions (%)
Like-for-like rental growth 2009F 2010F 2011F 2012F
Western Europe -0.5 1.7 2.0 2.5Czech republic 0.0 1.5 2.0 2.0Romania N/A N/A N/A N/ATotal -0.5 1.7 2.0 2.5
Source: ING estimates
_
3. Portfolio valuation: we assume portfolio adjustments fade out into 2010.
Fig 5 Portfolio valuation forecasts (%)
2009F 2010F 2011F 2012F
Western Europe -3.3 -0.3 0.0 0.0CEE -18.2 -8.3 -0.5 0.0Total -5.4 -0.8 0.0 0.0
Source: ING estimates _

221
Benelux Real Estate February 2010
Company profile
In terms of real estate assets, WDP is the third-largest Sicafi in Belgium, with assets of c.€804m at the end of 3Q09. It is the market leader in semi-industrial and logistics real estate in Belgium. It has been using the Sicafi status since 1999, and hence has appeared in the Euronext Bel Mid index since 1999. It also acquired SIIC status in France, which enables it to enjoy comparable tax benefits by investing in French real estate compared with Belgian real estate. WDP is located in Wolvertem, on the outskirts of Brussels.
WDP’s core strategy is to offer flexibility to its clients by creating added value in three ways:
• Real estate development. Retaining a strategic reserve of land of c.€50m near the most important transport axes and intersections in the Netherlands, Belgium, France, and recently also Romania, WDP is ready to develop logistics and warehouse assets when opportunities arise. In this way, WDP develops an average logistics surface of 50,000-100,000m² per year. Having nearly completed the last parts of its speculative pipeline, WDP has stated it will not engage in any further speculative developments until market circumstances improve.
• Sale and leaseback operations of logistics centres of industrial companies looking to focus on their core activities. A good example is the sale and leaseback of three of DHL’s Belgian distribution centres during 1Q09 for an investment value of €29.7m and an initial yield of 8.7%.
• Real estate investment. This represents the traditional purchase of real estate assets and renovations, depending on clients’ needs, or making additional investments in existing buildings that have already been leased.
In 2007, WDP decided to grow its portfolio by also acquiring land assets in Romania, near access routes to Bucharest. This marked the start of a pan-European strategy of investing in semi-industrial and logistics real estate.
Portfolio profile WDP owns a €804m portfolio, of which c.€102m is in developments, and €50m in land. Some 30% of the rental income of the portfolio is generated outside Belgium. We estimate WDP owns nearly 100 sites in its portfolio, spread over five countries: Belgium, France, the Netherlands, Romania and the Czech Republic. The total surface area of land at the sites of the portfolio is <4m m², along with c.1.4m m² of buildings, including recent developments.
Largest semi-industrial real estate fund in
Belgium
Real estate developing, investing and sale and
lease backs
€50m strategic land reserve
Pan-European strategy

222
Benelux Real Estate February 2010
Fig 6 Rentable surface by category
Fig 7 Rental value per country
Offices 1%
Warehouses87%
Commercial premises
2%
Other2% Offices
adjoining warehouses
8%
Czech Republic
5% France10%
The Netherlands
15%
Belgium70%
Source: Company data Source: Company data
The portfolio is well balanced between the mature Western European market and growth markets in Eastern Europe. In the Netherlands, Belgium and France, WDP tries to be present at each important intersection on the Rotterdam-Antwerp-Brussels-Lille axis, locations characterised by strong demand for logistics solutions. The Nord-Pas-de-Calais region (Lille) in northern France in particular is recognised as a key location for transport towards affluent consumer regions such as Paris, London, Flanders and the Ruhr area. It is seen as a leading and stable logistics centre for the next 15 years by industry experts such as the Vlaams Instituut voor Logistiek and Cushman & Wakefield.
Fig 8 Fair value overview at end-1Q09
• Value: €73m• Gross yield: 8.56%• 118.000m²
France
• Value: €25m• Gross yield: N/A• 929.000m²• (landbank)
Romania
• Value: €27m• Gross yield: 8.79%• 39.000m²
Czech Republic
• Value: €127m• Gross yield: 8.06%• 180.000m²
Netherlands
• Value: €529m• Gross yield: 7.74%• 887.000m²
Belgium
• Value: €73m• Gross yield: 8.56%• 118.000m²
France• Value: €73m• Gross yield: 8.56%• 118.000m²
France
• Value: €25m• Gross yield: N/A• 929.000m²• (landbank)
Romania• Value: €25m• Gross yield: N/A• 929.000m²• (landbank)
Romania
• Value: €27m• Gross yield: 8.79%• 39.000m²
Czech Republic• Value: €27m• Gross yield: 8.79%• 39.000m²
Czech Republic
• Value: €127m• Gross yield: 8.06%• 180.000m²
Netherlands• Value: €127m• Gross yield: 8.06%• 180.000m²
Netherlands
• Value: €529m• Gross yield: 7.74%• 887.000m²
Belgium• Value: €529m• Gross yield: 7.74%• 887.000m²
Belgium
Source: June 2009 rights issue roadshow presentation
_
About half of the €40m strategic land bank owned by WDP is situated in Romania. This represents c0.9m m2. Even though no real estate has been bought or developed in this area, WDP believes this land portfolio remains of strategic importance given its location at the eastern border of the European Union. We found that WDP has obtained the most important certifications that allow it to begin development in this
Balance between mature and growth
markets
Strategic potential in Romania…
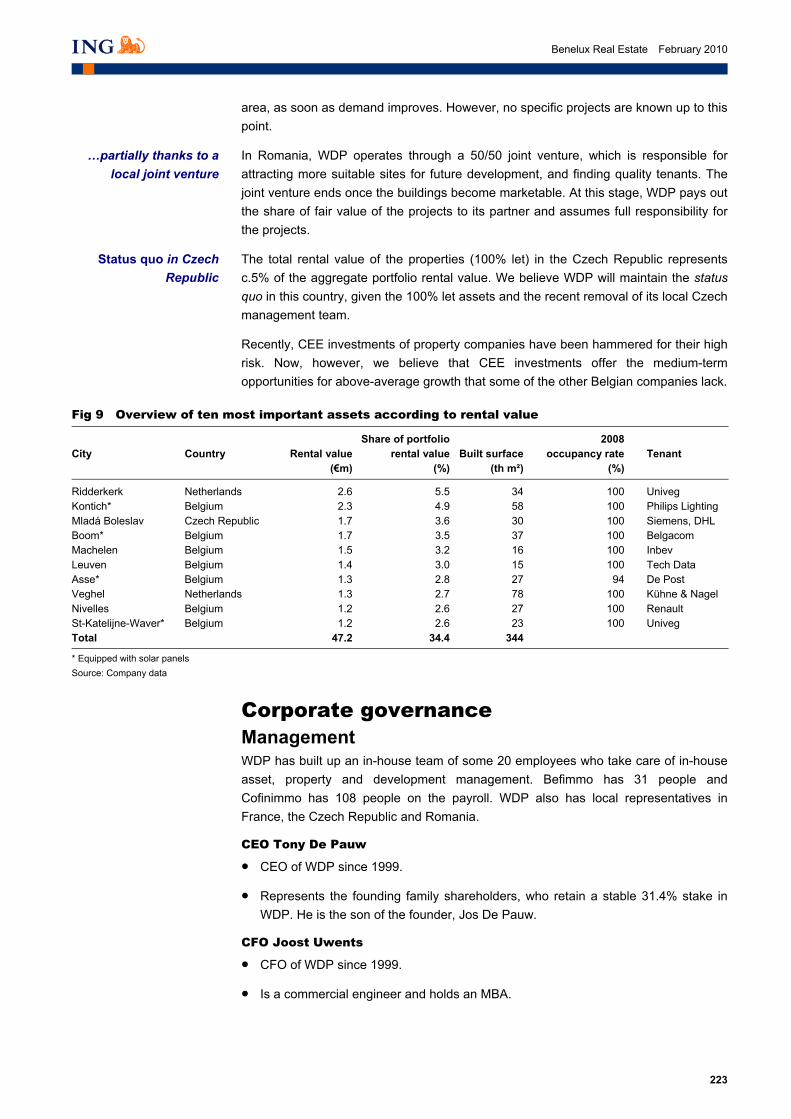
223
Benelux Real Estate February 2010
area, as soon as demand improves. However, no specific projects are known up to this point.
In Romania, WDP operates through a 50/50 joint venture, which is responsible for attracting more suitable sites for future development, and finding quality tenants. The joint venture ends once the buildings become marketable. At this stage, WDP pays out the share of fair value of the projects to its partner and assumes full responsibility for the projects.
The total rental value of the properties (100% let) in the Czech Republic represents c.5% of the aggregate portfolio rental value. We believe WDP will maintain the status quo in this country, given the 100% let assets and the recent removal of its local Czech management team.
Recently, CEE investments of property companies have been hammered for their high risk. Now, however, we believe that CEE investments offer the medium-term opportunities for above-average growth that some of the other Belgian companies lack.
Fig 9 Overview of ten most important assets according to rental value
City
Country Rental value
(€m)
Share of portfolio rental value
(%)Built surface
(th m²)
2008 occupancy rate
(%)
Tenant
Ridderkerk Netherlands 2.6 5.5 34 100 Univeg Kontich* Belgium 2.3 4.9 58 100 Philips Lighting Mladá Boleslav Czech Republic 1.7 3.6 30 100 Siemens, DHL Boom* Belgium 1.7 3.5 37 100 Belgacom Machelen Belgium 1.5 3.2 16 100 Inbev Leuven Belgium 1.4 3.0 15 100 Tech Data Asse* Belgium 1.3 2.8 27 94 De Post Veghel Netherlands 1.3 2.7 78 100 Kühne & Nagel Nivelles Belgium 1.2 2.6 27 100 Renault St-Katelijne-Waver* Belgium 1.2 2.6 23 100 Univeg Total 47.2 34.4 344
* Equipped with solar panels Source: Company data
_
Corporate governance Management WDP has built up an in-house team of some 20 employees who take care of in-house asset, property and development management. Befimmo has 31 people and Cofinimmo has 108 people on the payroll. WDP also has local representatives in France, the Czech Republic and Romania.
CEO Tony De Pauw
• CEO of WDP since 1999.
• Represents the founding family shareholders, who retain a stable 31.4% stake in WDP. He is the son of the founder, Jos De Pauw.
CFO Joost Uwents
• CFO of WDP since 1999.
• Is a commercial engineer and holds an MBA.
…partially thanks to a local joint venture
Status quo in Czech Republic

224
Benelux Real Estate February 2010
Shareholders and stock liquidity WDP obtained SICAFI status in 1999, and has a history that goes back to the 1970s. The De Pauw family has a 31.4% stake in the company and acts as the reference shareholder. The family kept its interest at the same level during the capital-raising related to the acquisition of the DHL distribution centres during 1Q09 and during the June 2009 rights issue.
Fig 10 Shareholder structure
De Pauw family31%
Free float69%
Source: Bloomberg
_
Free float of 68.6%
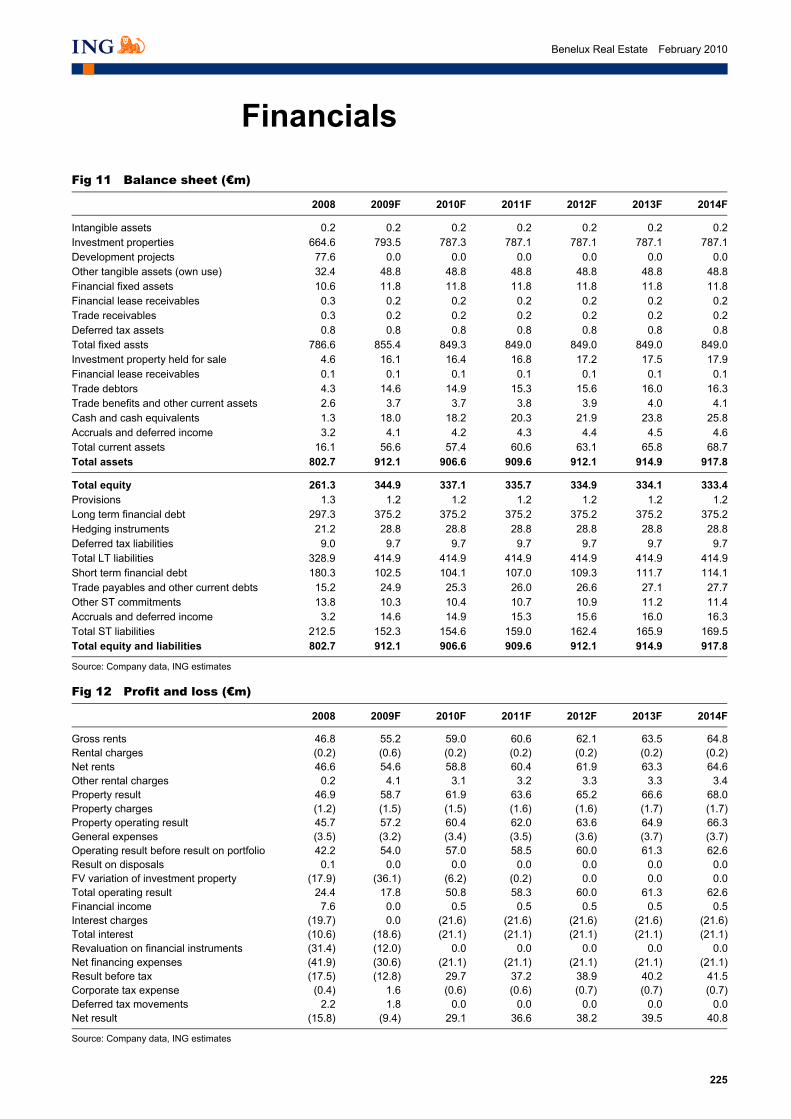
225
Benelux Real Estate February 2010
Financials
Fig 11 Balance sheet (€m)
2008 2009F 2010F 2011F 2012F 2013F 2014F
Intangible assets 0.2 0.2 0.2 0.2 0.2 0.2 0.2Investment properties 664.6 793.5 787.3 787.1 787.1 787.1 787.1Development projects 77.6 0.0 0.0 0.0 0.0 0.0 0.0Other tangible assets (own use) 32.4 48.8 48.8 48.8 48.8 48.8 48.8Financial fixed assets 10.6 11.8 11.8 11.8 11.8 11.8 11.8Financial lease receivables 0.3 0.2 0.2 0.2 0.2 0.2 0.2Trade receivables 0.3 0.2 0.2 0.2 0.2 0.2 0.2Deferred tax assets 0.8 0.8 0.8 0.8 0.8 0.8 0.8Total fixed assts 786.6 855.4 849.3 849.0 849.0 849.0 849.0Investment property held for sale 4.6 16.1 16.4 16.8 17.2 17.5 17.9Financial lease receivables 0.1 0.1 0.1 0.1 0.1 0.1 0.1Trade debtors 4.3 14.6 14.9 15.3 15.6 16.0 16.3Trade benefits and other current assets 2.6 3.7 3.7 3.8 3.9 4.0 4.1Cash and cash equivalents 1.3 18.0 18.2 20.3 21.9 23.8 25.8Accruals and deferred income 3.2 4.1 4.2 4.3 4.4 4.5 4.6Total current assets 16.1 56.6 57.4 60.6 63.1 65.8 68.7Total assets 802.7 912.1 906.6 909.6 912.1 914.9 917.8
Total equity 261.3 344.9 337.1 335.7 334.9 334.1 333.4Provisions 1.3 1.2 1.2 1.2 1.2 1.2 1.2Long term financial debt 297.3 375.2 375.2 375.2 375.2 375.2 375.2Hedging instruments 21.2 28.8 28.8 28.8 28.8 28.8 28.8Deferred tax liabilities 9.0 9.7 9.7 9.7 9.7 9.7 9.7Total LT liabilities 328.9 414.9 414.9 414.9 414.9 414.9 414.9Short term financial debt 180.3 102.5 104.1 107.0 109.3 111.7 114.1Trade payables and other current debts 15.2 24.9 25.3 26.0 26.6 27.1 27.7Other ST commitments 13.8 10.3 10.4 10.7 10.9 11.2 11.4Accruals and deferred income 3.2 14.6 14.9 15.3 15.6 16.0 16.3Total ST liabilities 212.5 152.3 154.6 159.0 162.4 165.9 169.5Total equity and liabilities 802.7 912.1 906.6 909.6 912.1 914.9 917.8
Source: Company data, ING estimates _
Fig 12 Profit and loss (€m)
2008 2009F 2010F 2011F 2012F 2013F 2014F
Gross rents 46.8 55.2 59.0 60.6 62.1 63.5 64.8Rental charges (0.2) (0.6) (0.2) (0.2) (0.2) (0.2) (0.2)Net rents 46.6 54.6 58.8 60.4 61.9 63.3 64.6Other rental charges 0.2 4.1 3.1 3.2 3.3 3.3 3.4Property result 46.9 58.7 61.9 63.6 65.2 66.6 68.0Property charges (1.2) (1.5) (1.5) (1.6) (1.6) (1.7) (1.7)Property operating result 45.7 57.2 60.4 62.0 63.6 64.9 66.3General expenses (3.5) (3.2) (3.4) (3.5) (3.6) (3.7) (3.7)Operating result before result on portfolio 42.2 54.0 57.0 58.5 60.0 61.3 62.6Result on disposals 0.1 0.0 0.0 0.0 0.0 0.0 0.0FV variation of investment property (17.9) (36.1) (6.2) (0.2) 0.0 0.0 0.0Total operating result 24.4 17.8 50.8 58.3 60.0 61.3 62.6Financial income 7.6 0.0 0.5 0.5 0.5 0.5 0.5Interest charges (19.7) 0.0 (21.6) (21.6) (21.6) (21.6) (21.6)Total interest (10.6) (18.6) (21.1) (21.1) (21.1) (21.1) (21.1)Revaluation on financial instruments (31.4) (12.0) 0.0 0.0 0.0 0.0 0.0Net financing expenses (41.9) (30.6) (21.1) (21.1) (21.1) (21.1) (21.1)Result before tax (17.5) (12.8) 29.7 37.2 38.9 40.2 41.5Corporate tax expense (0.4) 1.6 (0.6) (0.6) (0.7) (0.7) (0.7)Deferred tax movements 2.2 1.8 0.0 0.0 0.0 0.0 0.0Net result (15.8) (9.4) 29.1 36.6 38.2 39.5 40.8
Source: Company data, ING estimates _

226
Benelux Real Estate February 2010
Fig 13 Cash flow statement (€m)
2008 2009F 2010F 2011F 2012F 2013F 2014F
Profit for the year (15.8) (9.4) 29.1 36.6 38.2 39.5 40.8Total P/L from company activities (1.5) (9.4) 29.1 36.6 38.2 39.5 40.8Writedowns 0.2 0.0 0.0 0.0 0.0 0.0 0.0Change in provisions (0.2) 0.0 0.0 0.0 0.0 0.0 0.0FV variations in property 17.9 36.1 6.2 0.2 0.0 0.0 0.0Change in deferred taxes (1.7) 0.7 0.0 0.0 0.0 0.0 0.0FV on derivatives 29.6 12.0 0.0 0.0 0.0 0.0 0.0Increase in sales (0.1) 0.0 0.0 0.0 0.0 0.0 0.0Total adjustment for non-monetary items 45.7 48.7 6.2 0.2 0.0 0.0 0.0Change in working capital assets 9.6 (23.8) (0.6) (1.1) (0.9) (0.9) (0.9)Change in working capital liabilities 4.5 17.6 0.8 1.4 1.1 1.1 1.2Other (0.7) 0.0 0.0 0.0 0.0 0.0 0.0Total operating capital movements 13.3 (6.2) 0.2 0.3 0.3 0.3 0.3Interest received 2.2 0.0 0.0 0.0 0.0 0.0 0.0Income tax paid/received (0.4) 0.0 0.0 0.0 0.0 0.0 0.0CF from other operating activities 1.8 0.0 0.0 0.0 0.0 0.0 0.0Total cash from operations 59.5 33.1 35.4 37.1 38.5 39.8 41.1
Total cash from financing 104.1 (76.5) (35.3) (35.0) (36.8) (37.9) (39.1)
Acquisition payments for property investments (NET) (109.4) 0.0 0.0 0.0 0.0 0.0 0.0Payments in connection with project developments (37.8) 0.0 0.0 0.0 0.0 0.0 0.0Acquisition of other tangible and intangible fixed assets (26.0) 60.2 0.0 0.0 0.0 0.0 0.0Business combinations 0.0 0.0 0.0 0.0 0.0 0.0 0.0Total cash from purchases (173.1) 60.2 0.0 0.0 0.0 0.0 0.0Total cash from disposals 1.8 0.0 0.0 0.0 0.0 0.0 0.0Total cash from investing (171.3) 60.2 0.0 0.0 0.0 0.0 0.0
Net cash movement (7.7) 16.8 0.1 2.1 1.7 1.8 2.0Cash balance BOP 9.0 1.3 18.0 18.2 20.3 21.9 23.8Cash balance EOP 1.3 18.0 18.2 20.3 21.9 23.8 25.8
Source: Company data, ING estimates
_
Fig 14 Per share data (€)
2008 2009F 2010F 2011F 2012F 2013F 2014F
No. of shares 8,592,721 12,533,938 12,533,938 12,533,938 12,533,938 12,533,938 12,533,938
Direct result per share 3.64 2.94 2.81 2.93 3.05 3.15 3.26Indirect result per share (5.48) (3.69) (0.49) (0.02) 0.00 0.00 0.00Total result per share (1.84) (0.75) 2.32 2.92 3.05 3.15 3.26
IFRS NAV per share 30.4 27.5 26.9 26.8 26.7 26.7 26.6
Recurring CFPS 3.27 2.94 2.81 2.93 3.05 3.15 3.26Recurring EPS 3.64 2.94 2.81 2.93 3.05 3.15 3.26DPS 2.94 2.94 3.03 3.12 3.21 3.31 3.41
Source: Company data, ING estimates
_

227
Benelux Real Estate February 2010
Fig 15 Quarterly profit and loss (€m)
2Q09 3Q09 4Q09F 1Q10F 2Q10F 3Q10F 4Q10F
Gross rents 0.0 13.9 14.7 14.7 14.6 14.8 14.9Net rents 13.1 13.9 14.6 14.6 14.6 14.7 14.9Other rental charges 1.5 1.5 0.8 0.8 0.8 0.8 0.8Property result 14.6 15.5 15.4 15.4 15.4 15.5 15.7Property charges (technical, commercial, mgnt) (0.5) (0.3) (0.4) (0.4) (0.4) (0.4) (0.4)Property operating result 14.1 15.2 15.0 15.0 15.0 15.1 15.3General expenses (0.9) (0.8) (0.8) (0.8) (0.8) (0.9) (0.9)Other results 0.0 0.0 0.0 0.0 0.0 0.0 0.0Operating result before result on portfolio 13.2 14.4 14.2 14.2 14.1 14.3 14.4FV variation of investment property (7.5) (5.5) (10.0) (3.4) (2.1) (0.4) (0.2)Total operating result 5.7 8.9 4.1 10.8 12.0 13.8 14.2Financial income 0.0 0.0 0.2 0.2 0.1 0.0 0.1Interest charges 0.0 0.0 (5.4) (5.4) (5.4) (5.4) (5.4)Total interest (4.6) (4.5) (5.2) (5.2) (5.3) (5.4) (5.3)Revaluation on financial instruments 6.4 (4.8) 0.0 0.0 0.0 0.0 0.0Net financing expenses 1.8 (9.3) (5.2) (5.2) (5.3) (5.4) (5.3)Result before tax 7.5 (0.4) (1.0) 5.6 6.7 8.5 8.9Corporate tax expense 2.4 (0.4) (0.2) (0.2) (0.2) (0.2) (0.2)Deferred tax movements 0.0 1.8 0.0 0.0 0.0 0.0 0.0Net result 9.9 1.0 (1.2) 5.4 6.6 8.3 8.7
Source: Company data, ING estimates _
Fig 16 Quarterly cash flow statement (€m)
2Q09 3Q09 4Q09F 1Q10F 2Q10F 3Q10F 4Q10F
Profit for the year 9.9 0.0 (1.2) 5.4 6.6 8.3 8.7Total P/L from company activities 9.9 0.0 (1.2) 5.4 6.6 8.3 8.7FV variations in property 0.0 0.0 10.0 3.4 2.1 0.4 0.2Total adjustment for non-monetary items 0.0 0.0 10.0 3.4 2.1 0.4 0.2Change in working capital assets 0.0 0.0 (1.7) 0.0 0.1 (0.4) (0.4)Change in working capital liabilities 0.0 0.0 (5.0) (0.1) (0.1) 0.5 0.5Total operating capital movements 0.0 0.0 (6.7) 0.0 0.0 0.1 0.1CF from other operating activities 0.0 0.0 0.0 0.0 0.0 0.0 0.0Total cash from operations 9.9 0.0 2.1 8.8 8.7 8.9 9.1
Loan acquisition 0.0 0.0 2.1 (0.1) (0.3) 1.0 1.0Loan repayment 0.0 0.0 0.0 0.0 0.0 0.0 0.0Financing granted to WDP development RO joint venture 0.0 0.0 0.0 0.0 0.0 0.0 0.0Dividends paid 0.0 0.0 0.0 0.0 (36.8) 0.0 0.0Total cash from financing 93.0 0.0 2.1 (0.1) (37.1) 1.0 1.0
Total cash from investing* 0.0 0.0 0.0 0.0 0.0 0.0 0.0
Net cash movement 9.9 0.0 4.3 8.7 (28.5) 9.8 10.1Cash balance BOP 0.0 0.0 21.6 18.0 26.8 (1.7) 8.1Cash balance EOP 9.9 0.0 25.9 26.8 (1.7) 8.1 18.2
*Unavailable on a quarterly basis Source: Company data, ING estimates
_

228
Benelux Real Estate February 2010
Fig 17 Quarterly per share data (€)
2Q09 3Q09 4Q09F 1Q10F 2Q10F 3Q10F 4Q10F
No. of shares 9,400,454 12,533,938 12,533,938 12,533,938 12,533,938 12,533,938 12,533,938
Direct result per share 1.16 0.76 0.71 0.70 0.69 0.70 0.71Indirect result per share (0.11) (0.68) (0.80) (0.27) (0.17) (0.04) (0.02)Total result per share 1.05 0.08 (0.10) 0.43 0.52 0.66 0.70
IFRS NAV per share 37.6 28.2 28.1 28.0 25.5 26.2 26.9
Recurring CFPS 1.16 0.76 0.71 0.70 0.69 0.70 0.71Recurring EPS 1.16 0.76 0.71 0.70 0.69 0.70 0.71
DPS 2.94 0 0 0 2.94 0 0
Source: Company data, ING estimates _

229
Benelux Real Estate February 2010
Netherlands
Wereldhave A €2.5bn ‘global player’
Key ratios (%)
2009 2010F
Rental growth -2.1 5.4Operating margin 66.8 66.5Occupancy rate 94.6 93.4
Share data No. of shares (m) 21.28Daily turnover (€m) 8.1Free float (%) 100Enterprise value (€m) 2,198 Market cap (€m) 1,382
12-month forecast returns (%) Share price 10.8Dividend 7.212m f'cst total return 18.0
Share price performance
20
30
40
50
60
70
1/08 7/08 1/09 7/09 1/10Price
AEX All Share (rebased)
Source: ING
We initiate with a BUY and a €72.7 TP, based on a target premium of 0% to 2010F IFRS NAV of €72.7. It reflects the uncommitted development pipeline, strong balance sheet, execution risk of the strategy change and currency risks.
Initiating coverage
€65.05 February 2010
Buy
Real estate
€72.7 Target price
WEHA.AS Reuters
Arjan Knibbe Amsterdam (31) 20 563 8780 [email protected]
Jean-Yves Devloo Amsterdam (31) 20 563 8745 [email protected]
Wereldhave has set itself a very ambitious programme to restructure its portfolio. This process will take years and is likely to be the key driver of earnings growth.
In the current phase, Wereldhave is well positioned to outperform in either U-, V- or W-shaped recoveries as it can accelerate or slow down its very substantial acquisition and disposal programme that lies ahead.
We appreciate the fact that Wereldhave responded to the crisis very early, some say too early, and did not have to raise equity. The new management earns respect for its clearer strategy, which is ambitious but lacks geographic focus.
Key ratios and forecasts
2008 2009F 2010F 2011F 2012F
EPS adj (€) 4.92 4.91 4.83 4.97 5.32PER (x) 13.3 13.4 13.6 13.2 12.3EPRA NNNAV per share (€)* N/A N/A N/A N/A N/AIFRS NAV per share (€)** 83.74 73.28 72.72 78.25 82.00P/IFRS NAV (%) 78 0 0 0 0DPS (€) 4.66 4.59 4.72 5.05 5.17Dividend yield (%) 7.1 7.0 7.2 7.7 7.9CFPS (€) 4.71 5.84 4.44 3.75 4.34LTV (%) 26 28 31 31 30
* Wereldhave only reports an EPRA NAV, and this is on an annual basis. EPRA NAV end-2008 was €86.31 (fully diluted) ** IFRS NAV per share before distribution of the dividend Source: Company data, ING estimates _

230
Benelux Real Estate February 2010
Investment case
Wereldhave is the oldest quoted property company in the Benelux, having been established in 1930. The company has a €2.4bn investment portfolio and a development pipeline of c.€465m, of which €72m is spent. The pipeline is uncommitted. With the arrival of the new CEO, Hans Pars, in 2009, the company’s strategy has been adjusted. Wereldhave has stated that it will concentrate on nine regions, in each of which it aims to have an office, retail or residential portfolio of c.€400m. Belgium will remain the only multi-sector country. Management aims to increase the retail weighting from 45% to 50-60% and dispose of its industrial portfolio and smaller assets with a value below €20m.
Valuation We value Wereldhave at premium of 0% to 2010F IFRS NAV, which leads to our target price of €72.7. The 0% premium reflects the uncommitted development pipeline, strong balance sheet, execution risk of the strategy change and currency risks.
Highlights Over the past seven years Wereldhave has slightly neglected EPS, in our view, as it fell from €5.90 to €4.90 in the period 2002-08, which was a very strong period in direct property markets. On the other hand, we must compliment Wereldhave for having not needed to raise equity in the past crisis, because of its strong balance sheet. Wereldhave did issue a five year €230m 4.375% convertible bond (exercise price of €72.184) in August.
Timing of the execution of the new strategic plan will be the key determinant of EPS growth, not the real estate markets. In Figure 1 we illustrate the acquisition and disposal work that lies ahead of Wereldhave as it executes its adjusted strategic plan. As a rule, we do not pencil in planned acquisitions or disposals in our estimates.
Fig 1 Portfolio restructuring by country and sector
-17
-167
318
316
-9
-126
326
195
181
-41
-37
-113
341
-28
-153
-37
-33
0
-11
0
0
212
-300 -200 -100 0 100 200 300 400 500 600
Nethlnds
Belgium
France
Spain
Finland
UK
USA
Offices Retail Industrial Residential
Source: ING estimates
_
Execution more important than markets
for Wereldhave
Seven meagre years could be over

231
Benelux Real Estate February 2010
We comment extensively on the various elements of the company’s plan later in this note. In addition to these transactions, we feel that the internal organisation will need to be adjusted to become more retail-focused.
SWOT Fig 2 SWOT analysis
Strengths Weaknesses
Strong balance sheet with 30% LTV at 30 Sept 2009 Bi-continental model lacks focus
Long track record in a large number of markets Small country portfolios; c.€400m
Strong local management teams Late with retail overweight
Clear strategy EPS track record
Average asset size increasing Pipeline disclosure unstructured
Development and entrepreneurial track record
No growth for growth’s sake
Tradition of internal management
Opportunities Threats/Risks
Enter new markets Self-imposed turmoil in portfolio may cause bumpy ride
Export European or US best practice between continents US dollar and UK Sterling (hedged 64% and 65%, respectively)
New management could make Wereldhave a more outward looking organisation
Internal organisation is not (yet) the retail management and office timing “machine” it should be
Source: ING _
Risks Because of the contractual nature of a large part of the recurring cash flows, property companies are usually considered to have less risk than most other equity sectors. The risks for property companies bear a strong relation to the amount of development exposure, the geographical and sectoral breakdown, corporate governance and alignment of interests between management and shareholders.
Development
Wereldhave is not afraid to take on greenfield developments, such as the one in San Antonio, Texas. As a result, we believe the potential development exposure could bear more risk than that of its Dutch peers. We have included a sensitivity table of NAV to the development pipeline later in the note (see Figure 15).
Retail switch
Wereldhave has announced it wants to make retail its core sector as it is possible to add value in that sector. We believe that the retail markets have become very professional and complex and that Wereldhave needs to beef up its retail expertise further. There is a risk that retail will not outperform offices to the same extent as in the past decade, because there was a structural catch-up yield shift that put retail yields in line with prime office yields.
New management
Wereldhave installed a completely new management board in 2009. Notwithstanding the relevant experience of Hans Pars, we believe this does bear a risk. In particular, because a change of strategic direction has been taken.
Property companies are low risk, on average

232
Benelux Real Estate February 2010
Execution of plan
Execution of the strategic plan, which we find attractive on a number of points, could be challenging. If management is unable to keep to promises on timing, its reputation will be dented before it has really begun.
Currencies
Wereldhave operates in the United Kingdom and in the United States. This brings substantial currency risks. Wereldhave aims to hedge between 30% and 70% of its non-euro exposure. In November 2009 Wereldhave reported that a 10% change in currencies led to a €1.57 (or 2%) change in NAV per share. Cash flows are not hedged and a 10% change in average currency rates would have led to a €0.17 (or 3.5%) change in recurring EPS.
Fig 3 Current portfolio (30 Sept 2009)
Fig 4 Target portfolio
0
200
400
600
800
Nethlnds Belgium France Spain Finland UK USA
Offices Retail Industrial Residential
0200400600800
10001200
Nethlnds
Belgium
FranceSpain
Finland UKUSA
Offices Retail Industrial Residential
Source: Company data Note: Belgium is a mixed portfolio Source: Company data, ING estimates
_
Catalysts • Execution of the new strategy will cause very significant deal flow
• A pick up of US or European property markets
• Currency swings
• Results are due out on 3 March
• Newsflow about the financing of the growth from c.€2.5bn to €3.6-3.8bn
• A potential second step in the strategy
The new strategic plan The new strategic plan has a number of elements that we will discuss. We believe the plan is well thought through and leaves ample flexibility for later adjustments. In Figure 5 we comment on the main points. This is a fairly brave strategy, as it aims to change the company. On the other hand, we believe that new management is pulling its punches somewhat, maybe to make sure the organisation is not shaken too much.
The presented plan may well be the first of a number of steps to create an ultra flexible (sectoral and geographical) property company. Some would say it lacks focus, our views are below.
Fairly brave but still pulling punches
Our view on the strategy is mixed

233
Benelux Real Estate February 2010
Fig 5 Our verdict on the main points of Wereldhaves’ new strategy
Verdict Comment
Increase retail to 50-60% +/- Too late and potentially too little Nine submarkets +/- Conveniently close to heritage Two continents - - Lacks credible pan-US scale Minimum presence of €400m - Seems low, especially for retail One sector per submarket +/- Inflexible but good focus Disposal of sub-€20m assets and industrial property ++ Cost and management time efficient Retail focus on value-add through management + Is there another way? New for Wereldhave Office and apartment value add by timing ++ Timing is more than half the return Developments adds 5-10% (€180-360m) per annum ++ Cost conscious, new and SRI- and timing-grip
Source: ING
_
Increase retail to 50-60%
Retail was the flavour of the previous decade and many property companies in and outside the Benelux increased their retail weighting. Retail has made a structural relative (to office space) yield shift that will not be repeated. This structural yield shift explains part of the outperformance in the past. There is little doubt that retail outperforms in difficult markets. Lastly, the supply constraints are much stronger for retail than for office or apartment space.
We agree with Wereldhave and many others that good management can add much more value to retail than to office space. Nevertheless, we believe that Wereldhave could be beefing up its retail exposure near its relative peak. We are not sure retail will outperform office space over the next three years. Prime retail may see significantly more changes in consumer habits – greater use of the internet, less use of retailing as a leisure activity etc – than prime office space will see from office workers.
One of the elements of a retail property strategy is that the investor has a certain clout because the retailer has several outlets with the investor. With a €2bn retail portfolio scattered across Europe, (the US portfolios will have office and residential) that is not a credible case.
Nine submarkets
The choice of nine submarkets seems to be the easiest way, as no one gets hurt. Wereldhave does not exit any of its markets, which in itself a good thing as it is currently not a sellers market, but we would expect the company to differentiate more between its current markets in the future.
Two continents
We do not believe there is a strong rational argument for Wereldhave to operate in the US. It has no superior asset or market picking skills that we are aware of (and we asked), its track record is not such that it warrants a presence, and the presence bears currency risk. We have not seen any best US practice being imported (certainly not in offices), or the other way around. Management believes it has good region-picking skills.
The US is a legacy portfolio and should be liquidated when the markets are ripe for it. The diversification effect only makes sense for small investors that are unaware of, or have no access to, US REITs, and that do not want to or cannot buy a US REIT umbrella fund. These investors are dying out and we believe Wereldhave should not weaken its strategy to service them.
The US portfolio should be liquidated
A friendly start
Prime retail may see significantly more
change in consumer habits than prime office
space will see from office workers
Retail was the flavour of the previous decade
Wereldhave should not adjust its strategy to
serve a shrinking group of small investors

234
Benelux Real Estate February 2010
Minimum presence of €400m
We believe that €400m is sensible number for an office portfolio in smaller markets, but too small for a retail portfolio. As market dominance is more beneficial in retail than in office space we are unconvinced that ‘one size fits all’ is the right choice here. Its beauty is its simplicity. The €400m is a minimum number. Wereldhave could decide to put more capital into a market so it is not limiting itself to assets below €400m. A large La Défense tower or a UK shopping centre are still possible, but would be stretching the balance.
One sector per submarket
We believe that focus and discipline are good things. With this restriction Wereldhave repairs part of the damage of the US distractions. The resulting lower flexibility is an acceptable price to pay.
Disposal of sub-€20m assets and industrial property
Good idea. This should have been done before, unless there is a marriage value.
Retail focus on value add through management
This is an open door but a useful one. For Wereldhave, the new plan requires the on boarding of a large number of people with retail skills. Managing Director and member of the Board Dirk Anbeek brings 13 years of Ahold experience. In addition, Wereldhave recently hired a senior retail expert from WPM, a specialised retail property management company that managed Corio’s Hoog Catharijne shopping centre among others. The company also hired a senior retail specialist from Delancey to lead the UK retail drive.
Wereldhave does not have the same deep retail culture as some of its peers, and it will take years to create it. We were slightly surprised to hear about Wereldhave’s UK focus on retail. We think that UK retail is extremely competitive and Wereldhave lacks experience and size. UK shopping centres often have high occupancy cost ratios, putting a question mark on the longer term sustainability of some of the rental levels.
Office and apartment value add by timing
We have not often seen such a stress on the importance of timing in the office and residential markets. We also like the inclusion of development in the timing picture. We look forward to more guidance about this timing process. We believe that Wereldhave may be better positioned to read the gap between building cost and investment value than many others.
Developments should add 5-10% (€130-260m) per annum to the portfolio
This is a good idea, but why so restrictive and why not set a wider range of 0-20%? Clearly, if timing is a core competence development, completions should become zero at some stage in the cycle.
We are unconvinced that ‘one size fits all’ is
the right choice
Focus and discipline are good
No deep-rooted retail culture, yet
Why 5-10%?
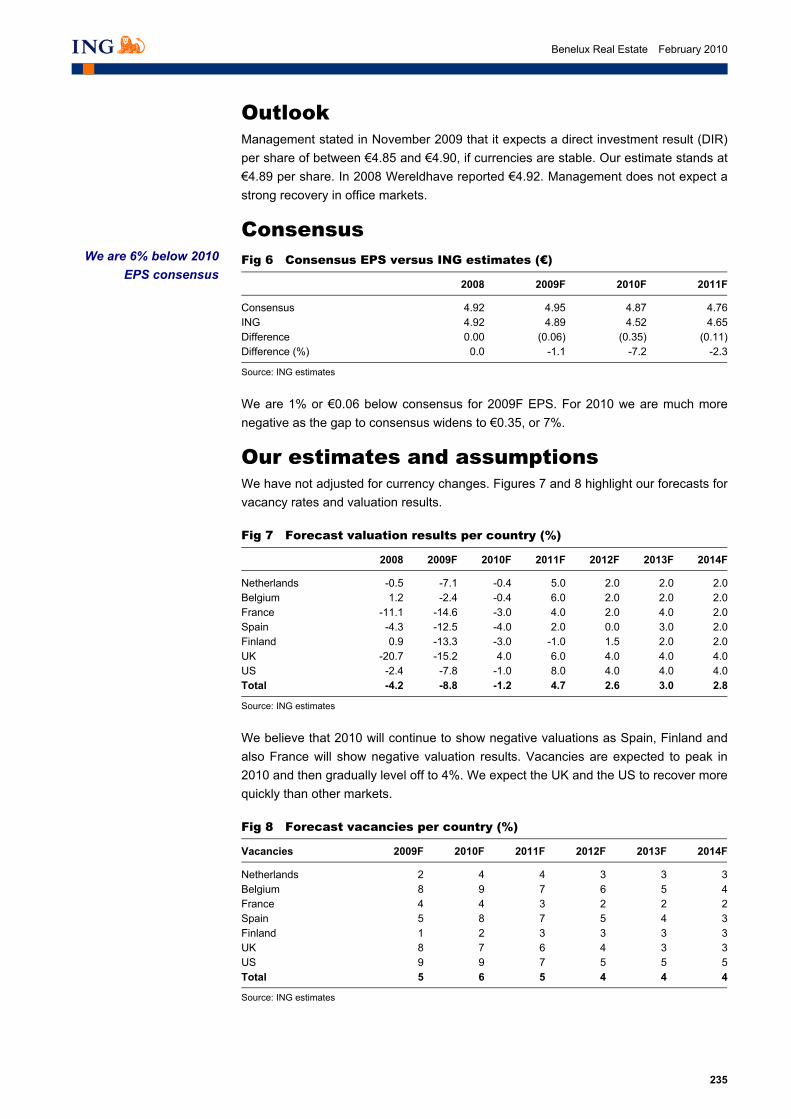
235
Benelux Real Estate February 2010
Outlook Management stated in November 2009 that it expects a direct investment result (DIR) per share of between €4.85 and €4.90, if currencies are stable. Our estimate stands at €4.89 per share. In 2008 Wereldhave reported €4.92. Management does not expect a strong recovery in office markets.
Consensus Fig 6 Consensus EPS versus ING estimates (€)
2008 2009F 2010F 2011F
Consensus 4.92 4.95 4.87 4.76ING 4.92 4.89 4.52 4.65Difference 0.00 (0.06) (0.35) (0.11)Difference (%) 0.0 -1.1 -7.2 -2.3
Source: ING estimates
_
We are 1% or €0.06 below consensus for 2009F EPS. For 2010 we are much more negative as the gap to consensus widens to €0.35, or 7%.
Our estimates and assumptions We have not adjusted for currency changes. Figures 7 and 8 highlight our forecasts for vacancy rates and valuation results.
Fig 7 Forecast valuation results per country (%)
2008 2009F 2010F 2011F 2012F 2013F 2014F
Netherlands -0.5 -7.1 -0.4 5.0 2.0 2.0 2.0Belgium 1.2 -2.4 -0.4 6.0 2.0 2.0 2.0France -11.1 -14.6 -3.0 4.0 2.0 4.0 2.0Spain -4.3 -12.5 -4.0 2.0 0.0 3.0 2.0Finland 0.9 -13.3 -3.0 -1.0 1.5 2.0 2.0UK -20.7 -15.2 4.0 6.0 4.0 4.0 4.0US -2.4 -7.8 -1.0 8.0 4.0 4.0 4.0Total -4.2 -8.8 -1.2 4.7 2.6 3.0 2.8
Source: ING estimates
_
We believe that 2010 will continue to show negative valuations as Spain, Finland and also France will show negative valuation results. Vacancies are expected to peak in 2010 and then gradually level off to 4%. We expect the UK and the US to recover more quickly than other markets.
Fig 8 Forecast vacancies per country (%)
Vacancies 2009F 2010F 2011F 2012F 2013F 2014F
Netherlands 2 4 4 3 3 3Belgium 8 9 7 6 5 4France 4 4 3 2 2 2Spain 5 8 7 5 4 3Finland 1 2 3 3 3 3UK 8 7 6 4 3 3US 9 9 7 5 5 5Total 5 6 5 4 4 4
Source: ING estimates
_
We are 6% below 2010 EPS consensus

236
Benelux Real Estate February 2010
Company profile
Investment portfolio The investment portfolio of Wereldhave is special because a large part has been developed by the company. Previous management had a strategy that building was cheaper than buying. This has also resulted in a fairly high number of non-prime offices.
A large part of the UK portfolio dates back to the Peachy takeover in 1988. Capital recycling has not been on the agenda in the UK. The individual office assets in London are below 4,000m², which we think is small, and we are unaware of a UK retail track record that justifies the new focus on this sector in the UK. In our view, in the UK in particular it may be a good strategy to build rather than to buy.
The Belgian portfolio seems attractive to us, with good recent progress on retail developments. Offices should not be too hard to dispose of. The Finnish economy is in a deeper recession than much of the rest of Europe, and Wereldhave’s Itakeskus centre – which forms c.90% of the €522m (21%) Finnish presence – is likely to be suffering.
Fig 9 Wereldhave portfolio as at 30 September 2009 (€m)
Netherlands Belgium France Spain Finland UK US Total
Offices 17 167 82 84 9 126 574 1061Retail 205 219 41 37 513 59 28 1101Industrial 153 0 37 33 0 11 0 235Residential 0 0 0 0 0 0 88 88Total 375.0 386.0 160.0 155.0 522.0 196.3 690.0 2,484
Source: Company data
_
The US portfolio is divided into three regions: Texas, San Diego and Washington. Wereldhave has a local presence in these markets. It remains unclear to us whether the company aims to outperform the local markets or believes these markets will outperform the US as a whole, or both. Because it lacks size, scale or other competitive advantages such as superior national market intelligence, we believe Wereldhave should exit the US and focus on the task ahead in Europe.
Wereldhave’s Dutch portfolio has a striking near-absence of office space (5% of Dutch portfolio) and a 40% distribution space weighting. The shopping centres in Arnhem, Leiderdorp and Etten Leur bring in half of the total Dutch rents, but are still fairly small centres.
We believe Wereldhave should exit the US
Building cheaper than buying, UK seems out
of place

237
Benelux Real Estate February 2010
Fig 10 Portfolio breakdown by region as at 30 September 2009
Fig 11 Portfolio breakdown by sector as at 30 September 2009
Netherlands15%
Belgium16%
France6%
Spain6%Finland
21%
UK8%
USA28%
Off ices43%
Retail44%
Indus trial9%
Residential4%
Source: Company data Source: Company data
Figure 12 gives a picture of the recent valuation changes as a result of yield increases. Finland was hit particularly hard in 2009, with a 60bp yield increase in only nine months. Belgium was remarkably strong, in line with other Belgian operators. The biggest yield increase in the period from 2007 to 3Q09 took place in the UK, where yields rose from 6.6% to 8.5%. _
Fig 12 Net property yields Wereldhave 2007-3Q09 (%)
3Q09 change (ppt) 2008 change (ppt) 2007
Belgium 6.2 0.1 6.1 0.3 5.8Finland 5.9 0.6 5.3 0.2 5.1France 6.5 0.5 6.0 0.4 5.6Netherlands 6.5 0.5 6.0 0.1 5.9Spain 7.1 0.5 6.6 0.5 6.1UK 8.5 0.6 7.9 1.3 6.6US 6.8 0.5 6.3 0.1 6.2Total 6.6 0.4 6.2 0.3 5.9
Source: Company data
_
Vacancies Figure 13 illustrates the vacancy rates at Wereldhave over the years. The occupancy level has dropped substantially in many markets, notably Finland, Paris and the US. At 99%, the Spanish occupancy rate is not yet impacted by the crisis.
Fig 13 Occupancy (%)
2005 2006 2007 2008 30-Jun-09
Netherlands 83 84 87 92 93Belgium 99 99 99 99 99Paris 97 98 96 96 37Spain 89 94 97 98 99Finland 93 99 99 99 99UK 97 98 92 91 91US 90 89 92 93 90Total 92 94 94 95 90
Note: Average over the past period Source: Company data
_

238
Benelux Real Estate February 2010
Developments Wereldhave has a €476m uncommitted development pipeline. We have modelled Phase 1 of San Antonio and Nivelles in our estimates.
Fig 14 Wereldhave’s uncommitted development pipeline
Developments Capex (€m) Phase 1 Phase 2
San Antonio (mixed) 262 €131m delivery 2010 and 2011 €131m, delivery undecidedNivelles (retail) 145 2011: €62m 2011-15: €83 m Tournai Retail) 34 2011-12: €20m 2011-12: €14m Leiderdorp (Retail) 35 2012-14: €35m Total 476
Source: Company data
_
Wereldhave’s largest development is San Antonio, where it will complete two office towers at the end of 1Q10 as the start of a large mixed development. Management has postponed the next completions until 2011. In Belgium, Wereldhave is working on two extensions of shopping centres: Nivelles, where construction will start shortly, and Tournai, where management expects to be able to apply for a building permit soon, now that the urban zoning plan has been approved.
Sensitivity analysis of our target price
Figure 15 illustrates what the developments could add to NAV per share, and hence our target price. On the horizontal axis we have the yield on cost and on the vertical axis is the yield on completion. Management has stated that the yields on cost of San Antonio and Nivelles are c.7.5%, with the cost of construction falling. We believe this pipeline could add c.€5-7 per share over the next few years. As stated above, this not fully incorporated in our estimates.
Fig 15 Sensitivity of NAV per share to the €476m pipeline (€)
Yield on cost (%)
7.0 7.5 8.0 8.5 9.0 9.5 10.0 5.5 6.09 8.13 10.16 12.19 14.22 16.25 18.28 6.0 3.72 5.59 7.45 9.31 11.17 13.04 14.90Yield on 6.5 1.72 3.44 5.16 6.88 8.60 10.31 12.03Completion (%) 7.0 0.00 1.60 3.19 4.79 6.38 7.98 9.58 7.5 (1.49) 0.00 1.49 2.98 4.47 5.96 7.45 8.0 (2.79) (1.40) 0.00 1.40 2.79 4.19 5.59
Source: ING estimates
_
Corporate governance Management board J. Pars (male, aged 47) • Zadelvast Beheer, Commercial Manager 1987-89
• Stichting Pensioenfonds Hoogovens, Portfolio Manager 1989-93
• Rodamco Europe, several management positions 1993-2003
• VastNed Groep, Director and CIO 2003-08
• Wereldhave, appointed to Director from 1 January 2009
• Managing Director as of 2 April 2009, CEO as of 1 July 2009
Pipeline could add €5-7 to NAV per share

239
Benelux Real Estate February 2010
D.J. Anbeek (male, aged 46) • DSM, several financial positions 1988-94
• Pricewaterhouse, Senior Consultant 1994-95
• Ahold, several international management positions 1996-2005
• Albert Heijn, Director Franchise & Real Estate 2006-09
• Wereldhave, Managing Director as of 1 June 2009
Hans Pars looks after Belgium, the US and the UK. Dirk Anbeek looks after the Netherlands, France, Finland and Spain.

240
Benelux Real Estate February 2010
Financials
Fig 16 Balance sheet (€m)
2008 2009F 2010F 2011F 2012F 2013F 2014F
Investment properties 2,646.0 2,386.2 2,477.0 2,670.4 2,739.4 2,821.2 2,900.8Total fixed assets 2,781.7 2,520.4 2,611.2 2,804.6 2,873.6 2,955.4 3,035.0Trade and other receivables 12.4 16.1 17.7 19.1 19.6 20.0 20.3Tax receivables 4.4 1.4 1.5 1.7 1.7 1.7 1.8Cash and cash equivalents 24.7 12.8 28.4 30.3 48.5 28.6 79.0Total current assets 41.5 30.3 47.7 51.1 69.8 50.3 101.1Total assets 2,823.2 2,550.7 2,658.9 2,855.7 2,943.3 3,005.7 3,136.1
Equity - group share 1,740.3 1,559.2 1,547.2 1,664.9 1,744.7 1,831.8 2,018.4Minority interest 119.9 115.8 114.7 115.7 116.5 117.0 117.5Total equity 1,860.2 1,674.9 1,661.8 1,780.6 1,861.1 1,948.8 2,135.8Interest bearing liabilities 715.6 518.2 618.2 678.2 678.2 648.2 688.2Deferred tax liabilities 151.8 124.7 124.7 124.7 124.7 124.7 124.7Other long term liabilities 21.3 21.4 21.4 21.4 21.4 21.4 21.4Long term liabilities 888.7 664.2 764.2 824.2 824.2 794.2 834.2Trade payables 3.5 3.6 4.0 4.3 4.4 4.5 4.6Taxes 3.3 4.9 5.4 5.8 6.0 6.1 6.2Interest bearing liabilities 24.0 170.8 188.1 202.6 208.4 212.2 215.9Other short term liabilities 43.5 32.1 35.4 38.1 39.2 39.9 40.6Short term liabilities 74.3 211.5 232.8 250.8 258.0 262.7 267.2Total equity and liabilities 2,823.2 2,550.7 2,658.9 2,855.7 2,943.3 3,005.7 3,237.3
Source: Company data, ING estimates _
Fig 17 Profit and loss (€m)
2008 2009F 2010F 2011F 2012F 2013F 2014F
Gross rents 168.3 164.8 173.6 182.3 195.0 198.6 202.0Service costs charged 42.6 44.2 47.0 50.0 53.9 54.8 55.7Total revenues 210.9 209.0 220.6 232.4 248.8 253.4 257.7Service costs paid (48.2) (51.8) (55.9) (59.5) (64.0) (65.1) (66.2)Property expenses (14.1) (14.4) (17.3) (18.4) (20.0) (20.4) (20.7)Net rental income 148.6 142.8 147.4 154.4 164.8 167.9 170.8Valuation results (108.0) (249.0) (27.5) 118.7 69.0 81.8 79.6Results on disposals 4.3 0.8 0.0 0.0 0.0 0.0 0.0General costs (14.5) (15.1) (15.9) (16.8) (18.3) (18.6) (19.0)Other income and expenses 4.0 3.6 4.0 4.2 4.5 4.6 4.6Operational result 34.4 (116.9) 107.9 260.5 220.0 235.7 236.1Interest charges (31.7) (20.0) (27.0) (30.2) (32.0) (32.1) (32.2)Interest income 8.5 1.7 0.7 0.6 1.1 1.3 1.4Interest capitalised (2.1) 0.7 2.9 2.9 2.9 2.9 2.9Net interest (25.2) (17.5) (23.4) (26.7) (28.0) (27.9) (27.9)Other financial income and expenses (7.6) 0.4 0.0 0.0 0.0 0.0 0.0Total finance expenses (32.9) (17.1) (23.4) (26.7) (28.0) (27.9) (27.9)Result before tax 1.5 (134.0) 84.5 233.9 192.0 207.7 208.2Taxes on result 7.3 30.1 1.6 (17.4) (10.9) (12.6) (12.3)Direct 0.0 (2.2) (2.0) (2.0) (2.0) (2.0) (2.0)Indirect 0.0 32.3 3.6 (15.4) (8.9) (10.6) (10.3)Profit 8.8 (103.9) 86.0 216.5 181.0 195.1 195.9Shareholders share 0.5 (107.9) 79.3 207.6 172.3 186.0 186.6Minority interest share 8.3 4.0 6.8 8.9 8.8 9.1 9.3
Direct result 109.4 111.6 110.0 113.2 121.0 123.9 126.6Wereldhave SH share 102.3 104.4 102.8 105.8 113.1 115.8 118.4Minority interest share 7.1 7.3 7.1 7.4 7.9 8.1 8.2Indirect result (111.3) (215.5) (23.9) 103.3 60.0 71.2 69.3Wereldhave SH share (101.8) (212.3) (23.6) 101.8 59.1 70.2 68.3Minority interest share (9.5) (3.2) (0.4) 1.5 0.9 1.1 1.0
Source: Company data, ING estimates _

241
Benelux Real Estate February 2010
Fig 18 Cash flow statement (€m)
2008 2009F 2010F 2011F 2012F 2013F 2014F
Profit 8.8 (103.9) 86.0 216.5 181.0 195.1 195.9Exchange rate differences 0.2 (0.5) 0.0 0.0 0.0 0.0 0.0Non cash financial income and expense 7.3 (0.1) 0.0 0.0 0.0 0.0 0.0Valuation results 108.0 249.0 27.5 (118.7) (69.0) (81.8) (79.6)Results on disposals (3.0) (0.8) 0.0 0.0 0.0 0.0 0.0Deferred taxes (10.3) (28.3) 0.0 0.0 0.0 0.0 0.0Other movement in reserves 0.6 0.6 0.0 0.0 0.0 0.0 0.0Movements in working capital 6.3 (4.7) 2.3 2.0 0.8 0.5 0.5CFO 117.8 111.3 115.9 99.8 112.8 113.8 116.8
Proceeds from disposals 2.7 2.8 0.0 0.0 0.0 0.0 0.0Investments in investment property, equipment and projects (146.3) (34.7) (118.3) (74.7) 0.0 0.0 0.0Investments in minority interests 0.0 (2.2) 0.0 0.0 0.0 0.0 0.0Investments in financial assets (2.9) 0.5 0.0 0.0 0.0 0.0 0.0Investments in other long term assets (0.8) (3.9) 0.0 0.0 0.0 0.0 0.0CFI (147.4) (37.4) (118.3) (74.7) 0.0 0.0 0.0
New loans interest bearing debts 346.6 271.5 117.3 74.5 5.8 (26.2) 43.7Repayment interest bearing debts (192.9) (303.1) 0.0 0.0 0.0 0.0 0.0Change other long term liabilities (3.4) (0.5) 0.0 0.0 0.0 0.0 0.0Cancellation of preference shares 0.0 (3.4) 0.0 0.0 0.0 0.0 0.0Dividend paid-group share (96.6) (73.8) (91.2) (89.9) (92.5) (98.9) (101.2)Dividend paid to minority interest (6.5) (6.3) (7.9) (7.8) (8.0) (8.6) (8.8)Cash part forward transactions (9.6) 29.8 0.0 0.0 0.0 0.0 0.0CFF 37.5 (85.8) 18.1 (23.2) (94.7) (133.6) (66.4)
Increase/decrease in cash 7.9 (12.0) 15.7 1.9 18.1 (19.9) 50.4Cash balance BOP 16.8 24.7 12.8 28.4 30.3 48.5 28.6Cash and bank balances EOP 24.7 12.8 28.4 30.3 48.5 28.6 79.0
Source: Company data, ING estimates _
Fig 19 Per share data (€)
2008 2009F 2010F 2011F 2012F 2013F 2014F
No. of ordinary shares EOP 20,781,735 21,276,988 21,276,988 21,276,988 21,276,988 21,276,988 21,276,988Maximum convertible shares 2,061,856 2,061,856 2,061,856 2,061,856 2,061,856 2,061,856 2,061,856Fully diluted number of shares 22,843,591 23,338,844 23,338,844 23,338,844 23,338,844 23,338,844 23,338,844Average no. of shares outstanding 20,781,735 21,276,988 21,276,988 21,276,988 21,276,988 21,276,988 21,276,988
Result per share – group share – diluted 0.02 (5.07) 3.73 9.76 8.10 8.74 8.77Direct result per share – group share 4.92 4.91 4.83 4.97 5.32 5.44 5.56Indirect result per share – group share (4.90) (9.98) (1.11) 4.78 2.78 3.30 3.21Dividend previous year 4.66 4.59 4.72 5.05 5.17 5.29
IFRS NAV per share 83.74 73.28 72.72 78.25 82.00 86.09 94.86EPRA NNNAV per share N/A N/A N/A N/A N/A N/A N/A
Recurring CFPS 4.71 5.84 4.44 3.75 4.34 4.38 4.51Recurring EPS 4.92 4.91 4.83 4.97 5.32 5.44 5.56
Source: Company data, ING estimates
_

242
Benelux Real Estate February 2010
Fig 20 Quarterly balance sheet (€m)
1Q09 2Q09 3Q09 4Q09F 1Q10F 2Q10F 3Q10F 4Q10F
Investment properties 2,657.6 2,586.8 2,412.8 2,386.2 2,400.7 2,416.6 2,443.5 2,477.0Total fixed assets 2,786.0 2,708.2 2,547.0 2,520.4 2,534.9 2,550.8 2,577.6 2,611.2Trade and other receivables 13.2 15.4 16.4 16.1 17.1 17.1 17.6 17.7Tax receivables 5.6 5.6 1.5 1.4 1.5 1.5 1.5 1.5Cash and cash equivalents 26.4 29.5 41.4 12.8 24.3 24.9 29.5 28.4Total current assets 45.1 50.5 59.3 30.3 42.9 43.4 48.7 47.7Total assets 2,831.1 2,758.7 2,606.3 2,550.7 2,577.8 2,594.3 2,626.3 2,658.9
Equity - group share 1,752.0 1,654.7 1,557.5 1,559.2 1,571.8 1,494.2 1,517.7 1,547.2Minority interest 121.9 115.9 114.8 115.8 117.4 111.0 112.8 114.7Total equity 1,873.9 1,770.6 1,672.3 1,674.9 1,689.1 1,605.2 1,630.5 1,661.8Interest bearing liabilities 721.2 587.2 568.2 518.2 518.2 618.2 618.2 618.2Deferred tax liabilities 149.7 143.7 124.7 124.7 124.7 124.7 124.7 124.7Other long term liabilities 21.9 21.5 21.4 21.4 21.4 21.4 21.4 21.4Long-term liabilities 892.8 752.4 714.2 664.2 664.2 764.2 764.2 764.2Trade payables 3.1 3.5 3.9 3.6 3.8 3.8 4.0 4.0Taxes 2.9 3.2 5.0 4.9 5.2 5.2 5.4 5.4Interest bearing liabilities 15.0 188.1 174.2 170.8 181.2 181.6 187.1 188.1Other short term liabilities 43.4 41.0 36.7 32.1 34.1 34.2 35.2 35.4Short-term liabilities 64.4 235.7 219.7 211.5 224.4 224.8 231.6 232.8Total equity and liabilities 2,831.1 2,758.7 2,606.3 2,550.7 2,577.8 2,594.3 2,626.3 2,658.9
Source: Company data, ING estimates _
Fig 21 Quarterly profit and loss account (€m)
1Q09 2Q09 3Q09 4Q09F 1Q10F 2Q10F 3Q10F 4Q10F
Gross rents 41.7 41.9 41.0 40.2 42.6 42.7 44.0 44.2Service costs charged 11.6 11.5 10.8 10.4 11.4 11.4 12.0 12.1Total revenues 53.3 53.4 51.7 50.6 54.1 54.2 56.1 56.4Service costs paid (13.8) (13.3) (12.6) (12.1) (13.6) (13.6) (14.3) (14.4)Property expenses (3.5) (3.2) (3.9) (3.8) (4.2) (4.2) (4.4) (4.4)Net rental income 36.0 36.8 35.3 34.7 36.2 36.3 37.3 37.5Valuation results (31.8) (50.8) (139.8) (26.6) (15.1) (13.7) (2.7) 4.0Results on disposals 0.0 0.0 0.8 0.0 0.0 0.0 0.0 0.0General costs (3.9) (3.6) (3.8) (3.8) (4.0) (3.9) (4.0) (4.0)Other income and expenses 1.0 0.8 0.9 0.9 1.0 1.0 1.0 1.0Operational result 1.3 (16.9) (106.6) 5.3 18.2 19.7 31.6 38.5Interest charges (6.2) (4.2) (3.1) (6.5) (6.5) (6.7) (6.9) (7.0)Interest income 1.6 0.4 (0.6) 0.3 0.3 0.2 0.1 0.1Interest capitalised 0.0 0.0 0.0 0.7 0.7 0.7 0.7 0.7Net interest (4.7) (3.7) (3.6) (5.5) (5.4) (5.8) (6.1) (6.1)Other financial income and expenses (1.1) 1.8 (0.2) 0.0 0.0 0.0 0.0 0.0Total finance expenses (5.8) (2.0) (3.8) (5.5) (5.4) (5.8) (6.1) (6.1)Result before tax (4.4) (18.8) (110.4) (0.2) 12.7 13.9 25.5 32.4Taxes on result 3.0 6.4 17.8 2.9 1.5 1.3 (0.1) (1.0)Direct 0.0 0.0 0.0 (0.5) (0.5) (0.5) (0.5) (0.5)Indirect 0.0 0.0 0.0 3.4 2.0 1.8 0.4 (0.5)Profit (1.5) (12.5) (92.6) 2.7 14.2 15.2 25.3 31.3Shareholders share (3.3) (12.9) (93.3) 1.7 12.6 13.6 23.6 29.5Minority interest share 1.9 0.4 0.7 1.0 1.6 1.6 1.8 1.9Direct result 28.1 30.4 27.3 25.8 27.3 27.1 27.7 27.9Wereldhave SH share 26.2 28.7 25.6 23.9 25.6 25.3 25.9 26.0Minority interest share 1.9 1.7 1.7 1.9 1.8 1.8 1.8 1.8Indirect result (32.9) (49.1) (139.2) (23.2) (13.2) (11.9) (2.4) 3.5Wereldhave SH share (29.5) (41.6) (118.9) (22.2) (13.0) (11.7) (2.3) 3.4Minority interest share (3.4) 2.0 (1.0) (0.9) (0.2) (0.2) 0.0 0.1
Source: ING estimates
_

243
Benelux Real Estate February 2010
Fig 22 Quarterly cash flow statements (€m)
1Q09 2Q09 3Q09 4Q09F 1Q10F 2Q10F 3Q10F 4Q10F
Profit (1.5) (12.5) (92.6) 2.7 14.2 15.2 25.3 31.3Exchange rate differences (0.1) 0.0 (0.1) 0.0 0.0 0.0 0.0 0.0Adjustments: 0.0 0.0 0.0 0.0 0.0 0.0 0.0 0.0Non cash financial income and expense 1.5 0.0 0.2 0.0 0.0 0.0 0.0 0.0Valuation results 31.8 0.0 139.8 26.6 15.1 13.7 2.7 (4.0)Results on disposals 0.0 0.0 (0.8) 0.0 0.0 0.0 0.0 0.0Deferred taxes (3.6) 0.0 (19.8) 0.0 0.0 0.0 0.0 0.0Other movement in reserves 0.2 0.0 0.3 0.0 0.0 0.0 0.0 0.0Movements in working capital (3.3) 0.0 7.0 (4.5) 1.4 0.0 0.7 0.1CFO 24.9 (12.5) 33.8 24.8 30.7 28.9 28.8 27.5
Proceeds from disposals 0.3 0.0 2.8 0.0 0.0 0.0 0.0 0.0Investments in investment property, equipment and projects (12.8) 0.0 (11.5) 0.0 (29.6) (29.6) (29.6) (29.6)Investments in minority interests 0.0 0.0 (2.2) 0.0 0.0 0.0 0.0 0.0Investments in financial assets 0.6 0.0 0.0 0.0 0.0 0.0 0.0 0.0Investments in other long term assets (0.2) 0.0 (3.5) 0.0 0.0 0.0 0.0 0.0
CFI (12.1) 0.0 (14.3) 0.0 (29.6) (29.6) (29.6) (29.6)New loans interest bearing debts 34.4 0.0 228.7 (53.3) 10.4 100.4 5.5 1.0Repayment interest bearing debts (53.4) 0.0 (240.5) 0.0 0.0 0.0 0.0 0.0Change other long term liabilities 0.1 0.0 (0.2) 0.0 0.0 0.0 0.0 0.0Cancellation of preference shares 0.0 0.0 (3.4) 0.0 0.0 0.0 0.0 0.0Dividend paid-group share 0.0 0.0 (0.1) 0.0 0.0 (91.2) 0.0 0.0Dividend paid to minority interest 0.0 0.0 0.0 0.0 0.0 (7.9) 0.0 0.0Cash part forward transactions 7.8 0.0 7.8 0.0 0.0 0.0 0.0 0.0CFF (11.2) 0.0 (7.6) (53.3) 10.4 1.2 5.5 1.0
Increase/decrease in cash 1.6 (12.5) 12.4 (28.6) 11.6 0.5 4.7 (1.1)Cash balance BOP 24.7 26.4 29.5 41.4 12.8 24.3 24.9 29.5Cash and bank balances EOP 26.4 13.9 41.8 12.8 24.3 24.9 29.5 28.4
Source: Company data, ING estimates
_

244
Benelux Real Estate February 2010
This page is left blank intentionally

245
Benelux Real Estate February 2010
Appendices

246
Benelux Real Estate February 2010
This page is left blank intentionally

247
Benelux R
eal Estate
February 2010
Appendix 1 Fig 1 Buildings occupied by the Commission in Brussels
Source: ec.europa.eu _
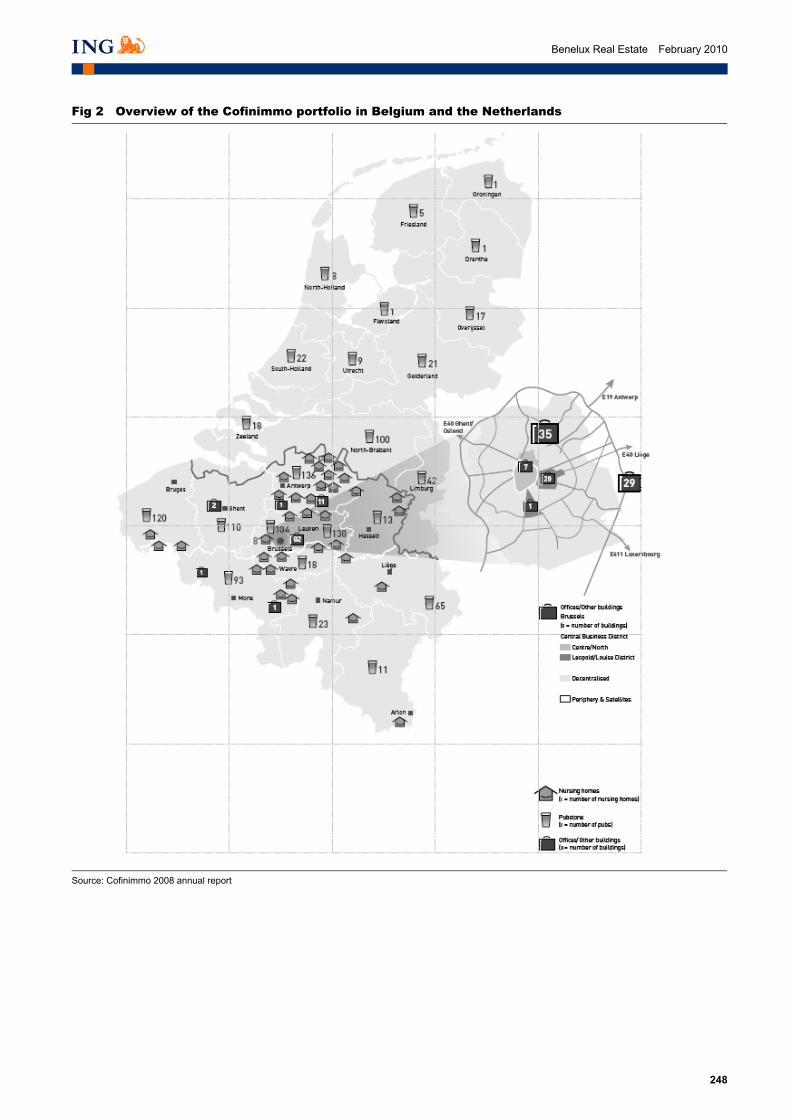
248
Benelux Real Estate February 2010
Fig 2 Overview of the Cofinimmo portfolio in Belgium and the Netherlands
Source: Cofinimmo 2008 annual report
_

249
Benelux Real Estate February 2010
Fig 3 Befimmo portfolio in Brussels
Source: Befimmo FY08/09 annual report
_

250
Benelux Real Estate February 2010
Fig 4 Leasinvest Real Estate portfolio (Brussels part)
Source: Company data
_

251
Benelux Real Estate February 2010
Appendix 2 Fig 5 GDP Forecasts (%YoY)
4Q09 1Q10 2Q10 3Q10 2009F 2010F 2011F
World (US$) -0.2 2.2 3.0 3.1 -2.5 3.3 3.4US -0.6 1.9 3.0 3.5 -2.6 3.0 2.8Japan -2.0 1.7 1.4 1.8 -5.4 1.8 2.1Germany -1.4 2.5 2.5 2.2 -4.7 2.2 1.9France -0.3 1.4 1.4 1.5 -2.2 1.5 2.0UK -2.8 0.4 1.5 1.9 -4.8 1.4 1.9Italy -2.4 0.5 1.2 1.0 -4.8 1.0 1.1Canada -1.5 1.1 3.0 4.3 -2.6 3.3 3.0
Eurozone -3.0 -1.4 0.0 0.3 -3.9 1.7 2.0Spain -3.0 -1.4 0.0 0.3 -3.6 -0.1 1.4Netherlands -2.2 0.7 2.5 1.8 -3.9 1.6 2.0Belgium -0.9 1.3 1.9 1.7 -3.1 1.6 1.8Greece -1.5 -1.3 -1.1 -0.2 -1.2 -0.5 0.8Switzerland -0.7 0.5 1.1 1.2 -1.5 1.0 1.9Sweden 0.4 2.0 2.4 2.8 -4.3 2.5 2.9Norway 0.3 2.0 3.8 3.8 3.4 3.2 2.7Iceland -7.1 -2.0 -1.2 5.3 -5.6 0.8 2.5
Bulgaria -5.7 -2.6 -1.1 1.3 -5.0 0.2 2.8Croatia -3.9 0.2 2.6 3.1 -5.6 2.3 2.9Czech Republic -2.8 2.6 2.4 1.8 -4.0 2.6 3.3Hungary -3.8 -0.5 -1.1 1.0 -6.4 0.5 3.1Kazakhstan * 2.2 3.5 3.8 - -0.4 2.6 4.7Poland 3.0 3.2 2.7 2.1 1.7 2.6 3.4Romania -4.4 -0.5 1.3 2.2 -6.5 1.6 0.9Russia * -1.1 4.1 4.7 - -8.4 3.3 4.5Slovakia -3.2 2.8 2.2 1.0 -4.8 1.8 3.5Turkey 1.7 6.8 3.7 2.9 -6.0 4.0 3.9Ukraine -4.4 4.4 2.9 1.6 -14.6 2.5 4.6
Brazil 5.8 7.6 6.9 5.9 0.2 6.0 4.3Mexico -4.4 1.1 3.8 2.6 -7.2 2.8 3.1
China 11.0 11.5 12.0 10.8 8.6 11.0 10.0Hong Kong 6.0 7.5 6.5 5.5 -2.0 6.2 5.8India 5.9 7.0 7.6 7.7 6.5 7.8 8.5Indonesia 5.8 5.8 6.2 6.0 4.7 6.1 6.3Korea 6.2 7.0 6.0 5.0 0.1 5.3 5.1Malaysia 3.2 6.0 4.5 3.5 -2.0 4.4 5.3Philippines 1.2 2.7 3.2 3.6 0.9 3.4 4.0Singapore 3.5 7.0 6.0 5.0 -1.9 5.8 6.5Taiwan 6.1 6.0 5.0 4.0 -3.5 4.8 5.5Thailand 2.2 5.0 4.5 4.0 -3.0 4.0 4.5
* Russia & Kasakstan updated as of 11 December 2009 Updated 08 January 2010 Source: ING
_
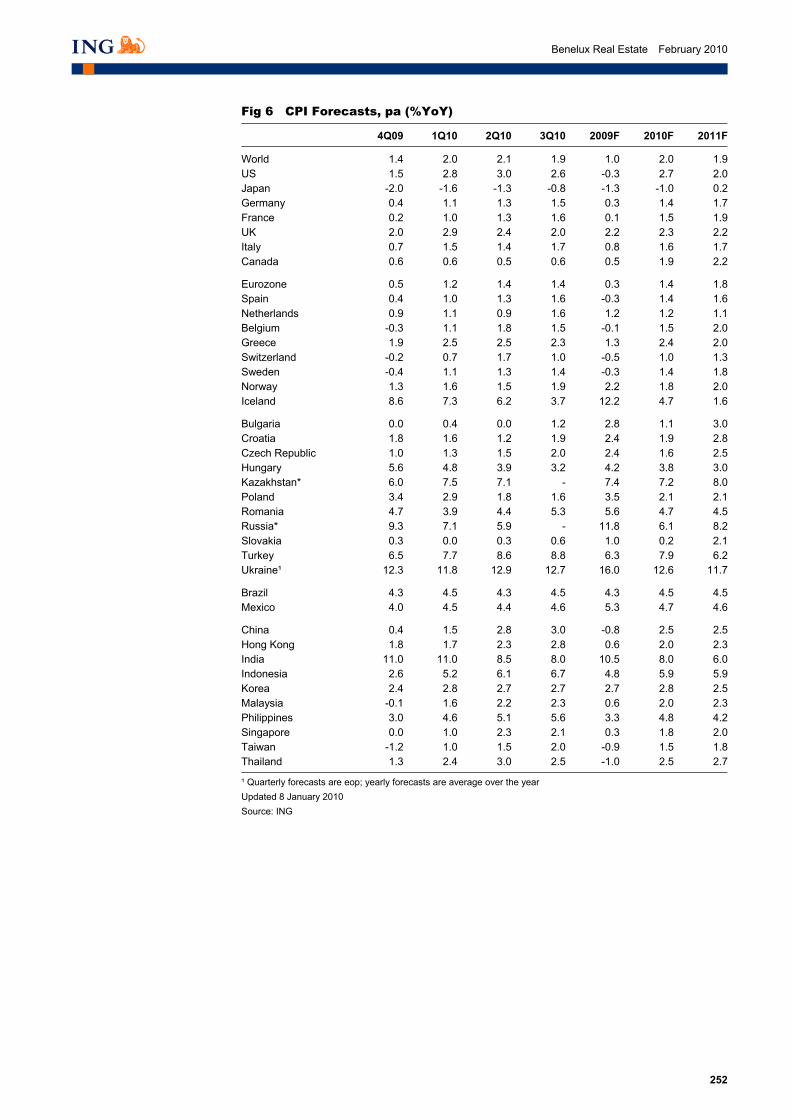
252
Benelux Real Estate February 2010
Fig 6 CPI Forecasts, pa (%YoY)
4Q09 1Q10 2Q10 3Q10 2009F 2010F 2011F
World 1.4 2.0 2.1 1.9 1.0 2.0 1.9US 1.5 2.8 3.0 2.6 -0.3 2.7 2.0Japan -2.0 -1.6 -1.3 -0.8 -1.3 -1.0 0.2Germany 0.4 1.1 1.3 1.5 0.3 1.4 1.7France 0.2 1.0 1.3 1.6 0.1 1.5 1.9UK 2.0 2.9 2.4 2.0 2.2 2.3 2.2Italy 0.7 1.5 1.4 1.7 0.8 1.6 1.7Canada 0.6 0.6 0.5 0.6 0.5 1.9 2.2
Eurozone 0.5 1.2 1.4 1.4 0.3 1.4 1.8Spain 0.4 1.0 1.3 1.6 -0.3 1.4 1.6Netherlands 0.9 1.1 0.9 1.6 1.2 1.2 1.1Belgium -0.3 1.1 1.8 1.5 -0.1 1.5 2.0Greece 1.9 2.5 2.5 2.3 1.3 2.4 2.0Switzerland -0.2 0.7 1.7 1.0 -0.5 1.0 1.3Sweden -0.4 1.1 1.3 1.4 -0.3 1.4 1.8Norway 1.3 1.6 1.5 1.9 2.2 1.8 2.0Iceland 8.6 7.3 6.2 3.7 12.2 4.7 1.6
Bulgaria 0.0 0.4 0.0 1.2 2.8 1.1 3.0Croatia 1.8 1.6 1.2 1.9 2.4 1.9 2.8Czech Republic 1.0 1.3 1.5 2.0 2.4 1.6 2.5Hungary 5.6 4.8 3.9 3.2 4.2 3.8 3.0Kazakhstan* 6.0 7.5 7.1 - 7.4 7.2 8.0Poland 3.4 2.9 1.8 1.6 3.5 2.1 2.1Romania 4.7 3.9 4.4 5.3 5.6 4.7 4.5Russia* 9.3 7.1 5.9 - 11.8 6.1 8.2Slovakia 0.3 0.0 0.3 0.6 1.0 0.2 2.1Turkey 6.5 7.7 8.6 8.8 6.3 7.9 6.2Ukraine¹ 12.3 11.8 12.9 12.7 16.0 12.6 11.7
Brazil 4.3 4.5 4.3 4.5 4.3 4.5 4.5Mexico 4.0 4.5 4.4 4.6 5.3 4.7 4.6
China 0.4 1.5 2.8 3.0 -0.8 2.5 2.5Hong Kong 1.8 1.7 2.3 2.8 0.6 2.0 2.3India 11.0 11.0 8.5 8.0 10.5 8.0 6.0Indonesia 2.6 5.2 6.1 6.7 4.8 5.9 5.9Korea 2.4 2.8 2.7 2.7 2.7 2.8 2.5Malaysia -0.1 1.6 2.2 2.3 0.6 2.0 2.3Philippines 3.0 4.6 5.1 5.6 3.3 4.8 4.2Singapore 0.0 1.0 2.3 2.1 0.3 1.8 2.0Taiwan -1.2 1.0 1.5 2.0 -0.9 1.5 1.8Thailand 1.3 2.4 3.0 2.5 -1.0 2.5 2.7
¹ Quarterly forecasts are eop; yearly forecasts are average over the year Updated 8 January 2010 Source: ING _
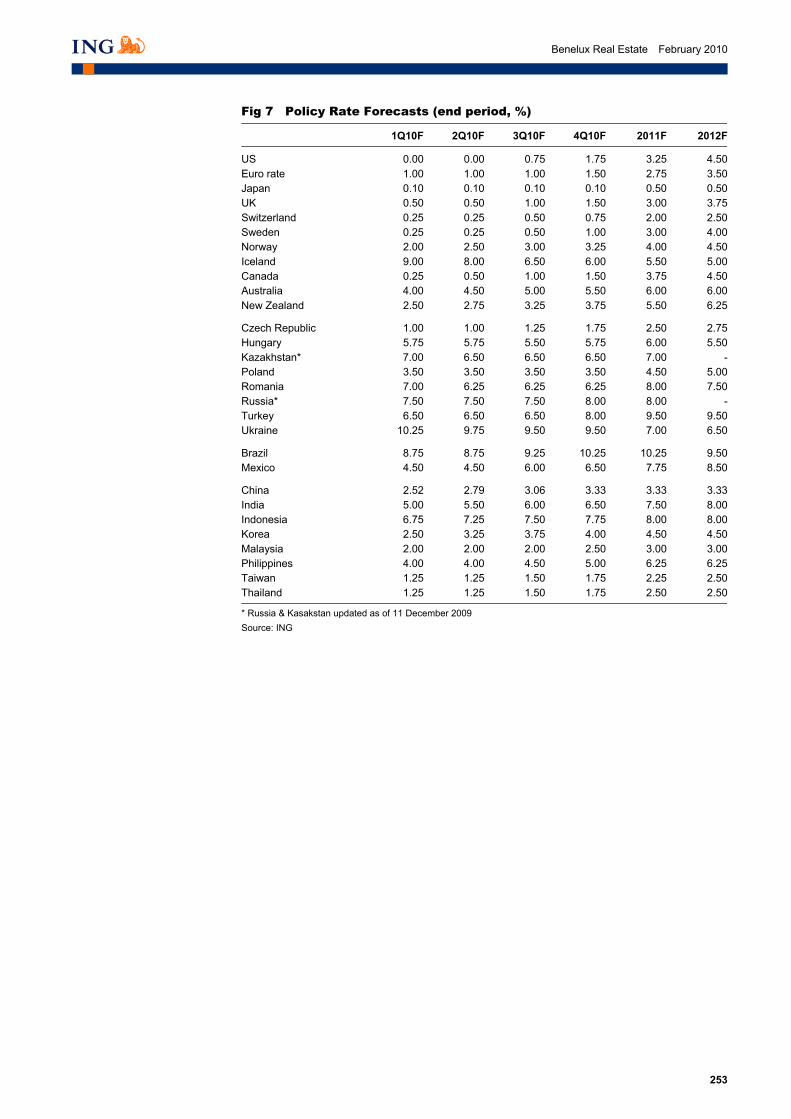
253
Benelux Real Estate February 2010
Fig 7 Policy Rate Forecasts (end period, %)
1Q10F 2Q10F 3Q10F 4Q10F 2011F 2012F
US 0.00 0.00 0.75 1.75 3.25 4.50Euro rate 1.00 1.00 1.00 1.50 2.75 3.50Japan 0.10 0.10 0.10 0.10 0.50 0.50UK 0.50 0.50 1.00 1.50 3.00 3.75Switzerland 0.25 0.25 0.50 0.75 2.00 2.50Sweden 0.25 0.25 0.50 1.00 3.00 4.00Norway 2.00 2.50 3.00 3.25 4.00 4.50Iceland 9.00 8.00 6.50 6.00 5.50 5.00Canada 0.25 0.50 1.00 1.50 3.75 4.50Australia 4.00 4.50 5.00 5.50 6.00 6.00New Zealand 2.50 2.75 3.25 3.75 5.50 6.25
Czech Republic 1.00 1.00 1.25 1.75 2.50 2.75Hungary 5.75 5.75 5.50 5.75 6.00 5.50Kazakhstan* 7.00 6.50 6.50 6.50 7.00 -Poland 3.50 3.50 3.50 3.50 4.50 5.00Romania 7.00 6.25 6.25 6.25 8.00 7.50Russia* 7.50 7.50 7.50 8.00 8.00 -Turkey 6.50 6.50 6.50 8.00 9.50 9.50Ukraine 10.25 9.75 9.50 9.50 7.00 6.50
Brazil 8.75 8.75 9.25 10.25 10.25 9.50Mexico 4.50 4.50 6.00 6.50 7.75 8.50
China 2.52 2.79 3.06 3.33 3.33 3.33India 5.00 5.50 6.00 6.50 7.50 8.00Indonesia 6.75 7.25 7.50 7.75 8.00 8.00Korea 2.50 3.25 3.75 4.00 4.50 4.50Malaysia 2.00 2.00 2.00 2.50 3.00 3.00Philippines 4.00 4.00 4.50 5.00 6.25 6.25Taiwan 1.25 1.25 1.50 1.75 2.25 2.50Thailand 1.25 1.25 1.50 1.75 2.50 2.50
* Russia & Kasakstan updated as of 11 December 2009 Source: ING _

254
Benelux Real Estate February 2010
Fig 8 3-month Interest Rate Forecasts (end period, %)
1Q10F 2Q10F 3Q10F 4Q10F 2011F 2012F
US 0.40 0.55 1.05 2.05 3.40 4.70Euro rate 0.85 1.15 1.25 1.75 2.85 3.60Japan 0.30 0.30 0.30 0.30 0.70 0.75UK 0.70 0.80 1.30 1.80 3.30 4.00Switzerland 0.25 0.30 0.55 0.70 2.10 2.70Sweden 0.60 0.70 1.00 1.40 3.30 4.20Norway 2.50 2.90 3.40 3.50 4.30 4.80Canada 0.60 0.95 1.50 1.95 4.15 4.65
Bulgaria 4.35 4.15 4.25 4.35 4.35 5.10Croatia 3.85 3.95 4.05 4.25 4.65 5.10Czech Republic 1.50 1.50 1.75 2.00 3.00 3.50Hungary 5.80 5.80 5.70 5.80 6.10 5.60Poland 4.08 4.13 4.08 4.10 4.82 5.15Romania 8.10 7.50 7.00 7.25 8.75 7.75Russia* 6.50 6.00 6.20 6.50 6.50 -Turkey 7.06 7.26 7.26 9.04 10.05 9.95Ukraine 22.00 19.00 17.00 17.00 15.00 12.50
Brazil 9.24 9.74 10.24 10.25 10.25 9.50Mexico 4.53 4.53 6.05 6.55 7.83 8.59
China* 1.40 1.60 1.80 2.00 2.80 2.80Hong Kong 0.25 0.40 0.70 1.10 2.30 2.30India 3.90 4.10 4.25 4.40 5.50 6.50Indonesia 7.25 7.50 7.75 8.00 8.50 8.50Korea* 2.90 3.50 3.90 4.25 4.50 4.50Malaysia 2.30 2.40 2.60 2.90 3.30 3.30Philippines* 4.40 4.40 4.60 4.80 5.00 5.00Singapore 0.65 0.80 1.00 1.50 2.00 2.00Taiwan* 0.50 0.60 1.00 1.25 2.00 2.20Thailand 1.40 1.60 1.80 2.00 2.30 2.50
* Russia updated as of 11 December 2009 * 3 month PBOC bill rate for China; CD rate for Korea, T-bill rate for the Philippines and CP rate for Taiwan; Interbank rates for the others Source: ING _

255
Benelux Real Estate February 2010
Fig 9 10Y Bond Yield Forecasts (end period 10Y unless stated, %)
1Q10F 2Q10F 3Q10F 4Q10F 2011F 2012F
US: Fed funds 0.00 0.00 0.75 1.75 3.25 4.503M 0.40 0.55 1.05 2.05 3.40 4.502Y 1.80 2.20 2.60 3.00 3.90 4.505Y 3.10 3.30 3.50 3.60 4.40 4.5010Y 4.20 4.50 4.70 4.50 4.50 4.5030Y 4.80 4.90 5.10 5.00 5.00 4.75
EU12: ECB refi 1.00 1.00 1.00 1.50 3.25 3.503M 0.85 1.15 1.25 1.75 2.85 3.602Y 1.80 2.00 2.30 2.60 3.40 3.705Y 2.80 2.90 3.00 3.00 3.90 4.0010Y 3.60 3.70 3.80 3.90 4.10 4.3030Y 4.20 4.30 4.30 4.40 4.50 4.50
Japan 1.40 1.40 1.40 1.70 2.00 2.00UK 4.40 4.70 4.60 4.60 5.00 5.00Canada 4.00 4.30 4.50 4.30 4.30 4.40Switzerland 2.10 2.20 2.30 2.50 3.20 3.70Sweden 3.70 4.00 4.40 4.60 4.90 4.90Norway 4.40 4.50 4.60 4.80 5.20 5.30
Bulgaria 6.80 6.70 6.30 5.90 5.40 5.60Croatia 6.10 6.20 5.80 5.60 5.40 5.60Czech Republic 4.40 4.50 4.80 4.90 5.60 5.50Hungary 8.00 8.20 7.70 7.30 6.50 6.20Poland 5.88 5.71 5.96 5.88 6.05 5.72Romania (5Y) 8.75 8.00 7.80 8.00 8.50 7.00Russia * 8.00 7.50 7.80 8.00 8.00 -Slovakia 4.60 4.70 4.75 4.80 4.90 4.90Ukraine (5Y) 10.80 10.50 10.10 9.80 9.70 9.70
Brazil 13.00 13.00 12.50 11.75 10.75 8.75Mexico 8.20 8.50 8.70 8.50 8.50 8.50
China (5Y) 3.20 3.40 3.60 3.80 4.30 4.30Hong Kong 2.60 2.70 2.80 2.90 3.50 3.50India 8.20 8.40 8.50 8.60 9.00 8.5Indonesia (10Y) 10.25 10.50 10.50 10.25 10.00 10.00Korea (3Y) 4.80 5.00 5.25 5.50 5.50 5.50Malaysia (5Y) 3.80 3.90 4.00 4.20 4.50 4.50Philippines (5Y) 6.40 6.50 6.60 6.75 7.00 7.00Singapore 2.70 2.80 2.90 3.00 3.30 3.30Taiwan 1.55 1.70 1.80 2.00 2.30 2.50Thailand 4.50 4.60 4.70 4.80 4.80 5.00
* Russia updated as of 11 December 2009 Updated 8 January 2010 Source: ING _
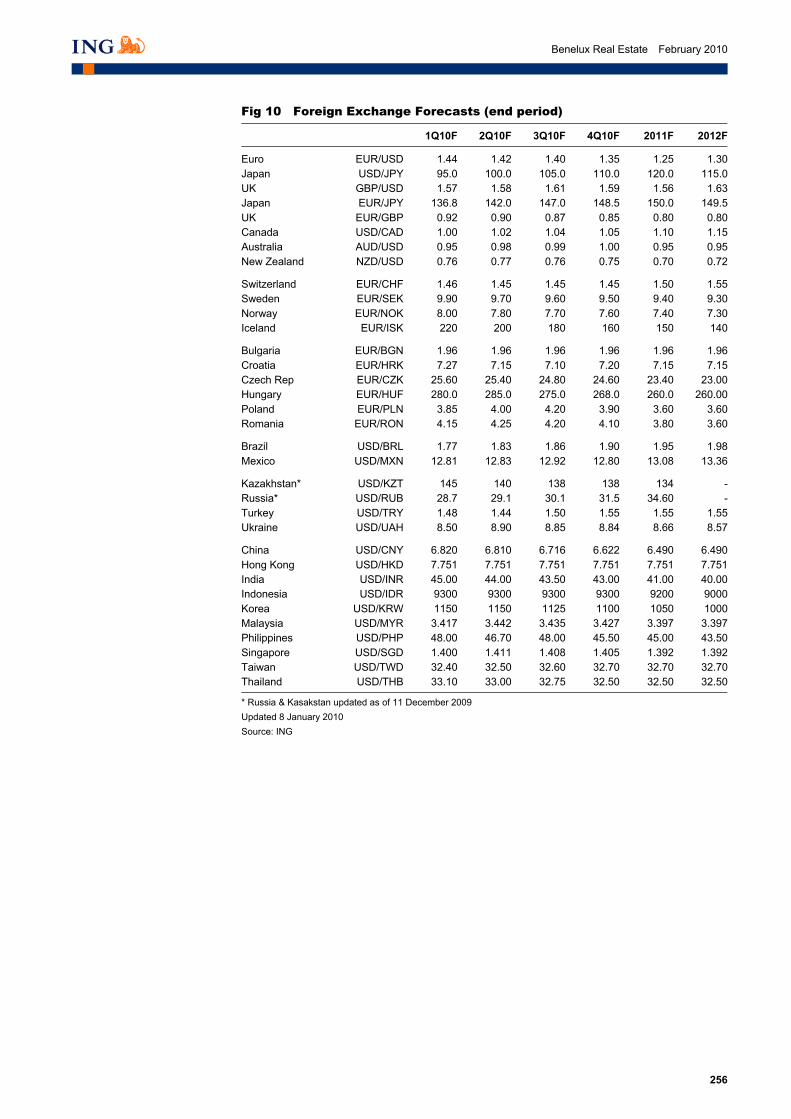
256
Benelux Real Estate February 2010
Fig 10 Foreign Exchange Forecasts (end period)
1Q10F 2Q10F 3Q10F 4Q10F 2011F 2012F
Euro EUR/USD 1.44 1.42 1.40 1.35 1.25 1.30Japan USD/JPY 95.0 100.0 105.0 110.0 120.0 115.0UK GBP/USD 1.57 1.58 1.61 1.59 1.56 1.63Japan EUR/JPY 136.8 142.0 147.0 148.5 150.0 149.5UK EUR/GBP 0.92 0.90 0.87 0.85 0.80 0.80Canada USD/CAD 1.00 1.02 1.04 1.05 1.10 1.15Australia AUD/USD 0.95 0.98 0.99 1.00 0.95 0.95New Zealand NZD/USD 0.76 0.77 0.76 0.75 0.70 0.72
Switzerland EUR/CHF 1.46 1.45 1.45 1.45 1.50 1.55Sweden EUR/SEK 9.90 9.70 9.60 9.50 9.40 9.30Norway EUR/NOK 8.00 7.80 7.70 7.60 7.40 7.30Iceland EUR/ISK 220 200 180 160 150 140
Bulgaria EUR/BGN 1.96 1.96 1.96 1.96 1.96 1.96Croatia EUR/HRK 7.27 7.15 7.10 7.20 7.15 7.15Czech Rep EUR/CZK 25.60 25.40 24.80 24.60 23.40 23.00Hungary EUR/HUF 280.0 285.0 275.0 268.0 260.0 260.00Poland EUR/PLN 3.85 4.00 4.20 3.90 3.60 3.60Romania EUR/RON 4.15 4.25 4.20 4.10 3.80 3.60
Brazil USD/BRL 1.77 1.83 1.86 1.90 1.95 1.98Mexico USD/MXN 12.81 12.83 12.92 12.80 13.08 13.36
Kazakhstan* USD/KZT 145 140 138 138 134 -Russia* USD/RUB 28.7 29.1 30.1 31.5 34.60 -Turkey USD/TRY 1.48 1.44 1.50 1.55 1.55 1.55Ukraine USD/UAH 8.50 8.90 8.85 8.84 8.66 8.57
China USD/CNY 6.820 6.810 6.716 6.622 6.490 6.490Hong Kong USD/HKD 7.751 7.751 7.751 7.751 7.751 7.751India USD/INR 45.00 44.00 43.50 43.00 41.00 40.00Indonesia USD/IDR 9300 9300 9300 9300 9200 9000Korea USD/KRW 1150 1150 1125 1100 1050 1000Malaysia USD/MYR 3.417 3.442 3.435 3.427 3.397 3.397Philippines USD/PHP 48.00 46.70 48.00 45.50 45.00 43.50Singapore USD/SGD 1.400 1.411 1.408 1.405 1.392 1.392Taiwan USD/TWD 32.40 32.50 32.60 32.70 32.70 32.70Thailand USD/THB 33.10 33.00 32.75 32.50 32.50 32.50
* Russia & Kasakstan updated as of 11 December 2009 Updated 8 January 2010 Source: ING
_

257
Benelux Real Estate February 2010
Disclosures Appendix ANALYST CERTIFICATION The analyst(s) who prepared this report hereby certifies that the views expressed in this report accurately reflect his/her personal views about the subject securities or issuers and no part of his/her compensation was, is, or will be directly or indirectly related to the inclusion of specific recommendations or views in this report.
IMPORTANT DISCLOSURES Company disclosures and ratings charts are available from the disclosures page on our website at http://research.ing.com or write to The Compliance Department, ING Financial Markets LLC, 1325 Avenue of the Americas, New York, USA, 10019. Valuation and risks: For details of the valuation methodologies used to determine our price targets and risks related to the achievement of these targets refer to the main body of this report and/or the most recent company report available at http://research.ing.com. The remuneration of research analysts is not tied to specific investment banking transactions performed by ING Group although it is based in part on overall revenues, to which investment banking contribute. Securities prices: Prices are taken as of the previous day’s close on the home market unless otherwise stated. Job titles. The functional job title of the person/s responsible for the recommendations contained in this report is equity research analyst unless otherwise stated. Corporate titles may differ from functional job titles. Conflicts of interest policy. ING manages conflicts of interest arising as a result of the preparation and publication of research through its use of internal databases, notifications by the relevant employees and Chinese walls as monitored by ING Compliance. For further details see our research policies page at http://research.ing.com.
FOREIGN AFFILIATES DISCLOSURES Each ING legal entity which produces research is a subsidiary, branch or affiliate of ING Bank N.V. See back page for the addresses and primary securities regulator for each of these entities.
RATING DISTRIBUTION (as of end 4Q09) RATING DEFINITIONS
Equity coverage Investment Banking clients*
Buy 45% 53%Hold 42% 41%Sell 13% 40% 100% * Percentage of companies in each rating category that are Investment Banking clients of ING Financial Markets LLC or an affiliate.
Buy: Forecast 12-mth absolute total return greater than +15%
Hold: Forecast 12-mth absolute total return of +15% to -5%
Sell: Forecast 12-mth absolute total return less than -5%
Total return: forecast share price appreciation to target price plus forecast annual dividend. Price volatility and our preference for not changing recommendations too frequently means forecast returns may fall outside of the above ranges at times.
.
_
BeneluxReal EstateEquity MARKEtS
February 2010
Benelux Real EstateCrisis controlled, directions for recovery
Average expected total return for Benelux Real Estate is 15%, of which 7% is dividend
Our top picks are Cofinimmo, Corio, Eurocommercial, VastNed O&I, VastNed Retail and Wereldhave
The strong defensive qualities of a number of Belgian companies will become less relevant as the recovery firms up
Arjan KnibbeAmsterdam (31) 20 563 [email protected]
Jean-Yves DevlooAmsterdam (31) 20 563 [email protected]
SEE THE DISCLOSURES APPENDIX FOR IMPORTANT DISCLOSURES AND ANALYST CERTIFICATION
Benelux R
eal EstateFebruary 2010
AMStERDAM BRuSSELS LONDON NEW yORK SiNGAPORE Tel: 31 20 563 8417 Tel: 32 2 547 7534 Tel: 44 20 7767 1000 Tel: 1 646 424 6000 Tel: 65 6535 3688
Bratislava Tel: 421 2 5934 6111 Bucharest Tel: 40 21 222 1600 Budapest Tel: 36 1 235 8800 Buenos Aires Tel: 54 11 4310 4700 Dublin Tel: 353 1 638 4000
Geneva Tel: 41 22 593 8050 Hong Kong Tel: 852 2848 8488 Istanbul Tel: 90 212 367 7011 Kiev Tel: 380 44 230 3030 Madrid Tel: 34 91 789 8880
Manila Tel: 63 2 479 8888 Mexico City Tel: 52 55 5258 2199 Milan Tel: 39 02 89629 3610 Moscow Tel: 7 495 755 5400 Paris Tel: 33 1 56 39 32 84
Prague Tel: 420 257 473 111 Santiago Tel: 56 2 659 2700 Sao Paulo Tel: 55 11 4504 6000 Seoul Tel: 82 2 317 1800 Shanghai Tel: 86 21 6841 3355
Sofia Tel: 359 2 917 6400 Taipei Tel: 886 2 2734 7600 Tokyo Tel: 81 3 5210 0100 Warsaw Tel: 48 22 820 5018
Research offices: legal entity/address/primary securities regulator Amsterdam ING Bank N.V., Foppingadreef 7, Amsterdam, Netherlands, 1102BD. Netherlands Authority for the Financial Markets
Bratislava ING Bank N.V., pobocka zahranicnej banky, Jesenskeho 4/C, 811 02 Bratislava, Slovak Republic. National Bank of Slovakia
Brussels ING Belgium S.A./N.V., Avenue Marnix 24, Brussels, Belgium, B-1000. Banking Finance and Insurance Commission
Bucharest ING Bank N.V. Bucharest Branch, 11-13 Kiseleff Avenue, PO Box 2-208, 011342, Bucharest 1, Romania Romanian National Securities and Exchange Commission
Budapest ING Bank N.V. Hungary Branch, Dozsa Gyorgy ut 84\B, H - 1068 Budapest, Hungary. Hungarian Financial Supervisory Authority
Hong Kong ING Bank N.V. Hong Kong Branch, 39/F, One International Finance Centre, Central Hong Kong. Hong Kong Monetary Authority
Istanbul ING Bank N.V. Istanbul Representative Office, Eski Buyukdere Caddesi Guney Plaza No: 17 / A Kat: 3 Maslak, Istanbul, Turkey, 34398. Capital Markets Board
Kiev ING Bank Ukraine JSC, 30-a, Spaska Street, Kiev, Ukraine, 04070 Ukrainian Securities and Stock Commission
London ING Bank N.V. London Branch, 60 London Wall, London EC2M 5TQ, United Kingdom. Authorised by the Dutch Central Bank
Manila ING Bank N.V. Manila Branch, 21/F Tower I, Ayala Avenue, 1226 Makati City, Philippines. Philippine Securities and Exchange Commission
Mexico City ING Bank (Mexico) SA, Bosques de Alisos 45-B, Piso 4, Bosques de Las Lomas, 05120, Mexico City, Mexico. Comisión Nacional Bancaria y de Valores
Milan ING Bank N.V. Milano, Via Paleocapa, 5, Milano, Italy, 20121. Commissione Nazionale per le Società e la Borsa
Moscow ING Bank (Eurasia) ZAO, 36, Krasnoproletarskaya ulitsa, 127473 Moscow, Russia. Federal Financial Markets Service
Mumbai ING Vysya Bank Limited, A Wing, Shivsagar Estate, 2nd Floor, South Wing, Dr. Annie Besant Road, Worli, Mumbai, 400 018. India Securities and Exchange Board of India
New York ING Financial Markets LLC, 1325 Avenue of the Americas, New York, United States, 10019. Securities and Exchange Commission
Prague ING Bank N.V. Prague Branch, Nadrazni 25, 150 00 Prague 5, Czech Republic. Czech National Bank
Sao Paulo ING Bank N.V. Sao Paulo, Ave. Presidente Juscelino Kubistchek, 2nd floor, Sao Paulo, Brazil 04543-000. Securities and Exchange Commission of Brazil
Singapore ING Bank N.V. Singapore Branch, 19/F Republic Plaza, 9 Raffles Place, #19-02, Singapore, 048619. Monetary Authority of Singapore
Sofia ING Bank N.V. Sofia Branch, 49B Bulgaria Blvd, Sofia 1404 Bulgaria. Financial Supervision Commission
Warsaw ING Securities S.A., Plac Trzech Krzyzy, 10/14, Warsaw, Poland, 00-499. Polish Financial Supervision Authority
Disclaimer This report has been prepared on behalf of ING (being for this purpose the wholesale and investment banking business of ING Bank NV and certain of its subsidiary companies) solely for the information of its clients. ING forms part of ING Group (being for this purpose ING Groep NV and its subsidiary and affiliated companies). It is not investment advice or an offer or solicitation for the purchase or sale of any financial instrument. While reasonable care has been taken to ensure that the information contained herein is not untrue or misleading at the time of publication, ING makes no representation that it is accurate or complete. The information contained herein is subject to change without notice. ING Group and any of its officers, employees, related and discretionary accounts may, to the extent not disclosed above and to the extent permitted by law, have long or short positions or may otherwise be interested in any transactions or investments (including derivatives) referred to in this report. In addition, ING Group may provide banking, insurance or asset management services for, or solicit such business from, any company referred to in this report. Neither ING Group nor any of its officers or employees accepts any liability for any direct or consequential loss arising from any use of this report or its contents. Copyright and database rights protection exists in this report and it may not be reproduced, distributed or published by any person for any purpose without the prior express consent of ING. All rights are reserved. Any investments referred to herein may involve significant risk, are not necessarily available in all jurisdictions, may be illiquid and may not be suitable for all investors. The value of, or income from, any investments referred to herein may fluctuate and/or be affected by changes in exchange rates. Past performance is not indicative of future results. Investors should make their own investigations and investment decisions without relying on this report. Only investors with sufficient knowledge and experience in financial matters to evaluate the merits and risks should consider an investment in any issuer or market discussed herein and other persons should not take any action on the basis of this report. This report is issued: 1) in the United Kingdom only to persons described in Articles 19, 47 and 49 of the Financial Services and Markets Act 2000 (Financial Promotion) Order 2005 and is not intended to be distributed, directly or indirectly, to any other class of persons (including private investors); 2) in Italy only to persons described in Article No. 31 of Consob Regulation No. 11522/98. Clients should contact analysts at, and execute transactions through, an ING entity in their home jurisdiction unless governing law permits otherwise. ING Bank N.V. London Branch is authorised by the Dutch Central Bank. It is incorporated in the Netherlands and its London Branch is registered in the UK (number BR000341) at 60 London Wall, London EC2M 5TQ. ING Financial Markets LLC, which is a member of the NYSE, FINRA and SIPC and part of ING, has accepted responsibility for the distribution of this report in the United States under applicable requirements. ING Vysya Bank Ltd is responsible for the distribution of this report in India. EQ Additional information is available on request