BENEFITS OF HEADLAMP LEVELING AND CLEANING FOR …
19
UMTRI-2007-46 NOVEMBER 2007 BENEFITS OF HEADLAMP LEVELING AND CLEANING FOR CURRENT U.S. LOW BEAMS MICHAEL J. FLANNAGAN MICHAEL SIVAK BRANDON SCHOETTLE
Transcript of BENEFITS OF HEADLAMP LEVELING AND CLEANING FOR …

UMTRI-2007-46 NOVEMBER 2007
BENEFITS OF HEADLAMP LEVELING AND CLEANING FOR CURRENT U.S. LOW BEAMS
MICHAEL J. FLANNAGAN MICHAEL SIVAK
BRANDON SCHOETTLE

BENEFITS OF HEADLAMP LEVELING AND CLEANING FOR CURRENT U.S. LOW BEAMS
Michael J. Flannagan Michael Sivak
Brandon Schoettle
The University of Michigan Transportation Research Institute
Ann Arbor, Michigan 48109-2150 U.S.A.
Report No. UMTRI-2007-46 November 2007

i
Technical Report Documentation Page 1. Report No.
UMTRI-2007-46 2. Government Accession No.
3. Recipient’s Catalog No.
5. Report Date
November 2007 4. Title and Subtitle Benefits of Headlamp Leveling and Cleaning for Current U.S. Low Beams 6. Performing Organization Code
302753 7. Author(s)
Flannagan, M.J., Sivak, M., and Schoettle, B. 8. Performing Organization Report No. UMTRI-2007-46 10. Work Unit no. (TRAIS)
9. Performing Organization Name and Address The University of Michigan Transportation Research Institute 2901 Baxter Road Ann Arbor, Michigan 48109-2150 U.S.A.
11. Contract or Grant No.
13. Type of Report and Period Covered
12. Sponsoring Agency Name and Address The University of Michigan Industry Affiliation Program for Human Factors in Transportation Safety
14. Sponsoring Agency Code
15. Supplementary Notes The Affiliation Program currently includes Alps Automotive/Alpine Electronics, Autoliv, Bendix, BMW, Bosch, Chrysler, Com-Corp Industries, Decoma Autosystems, Denso, Federal-Mogul, Ford, GE, General Motors, Gentex, Grote Industries, Hella, Honda, Ichikoh Industries, Koito Manufacturing, Lang-Mekra North America, Magna Donnelly, Muth, Nissan, North American Lighting, Northrop Grumman, OSRAM Sylvania, Philips Lighting, Renault, SABIC Innovative Plastics, Siemens VDO Automotive, Sisecam, SL Corporation, Stanley Electric, Toyota Technical Center USA, Truck-Lite, Valeo, Visteon/ACH, and 3M Personal Safety Products. Information about the Affiliation Program is available at: http://www.umich.edu/~industry/ 16. Abstract
The goal of this study was to examine whether the recent changes in the sharpness of the vertical gradient in U.S. low beams have changed the importance of headlamp leveling and cleaning systems. The study consisted of three parts. In the first part, we collected new data on dynamic distributions of pitch angles for a passenger car, a minivan, and an SUV in actual traffic. In the second part, we applied the new dynamic pitch data (combined with recent static pitch data) to representative low-beam patterns to estimate the changes in the benefits of leveling systems. These estimates were made for a comprehensive combination of static and dynamic sources of misaim; additional analyses would be necessary to determine the relative benefits of leveling systems that address selected sources of misaim. Three sets of photometric data were used in the analysis: market-weighted 1997 and 2004 tungsten-halogen beam patterns, and a representative 2004 HID beam pattern. In the third part, we applied a previously derived model for the effects of dirt on the three beam patterns to estimate the changes in the benefits of cleaning systems. In both sets of analyses, the effects on both visibility and glare were considered. The results indicate that (1) the importance of headlamp leveling systems for U.S. low beams has recently increased substantially for tungsten-halogen and especially HID lamps, and (2) the importance of headlamp cleaning systems has stayed approximately the same. 17. Key Words headlamps, low beams, leveling, cleaning, visibility, glare
18. Distribution Statement Unlimited
19. Security Classification (of this report) None
20. Security Classification (of this page) None
21. No. of Pages 18
22. Price
ii
Acknowledgments
Appreciation is extended to the members of the University of Michigan Industry
Affiliation Program for Human Factors in Transportation Safety for support of this
research. The current members of the Program are:
Alps Automotive/Alpine Electronics
Autoliv
Bendix
BMW
Bosch
Chrysler
Com-Corp Industries
Decoma Autosystems
Denso
Federal-Mogul
Ford
GE
General Motors
Gentex
Grote Industries
Hella
Honda
Ichikoh Industries
Koito Manufacturing
Lang-Mekra North America
Magna Donnelly
Muth
Nissan
North American Lighting
Northrop Grumman
OSRAM Sylvania
Philips Lighting
Renault
SABIC Innovative Plastics
Siemens VDO Automotive
Sisecam
SL Corporation
Stanley Electric
Toyota Technical Center, USA
Truck-Lite
Valeo
Visteon/ACH
3M Personal Safety Products

iii
Contents
Acknowledgments...............................................................................................................ii
Introduction.........................................................................................................................1
In-Traffic Vehicle Pitch ......................................................................................................2
Benefits of Headlamp Leveling ..........................................................................................6
Benefits of Headlamp Cleaning ..........................................................................................9
Conclusions....................................................................................................................... 12
References......................................................................................................................... 13
1
Introduction
Leveling and cleaning systems for headlamps are common in Europe. Indeed, the
Economic Commission for Europe (ECE) regulations require manual leveling systems for all
headlamps; automatic leveling systems and cleaning systems are required for low beam
headlamps with lights sources that produce at least 2,000 lumens (ECE, 2006). (See
Dorleans (1992) and Bahnmüller (1997) for overviews of leveling and cleaning systems,
respectively.) The primary rationale for the use of headlamp leveling systems in Europe has
been the desire to control the increase in glare that occurs with headlamps aimed too high.
Analogously, although lens dirt has negative effects not only on glare (because of light
scattering) but also on visibility (because of light filtering), it is the glare control aspect that
is often emphasized with headlamp cleaning systems.
In contrast to the situation in Europe, leveling and cleaning systems are not required
in the U.S. There are two main reasons for this state of affairs. First, the U.S. regulations, in
contrast to the ECE regulations, traditionally emphasized visibility; glare control was
secondary. Second, the traditional U.S. low-beam patterns, produced by sealed beams, had a
relatively soft cut-off (vertical gradient). Thus, vertical misaim with such headlamps had
less severe consequences than with ECE headlamps that have sharper gradients.
However, low-beam headlighting in the U.S. has recently undergone major changes.
First, there was the introduction in the late 1990s of visual/optical aiming. Second, there has
been an increased usage of projector lamps. Third, HID headlamps have appeared on
vehicles. All three of these factors contributed to sharper vertical gradients (Sivak,
Schoettle, & Flannagan, 2004). Consequently, the present study was designed to quantify
how the benefits of leveling and cleaning systems have changed recently for U.S. low beams.
This study consisted of three parts. In the first part, we collected new data on
dynamic distributions of pitch angles for a passenger car, a minivan, and an SUV in actual
traffic. In the second part, we applied the new dynamic pitch data (combined with recent
static pitch data) to market-weighted 1997 and 2004 tungsten-halogen low-beam patterns and
a representative 2004 HID low-beam pattern. This was performed to estimate the changes in
the benefits of leveling systems for both visibility and glare. In the third part, we applied a
previously derived model for the effects of dirt on the three beam patterns to estimate the
changes in the benefits of cleaning systems.

2
In-traffic vehicle pitch
Background
In a recent study, we comprehensively analyzed the effects of the 10 most important
factors on the performance of low-beam headlamps (Sivak, Flannagan, & Miyokawa, 1998).
Based on the results of this analysis, we concluded that vertical aim is overwhelmingly the
most important factor.
There are two broad sources of vertical misaim: static and dynamic. Static sources
have their influence even when a vehicle is not moving. They include, for example, incorrect
initial aim, damage, and vehicle load (occupants, cargo, and fuel). The most recent survey of
the static aim of U.S. vehicles in use found that the standard deviation of vertical aim was
0.65° (Copenhaver & Jones, 1992). (Previous U.S. studies of Olson and Winkler (1985) and
Hull et al. (1972) obtained standard deviations of 0.9° and 0.8°, respectively.)
Dynamic sources of vertical misaim occur while moving. They include, for example,
acceleration/deceleration, aerodynamics, and road irregularities. As shown by Ishikawa and
Kobayashi (1993) and Huhn (1999), acceleration tends to produce greater effects (1.0° and
1.23°, respectively) than deceleration (-0.7° and -0.63°, respectively). (The g levels were not
specified in these two studies.) Speed has a more moderate effect. For example, Olson and
Winkler (1985) found that the effect at 88 km/h was 0.08°.
In this part of the study, we measured dynamic effects on headlamp aim (by
monitoring vehicle pitch) for three vehicles types: sedan, minivan, and SUV. The dynamic
influences involved were typical accelerations/decelerations, speed, and road irregularities
encountered during test drives on a route over public roads in Ann Arbor, Michigan.
Dynamic effects were measured under two levels of a static influence: vehicle load
(minimum or full).
Method
Loads. Two load conditions were tested: minimum load (only a 150-pound [68-kg]
driver), and full load. For each vehicle, the full load was enough to bring it to approximately
its gross vehicle weight rating. The loads included the same driver as in the minimum
condition, plus 150 pounds [68 kg] of bagged sand in each passenger position and 100

3
pounds [45 kg] of bagged sand in the trunk or rear cargo area. The number of passenger
positions, in addition to the driver, were 4 four for the sedan and 6 each for the minivan and
SUV.
Route. The same 24-km route was used for all runs. The route included rural,
expressway, and residential sections. All runs were driven by the same driver.
Vehicles. Three vehicles were used: a sedan (1992 Honda Accord), a minivan (2002
Dodge Grand Caravan), and an SUV (2002 Ford Explorer).
Instrumentation. Vehicle pitch was measured throughout the test drives at 100 Hz by
means of a pair of laser range finders mounted near the front and rear bumpers.
Results
Mean pitch by vehicle and load is presented in Figure 1. The main findings are as
follows: (1) The differences in mean pitch by vehicle class are not major, and (2) the
differences between the two load conditions across the three vehicle classes averaged 0.83°.
The corresponding standard deviations are shown in Figure 2. The main finding is that
standard deviation of pitch does not vary substantially with vehicle class or load.
-0.10
0.00
0.10
0.20
0.30
0.40
0.50
0.60
0.70
0.80
0.90
1.00
Passenger Car Minivan SUVVehicle Type
Pitc
h (d
egre
es)
Minimum loadFull load
Figure 1. Mean pitch by vehicle and load.

4
0.00
0.05
0.10
0.15
0.20
0.25
0.30
0.35
Passenger Car Minivan SUVVehicle Type
Stan
dard
Dev
iatio
n (d
egre
es)
Minimum loadFull load
Figure 2. Standards deviation of pitch by vehicle and load.
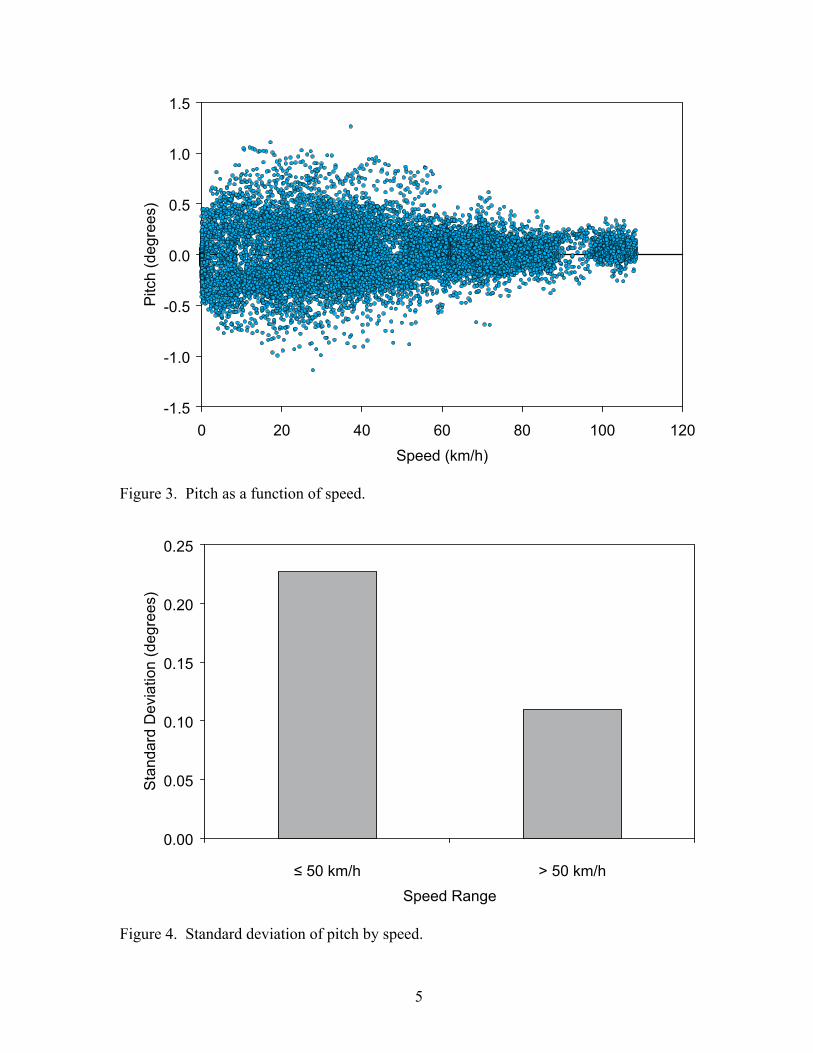
Figure 3 presents vehicle pitch as a function of speed for one of the six conditions
tested (SUV, minimum load). As is evident from Figure 3, the variability of pitch tended to
be greater at speeds of less than about 50 km/h than at higher speeds. (The pattern of results
was similar for the other five conditions.) Figure 4 presents standard deviation of pitch by
speed (averaged across the six conditions).
The effect of load on mean pitch was similar for all three vehicles. The mean change
in pitch from the minimum load to full load was +0.83°. However, given that the average
vehicle occupancy for passenger cars in the U.S. is only 1.57 persons (Bureau of
Transportation Statistics, 2007), it is not surprising that a recent, large study of 768 vehicles
(Copenhaver & Jones, 1992) found the mean static headlamp aim to be very close to 0
(+0.04°) when vehicles in normal use were sampled and measured with their loads of
occupants, cargo, and fuel in place.
5
-1.5
-1.0
-0.5
0.0
0.5
1.0
1.5
0 20 40 60 80 100 120Speed (km/h)
Pitc
h (d
egre
es)
Figure 3. Pitch as a function of speed.
0.00
0.05
0.10
0.15
0.20
0.25
> 50 km/hSpeed Range
Stan
dard
Dev
iatio
n (d
egre
es)
Figure 4. Standard deviation of pitch by speed.

6
Benefits of headlamp leveling
Approach
To estimate the benefits of leveling systems, we calculated the amount of light
directed toward representative visibility and glare test points when the lamps were correctly
aimed and when they were misaimed at two standard deviations of vertical aim.
Standard deviation of vertical aim
To estimate the combined static and dynamic standard deviation of pitch, we used the
static standard deviation obtained by Copenhaver and Jones (1992) for a wide variety of
vehicles and loads (0.65°), and the dynamic standard deviation for speeds of 50 km/h or less
from the preceding section of this report (0.23°). The combined standard deviation (0.69°,
rounded to 0.7°) was derived by taking the square root of the sum of the squares of each
standard deviation. This way of combining the standard deviations assumes that the static
and dynamic effects are independent random variables, as is probably appropriate for
estimating the overall level of misaim for a large population of vehicles. For example, the
combined standard deviation of vertical aim as estimated here would probably characterize
the distribution of aims one would experience in a large number of encounters with
oncoming vehicles in the course of a night drive.
Headlamp samples
The 1997 tungsten-halogen sample. A total of 23 lamps, manufactured for use on the
23 best-selling 1997 model year light vehicles, were in this sample (Sivak, Flannagan,
Kojima, & Traube, 1997). The 23 vehicles constituted 45% of all vehicles sold during that
year. None of the lamps was visually/optically aimable.
The 2004 tungsten-halogen sample. A total of 20 lamps, manufactured for use on the
20 best-selling 2004 model year light vehicles were in this sample (Schoettle, Sivak,
Flannagan, & Kosmatka, 2004). The 20 vehicles constituted 39% of all vehicles sold during
that year. Most of the lamps (91%) were visually/optically aimable.
The 2004 HID sample. This sample consisted of 5 lamps for the 5 best-selling
vehicle models that offered HID low beams in that model year either as standard or optional
equipment (Sivak, Schoettle, & Flannagan, 2004). All of the lamps were visually/optically
aimable.

7
Test points
We used two standard test points for our analysis (FMVSS, 2006): a visibility test
point on the right side (0.6° down, 1.3° right), and a glare test point on the left side (0.5° up,
1.5° left). In each case, we used a reasonably worst case scenario of misaim: For the
visibility test point, we applied the misaim that corresponded to two standard deviations of
pitch down, while for the glare test point the misaim corresponded to two standard deviations
of pitch up. The median (50th percentile) luminous intensities were used in the analyses.
Results
Table 1 shows the consequences of misaiming the lamps two standard deviations of
vehicle pitch down on luminous intensities at 0.6° down, 1.5° right. The results indicate that
(1) for the tungsten-halogen lamps, the misaim resulted in a larger reduction for the 2004 low
beams (93%) than for the 1997 low beams (91%), and (2) for the 2004 lamps, the misaim
resulted in a larger reductions for the HID low beams (97%) than for the tungsten-halogen
low beams (93%).
Table 1
Median luminous intensity directed toward 0.6° down, 1.3° right (a visibility test point) from 1997 and 2004 U.S. low beams when aimed nominally and when misaimed two standard deviations of
vehicle pitch down.
Aim Lamps
Nominal 1.4° down Change
1997 T-H 15,976 cd 1,413 cd -91%
2004 T-H 19,365 cd 1,337 cd -93%
2004 HID 28,090 cd 944 cd -97%

8
Table 2 shows the consequences of misaiming the lamps two standard deviations of
vehicle pitch up on luminous intensities at 0.5° up, 1.5° left. The results indicate that (1) for
the tungsten-halogen lamps, the misaim resulted in a larger increase in luminous intensities
for the 2004 low beams (952%) than for the 1997 low-beams (518%), and (2) for the 2004
lamps, the misaim resulted in a larger increase in luminous intensities for the HID low beams
(2,433%) than for the tungsten-halogen low-beams (952%).
Table 2
Median luminous intensity directed toward 0.5° up, 1.5° left (a glare test point) from 1997 and 2004 U.S. low beams when aimed nominally
and when misaimed two standard deviations of vehicle pitch up.
Aim Lamps
Nominal 1.4° up Change
1997 T-H 911 cd 5,628 cd +518%
2004 T-H 932 cd 9,808 cd +952%
2004 HID 700 cd 17,733 cd +2,433%
A comparison of the data in Tables 1 and 2 highlights the magnitude of the misaim
problem. Specifically, the luminous intensity directed toward the glare test point when the
low beams are misaimed by two standard deviations up is greater than the luminous intensity
directed toward the visibility point tested when the low beams are misaimed by two standard
deviations down. While this effect was present for all three sets of lamps tested, the
magnitude of the effect was greatest for the 2004 HID lamps, followed by the 2004 tungsten-
halogen lamps, and the 1997 tungsten-halogen lamps.
9
Benefits of headlamp cleaning
Background
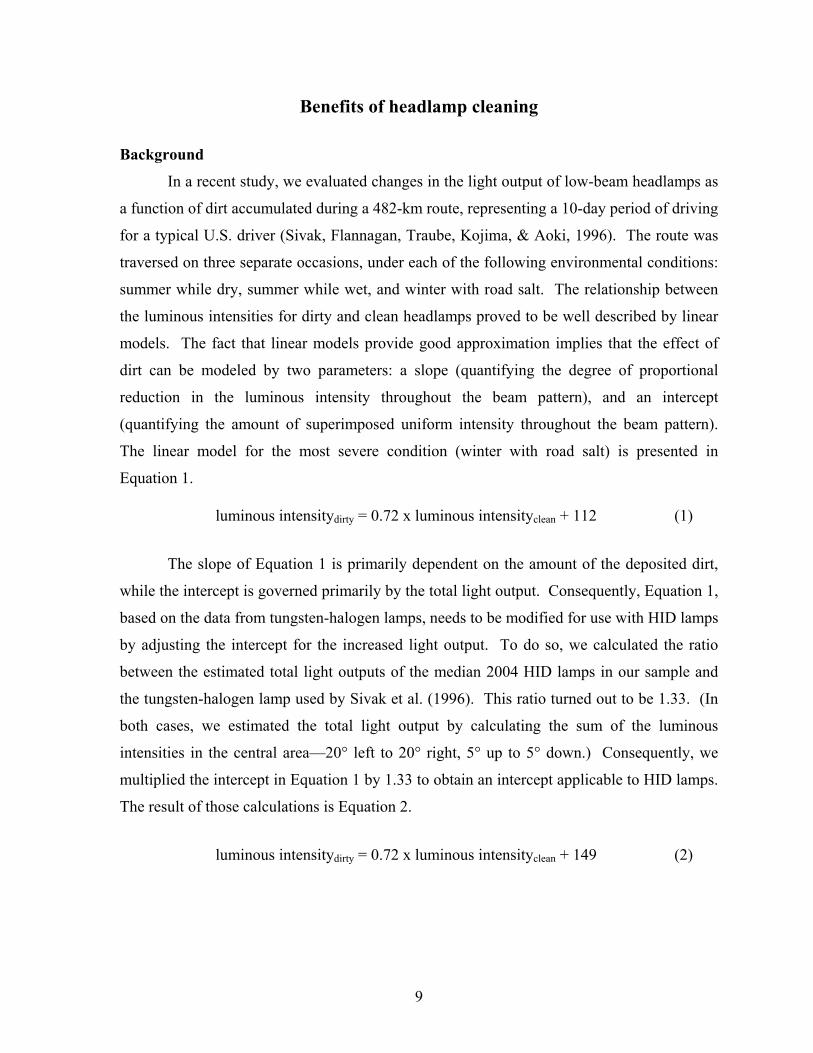
In a recent study, we evaluated changes in the light output of low-beam headlamps as
a function of dirt accumulated during a 482-km route, representing a 10-day period of driving
for a typical U.S. driver (Sivak, Flannagan, Traube, Kojima, & Aoki, 1996). The route was
traversed on three separate occasions, under each of the following environmental conditions:
summer while dry, summer while wet, and winter with road salt. The relationship between
the luminous intensities for dirty and clean headlamps proved to be well described by linear
models. The fact that linear models provide good approximation implies that the effect of
dirt can be modeled by two parameters: a slope (quantifying the degree of proportional
reduction in the luminous intensity throughout the beam pattern), and an intercept
(quantifying the amount of superimposed uniform intensity throughout the beam pattern).
The linear model for the most severe condition (winter with road salt) is presented in
Equation 1.
luminous intensitydirty = 0.72 x luminous intensityclean + 112 (1)
The slope of Equation 1 is primarily dependent on the amount of the deposited dirt,
while the intercept is governed primarily by the total light output. Consequently, Equation 1,
based on the data from tungsten-halogen lamps, needs to be modified for use with HID lamps
by adjusting the intercept for the increased light output. To do so, we calculated the ratio
between the estimated total light outputs of the median 2004 HID lamps in our sample and
the tungsten-halogen lamp used by Sivak et al. (1996). This ratio turned out to be 1.33. (In
both cases, we estimated the total light output by calculating the sum of the luminous
intensities in the central area—20° left to 20° right, 5° up to 5° down.) Consequently, we
multiplied the intercept in Equation 1 by 1.33 to obtain an intercept applicable to HID lamps.
The result of those calculations is Equation 2.
luminous intensitydirty = 0.72 x luminous intensityclean + 149 (2)

10
Approach
To estimate the benefits of cleaning systems on visibility and glare, we applied
Equation 1 (for the tungsten-halogen lamps) and Equation 2 (for the HID lamps) to the
luminous intensities in Tables 1 and 2, and then compared the “dirty” to “clean” values.
Results
The results are shown in Tables 3 and 4. The main finding is that the percentage
differences between the dirty and clean luminous intensities were similar for the low beams
in the three samples.
Table 3 Effects of dirt on the median luminous intensity directed toward 0.6° down, 1.3° right
(a visibility test point) from 1997 and 2004 U.S. low beams when aimed nominally and when misaimed two standard deviations of vehicle pitch down.
Aim
Nominal 1.4° down
Lamps Clean Dirty Change Clean Dirty Change
1997 T-H 15,976 cd 11,615 cd -27% 1,413 cd 1,130 cd -20%
2004 T-H 19,365 cd 14,055 cd -27% 1,337 cd 1,075 cd -20%
2004 HID 28,090 cd 20,374 cd -27% 944 cd 829 cd -12%
Table 4 Effects of dirt on the median luminous intensity directed toward 0.5° up, 1.5° left (a glare test point) from 1997 and 2004 U.S. low beams when aimed nominally
and when misaimed two standard deviations of vehicle pitch up.
Aim
Nominal 1.4° up
Lamps Clean Dirty Change Clean Dirty Change
1997 T-H 911 cd 768 cd -16% 5,628 cd 4,164 cd -26%
2004 T-H 932 cd 783 cd -16% 9,808 cd 7,174 cd -27%
2004 HID 700 cd 653 cd -7% 17,733 cd 12,917 cd -27%

11
Both test points had decreases in luminous intensity with dirt. Given Equation 1,
only the points of tungsten-halogen low beams that have the clean luminous intensity of less
than 400 cd would have increases with dirt. (At 400 cd, the proportional decrease due to the
slope of 0.72 is the same as the uniform increase due to the constant of 112.) The analogous
tipping point for HID low beams, based on Equation 2, is 539 cd.
12
Conclusions
The goal of this study was to examine whether the recent changes in the sharpness of
the vertical gradient in U.S. low beams have changed the importance of headlamp leveling
and cleaning systems.
The study consisted of three parts. In the first part, we collected new data on
dynamic distributions of pitch angles for a passenger car, a minivan, and an SUV in actual
traffic. In the second part, we applied the new dynamic pitch data (combined with recent
static pitch data) to representative low-beam patterns to estimate the changes in the benefits
of leveling systems. These estimates were made for a comprehensive combination of static
and dynamic sources of misaim; additional analyses would be necessary to determine the
relative benefits of leveling systems that address selected sources of misaim. Three sets of
photometric data were used in the analysis: market-weighted 1997 and 2004 tungsten-
halogen beam patterns, and a representative 2004 HID beam pattern. In the third part, we
applied a previously derived model for the effects of dirt on the three beam patterns to
estimate the changes in the benefits of cleaning systems. In both sets of analyses, the effects
on both visibility and glare were considered.
The results indicate that (1) the importance of headlamp leveling systems for U.S.
low beams has recently increased substantially for tungsten-halogen and especially HID
lamps, and (2) the importance of headlamp cleaning systems has stayed approximately the
same.

13
References
Bahnmüller, G. (1997). Progress in development of headlamp cleaning systems. In,
Proceedings of the Conference on Progress in Automotive Lighting (pp. 43-48).
Darmstadt, Germany: Technical University of Darmstadt.
Bureau of Transportation Statistics (2007). National transportation statistics 2007.
Washington, D.C.: U.S. Department of Transportation.
Copenhaver, M.M. and Jones, E. (1992). Measurement of headlamp aim and the electrical
and photometric performance characteristics of rear lighting systems (Report No.
DOT HS 807 930). Washington, D.C.: National Highway Traffic Safety
Administration.
Dorleans, G. (1992). Headlamp levelling devices (SAE Technical Paper Series No. 932000).
Warrendale, PA: Society of Automotive Engineers.
ECE [Economic Commission for Europe]. (2006). Uniform provisions concerning the
approval of vehicles with regard to the installation of lighting and light-signaling
devices (Regulation No. 48). Geneva: United Nations.
FMVSS [Federal Motor Vehicle Safety Standards] (2006). Standard No. 108: Lamps,
reflective devices, and associated equipment. In, Code of Federal Regulations, Title
49. Washington, D.C.: Office of the Federal Register.
Huhn, W. (1999). Influence of dynamic car parameters on lighting. In, Proceedings of the
Conference on Progress in Automotive Lighting (pp. 412-419). Darmstadt, Germany:
Technical University of Darmstadt.
Hull, R.W., Hemion, R.H., and Cadena, D.G. (1972). Guidelines for improving the stability
of headlamp aim (Report No. DOT HS 800 739). Washington, D.C.: National
Highway Traffic Safety Administration.
Ishikawa, M. and Kobayashi, S. (1993). Auto-levelling projector headlamp system with
rotatable light shield (SAE Technical Paper Series No. 930726). Warrendale, PA:
Society of Automotive Engineers.
Olson, P.L. and Winkler, C.B. (1985). Measurement of crash avoidance characteristics of
vehicles in use (Technical Report No. UMTRI-85-20). Ann Arbor: The University of
Michigan Transportation Research Institute.

14
Schoettle, B., Sivak, M., Flannagan, M.J., & Kosmatka, W.J. (2004). A market-weighted
description of low-beam headlighting patterns in the U.S.: 2004 (Technical Report
No. UMTRI-2004-23). Ann Arbor: The University of Michigan Transportation
Research Institute.
Sivak, M., Flannagan, M.J., Kojima, S., and Traube, E.C. (1997). A market-weighted
description of low-beam headlighting patterns in the U.S. (Technical Report No.
UMTRI-97-37). Ann Arbor: The University of Michigan Transportation Research
Institute.
Sivak, M., Flannagan, M.J., and Miyokawa, T. (1998). Quantitative comparisons of factors
influencing the performance of low-beam headlamps (Technical Report No. UMTRI-
98-42). Ann Arbor: The University of Michigan Transportation Research Institute.
Sivak, M., Flannagan, M.J., Traube, E.C., Kojima, S., and Aoki, M. (1996). Effects of
realistic levels of dirt on light distribution of low-beam headlamps (Technical Report
No. UMTRI-96-10). Ann Arbor: The University of Michigan Transportation
Research Institute.
Sivak, M., Schoettle, B., and Flannagan, M.J. (2004). Recent trends in the performance of
tungsten-halogen and HID low beams in the U.S. (Technical Report No. UMTRI-
2004-25). Ann Arbor: The University of Michigan Transportation Research Institute.