
Benefit-Based Tree Appraisal
61
Benefit-Based Tree Appraisal Greg McPherson USDA Forest Service, PSW Research Station Midwest Chapter ISA Annual Conference Center for Urban Forest Research
-
Upload
dinhnguyet -
Category
Documents
-
view
215 -
download
0
Transcript of Benefit-Based Tree Appraisal

Benefit-Based Tree AppraisalGreg McPherson
USDA Forest Service, PSW Research StationMidwest Chapter ISA Annual Conference
Center for Urban Forest Research
Today
• Tree valuation
• Yard tree comparison
• Street trees example
• Tree Effects Calculator
• Other Research & Tools

Tree Valuation Approaches
• Cost Value• Income Value• Market Value

Benefit-Based Approach
ValueValue
FunctionFunctionManagementManagement
StructureStructure

Tree
Benefit and Cost Values
Program Costs
Benefit ModelsEnergy
Air QualityCarbonRunoff
Aesthetics
Building/ Utility Climate Benefit
Prices
Benefit-Cost Modeling
Resource Units

Fraxinus pennsylvanica
Green Ash
0.00
10.00
20.00
30.00
40.00
50.00
60.00
70.00
80.00
15 30 45 60 75 90
Years After Planting
Hei
ght (
ft)
Bismarck
Cheyenne
Ft Collins
79%
61%58%
32%37%
62%

30 year old green ash
Bismarck
Cheyenne
Fort Collins

Cooling and Heating Energy Savings

Avoided Emissions

Carbon Dioxide

Rainfall Interception

Air Pollutant Uptake

Biogenic Volatile Organic Compounds Release

Aesthetic and Other Benefits
• 844 home sales, Athens, GA
• Large front yard tree adds 0.9%
• A = L x ((T x C) / M)– L = Leaf area increase – T = Sales price increase by
large tree = (0.9% x median home sales price
– C = Location reduction – M = Large tree leaf area

Aesthetic and Other Benefits

Yard Tree Comparison
• Green ash, Fort Collins • Front yard, west side• 40 years
– Cost Approach (Replacement value) – Income Approach
• Cumulative annual benefits (Ft Collins)• Cumulative annual benefits (Boulder)

Yard Tree Comparison
• Value = Basic Value x Cond x Loc Basic Value = Replacement Cost + (Basic Price x [TAa -TAr] x Species)
• Replacement Cost = $671• Basic Price = $49/sq inch• Species = 60%• Condition = 70%• Location = 70%

Benefit Valuation• Energy prices
– Electricity ($0.78/kWh)– Natural gas ($0.0072/kBtu)
• CO2 reduction– $15/ton - CO2e.com
• Pollutant uptake– Control costs (Wang and Santini
1995)• NO2 & O3 = $3.07/lb• SO2 = $7.13/lb• PM10 = $5.13/lb• VOC = $4.85/lb
• Rainfall interception– Control costs based on construction
and operation costs of detention/retention basin in Fort Collins ($0.01/gal)
• Aesthetic and Other– Median residential sales price– Ft Collins = $212,000– Boulder = $413,000

Yard Tree ComparisonGreen Ash, West Side, Yard, Ft. Collins, CO
0
10
20
30
40
50
60
70
0 5 10 15 20 25 30 35 40
Year After Planting
Valu
e ($
)
Energy Net CO2 Air Quality Runoff Esthetics

Yard Tree Comparison
Green Ash, West Side, Front Yard
0
1,000
2,000
3,000
4,000
5,000
6,000
0 5 10 15 20 25 30 35 40Year After Planting
Tota
l Val
ue ($
)
Replacement Value Income - Ft Collins Income - Boulder

Yard Tree Comparison Summary
• Replacement Value exceeds Income– Costs not included
• Income Value– Relative importance of each
benefit– Very sensitive to property
values– Sensitive to place – Tree condition not included

Street Trees Example
• 5 Pistache planted 15 years ago• Compare Current Value
– Replacement value– Net present value of benefits for next 25 years
• Discount rates: 4%, 7%, 10%
• Retain or remove and replace?– Remove Pistache and replace with Planes
• Amount saved from optimal planting?

Example in Davis, CA

Current Situation

Compare Current Value• Trunk formula
• Avg dbh = 9”• Avg condition = 57%• Avg location = 67%
– Site = 80%– Contribution = 70%– Placement = 50%
• Species rating = 90%• Basic price =
$56.50/sq inch
• Replacement Value– $1,751 avg/tree
($1,451 to $1,913)
Replacement Value
$0$200$400$600$800
$1,000$1,200$1,400$1,600$1,800$2,000
Tree 1 Tree 2 Tree 3 Tree 4 Tree 5 Average

Background• Modesto tree growth & benefit data for Pistache &
Plane• Davis tree care costs and sidewalk repair schedule
Activity Unit Cost $/treePlant pistache 75 Plant plane (adds $50 for site prep of shrub bed) 125 Prune small tree (4-yr cycle) 36Prune 6-12" dbh (8-yr cycle) 113Prune 12-18" dbh (8-yr cycle) 163Prune 18-24" dbh (8-yr cycle) 225Remove pistache 6-12" dbh (at 15 years) 150Remove pistache 12-18" dbh (at 40 years) 250Grind sidewalk (5 squares, at yrs 10, 15, 30, & 35 $20/4-ft square 20Root prune (at years 20, 25, and 40) 30Remove & replace sidewalk (at yrs 20 and 40) $12/sq ft, 3 sq/tree (48 sq ft) 576Remove & replace curb/gutter (at yrs 25 and 40) $50/linear ft, 12 ft/tree 600

Davis Benefit Valuation• Energy prices
– Electricity ($0.116/kWh)– Natural gas ($0.0064/kBtu)
• CO2 reduction– $30/ton
• Pollutant uptake– Emission reduction credits
• NO2 & O3 = $3.85/lb• PM10 = $4.47/lb• VOC = $1.51/lb
• Rainfall interception– Annualized capital cost and operations
and maintenance ($0.0017/gal)• Aesthetic and Other
– Median residential sales price– $273,518 in 1999-2000

Compare Current Value - CostsExpenditure per Pistache = $3,052 (Years 16-40)
Plant/Water, $0
Sidewalk, $2,482
Prune, $439Storm/Liability
, $35
Admin/Other, $96

Compare Current Value - BenefitsBenefit per Pistache = $1,726 (Years 16-40)
Energy, $476 Aesthetics, $820
Air Quality, $305
CO2, $99 Stormwater,
$26

Compare Current Value
• NPV Yr 16-40• 0% = $-1,296• 4% = $-608• 7% = $-363• 10% = $-226
• Replacement Value– $1,751
NPV (per Pistache, 7%)
-$1,500
-$1,000
-$500
$0
$500
$1,000
16 20 24 28 32 36 40
Benefit Cost Net Benefit

Replant With Plane in Shrub Bed

Cost-Effective to Remove and Replace Pistache?
• Removal and replacement costs– $150 remove, $125 plant = $275/tree– Remove & replace sidewalk/curb & gutter =
$1,176/tree • Reduced benefits from smaller trees• Increased air quality benefit (VOCs) • Reduced costs for tree care and sidewalk
repair• Greatest NPV of benefits

Expenditure per Replanted Plane - $1,876 (Yrs 16-40)
$0
$400
$800
$1,200
$1,600
16 20 24 28 32 36 40Plant/Water Prune Storm/Liability IPM/Other Sidewalk
Benefits and Costs for Replacing
Benefits per Replanted Plane- $2,870 (Yrs 16-40)
$0$20$40$60$80
$100$120$140$160
16 20 24 28 32 36 40Energy Air Quality CO2 Stormwater Aesthetics

Benefits and Costs for Replacing
Cumulative Benefits and Costs (per Plane)
-$2,000
-$1,000
$0
$1,000
$2,000
$3,000
16 20 24 28 32 36 40Costs Benefits Net Benefits

Cost-Effective to Remove Pistache and Replace?
• Net Present Value of Benefits per tree (Yrs 16-40)
• NPV Benefit (0%) – Retain Pistache
$-1,326– Replace w/ Plane $994
• NPV (7%)– Retain Pistache $-363– Replace w/Plane $-270
• Remove-Replace cost-effective at lower discount rates
Net Benefits for Pistache and Plane
-$1,500
-$1,000
-$500
$0
$500
$1,000
16 20 24 28 32 36 40Pistache Plane

Amount Saved With Optimal Layout for 40 Years
• NPV Benefits (0%)– Pistache $-783 – Plane $3,409
• Amount saved:– $4,192/tree
• Decision effects future value
Net Benefits Comparison (Pistache & Plane )
-$1,000
$0
$1,000
$2,000
$3,000
$4,000
0 5 10 15 20 25 30 35 40
Pistache Plane

Summary• Compare Current Value Pistache
– Replacement Value > Benefit-based• Future sidewalk repair costs
• Retain or Remove & Replace? – Depends on discount rate– Retain more cost-effective at higher
rates– Decision-support tool
• Amount Saved with Optimal Planting (40 yrs) – $4,192/tree

Benefit-Based Approach
• Considers future stream of costs & benefits
• Breaks out specific benefits• Unsuitable for tree appraisal now
– specific tree species, size, location, condition, longevity
• Principles can inform contribution and placement ratings
• Long-term implications of planting and management

Tree Effects Calculator• Enter Region • Enter Tree Data • Enter Site Data• Calculate Replacement Value• Calculate Value of Current
Benefits• Calculate Value of Future
Benefits

U&CF Tipping Point• New Leadership & Awareness
• At the Top• Grass Roots
• New Investment & Responsibility• Los Angeles• Sacramento: Energy & Air Quality• Green Streets & Carbon• Making it Pay!
• New Tools for Project Planning, Budgeting, & Monitoring

Street Tree Simulator
User Interface Design
DeVine Consulting
September 19, 2006
15 yrs
10 yrs
20 yrs
5 yrs
$50
$135
$265
RR=$600
Con
ditio
n
Tree Age

Global Inputs
Dropdown region
selection. This can be made a
graphical selection if necessary.
Button for importing data from STRATUM.

Adjust DBH Values
User enters boundaries between size class and checks
those that are considered large DBH
classes.
Buttons for adding and removing
inputs for additional size
classes.

Adjust Default LOS

Unit Cost Schedules
All program
areas included
on scrollable
(and resizable) window.

Mortality Curves
Dynamic graph displays Mortality
Curves with numeric values listed below. Infrastructure
Damage Curves will be represented
in a similar fashion.
Users can adjust Mortality Curves by species or use one
curve for all.

Navigation Detail
Additional navigation
detail.

Los Angeles One Million Trees Initiative Canopy Cover
Assessment• Study Goals
– Current tree canopy cover– Number and type of potential
tree planting sites– Value of ecosystem services
for 40 yrs • Final Products
– Report (results by city and council district)
– GIS database

Remote Sensing and GIS Data
• QuickBird Imagery (2002-2005) • Digital Aerial Imagery (2000 & 2006)• Digital Land Use Maps• Base Maps
– Council districts & Neighborhoods– Census data– Highways, major streets

Method for Existing Canopy
• Masking– Mountains
• Classification– Non-vegetation
(paving, buildings, rock, water)
– Vegetation• Tree/shrub• Irrigated turf• Un-irrigated grass/herbs
• Accuracy Assessment (9% overestimate)
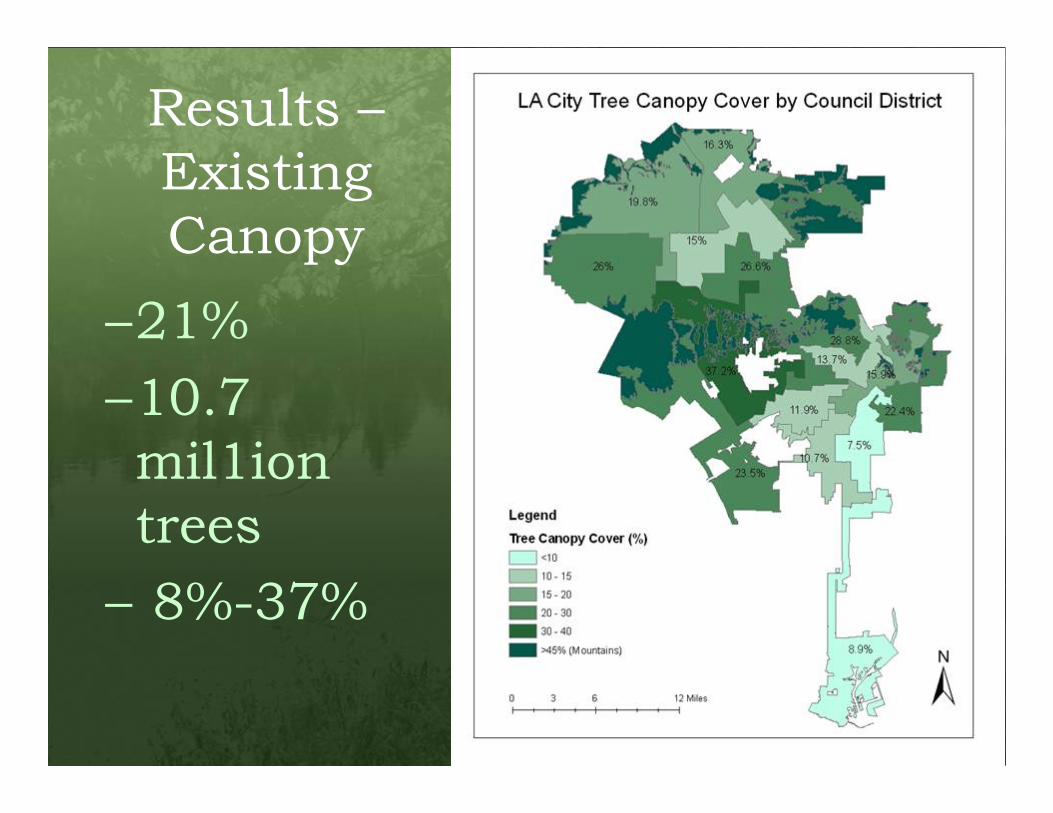
Results –Existing Canopy
–21%–10.7 mil1ion trees
– 8%-37%

Results – Existing Canopy
Existing Tree Canopy Cover by Council District
0.0%
5.0%
10.0%
15.0%
20.0%
25.0%
30.0%
35.0%
40.0%
Ed P. R
eyes
Wendy G
reuel
Dennis
P. Z
ineTom
LaBon
geJa
ck W
eiss
Tony C
ardena
sAlex
Pad
illaBern
ard C
. Park
sJa
n Perr
y
Herb J.
Wes
son,
Jr.Bill
Rosen
dahl
Greig S
mithEric
Garc
etti
Jose
Huiz
arJa
nice H
ahn
City

Method for Potential TCC• Potential Tree Canopy Cover
– Grass area without tree canopy– Tree trunk 2-ft min from paving & building– Tree crowns don’t overlap– Largest stature trees first– Reiterate for each tree type
• Mature Tree Crown Diameters– 50 ft, 30 ft, 15 ft
• Large Parking Lots (Ind, Comm, Institutional)– Sample % area paved in each Council District by Land Use– Assume 25% TCC for Industrial (30’ Crown Diameter)– Assume 50% TCC for Others
• Accuracy Assessment– 50 sample plots– Ground Truthing
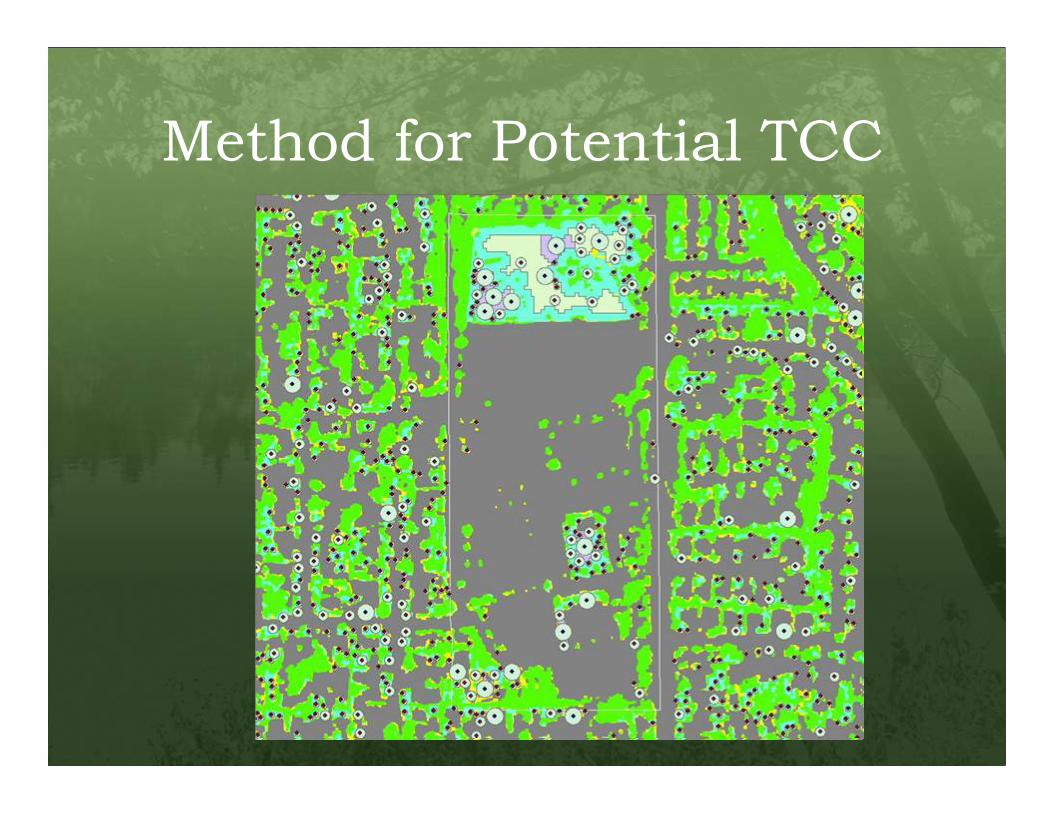
Method for Potential TCC

Ground-Truthing

Results –Potential Canopy
• 9.2% Citywide– 23,244 ac
• 2.7 million trees– 73% small– 20% medium– 7% large

Results –Potential
TCCExisting and Potential Tree Canopy Cover by Council District
0.0%5.0%
10.0%15.0%20.0%25.0%30.0%35.0%40.0%45.0%
Ed P. R
eyes
Wendy
Greu
elDen
nis P
. Zine
Tom La
Bonge
Jack
Weis
sTo
ny C
arden
asAlex
Pad
illa
Bernard
C. P
arks
Jan P
erry
Herb J.
Wes
son,
Jr.Bill R
osen
dahl
Greig S
mithEric
Garc
etti
Jose
Huiz
arJa
nice H
ahn City
ExTCC PoTCC

Project Future Benefits
Benefits from Planting 160 Trees in Hazard Park, Los Angeles
$0$10,000$20,000$30,000$40,000$50,000$60,000$70,000$80,000
0 5 10 15 20 25 30 35 40
Year after Planting
Energy CO2 Air Quality Runoff Aesthetics

GIS Decision Support System

GIS Decision Support System

Questions?


![01. Cambridge University Press,.Benefit-Cost Analysis - Financial and Economic Appraisal Using Spreadsheets.[2003.ISBN0521528984]](https://static.fdocuments.in/doc/165x107/557208d4497959fc0b8bd804/01-cambridge-university-pressbenefit-cost-analysis-financial-and-economic-appraisal-using-spreadsheets2003isbn0521528984.jpg)


