Beneficiation of Chipped and Shredded Woody … of Chipped and Shredded Woody Biomass USDA Bioenergy...
28
Beneficiation of Chipped and Shredded Woody Biomass USDA Bioenergy Feedstock Workshop – October 2011 Jim Dooley This presentation is based upon research and development that was supported in- part by the U.S. Department of Agriculture – NIFA - Small Business Innovation Research Program Contract No. 2009-33610-01114 Cleaning “dirty” biomass to produce quality feedstocks
Transcript of Beneficiation of Chipped and Shredded Woody … of Chipped and Shredded Woody Biomass USDA Bioenergy...

Beneficiation of Chipped and Shredded Woody Biomass
USDA Bioenergy Feedstock Workshop – October 2011
Jim Dooley
This presentation is based upon research and develo pment that was supported in-part by the U.S. Department of Agriculture – NIFA - S mall Business Innovation
Research Program Contract No. 2009-33610-01114
Cleaning “dirty” biomass to produce quality feedstocks
Agenda
• Forest Concepts – Supply Chain R&D• Woody Biomass Availability and Competition• Characterization of Low-Grade Woody Biomass• Pathways to Achieve User Specifications• Results and Discussion• Final Thoughts

Biomass Feedstock Quality Matters
• Ash content is a major issue for pellet fuel feedstocks• Soluble minerals (e.g. alkanes, iron oxide, calcium
carbonate, sodium, postassium, …) greatly reduce yield of biofuels due to catalytic reactions
• Particle size and surface-to-volume ratios affect reaction kinetics, drying rates, materials handling, …
• Quality can be improved by:– Anatomical fractionation (bark, leaves, …)– Cleaning to remove soil, gravel, metal, grit, …– Washing to reduce extractives– Size sorting– Comminution methods and equipment
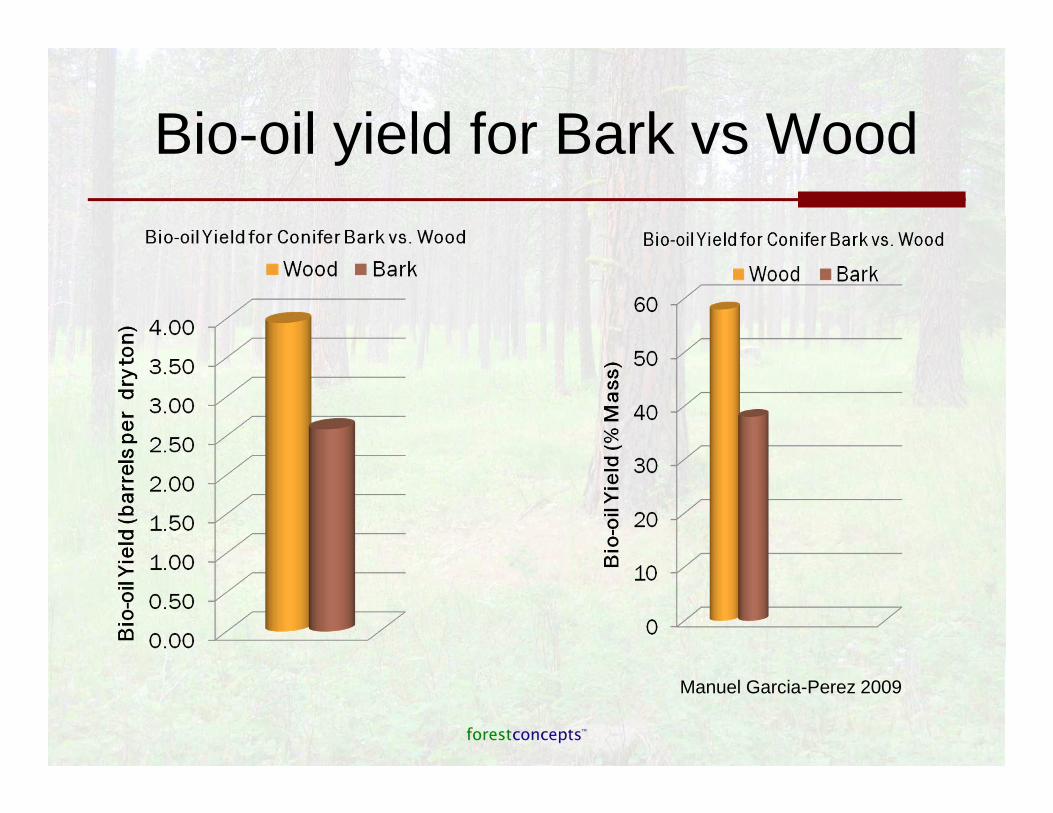
Bio-oil yield for Bark vs Wood
Manuel Garcia-Perez 2009
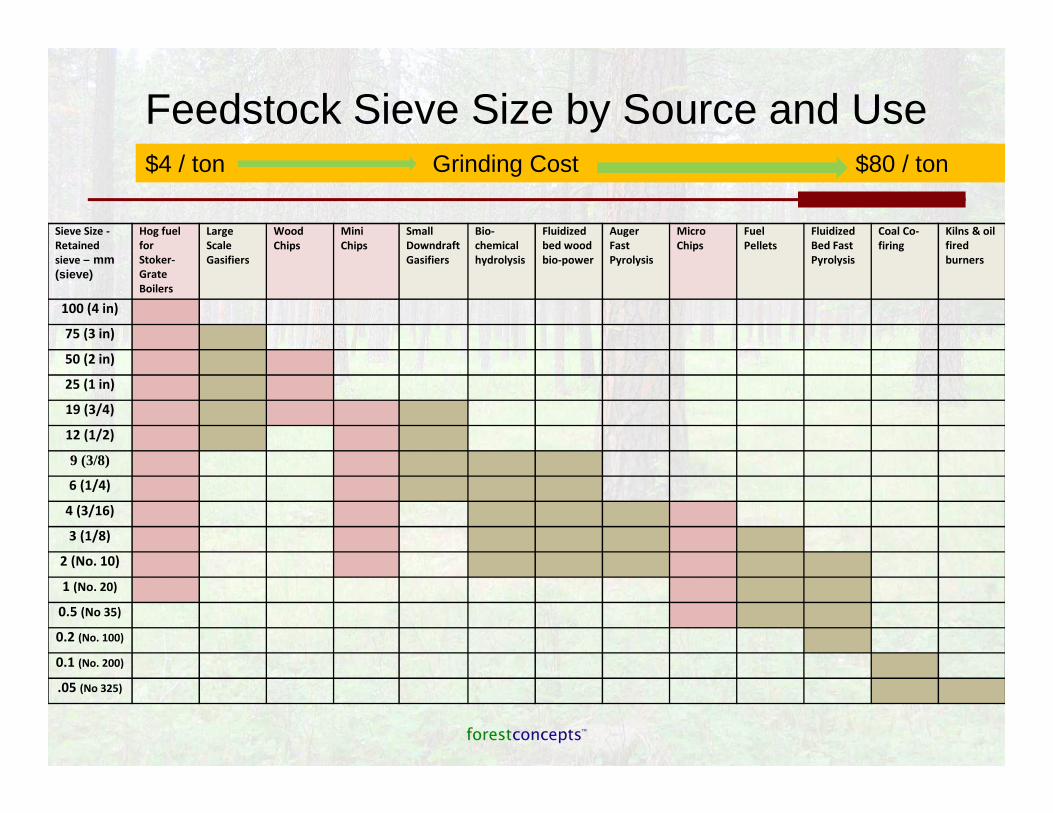
Feedstock Sieve Size by Source and Use
Sieve Size -
Retained
sieve – mm (sieve)
Hog fuel
for
Stoker-
Grate
Boilers
Large
Scale
Gasifiers
Wood
Chips
Mini
Chips
Small
Downdraft
Gasifiers
Bio-
chemical
hydrolysis
Fluidized
bed wood
bio-power
Auger
Fast
Pyrolysis
Micro
Chips
Fuel
Pellets
Fluidized
Bed Fast
Pyrolysis
Coal Co-
firing
Kilns & oil
fired
burners
100 (4 in)
75 (3 in)
50 (2 in)
25 (1 in)
19 (3/4)
12 (1/2)
9 (3/8)
6 (1/4)
4 (3/16)
3 (1/8)
2 (No. 10)
1 (No. 20)
0.5 (No 35)
0.2 (No. 100)
0.1 (No. 200)
.05 (No 325)
$4 / ton Grinding Cost $80 / ton
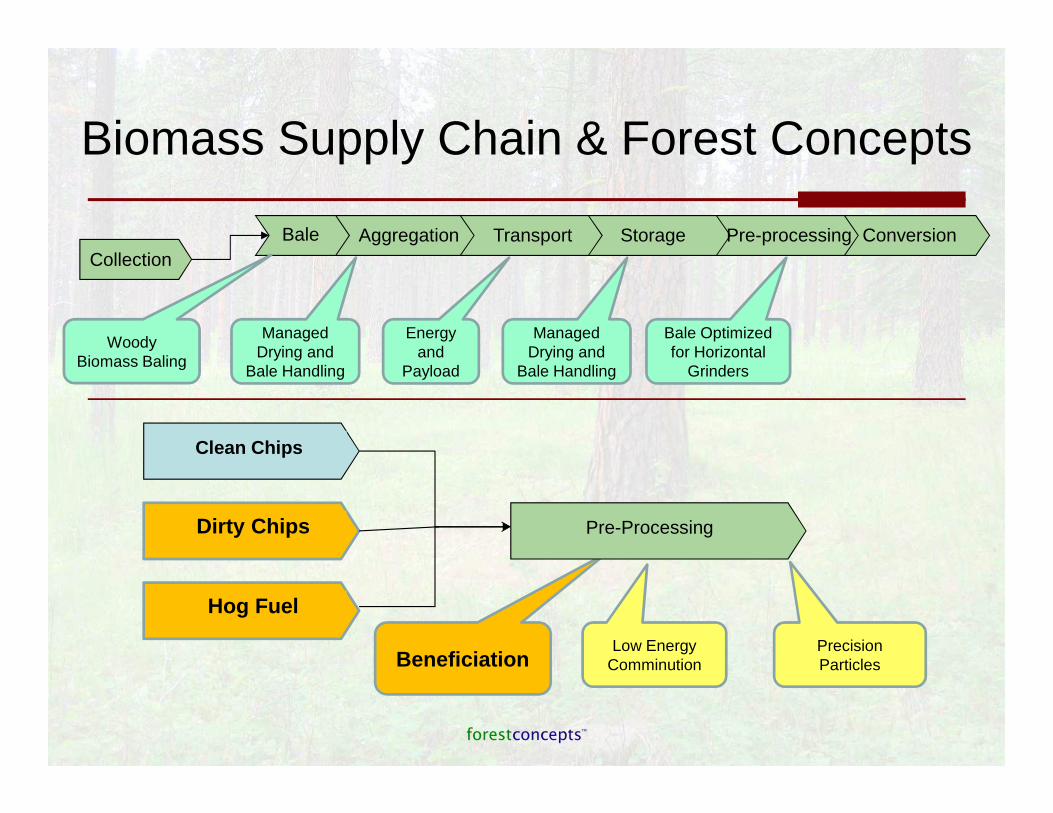
Biomass Supply Chain & Forest Concepts
CollectionAggregationBale Transport Storage Pre-processing Conversion
Energy and
Payload
Beneficiation
Pre-Processing
Low Energy Comminution
Precision Particles
Woody Biomass Baling
Clean Chips
Dirty Chips
Hog Fuel
Managed Drying and
Bale Handling
Bale Optimized for Horizontal
Grinders
Managed Drying and
Bale Handling

Bioenergy Science and Technology at Forest Concepts
Our Innovations –• Reduce the cost of collection, handling and transport for woody biomass
– Baled biomass is less expensive to make, store, and transport than chips
• Increase the volume of cost-effective cellulosic biomass in the market– Baled biomass can be handled and trucked just like other recyclables– Beneficiation and cleaning of low-grade and off-spec biomass
• Increase the yield of liquid transportation fuels– Feedstock cleaning and sorting improves conversion efficiency– Crumbles™ precision particles increase yield
• Increase the net energy of biofuels – Reducing energy consumption through the feedstock supply chain– Low energy comminution saves energy and provides more uniform particles– Reduced process time saves energy in the conversion facilities
• Reduce the capital and operational cost of conversion facilities– Crumbles™ precision particles reduce process time
• Enable competitive production of biofuels at smaller-scale facilities– Appropriate scale equipment designs– Scalable technologies based on sound science

Power Curve Distribution (aka Axtel Distribution) of Firms by Size
• Most industries in the developed world are comprised of a mix of very small to very large facilities.•In the dairy industry there are more than 50,000 of dairies with less than 100 cows and a only about 500 dairies with more than 2,000 cows according to USDA.•In the sawmill industry there are more than 2,000 sawmills with less than 10 employees and only 27 with more than 500 employees according to the US Census Bureau. •Sawmills and dairies are somewhat analogous to the emerging second generation biofuels industry.
Dooley 2011 Conceptual Distribution of Primary Biofuel Producers by Size – White Paper. Forest Concepts, LLC
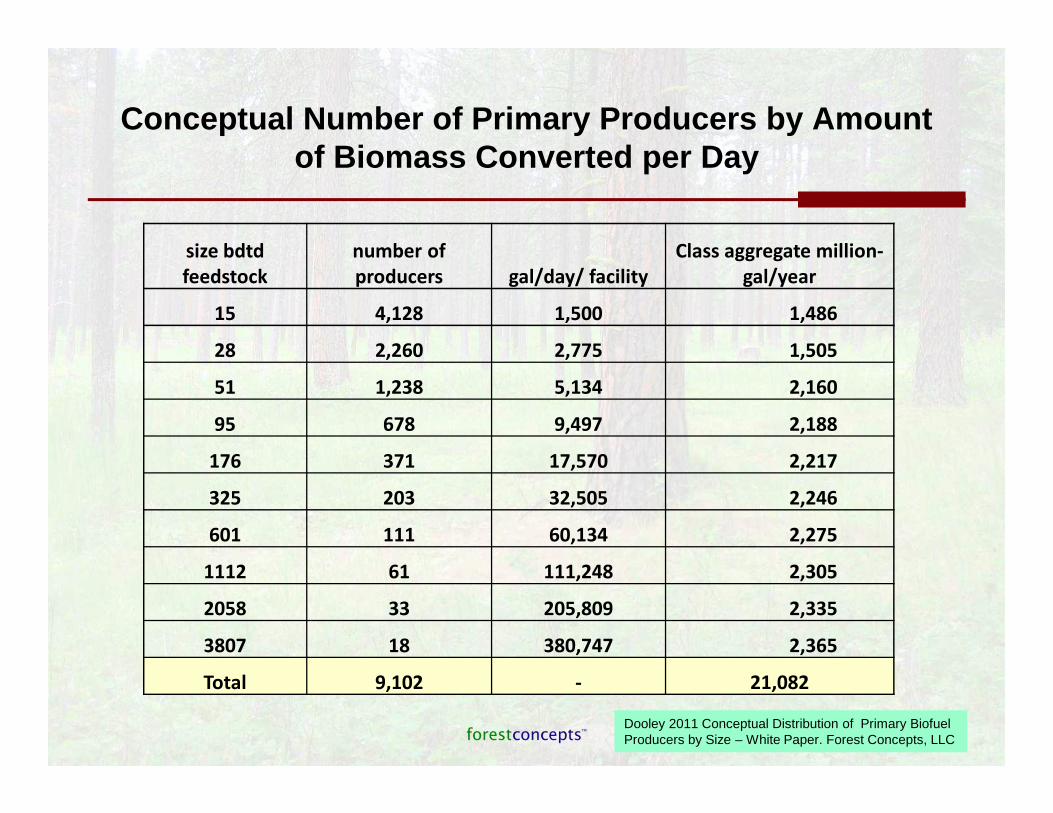
Conceptual Number of Primary Producers by Amount of Biomass Converted per Day
size bdtd
feedstock
number of
producers gal/day/ facility
Class aggregate million-
gal/year
15 4,128 1,500 1,486
28 2,260 2,775 1,505
51 1,238 5,134 2,160
95 678 9,497 2,188
176 371 17,570 2,217
325 203 32,505 2,246
601 111 60,134 2,275
1112 61 111,248 2,305
2058 33 205,809 2,335
3807 18 380,747 2,365
Total 9,102 - 21,082
Dooley 2011 Conceptual Distribution of Primary Biofuel Producers by Size – White Paper. Forest Concepts, LLC

Biomass Feedstock
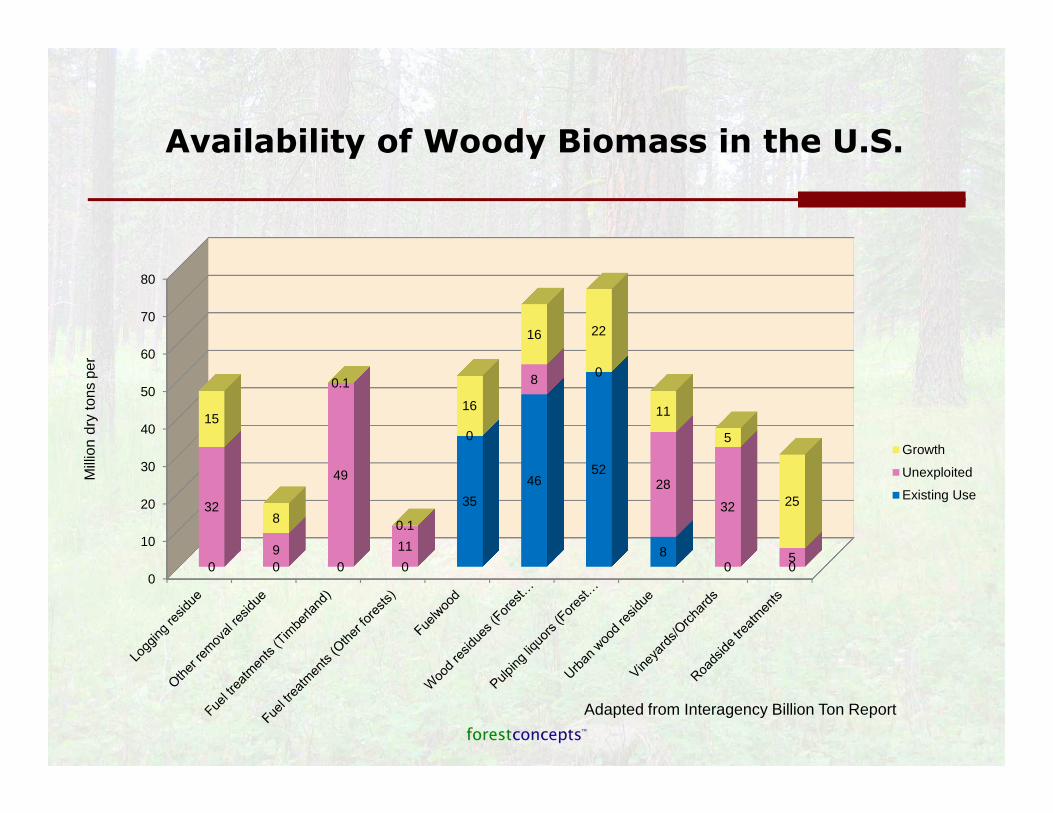
Availability of Woody Biomass in the U.S.
0
10
20
30
40
50
60
70
80
0 0 0 0
35
4652
80 0
32
9
49
11
0
8 0
28
32
5
15
8
0.1
0.1
16
16 22
11
5
25
Growth
Unexploited
Existing Use
Mill
ion
dry
tons
per
Adapted from Interagency Billion Ton Report
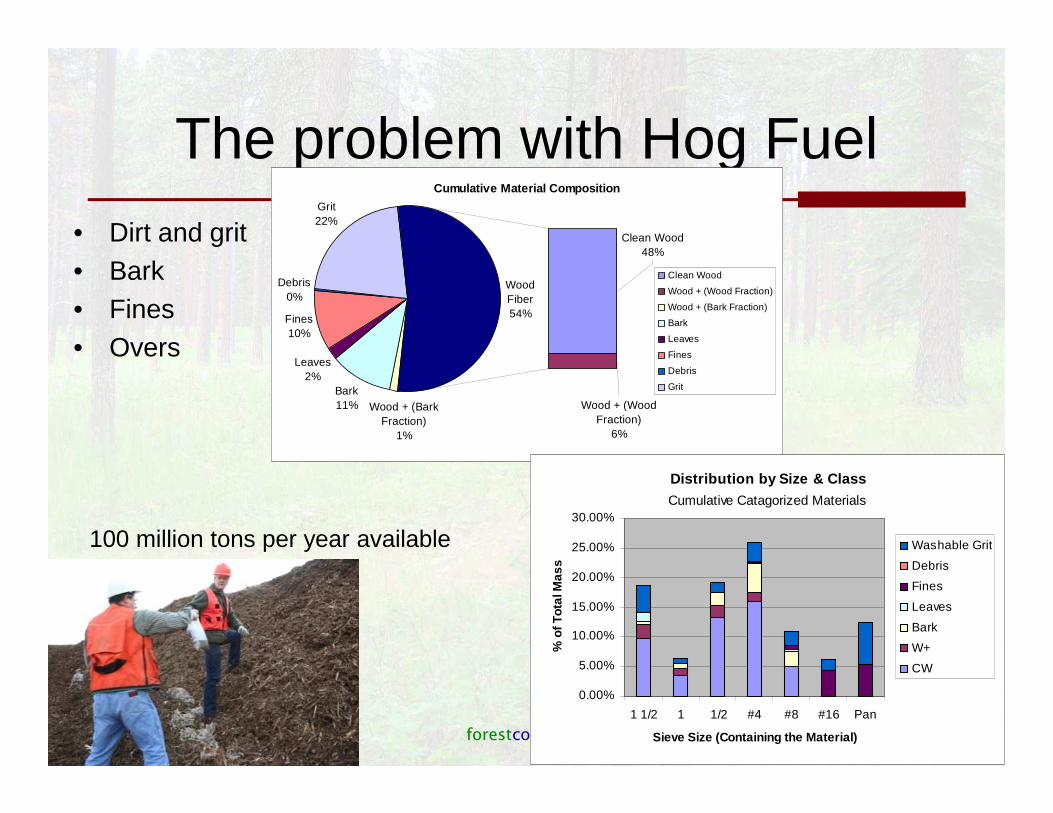
The problem with Hog Fuel• Dirt and grit• Bark• Fines• Overs
12/8/2011 12
Cumulative Material Composition
Bark11%
Leaves2%
Fines10%
Debris0%
Grit22%
Wood + (Wood Fraction)
6%
Clean Wood48%
WoodFiber54%
Wood + (Bark Fraction)
1%
Clean Wood
Wood + (Wood Fraction)
Wood + (Bark Fraction)
Bark
Leaves
Fines
Debris
Grit
Distribution by Size & Class
0.00%
5.00%
10.00%
15.00%
20.00%
25.00%
30.00%
1 1/2 1 1/2 #4 #8 #16 Pan
Sieve Size (Containing the Material)
% o
f Tot
al M
ass
Washable Grit
Debris
Fines
Leaves
Bark
W+
CW
Cumulative Catagorized Materials
100 million tons per year available
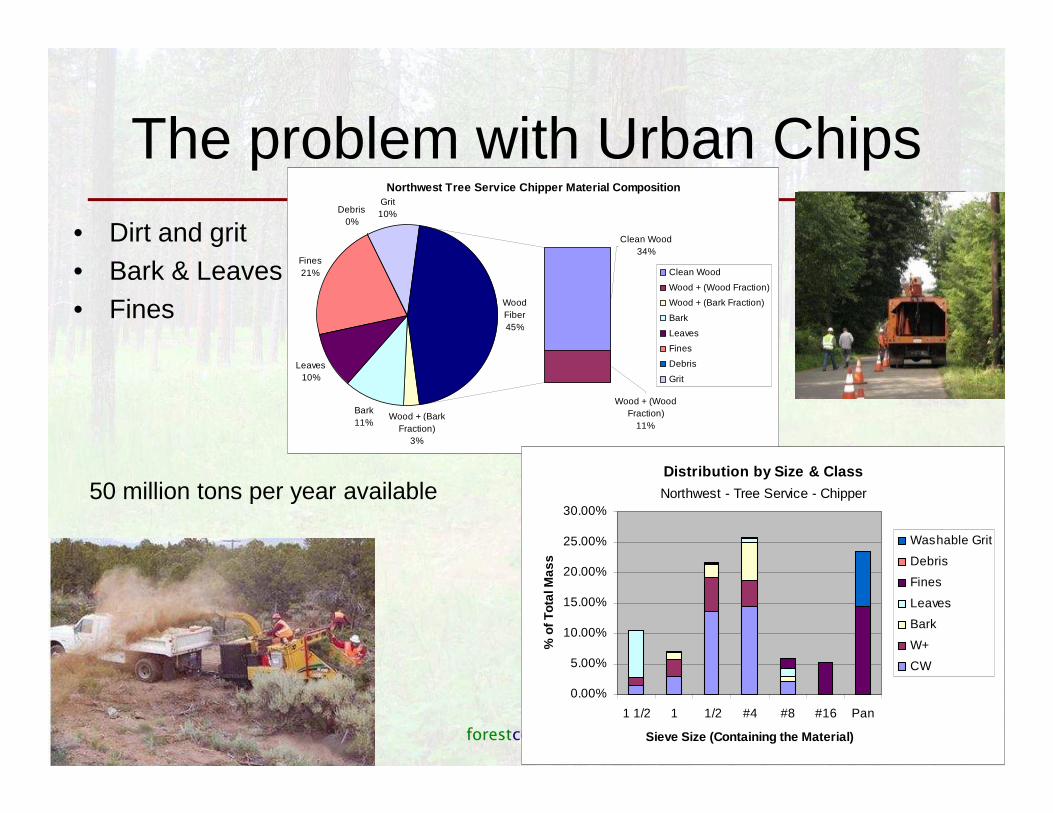
The problem with Urban Chips• Dirt and grit• Bark & Leaves• Fines
12/8/2011 13
50 million tons per year available
Northwest Tree Service Chipper Material Composition
Wood + (Bark Fraction)
3%
Bark11%
Leaves10%
Fines21%
Debris0%
Grit10%
WoodFiber45%
Wood + (Wood Fraction)
11%
Clean Wood34%
Clean Wood
Wood + (Wood Fraction)
Wood + (Bark Fraction)
Bark
Leaves
Fines
Debris
Grit
Distribution by Size & Class
0.00%
5.00%
10.00%
15.00%
20.00%
25.00%
30.00%
1 1/2 1 1/2 #4 #8 #16 Pan
Sieve Size (Containing the Material)
% o
f Tot
al M
ass
Washable Grit
Debris
Fines
Leaves
Bark
W+
CW
Northwest - Tree Service - Chipper

Woody Biomass BeneficiationUSDA SBIR Objective:
Increase the supply of wood fiber to reduce conflicts and competition for traditional mill residuals – This was 3 years before BCAP!
Develop technologies to reprocess hog fuel and urban chips into fractions suitable to replace traditional mill residuals– Reduce bark content to 1, 3, or 6 % targets– Deliver clean streams of wood and bark that meet
industry sector standards for ash and grit content

Ash Content of Clean Biomass Feedstocks
CHEMICAL CHARACTERISTICSheating value (gross,
unless specified; GJ/t)ash (%) sulfur (%) potassium (%) Ash melting
temperature [some ash sintering observed] (C)
corn stover 17.6 5.6sweet sorghum 15.4 5.5sugarcane bagasse 18.1 3.2-5.5 0.10-0.15 0.73-0.97sugarcane leaves 17.4 7.7hardwood 20.5 0.45 0.009 0.04 [900]softwood 19.6 0.3 0.01hybrid poplar 19.0 0.5-1.5 0.03 0.3 1350bamboo 18.5-19.4 0.8-2.5 0.03-0.05 0.15-0.50switchgrass 18.3 4.5-5.8 0.12 1016miscanthus 17.1-19.4 1.5-4.5 0.1 0.37-1.12 1090 [600]Arundo donax 17.1 5-6 0.07
http://bioenergy.ornl.gov/papers/misc/biochar_factsheet.html
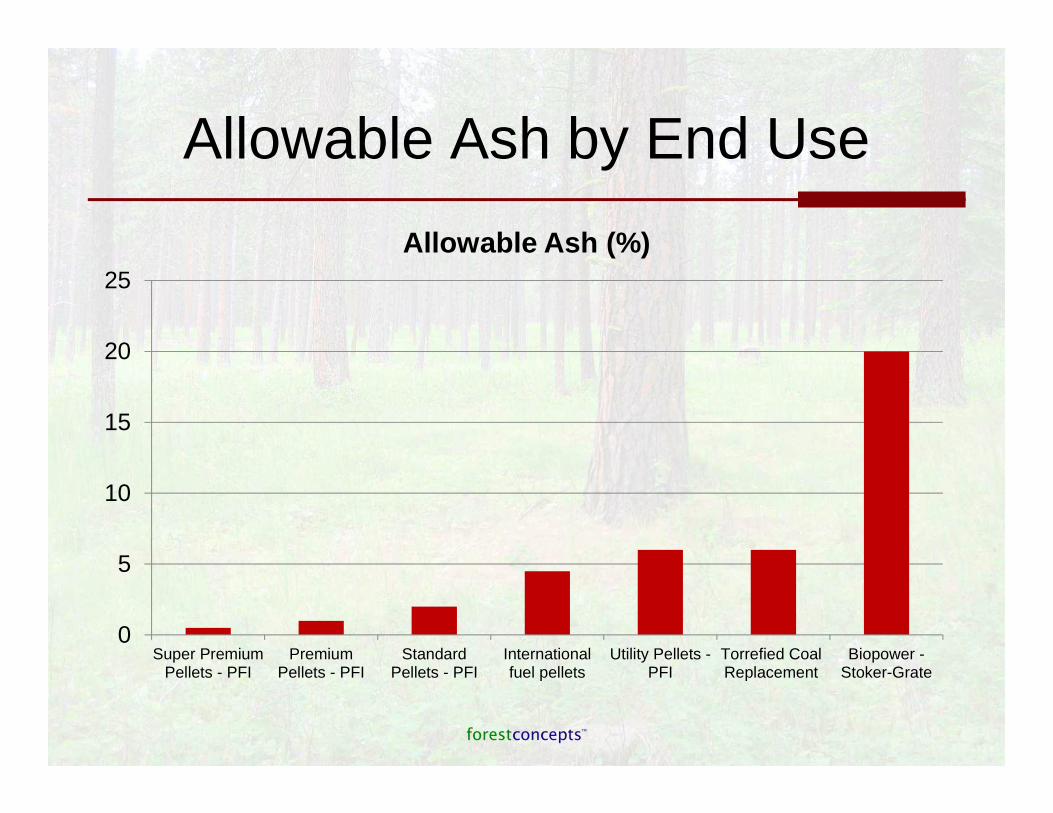
Allowable Ash by End Use
0
5
10
15
20
25
Super PremiumPellets - PFI
PremiumPellets - PFI
StandardPellets - PFI
Internationalfuel pellets
Utility Pellets -PFI
Torrefied CoalReplacement
Biopower -Stoker-Grate
Allowable Ash (%)

Ash Content by Sieve Fraction for Land Clearing Woody Biomass
Sample: 2011.07.12.001
Sieve ID
Opening
(mm)
Ash
Content
3 75.0 0.5%
1 1/2 37.5 0.56%
1 25.0 1.07%
1/2 12.5 1.21%
1/4 6.3 1.86%
1/8 3.2 14.21%
No. 16 0.7 20.82%
Pan 40.11%
0%10%20%30%40%50%60%70%80%90%
100%
0 10 20 30 40
Ash
Con
tent
(%
)
Sieve Opening (mm)
Land Clearing Woody Biomass
Note: Clean wood is ~ 0.3% ash
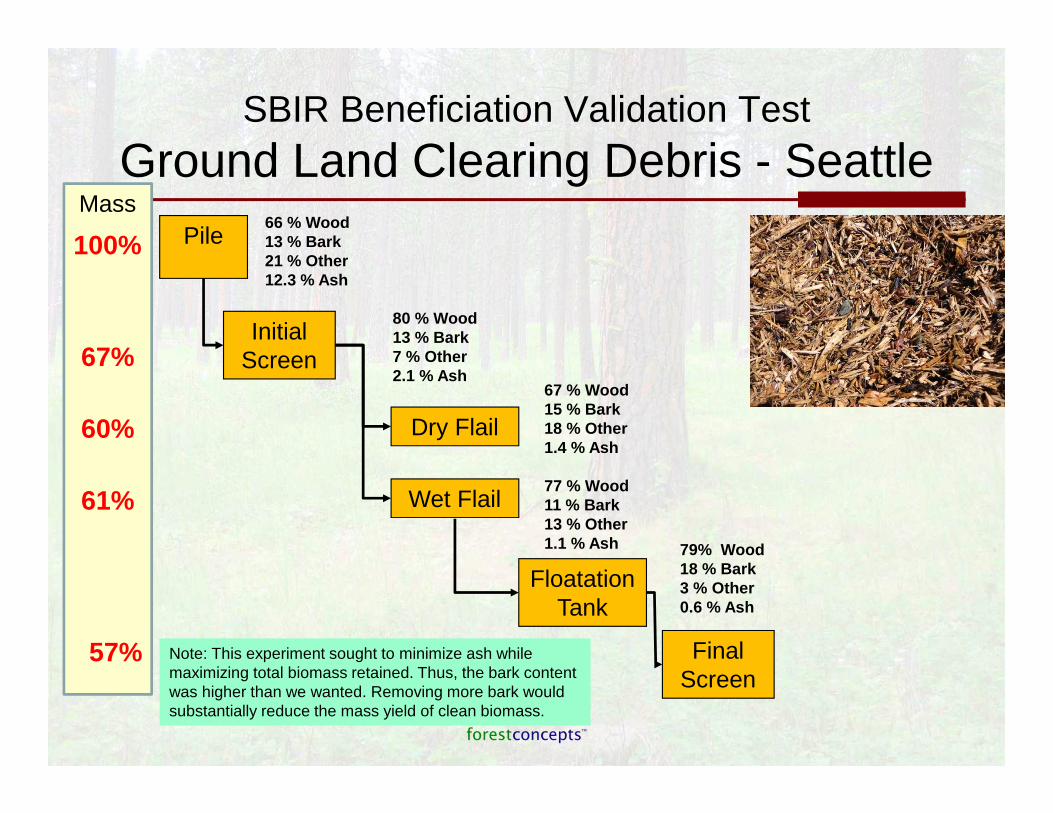
Pile
Dry Flail
Floatation Tank
Initial Screen
66 % Wood13 % Bark21 % Other12.3 % Ash
80 % Wood13 % Bark7 % Other2.1 % Ash
Wet Flail
Final Screen
67 % Wood15 % Bark18 % Other1.4 % Ash
77 % Wood11 % Bark13 % Other1.1 % Ash 79% Wood
18 % Bark3 % Other0.6 % Ash
100%
67%
60%
61%
Mass
57% Note: This experiment sought to minimize ash while maximizing total biomass retained. Thus, the bark content was higher than we wanted. Removing more bark would substantially reduce the mass yield of clean biomass.
SBIR Beneficiation Validation Test
Ground Land Clearing Debris - Seattle

Raw Material66 % Wood13 % Bark12.3 % Ash
After Wet Flail77 % Wood11 % Bark1.1 % Ash
Ground Land Clearing DebrisSample: 2011.07.12.001

Ash Content by Sieve Fraction for Clean Wood Chip Fuel – Olympic Region
Sample: 2011.07.14.001
Sieve ID
Opening
(mm)
Ash
Content
3 75.0 -
1 1/2 37.5 -
1 25.0 0.26%
1/2 12.5 0.24%
1/4 6.3 0.26%
1/8 3.2 0.3 4%
No. 16 0.7 0.34 %
Pan 2.93 %
Note: Clean wood is ~ 0.3% ash
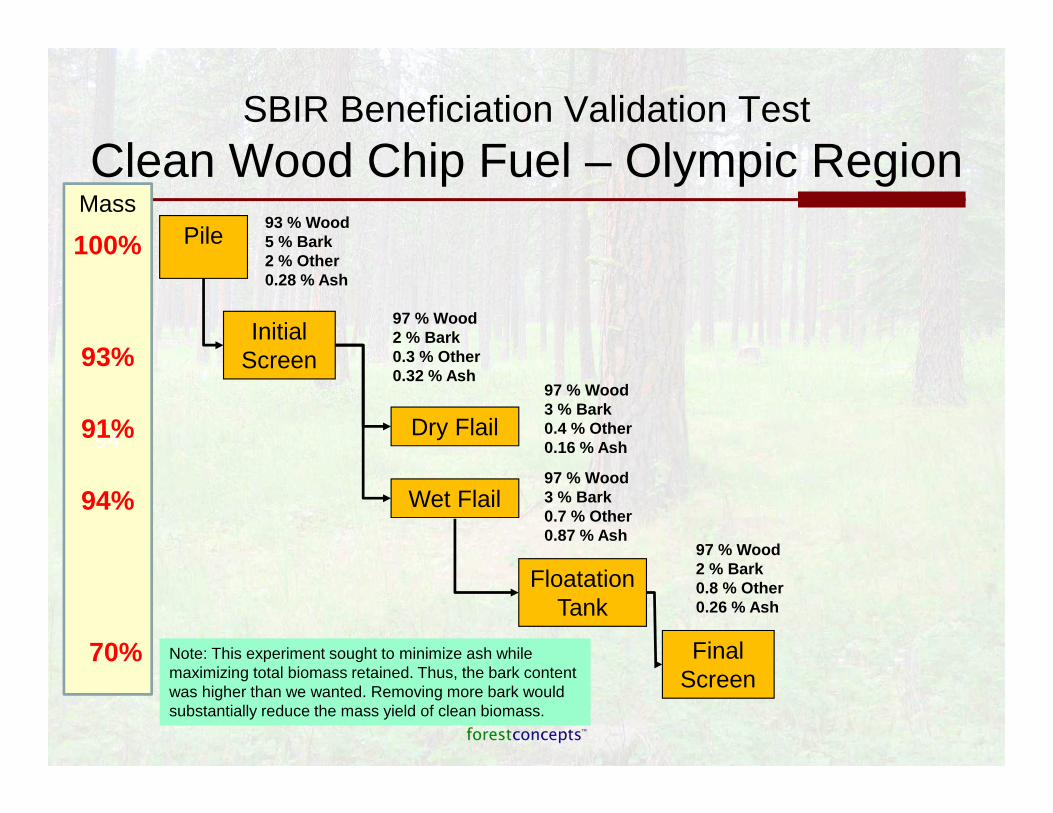
94
Pile
Dry Flail
Floatation Tank
Initial Screen
93 % Wood5 % Bark2 % Other0.28 % Ash
97 % Wood2 % Bark0.3 % Other0.32 % Ash
Wet Flail
Final Screen
97 % Wood3 % Bark0.4 % Other0.16 % Ash
97 % Wood3 % Bark0.7 % Other0.87 % Ash
97 % Wood2 % Bark0.8 % Other0.26 % Ash
100%
93%
91%
94%
Mass
70% Note: This experiment sought to minimize ash while maximizing total biomass retained. Thus, the bark content was higher than we wanted. Removing more bark would substantially reduce the mass yield of clean biomass.
SBIR Beneficiation Validation Test
Clean Wood Chip Fuel – Olympic Region

Ash Content by Sieve Fraction for Urban Arborist Chips – Auburn, WA
Sample: 2011.07.19.002
Sieve ID
Opening
(mm)
Ash
Content
3 75.0 -
1 1/2 37.5 -
1 25.0 -
1/2 12.5 1.9 %
1/4 6.3 2.8 %
1/8 3.2 3.8 %
No. 16 0.7 4.4 %
Pan 6.0 %
Note: Clean wood is ~ 0.3% ash
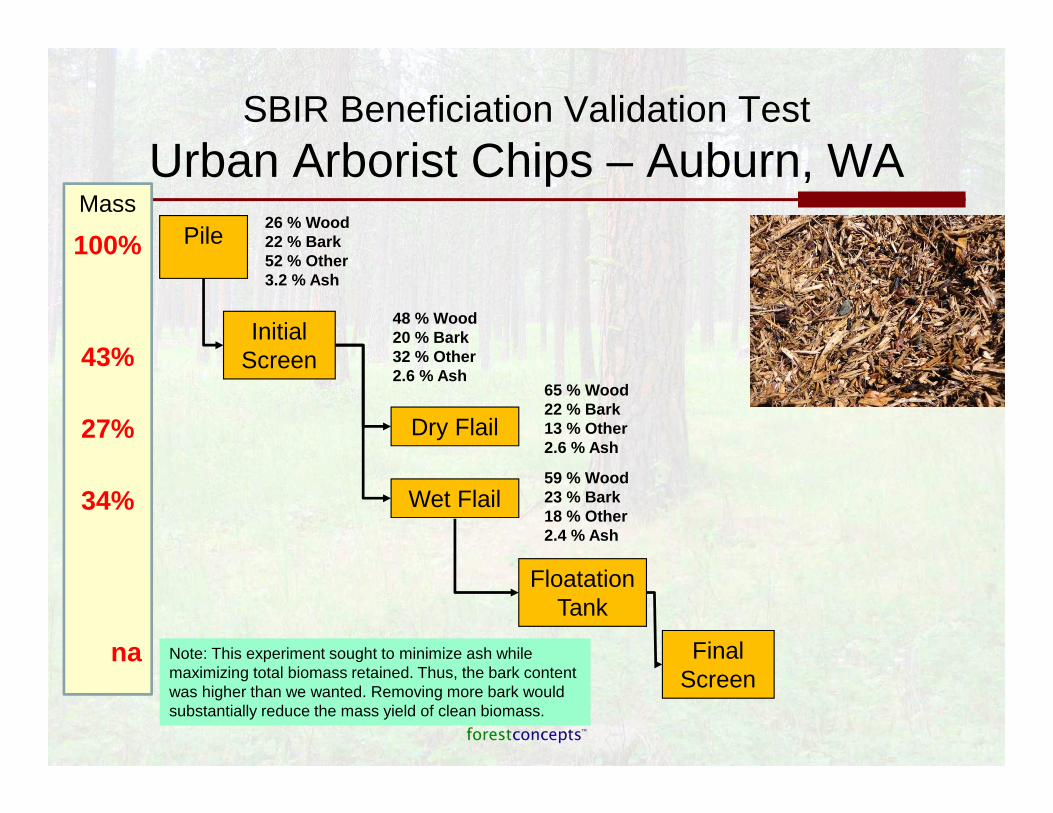
SBIR Beneficiation Validation Test
Urban Arborist Chips – Auburn, WAPile
Dry Flail
Floatation Tank
Initial Screen
26 % Wood22 % Bark52 % Other3.2 % Ash
48 % Wood20 % Bark32 % Other2.6 % Ash
Wet Flail
Final Screen
65 % Wood22 % Bark13 % Other2.6 % Ash
59 % Wood23 % Bark18 % Other2.4 % Ash
100%
43%
27%
34%
Mass
na Note: This experiment sought to minimize ash while maximizing total biomass retained. Thus, the bark content was higher than we wanted. Removing more bark would substantially reduce the mass yield of clean biomass.

Conclusions from Validation Tests
• Land Clearing Debris– Screening alone can often get the ash content below 3%– Dry or wet flail processing can further reduce ash to less than 1.5%– Bark content was not appreciably reduced – More work to be done!– Approx. 60% of mass could be redirected to fuel pellets or furnish
• Arborist Ponderosa Pine Chips– Screening and dry flail increased wood content from 26% to 65%– More than 65% of mass was removed by processing– Total ash remained approx. 2.5% throughout testing– This sample would be uneconomical to upgrade
• Fuel Chips– This material was very clean (0.3% ash) to begin with– Processing may reduce bark from 4.6% to 2.7%
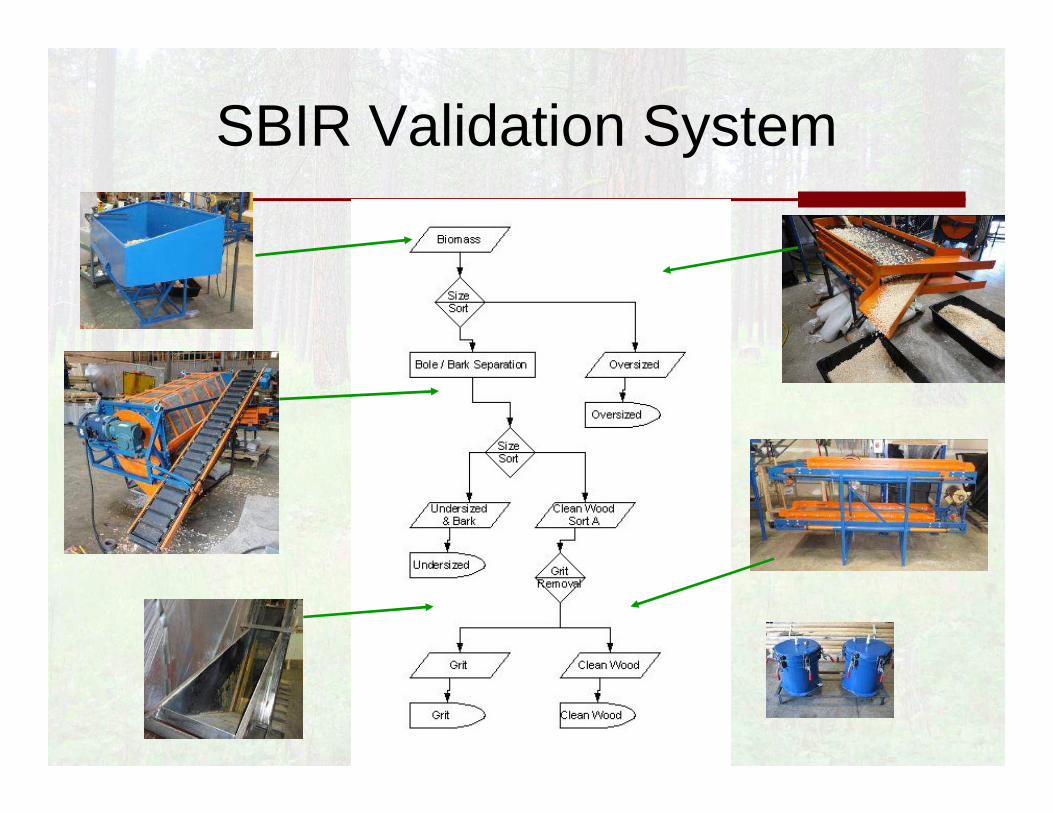
SBIR Validation System
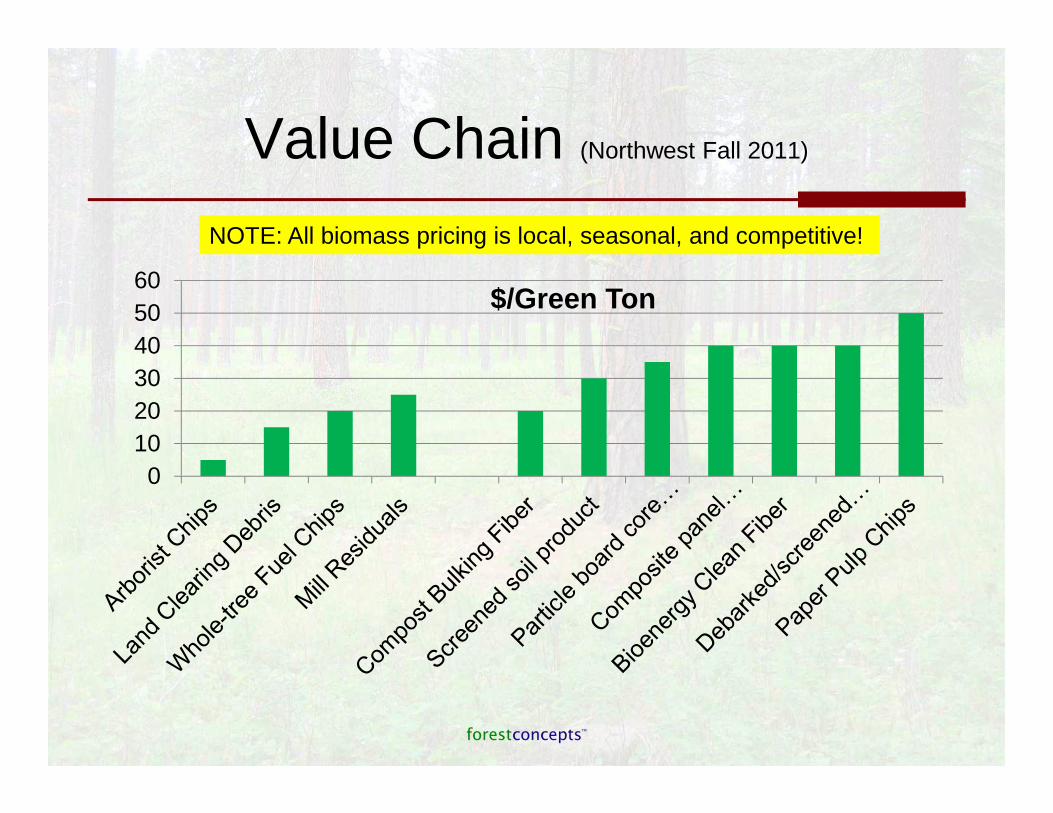
Value Chain (Northwest Fall 2011)
0102030405060
$/Green Ton
NOTE: All biomass pricing is local, seasonal, and competitive!
Final Thoughts
• Most woody biomass does not meet user needs for dirt, ash, bark, and rocks
• Beneficiation can occur at producer, depot/aggregator, or user
• Cost is a function of the degree of cleaning needed
• Methods are applicable to cane, corn, …• Forest Concepts’ demonstration scale portable
system is available for use – 1 bdt per hour
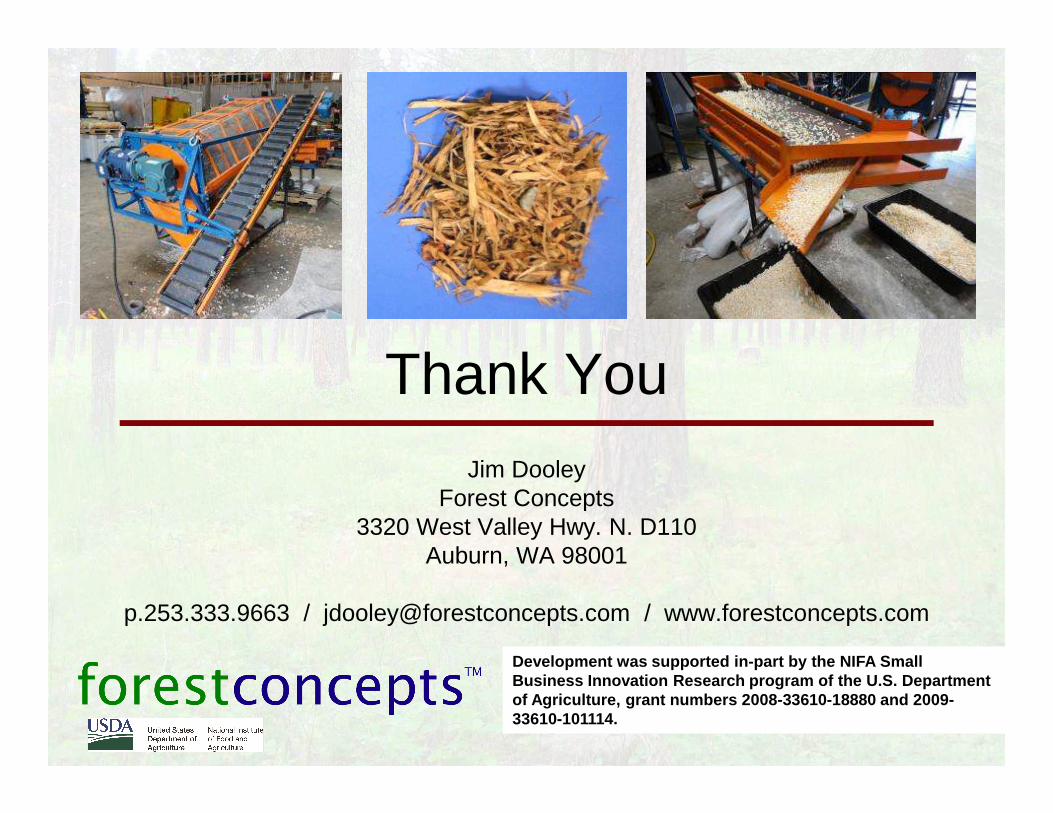
Thank YouJim Dooley
Forest Concepts3320 West Valley Hwy. N. D110
Auburn, WA 98001
p.253.333.9663 / [email protected] / www.forestconcepts.com
Development was supported in-part by the NIFA Small Business Innovation Research program of the U.S. De partment of Agriculture, grant numbers 2008-33610-18880 and 2009-33610-101114.