Benchmarking/Cost Savings Justified by Asset Management · “enchmarking/ost Savings Justified by...
17
“Benchmarking/Cost Savings Justified by Asset Management” Scott Haskins, Sr VP and Director of Strategic Consulting, CH2M Craig Edlund, Director of Asset Management, Metropolitan Council Environmental Services 2017 Water Asset Management Conference
Transcript of Benchmarking/Cost Savings Justified by Asset Management · “enchmarking/ost Savings Justified by...

“Benchmarking/Cost Savings Justified by Asset Management”
Scott Haskins, Sr VP and Director of Strategic Consulting, CH2M
Craig Edlund, Director of Asset Management, Metropolitan Council Environmental Services
2017 Water Asset Management Conference

Organizational Process Benchmarking
Enabling Business and Customer Value through better Asset Management
World’s largest process benchmarking project (44 participants/cross
industry), mapping to ISO 55000 and EUM:
An asset/utility management maturity assessment
Understanding of leading-edge practice across the lifecycle
Peer networks with other organisations internationally

Global Benchmarking Participation MCV Participants
1
2
27
3
9
2Toho
Portland Water
DC Water
MCES
Albuquerque
Rancho (California)
Montgomery County (Ohio)
Region of Peel
Region of York
Los Angeles Sanitation District
Vancouver, Washington
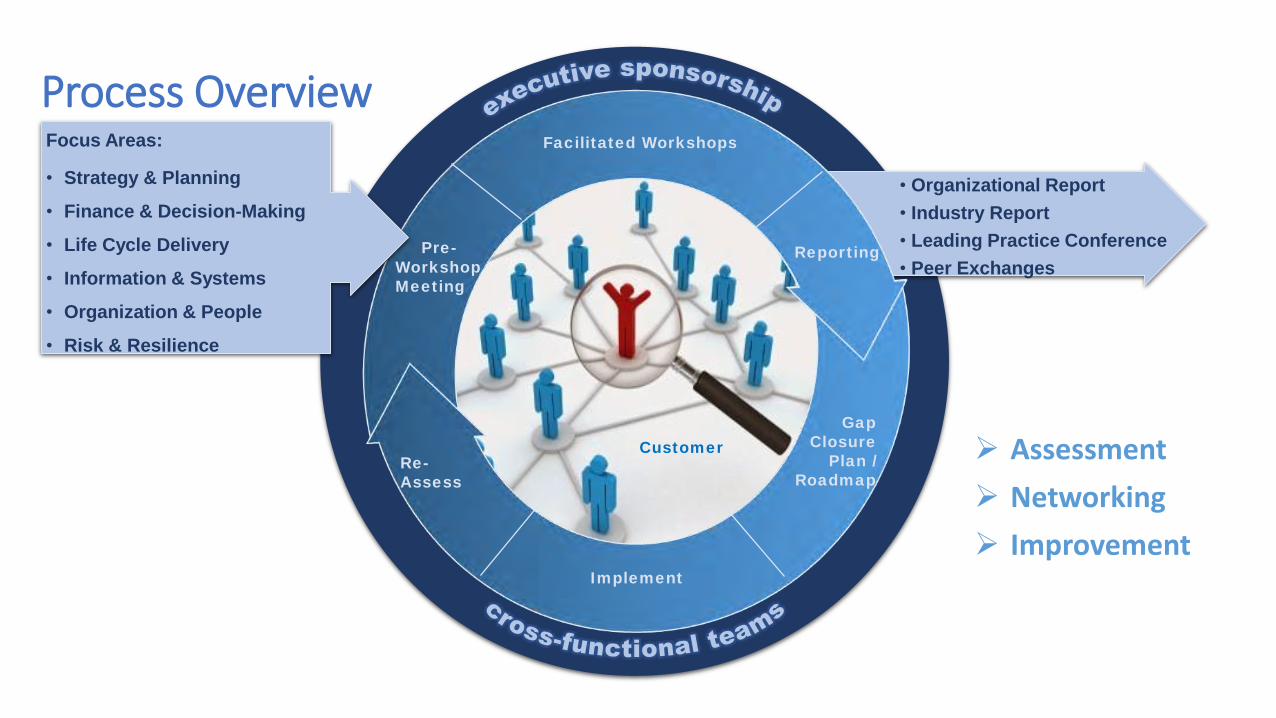
Facilitated Workshops
Pre-
Workshop
Meeting
Reporting
Gap
Closure
Plan /
Roadmap
Implement
Re-
Assess
Customer
Focus Areas:
• Strategy & Planning
• Finance & Decision-Making
• Life Cycle Delivery
• Information & Systems
• Organization & People
• Risk & Resilience
Process Overview
Assessment
Networking
Improvement
• Organizational Report
• Industry Report
• Leading Practice Conference
• Peer Exchanges
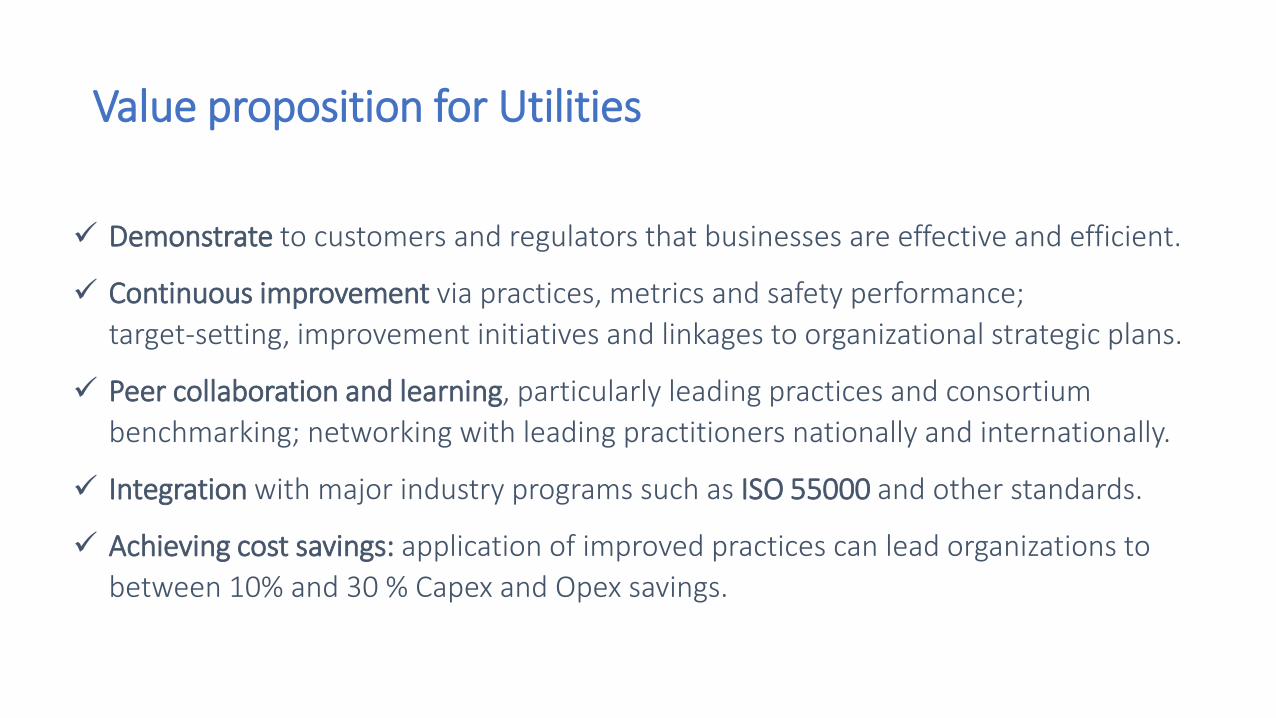
Value proposition for Utilities
Demonstrate to customers and regulators that businesses are effective and efficient.
Continuous improvement via practices, metrics and safety performance;
target-setting, improvement initiatives and linkages to organizational strategic plans.
Peer collaboration and learning, particularly leading practices and consortium
benchmarking; networking with leading practitioners nationally and internationally.
Integration with major industry programs such as ISO 55000 and other standards.
Achieving cost savings: application of improved practices can lead organizations to
between 10% and 30 % Capex and Opex savings.

Details of the assessment structure
• Designed to examine the process capability and execution which underpins outcomes
• Evaluates business processes across 7 key functions
Organisational Management1
Asset
Capability
Planning
Asset
Acquisition
Asset
Operation
Asset
Maintenance
Asset
Replacement
Rehabilitation
Support Applications
2 3 4 5 6
7

Rigorous hierarchy of questions and scoring
49 Processes
203 Sub Processes
553 Measures
7 Functions

Example Results
Processes
Functions

Leading Practice Workshop• ActewAGL (Australia): Automating asset-specific plans and renewals timing
• Albuquerque Bernalillo County Water Utility Authority: Customer Engagement; Managing performance
• City of Vancouver, Washington: Operations and maintenance contracting; Using business case evaluations
• DC Water and Sewer Authority: Innovation program; Linking strategic planning to process improvement
• Los Angeles Sanitation: CIP development; One Water; Resource recovery management
• Metropolitan Council Environmental Services: Employee engagement; Integrated water planning
• Portland Water Bureau: Collaboration conduit; Managing the risk of asset failure
• Rancho California Water District: MyWaterTracker; Asset Management Plan (AMP) framework and AMP groundwater production wells
• Region of Peel: Drinking water quality management system; Policies, risk, strategy, strategic asset management plans
• Sydney Water: Operational optimization using BI and data analytics
• Toho Water Authority: Asset acquisition, testing and acceptance processes; Workforce management, processes and procedures
• Yarra Valley Water: Determination of acceptable levels of service to customers

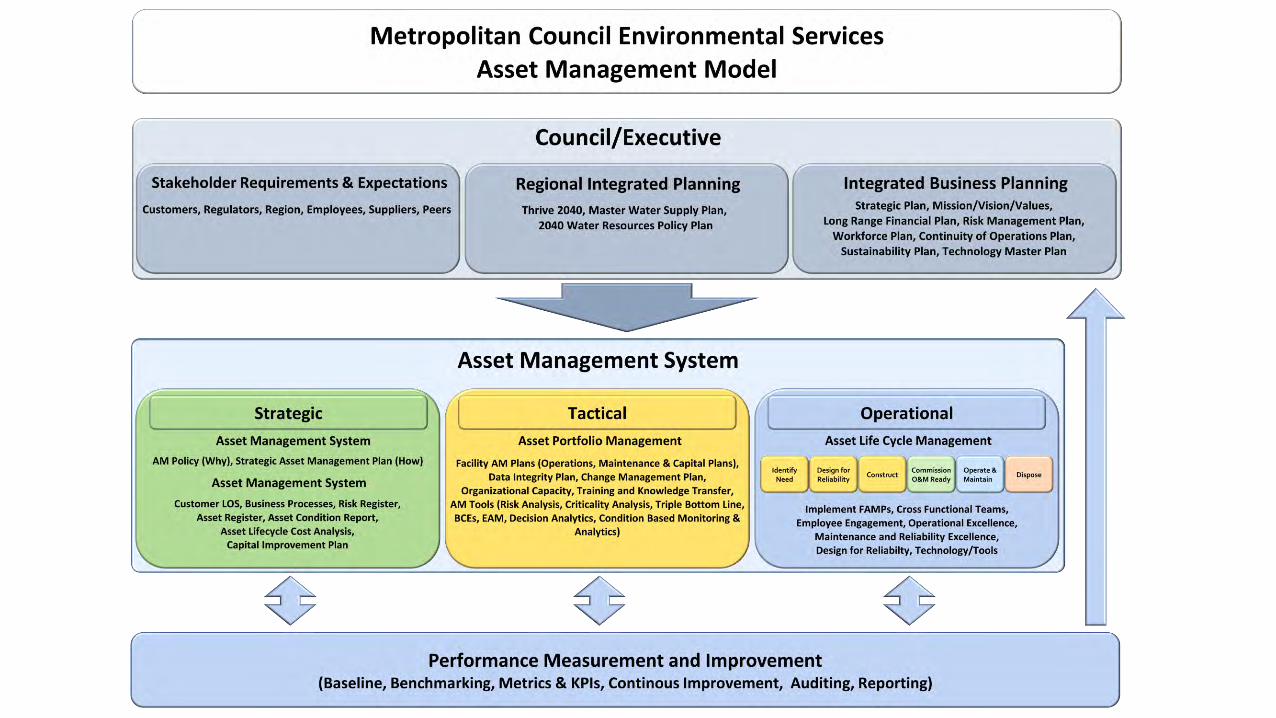
Metropolitan Council Environmental Services
MCES by the numbers
• 7 Wastewater treatment plants
• 1 Water Reclamation Plant (recharge)
• 370 MGD capacity (250mgd average)
• 109 communities/2.7 million residents
• 850 industrial customers
• Over 30K assets throughout the system*
• 600 miles of pipes (up to 14’ dia)
• 62 lift stations
• 206 metering sites
• $7.4 billion in infrastructure
• $140 million in capital renewal annually
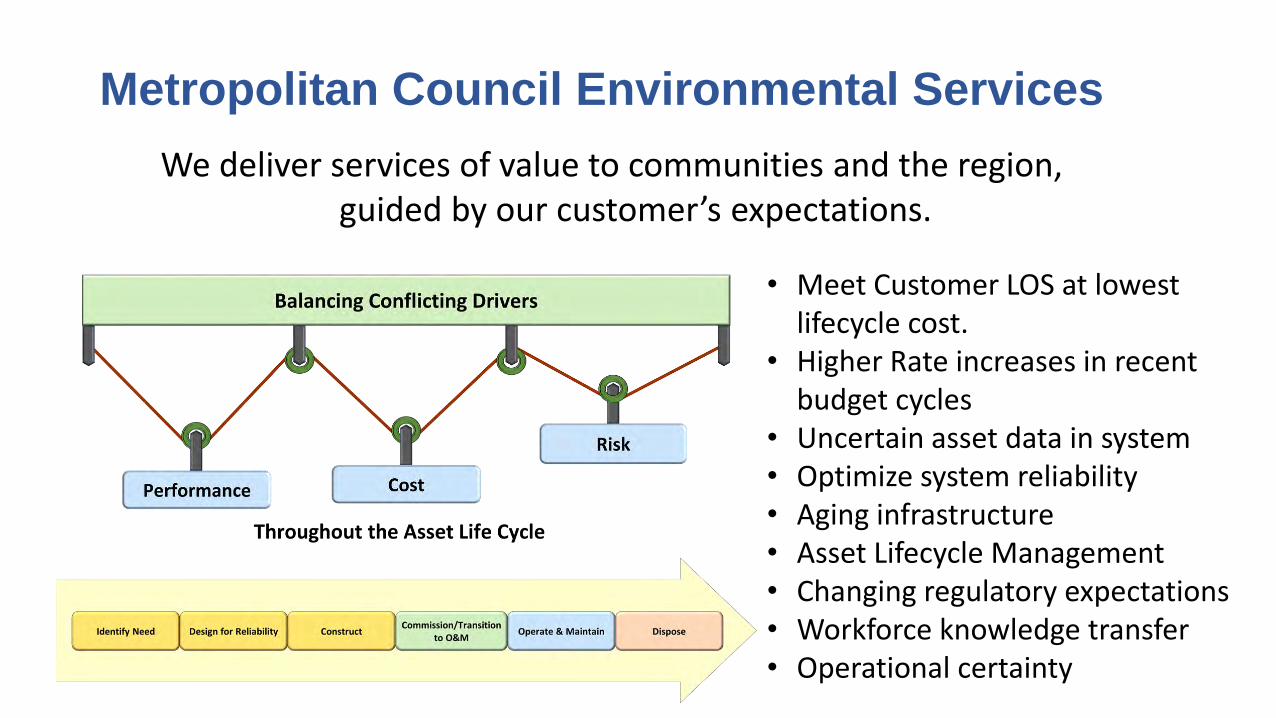
• Meet Customer LOS at lowest lifecycle cost.
• Higher Rate increases in recent budget cycles
• Uncertain asset data in system• Optimize system reliability• Aging infrastructure• Asset Lifecycle Management• Changing regulatory expectations• Workforce knowledge transfer• Operational certainty
We deliver services of value to communities and the region, guided by our customer’s expectations.
Metropolitan Council Environmental Services

AMCV ProjectComparative Benchmarking Areas

AMCV ProjectMCES WSAA Score
39%
OperationalManagement
1
45%
Asset Capability Planning
2
75%
Asset Acquisition
3
34%
Asset Operation
4
46%
Asset Maintenance
5
29%
Asset Renewal
6
59%
Support Applications
7
44%
Overall Score

AMCV ProjectRecommended Initiatives
Staff Developmentand Training
9
Asset ManagementPlans
5
CIP Developmentand Implementation
10
Technology Planningand Integration
6
Improved BusinessProcesses
11
PerformanceManagement
7
Risk Management
1
Customer LOS
2
Communications Plan
3
Data Analysis and Decision Making
4
Resource RequirementsAnd Allocation
8
Operational Efficiencyand Effectiveness
12

AMCV ProjectRecommended Initiatives Mapped to AM Roadmap

Cross Functional Benchmarking WinsClarity across the organization of business drivers and needs
AM Plan has Line of Sight and Alignment with Mission, Vision and Values
Cross functional collaboration embedding into our culture
Integrated Business Planning, not in separate silos
Implementing AM initiatives allowed accurate facility budgeting plans with a resulting < 4% rate increases over next 5 years.
Accurate asset lifecycle data = accurate capital renewal budgeting