Benchmarking with ENERGY STAR Portfolio Manager
60
Richmond Building Energy Challenge Benchmarking
Transcript of Benchmarking with ENERGY STAR Portfolio Manager

Richmond Building
Energy Challenge
Benchmarking

2
Agenda
• Why Energy Management?
• Why Benchmark Energy Use?
• Value of Portfolio Manager
• Features of Portfolio Manager Tool
• Using Portfolio Manager
• How the Richmond Building Energy Challenge Can Help

WHY ENERGY MANAGEMENT?

4
Context for Energy Management
• Financial benefits from a decrease in operating costs
– Hedge against energy cost volatility;
• General improvement in operating efficiency
• Improvement in stakeholder relations
• Mitigation of environmental impact
• Enhancement of the organization’s public image
• Improvement of the financial case for facility renewal
• And many others . . .

5
Assessing Your Need for an
Energy Management Strategy
The business opportunity?
Importance of energy to the organization?
Current use of energy and its cost relative to total operational cost?
Energy-related opportunities and their risks?
Alignment of energy management with organizational goals and image?
Legislation and compliance?
Other current organizational needs?
6
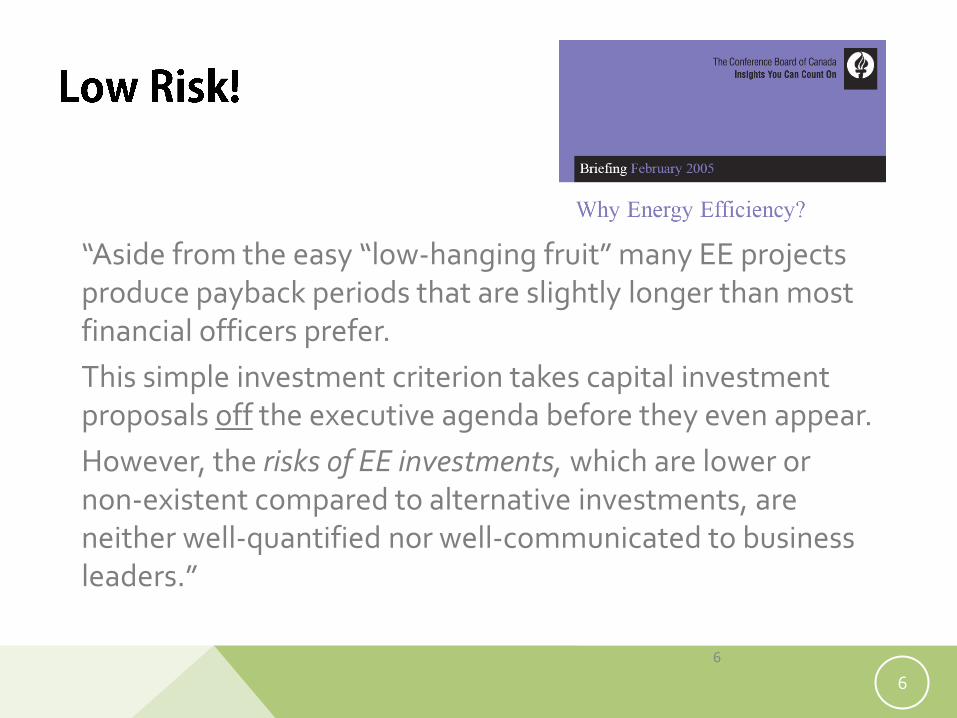
“Aside from the easy “low-hanging fruit” many EE projects produce payback periods that are slightly longer than most financial officers prefer.
This simple investment criterion takes capital investment proposals off the executive agenda before they even appear.
However, the risks of EE investments, which are lower or non-existent compared to alternative investments, are neither well-quantified nor well-communicated to business leaders.”
6

7

WHY BENCHMARK YOUR ENERGY
USE?

9
Benchmarking is…
• The process of comparing one’s performance metrics to better, best, median and historical performance
10
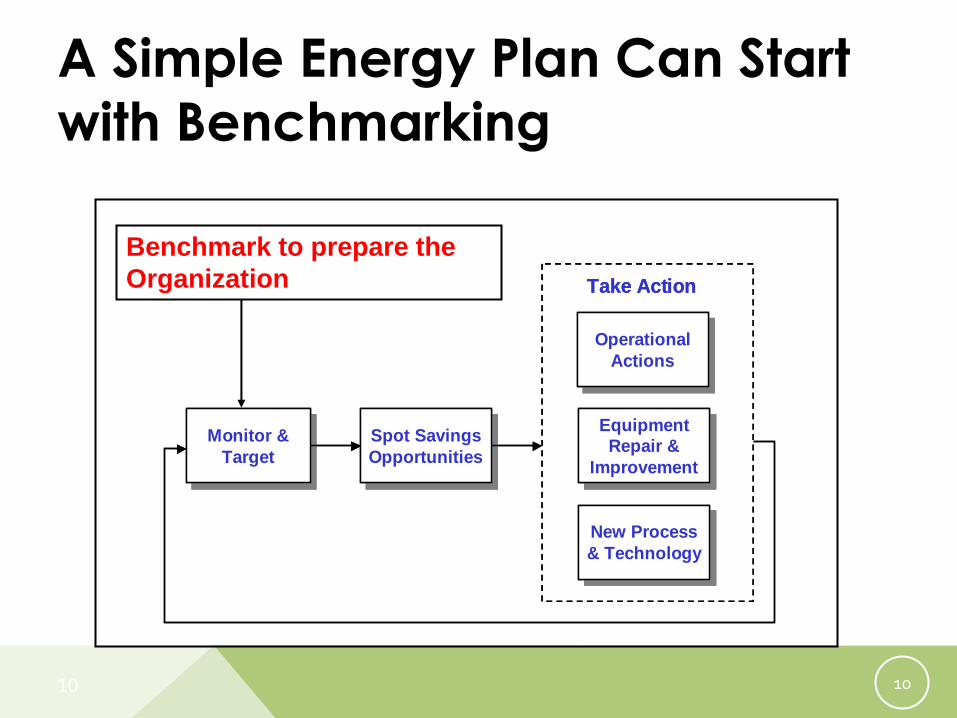
A Simple Energy Plan Can Start
with Benchmarking
Monitor &
Target
Monitor &
TargetSpot Savings
Opportunities
Spot Savings
Opportunities
New Process
& Technology
New Process
& Technology
Equipment Repair &
Improvement
Equipment Repair &
Improvement
Operational
Actions
Operational
Actions
Take Action
Monitor &
Target
Monitor &
TargetSpot Savings
Opportunities
Spot Savings
Opportunities
New Process
& Technology
New Process
& Technology
Equipment Repair &
Improvement
Equipment Repair &
Improvement
Operational
Actions
Operational
Actions
Take Action
Benchmark to prepare the
Organization
10

11
Using Benchmarking as a guide
to improvements
Measure
Analyze
Take Action
Data
Information
Result

12
Benchmarking leads to …
increased knowledge about how one’s building is performing
a desire to improve one’s performance through better practices
a dialogue/investigation of differences between buildings
the development of baselines and improvement targets
monitoring of all energy performance

13
BenchmarkingAn Energy Management Best Practice
• Energy Performance
– Consumption related to drivers
• Energy Practice
– Technical
– Operational
– Organization
• Better practices -> better performance
• Best practice -> best performance
14
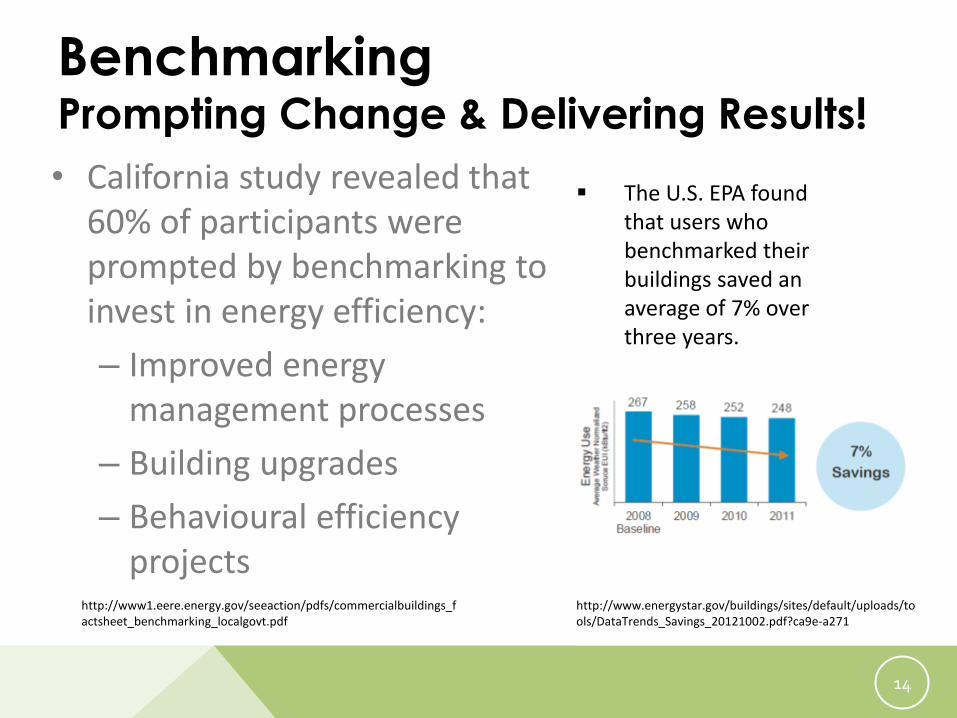
Benchmarking Prompting Change & Delivering Results!
• California study revealed that 60% of participants were prompted by benchmarking to invest in energy efficiency:
– Improved energy management processes
– Building upgrades
– Behavioural efficiency projects
http://www1.eere.energy.gov/seeaction/pdfs/commercialbuildings_factsheet_benchmarking_localgovt.pdf
http://www.energystar.gov/buildings/sites/default/uploads/tools/DataTrends_Savings_20121002.pdf?ca9e-a271
The U.S. EPA found that users who benchmarked their buildings saved an average of 7% over three years.

15
Clear Trends Linking Energy Efficiency to Profitability
“The results suggest that an otherwise identical commercial building with an Energy Star or LEED certification will rent for about three percent more per square foot; the difference in effective rent is estimated to be about six percent. The increment to the selling price may be as much as 13 percent.”
On The Economics of Green Buildings By Nils Kok, Visiting Scholar, UC Berkeley Assistant Professor, Maastricht University
http://corporate-sustainability.org/on_the_economics_of_green_buildings/
16
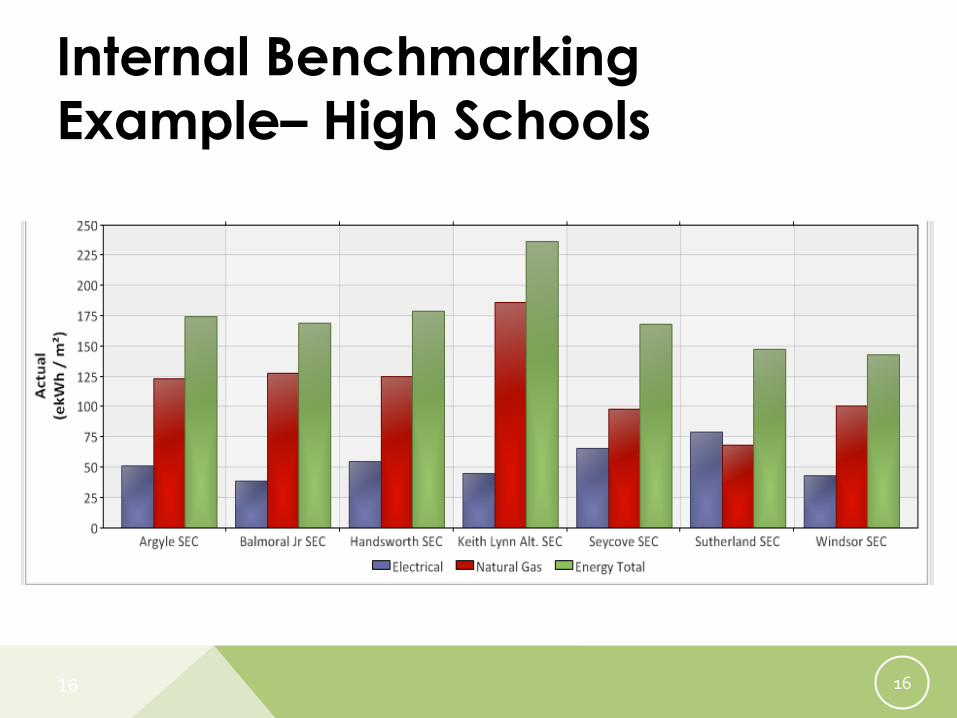
Internal Benchmarking
Example– High Schools
16

17
External Benchmarking Example–
High Schools

18

VALUE OF PORTFOLIO MANAGER

20
What is ENERGY STAR Portfolio
Manager? • Free, secure online tool where you can:
– Benchmark the energy use intensity (EUI) of all of your buildings; eligible buildings will receive ratings on a 1-100 scale
– Track changes in energy use over time in single buildings, groups of buildings, or entire portfolios
– Track cost savings and CO2 emissions
– Track water usage
• Based on U.S. ENERGY STAR methodology
• Run by NRCan (Natural Resources Canada)

21
Portfolio Manager... • Is based upon the proven strategic approach of benchmarking
as the first step to improving energy efficiency
• Is a cost management tool for business that treats energy as any other resource to be managed.
• Helps building owners and managers to strategically manage energy in individual buildings and across their entire building portfolios by offering guidance and tools to:
– assess energy performance,
– set reduction goals,
– track savings over time, and
– report performance improvement.

22
NRCan’s Role
• Natural Resources Canada is the gatekeeper for ENERGY STAR Portfolio Manager in Canada.
• For technical questions related to the tool, clients should consult with NRCan via [email protected]

23
Canadian Adaptation • Only national Canadian building energy use data survey
• Canadian factors for site and source energy and emissions calculations
• Bilingual interface – French and English
• Metric and imperial measurements
• 150+ Canadian weather stations – Auto mapped to the postal code of the building
• 1-100 ENERGY STAR performance scores for K-12 schools, commercial offices, hospitals & Food Retail
• other building types will be added over time

24
Categories of Buildings
• Portfolio Manager offers benchmarking for ->
• Adjusted for location and weather variances between locations and years
– Bank branch – Barracks – Courthouse – Data center – Distribution center – Financial office – Hospital (general medical & surgical) – Hotel – K-12 school – Medical office – Multifamily housing – Non-refrigerated warehouse – Office – Refrigerated warehouse – Residence hall/ dormitory – Retail store – Senior care community – Supermarket/grocery store – Wastewater treatment plant – Wholesale club/supercenter – Worship facility
25
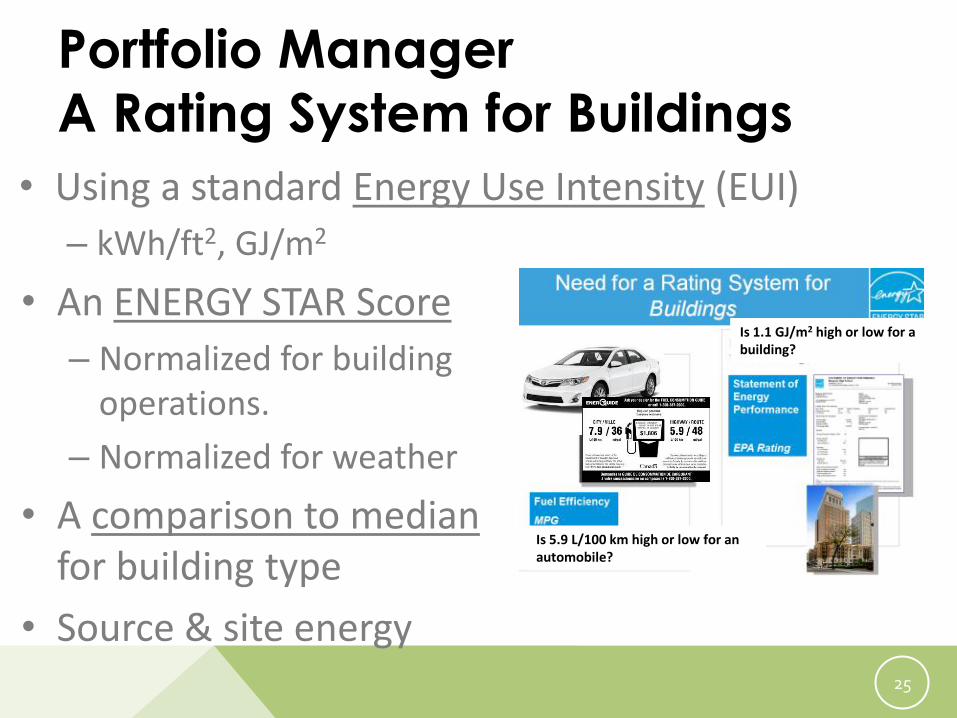
Portfolio Manager
A Rating System for Buildings
• Using a standard Energy Use Intensity (EUI)
– kWh/ft2, GJ/m2
Is 5.9 L/100 km high or low for an automobile?
Is 1.1 GJ/m2 high or low for a building?
• An ENERGY STAR Score
– Normalized for building operations.
– Normalized for weather
• A comparison to median for building type
• Source & site energy

26
Why Use Portfolio Manager • Universal tool – widely understood and accepted
– Robust normalization for building conditions – Draws from an extensive energy use database – Based on source energy to account for the true impact of
energy use, starting from generation and transmission • Ability to share data/scores • Easy input and output of data
– Data is not captive – Easy interface to other software – Data can be uploaded automatically through web services
• Complementary to RETScreen® Plus and other tools E.g.: – Portfolio Manager for benchmarking and year-over-year
comparisons – RETScreen Plus for detailed monitoring & verification

27
Additional Portfolio Manager
Features • Shareability
– Permit/control others’ access for in/outputs • Including energy suppliers to upload your data
– Account can be shared with the City of Richmond’s Energy coaches to assist with benchmarking
• Downloadable templates (with easy instructions) – Additional property details – Energy use and cost data – Report customization
• NRCan webinars and technical support

28

FEATURES OF PORTFOLIO
MANAGER
30
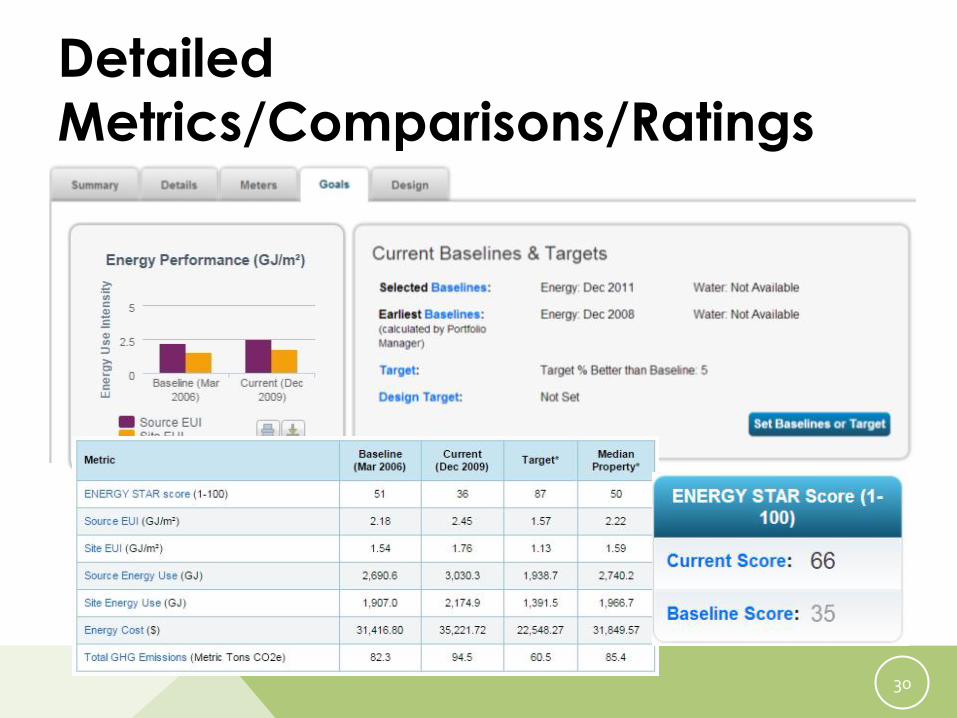
Detailed
Metrics/Comparisons/Ratings

31
Numerous Reporting
Possibilities…
32
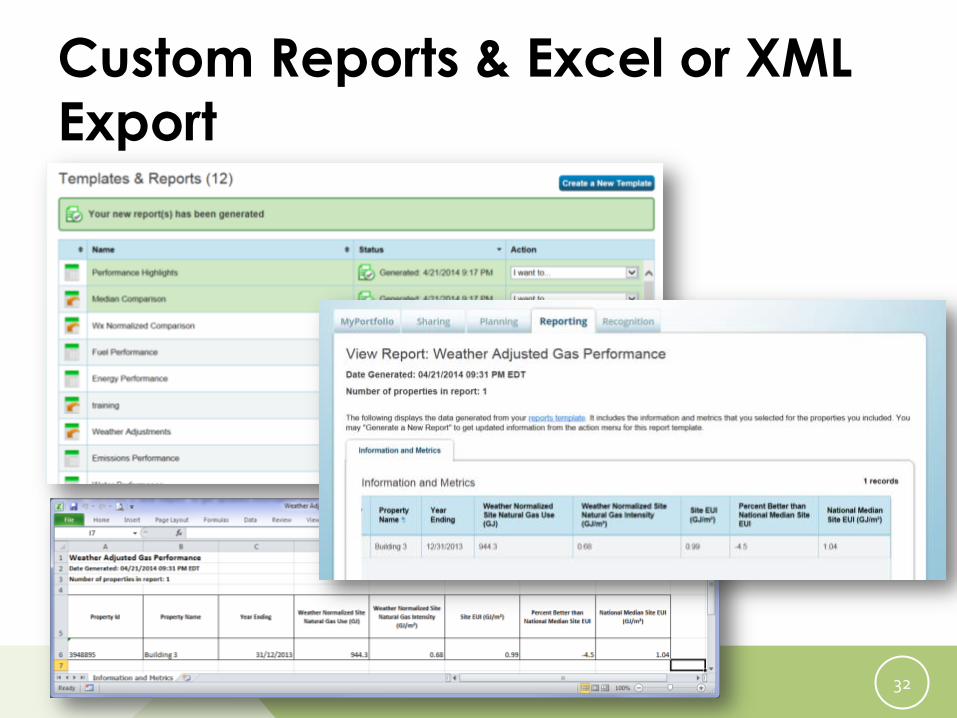
Custom Reports & Excel or XML
Export

33
Sustainable Building Checklist
“Sustainable Practice Benchmarking”
Correlate performance to practice across a building portfolio!

34
Portfolio Manager - Monitoring Tool
35
ENERGY STAR Performance
Score for Canadian Buildings • 1-100 score for K-12 schools, hospitals and commercial
office buildings – Scores will be available on a progressive basis, other
building types will be added over time
• Energy performance scores are based on the 2009, Survey of Commercial and Institutional Energy Use (SCIEU)
• Median energy use intensity values (EUI) available for almost all buildings – EUI can be used for monitoring and tracking instead of or
in addition to a 1-100 ENERGY STAR performance score.
36
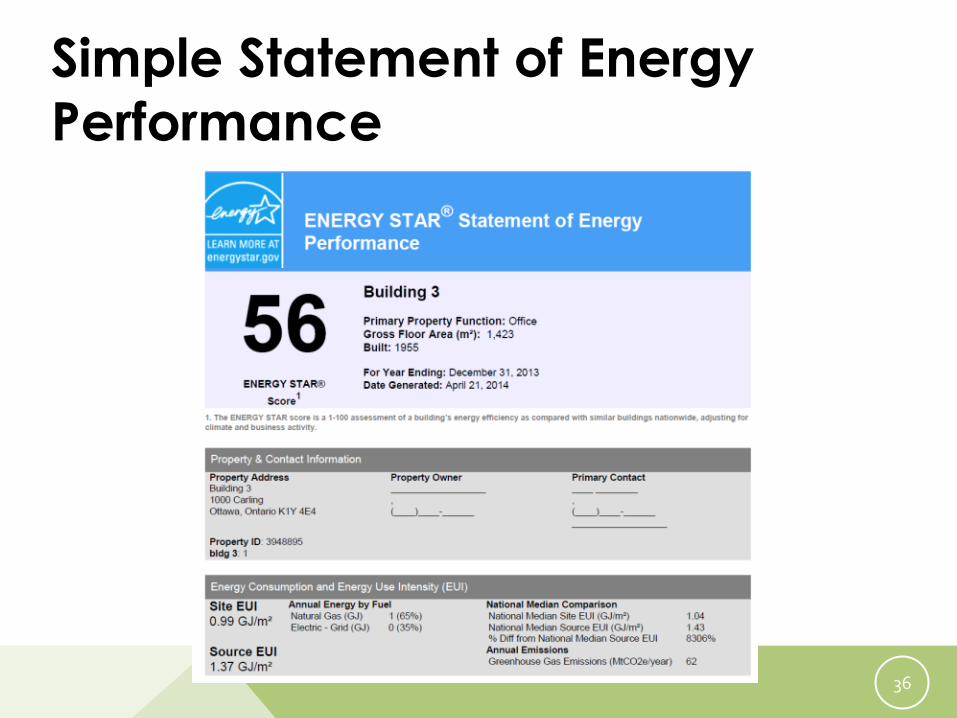
Simple Statement of Energy
Performance
37
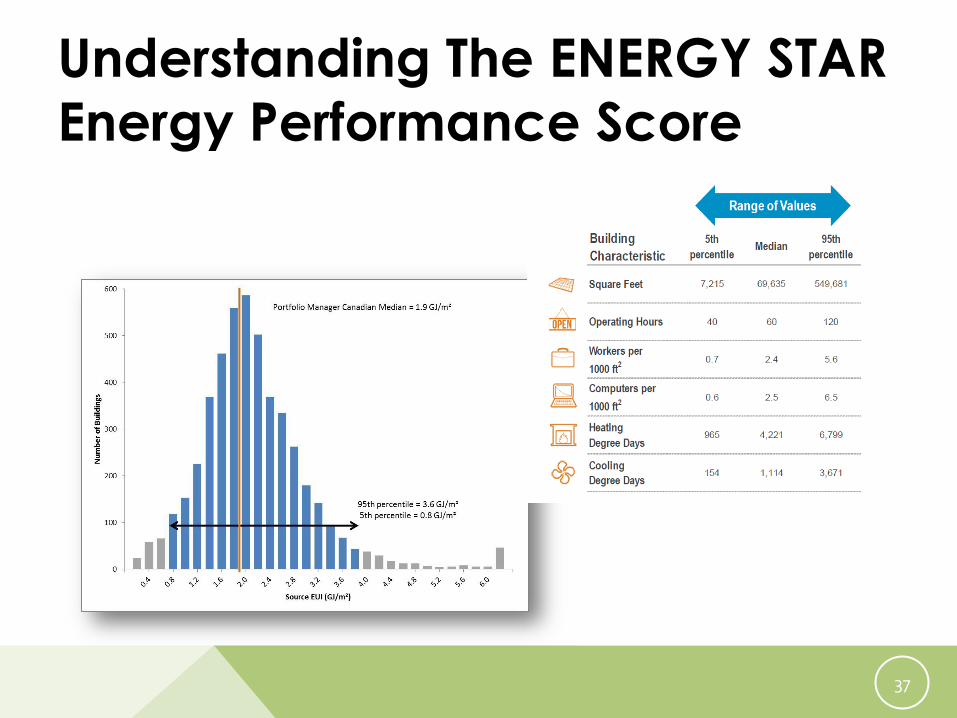
Understanding The ENERGY STAR
Energy Performance Score
38
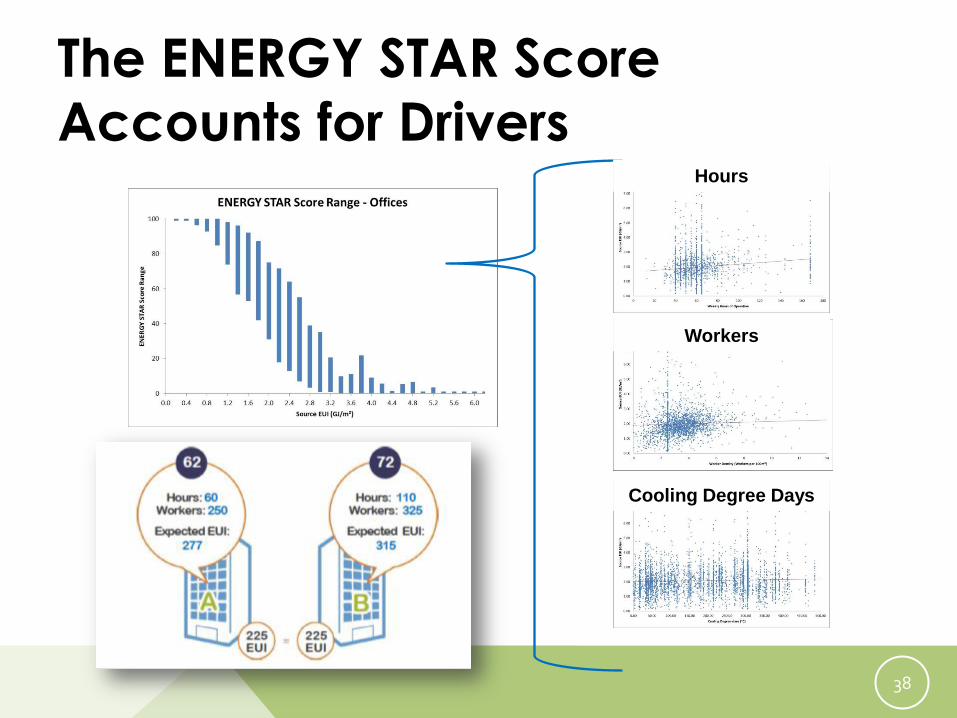
The ENERGY STAR Score
Accounts for Drivers Hours
Workers
Cooling Degree Days

39

USING PORTFOLIO MANAGER
41
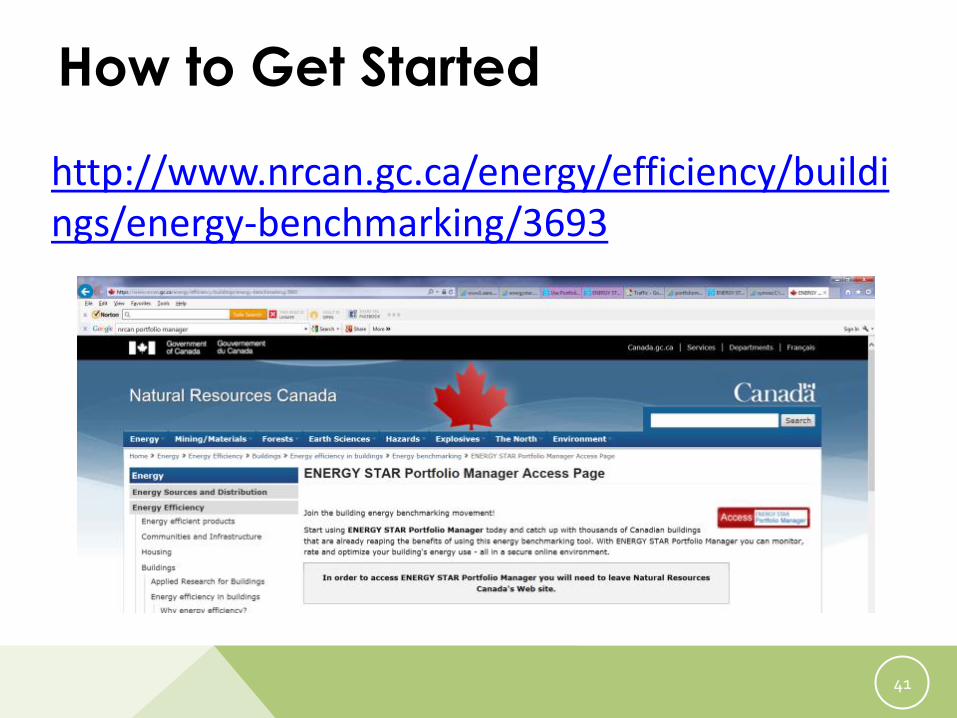
How to Get Started
http://www.nrcan.gc.ca/energy/efficiency/buildings/energy-benchmarking/3693

42
Getting Data into Portfolio
Manager – 3 Options!
• Manual data entry
• Spreadsheet upload
• Web services
Export Also!

43
• Floor area (sq.ft or meters):
– Office space, Parking and Data center
• Occupant #’s
• Number of PCs
• Operating hours by week
• % that can be heated/ cooled
• Data center:
– Configuration (UPS, Cooling redundancy)

44
Case Study:
Richmond Office
45
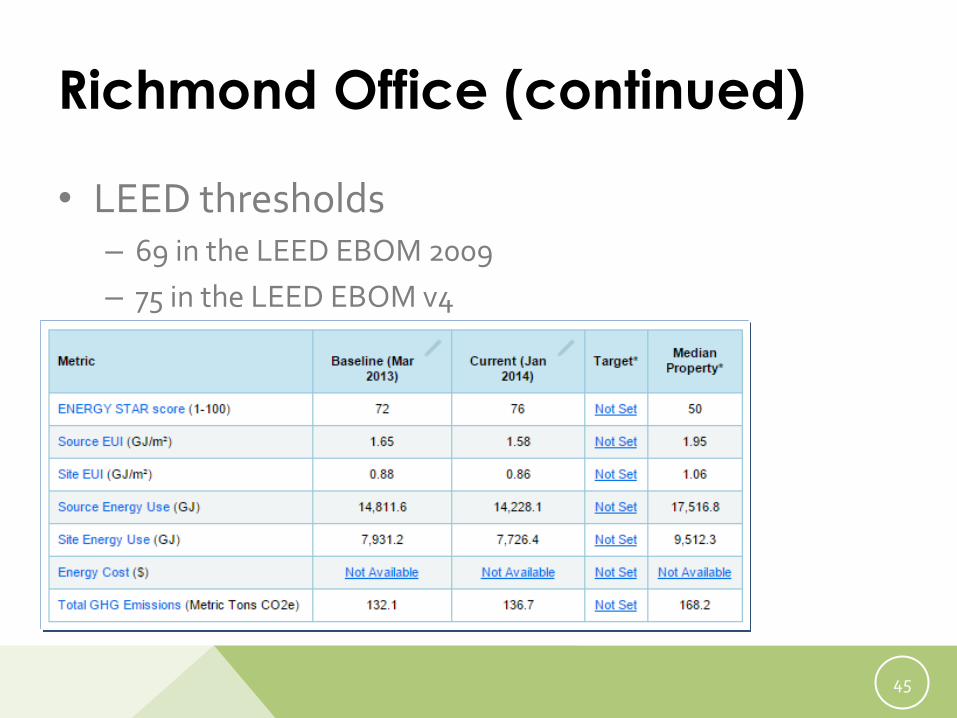
Richmond Office (continued)
• LEED thresholds – 69 in the LEED EBOM 2009
– 75 in the LEED EBOM v4
46
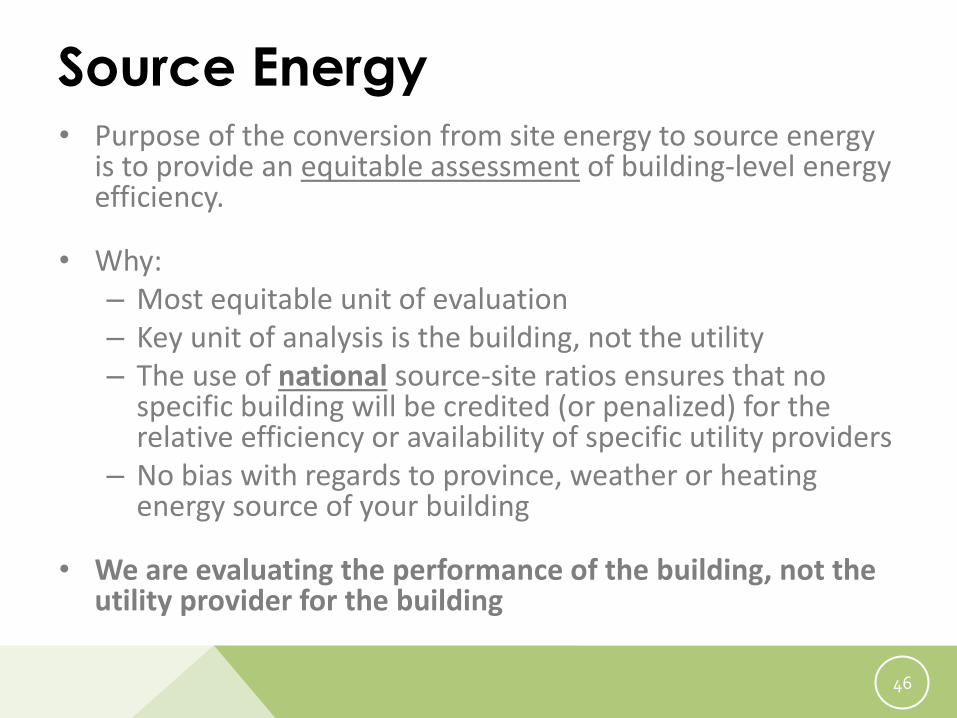
Source Energy • Purpose of the conversion from site energy to source energy
is to provide an equitable assessment of building-level energy efficiency.
• Why: – Most equitable unit of evaluation – Key unit of analysis is the building, not the utility – The use of national source-site ratios ensures that no
specific building will be credited (or penalized) for the relative efficiency or availability of specific utility providers
– No bias with regards to province, weather or heating energy source of your building
• We are evaluating the performance of the building, not the utility provider for the building

47
Source Energy
• Two identical buildings with the exception of heating source
By just looking at purchased energy, we are not evaluating the true performance of the building since transformation to heating energy occurs in different locations.

48
Help! – Is At Hand • English & French language
• Extensive Frequently Asked Questions available
• Richmond Energy Coaches can help with creating your ESPM building profiles

49

51
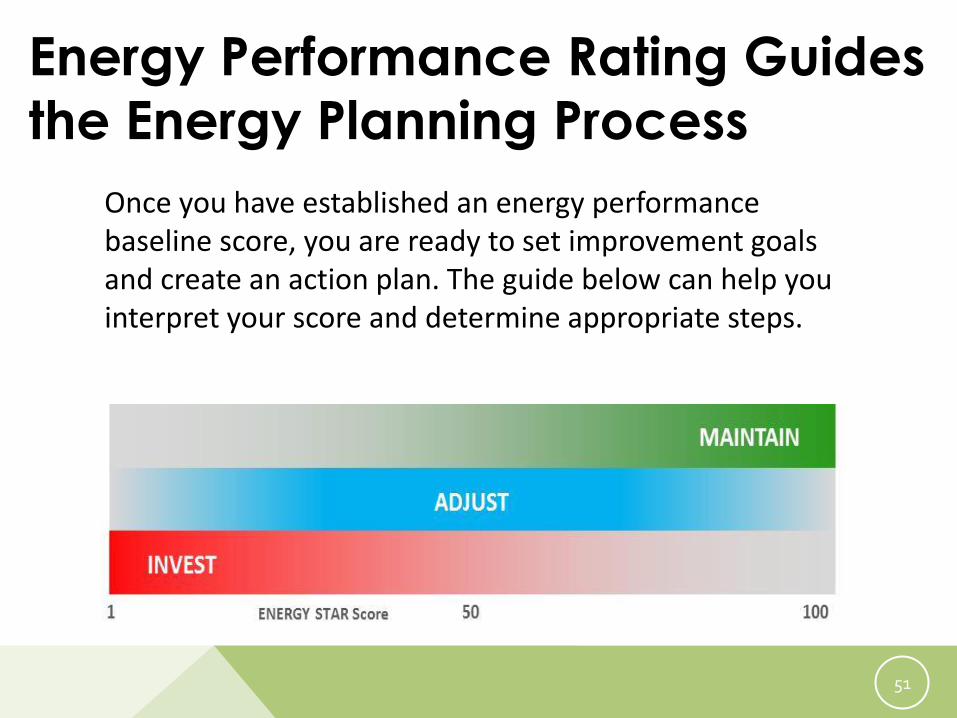
Energy Performance Rating Guides
the Energy Planning Process
Once you have established an energy performance baseline score, you are ready to set improvement goals and create an action plan. The guide below can help you interpret your score and determine appropriate steps.

52
Case Study: Plotting the Energy Performance
Improvement of NRCan Building #3
Year Score Actions
2009 30 Energy assessment
2010 24 HVAC retrofit of boiler, rooftop units and controls
2011 36 HVAC schedule adjustment
2012 40 Control system recommissioning
2013 56 Lighting retrofit, insulation added as part of roof replacement, awareness program

54
International Performance Measurement
and Verification Protocol (IPMVP)
Verification methods depend on the retrofit item
A. Partially measured retrofit isolation – With assumption/stipulations
B. Retrofit isolation – Fully measured
C. Whole facility – Or sub-metered part
D. Calibrated simulation – With software
55
Use Monitoring and Verification
Principals
• Savings = Predicted Energy Use – Actual Energy Use After ECM project
– Predicted energy use is based on your energy performance model, just like your baseline!
– Will be adjusted for weather or other drivers

56
Mathematical Model Example
• HDDs or heating degree days are used to define how cold it is and to adjust to the current year
Line of Best Fit: “Model” of your consumption

57
Track Savings over Time using CUSUM AnalysisMeters, Sites, or whole Portfolio

58

59
Help Is Available!
• City Green will…
– Help you identify what inputs are needed
– Input your data into Portfolio Manager
– Help you interpret your score
– And more!

60
Robert Greenwald, P.Eng., MBA, President
@Rob_Prism
Tel: 604-205-5500
www.prismengineering.com
320 - 3605 Gilmore Way, Burnaby, BC V5G 4X5