Benchmarking Ireland’s Productivity Performance 2004 … · Productivity is a multi-dimensional...
76
1 January 2017 Benchmarking Ireland’s Productivity Performance 2004-2014
Transcript of Benchmarking Ireland’s Productivity Performance 2004 … · Productivity is a multi-dimensional...

1 January 2017
Benchmarking Ireland’s Productivity Performance 2004-2014
2 January 2017
Introduction to the National Competitiveness Council
The National Competitiveness Council reports to the Taoiseach and the Government, through the Minister for
Jobs, Enterprise and Innovation on key competitiveness issues facing the Irish economy and offers
recommendations on policy actions required to enhance Ireland’s competitive position.
Each year the NCC publishes two annual reports:
Ireland’s Competitiveness Scorecard provides a comprehensive statistical assessment of Ireland's
competitiveness performance; and
Ireland’s Competitiveness Challenge uses this information along with the latest research to outline the
main challenges to Ireland’s competitiveness and the policy responses required to meet them.
As part of its work, the NCC also:
Publishes the Costs of Doing Business where key business costs in Ireland are benchmarked against costs
in competitor countries; and
Provides an annual Submission to the Action Plan for Jobs, quarterly bulletins on competitiveness and
other papers on specific competitiveness issues.
The work of the National Competitiveness Council is underpinned by research and analysis undertaken by the
Strategic Policy Division of the Department of Jobs, Enterprise and Innovation.
The NCC’s Competitiveness Framework
The Council defines national competitiveness as the ability of enterprises to compete successfully in
international markets. National competitiveness is a broad concept that encompasses the diverse range of
factors which result in firms in Ireland achieving success in international markets. For the Council, the goal of
national competitiveness is to provide Ireland’s people with the opportunity to improve their living standards
and quality of life. The Council uses a “competitiveness pyramid” to illustrate the various factors (essential
conditions, policy inputs and outputs), which combine to determine overall competitiveness and sustainable
growth. Under this framework, competitiveness is not an end in itself, but a means of achieving sustainable
improvements in living standards and quality of life.
3 January 2017
National Competitiveness Council Members
Professor Peter Clinch Chair, National Competitiveness Council
Pat Beirne Chief Executive Officer, Mergon Group
Kevin Callinan Deputy General Secretary, IMPACT Trade Union
Micheál Collins Associate Professor, School of Social Policy, Social Work and Social Justice, UCD
Isolde Goggin Chair, Competition and Consumer Protection Commission
Cathríona Halahan CEO/Managing Director (Ireland), Microsoft
Declan Hughes Assistant Secretary, Department of Jobs, Enterprise and Innovation
Jane Magnier Joint Managing Director, Abbey Tours
Danny McCoy Chief Executive Officer, IBEC
Seán O'Driscoll President, Glen Dimplex Group
Louise Phelan Vice President of Global Operations, Europe Middle East and Africa, PayPal
Dave Shanahan Chief Executive, Adagio Ventures Commercialisation Partners
Martin Shanahan Chief Executive, IDA Ireland
Julie Sinnamon Chief Executive, Enterprise Ireland
Ian Talbot Chief Executive, Chambers Ireland
Jim Woulfe Chief Executive, Dairygold Co-Operative Society Limited
Council Advisers
Brid Cannon Department of Agriculture, Food and the Marine
Patricia Cronin Department of Communications, Climate Action and Natural Resources
Kathleen Gavin Department of Education and Skills
John McCarthy Department of Finance
Conan McKenna Department of Justice and Equality
David Moloney Department of Public Expenditure and Reform
Ray O’Leary Department of Transport, Tourism, and Sport
David Walsh Department of Housing, Planning, Community and Local Government
John Shaw Department of the Taoiseach
Research, Analysis and Administration
Marie Bourke Department of Jobs, Enterprise and Innovation
Eoin Cuddihy 23 Kildare Street, Dublin 2, D02 TD30
Conor Hand Tel: 01 6312121
John Maher Email: [email protected]
Web: www.competitiveness.ie
4 January 2017
Chairman’s Preface
Productivity is a multi-dimensional concept; it reflects our ability to produce more
output by better combining inputs, thanks to new ideas, technological innovations
and new business models. Measures of productivity growth constitute core
indicators for the analysis of economic growth. Productivity growth is the primary
way of financing improved living standards, wages and public services.
As set out in our framework for competitiveness analysis, the National
Competitiveness Council considers productivity a crucial component and driver of
Ireland’s international competitiveness performance. In 2012 the Council published
reports on Irish productivity for the period 1980-2011. Four years on, is important to
revisit this work and benchmark Ireland’s performance given the changes that have occurred in the Irish and
global economy and the growing importance of productivity as a source of economic growth and
competitiveness.
Global trends suggest that the rate of productivity growth has slowed both in terms of labour productivity and
total factor productivity. Closer to home, average euro area and UK productivity growth rates are significantly
lower than levels in the United States. Overall, Ireland’s productivity performance is relatively strong and
above the Euro area average and levels seen in the UK. However, Ireland’s performance is highly influenced by
shifts in the composition of employment and the influence of the FDI sector on output. Increasing productivity
across all sectors remains a significant challenge in ensuring growth is sustainable in the long run. Ireland can
take advantage of a sizeable competitiveness opportunity if we can avoid the ‘productivity trap’ being
experienced by many developed economies.
Just as productivity performance differs between countries, so too it differs between sectors and firms. At
sectoral level, growth in the value of output is driven primarily by ‘modern’ Manufacturing and services traded
internationally. In Ireland, the performance of modern Manufacturing, ICT and Professional Services is
particularly strong, while the contribution from sectors such as Retail and accommodation and food remains
low. Equally, divergent firm-level productivity performance directly impacts upon aggregate national
performance. OECD research indicates that firms can be classified into three cohorts based on their
productivity performance: the globally most productive firms (i.e. global frontier firms); the most advanced
firms nationally; and laggard firms. Despite the generally positive trends in Irish productivity performance, the
trajectory of Ireland’s growth path is linked to the performance of Ireland’s high-productivity sectors such as
ICT and manufacturing where value added is dominated by multinational firms. The narrow base of sectors
driving overall productivity performance leaves Ireland vulnerable to external shocks but also serves to
highlight the scope for reform. As noted by the OECD, over the next decade, productivity will increasingly be
about “working smarter”, rather than “working harder”. The challenges in improving the quantity and quality
of human and productive capital, and enhancing total factor productivity are complex and significant, but key
to achieving long-run economic growth and rising prosperity. The Government’s enterprise strategy
Enterprise 2025 (EP2025) sets out a target for Ireland to achieve 2-2.5 per cent growth in productivity per
annum over the next ten years. The Council welcomes this commitment but considers a range of actions will
need to be undertaken to safeguard and enhance the drivers of Ireland’s productivity performance. The
challenge will be to ensure that productivity growth is driven by a broad range of sectors.
I would like to conclude by thanking the Council members and advisers for their input throughout the
development of this report. I would particularly like to acknowledge the enthusiasm, commitment and
expertise of the secretariat for taking on this exceptionally important area of work.
Professor Peter Clinch
Chairman, National Competitiveness Council
5 January 2017
Table of Contents
Chairman’s Preface 4
Executive Summary 6
Chapter 1: Why Productivity Matters 8
1.1 Introduction 8
1.2 Recent Policy Developments 9
1.3 Competitiveness and the Determinants of Productivity Growth 10
2 Methodologies, Definitions and Scope 14
2.1. Methodologies 14
2.2. Definitions 16
3. Labour Productivity Performance 2004-2014 19
3.1 Overview 19
3.2 Productivity and the Economic Cycle in Ireland 20
3.3 Changes to Ireland’s Long-run Labour Productivity Performance 22
3.4 Labour Productivity Growth 24
4. Trends in Employment and Hours Worked 2004-2014 26
4.1 Overview 26
4.2 Trends in Hours worked 29
5. Trends in Productivity at Sector level 33
5.1 Overview 33
5.2 Total and Sectoral Output Trends 33
5.3 Trends in Labour Productivity Growth at Sectoral Level 37
5.4 Sectoral Contributions to Business Sector Labour Productivity 39
5.5 Trends in Sectoral Gross Value Added per hour Worked 40
5.6 Focus on Sectors 41
6. Investment and Capital Productivity Trends 54
6.1 Context 54
6.2 Trends in Investment 54
6.3 Capital Productivity Growth 56
7. Multifactor Productivity 58
7.1 Context 58
7.2 Trends in MFP Growth 58
8.1 Context 60
8.2 Labour Productivity by Firm Size 60
8.3 Multifactor Productivity at Firm Level 63
8.4 Productivity and Firm Ownership 64
9. Conclusions and Implications for Policy 69
9.1 Extending Global Connectedness via Trade, FDI, and Participation in Global Value Chains 70
9.2 Facilitating Start-ups and Scaling of Firms 72
9.3 Deepening Innovation Capacity, Capability and Activity at Firm Level 73
6 January 2017
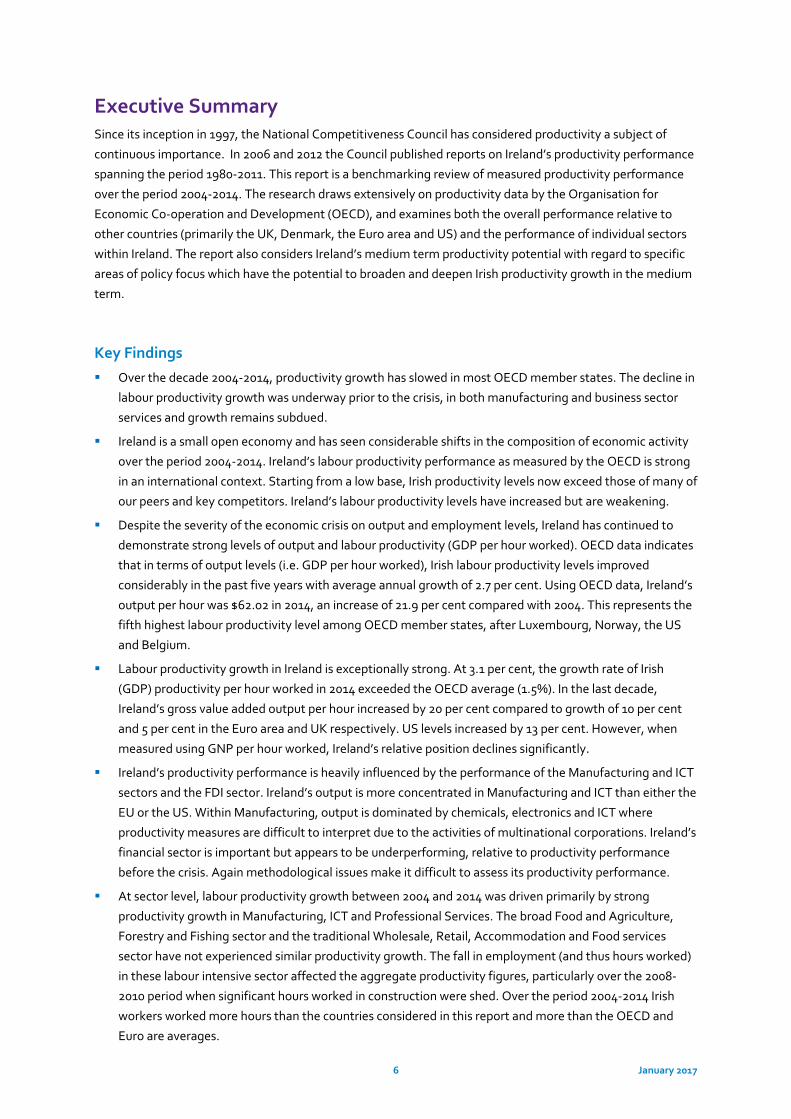
Executive Summary Since its inception in 1997, the National Competitiveness Council has considered productivity a subject of
continuous importance. In 2006 and 2012 the Council published reports on Ireland’s productivity performance
spanning the period 1980-2011. This report is a benchmarking review of measured productivity performance
over the period 2004-2014. The research draws extensively on productivity data by the Organisation for
Economic Co-operation and Development (OECD), and examines both the overall performance relative to
other countries (primarily the UK, Denmark, the Euro area and US) and the performance of individual sectors
within Ireland. The report also considers Ireland’s medium term productivity potential with regard to specific
areas of policy focus which have the potential to broaden and deepen Irish productivity growth in the medium
term.
Key Findings
Over the decade 2004-2014, productivity growth has slowed in most OECD member states. The decline in
labour productivity growth was underway prior to the crisis, in both manufacturing and business sector
services and growth remains subdued.
Ireland is a small open economy and has seen considerable shifts in the composition of economic activity
over the period 2004-2014. Ireland’s labour productivity performance as measured by the OECD is strong
in an international context. Starting from a low base, Irish productivity levels now exceed those of many of
our peers and key competitors. Ireland’s labour productivity levels have increased but are weakening.
Despite the severity of the economic crisis on output and employment levels, Ireland has continued to
demonstrate strong levels of output and labour productivity (GDP per hour worked). OECD data indicates
that in terms of output levels (i.e. GDP per hour worked), Irish labour productivity levels improved
considerably in the past five years with average annual growth of 2.7 per cent. Using OECD data, Ireland’s
output per hour was $62.02 in 2014, an increase of 21.9 per cent compared with 2004. This represents the
fifth highest labour productivity level among OECD member states, after Luxembourg, Norway, the US
and Belgium.
Labour productivity growth in Ireland is exceptionally strong. At 3.1 per cent, the growth rate of Irish
(GDP) productivity per hour worked in 2014 exceeded the OECD average (1.5%). In the last decade,
Ireland’s gross value added output per hour increased by 20 per cent compared to growth of 10 per cent
and 5 per cent in the Euro area and UK respectively. US levels increased by 13 per cent. However, when
measured using GNP per hour worked, Ireland’s relative position declines significantly.
Ireland’s productivity performance is heavily influenced by the performance of the Manufacturing and ICT
sectors and the FDI sector. Ireland’s output is more concentrated in Manufacturing and ICT than either the
EU or the US. Within Manufacturing, output is dominated by chemicals, electronics and ICT where
productivity measures are difficult to interpret due to the activities of multinational corporations. Ireland’s
financial sector is important but appears to be underperforming, relative to productivity performance
before the crisis. Again methodological issues make it difficult to assess its productivity performance.
At sector level, labour productivity growth between 2004 and 2014 was driven primarily by strong
productivity growth in Manufacturing, ICT and Professional Services. The broad Food and Agriculture,
Forestry and Fishing sector and the traditional Wholesale, Retail, Accommodation and Food services
sector have not experienced similar productivity growth. The fall in employment (and thus hours worked)
in these labour intensive sector affected the aggregate productivity figures, particularly over the 2008-
2010 period when significant hours worked in construction were shed. Over the period 2004-2014 Irish
workers worked more hours than the countries considered in this report and more than the OECD and
Euro are averages.
7 January 2017
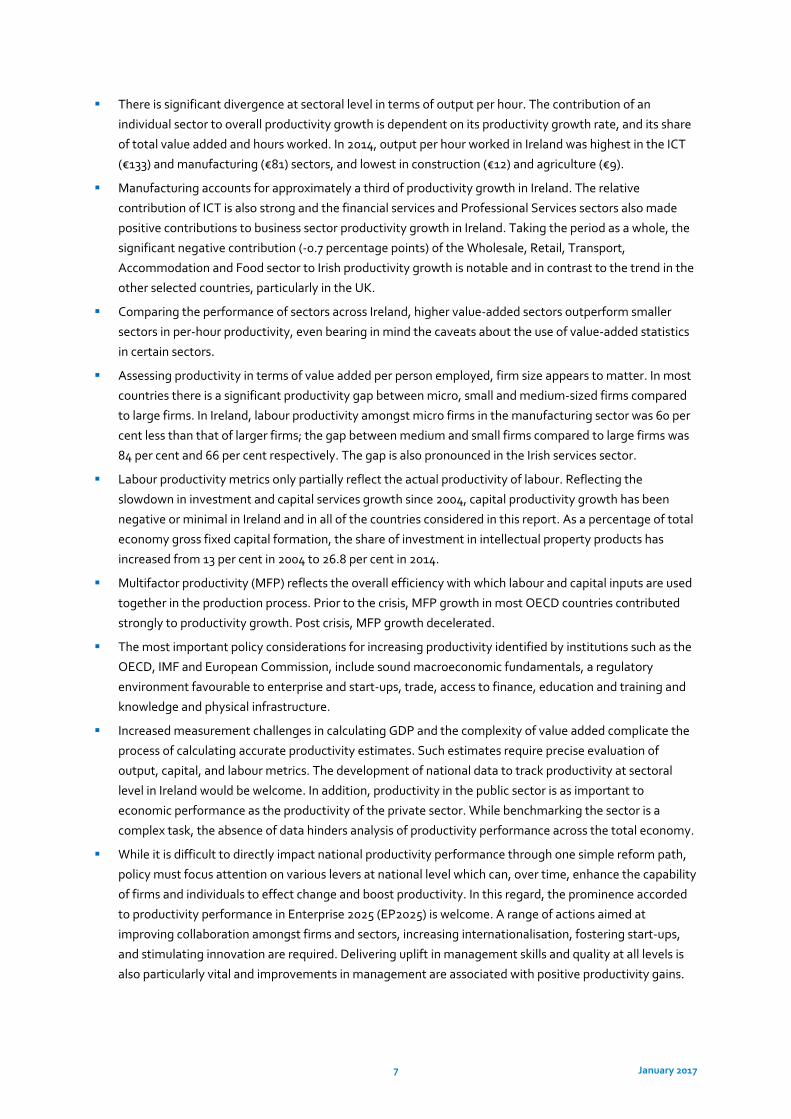
There is significant divergence at sectoral level in terms of output per hour. The contribution of an
individual sector to overall productivity growth is dependent on its productivity growth rate, and its share
of total value added and hours worked. In 2014, output per hour worked in Ireland was highest in the ICT
(€133) and manufacturing (€81) sectors, and lowest in construction (€12) and agriculture (€9).
Manufacturing accounts for approximately a third of productivity growth in Ireland. The relative
contribution of ICT is also strong and the financial services and Professional Services sectors also made
positive contributions to business sector productivity growth in Ireland. Taking the period as a whole, the
significant negative contribution (-0.7 percentage points) of the Wholesale, Retail, Transport,
Accommodation and Food sector to Irish productivity growth is notable and in contrast to the trend in the
other selected countries, particularly in the UK.
Comparing the performance of sectors across Ireland, higher value-added sectors outperform smaller
sectors in per-hour productivity, even bearing in mind the caveats about the use of value-added statistics
in certain sectors.
Assessing productivity in terms of value added per person employed, firm size appears to matter. In most
countries there is a significant productivity gap between micro, small and medium-sized firms compared
to large firms. In Ireland, labour productivity amongst micro firms in the manufacturing sector was 60 per
cent less than that of larger firms; the gap between medium and small firms compared to large firms was
84 per cent and 66 per cent respectively. The gap is also pronounced in the Irish services sector.
Labour productivity metrics only partially reflect the actual productivity of labour. Reflecting the
slowdown in investment and capital services growth since 2004, capital productivity growth has been
negative or minimal in Ireland and in all of the countries considered in this report. As a percentage of total
economy gross fixed capital formation, the share of investment in intellectual property products has
increased from 13 per cent in 2004 to 26.8 per cent in 2014.
Multifactor productivity (MFP) reflects the overall efficiency with which labour and capital inputs are used
together in the production process. Prior to the crisis, MFP growth in most OECD countries contributed
strongly to productivity growth. Post crisis, MFP growth decelerated.
The most important policy considerations for increasing productivity identified by institutions such as the
OECD, IMF and European Commission, include sound macroeconomic fundamentals, a regulatory
environment favourable to enterprise and start-ups, trade, access to finance, education and training and
knowledge and physical infrastructure.
Increased measurement challenges in calculating GDP and the complexity of value added complicate the
process of calculating accurate productivity estimates. Such estimates require precise evaluation of
output, capital, and labour metrics. The development of national data to track productivity at sectoral
level in Ireland would be welcome. In addition, productivity in the public sector is as important to
economic performance as the productivity of the private sector. While benchmarking the sector is a
complex task, the absence of data hinders analysis of productivity performance across the total economy.
While it is difficult to directly impact national productivity performance through one simple reform path,
policy must focus attention on various levers at national level which can, over time, enhance the capability
of firms and individuals to effect change and boost productivity. In this regard, the prominence accorded
to productivity performance in Enterprise 2025 (EP2025) is welcome. A range of actions aimed at
improving collaboration amongst firms and sectors, increasing internationalisation, fostering start-ups,
and stimulating innovation are required. Delivering uplift in management skills and quality at all levels is
also particularly vital and improvements in management are associated with positive productivity gains.
8 January 2017
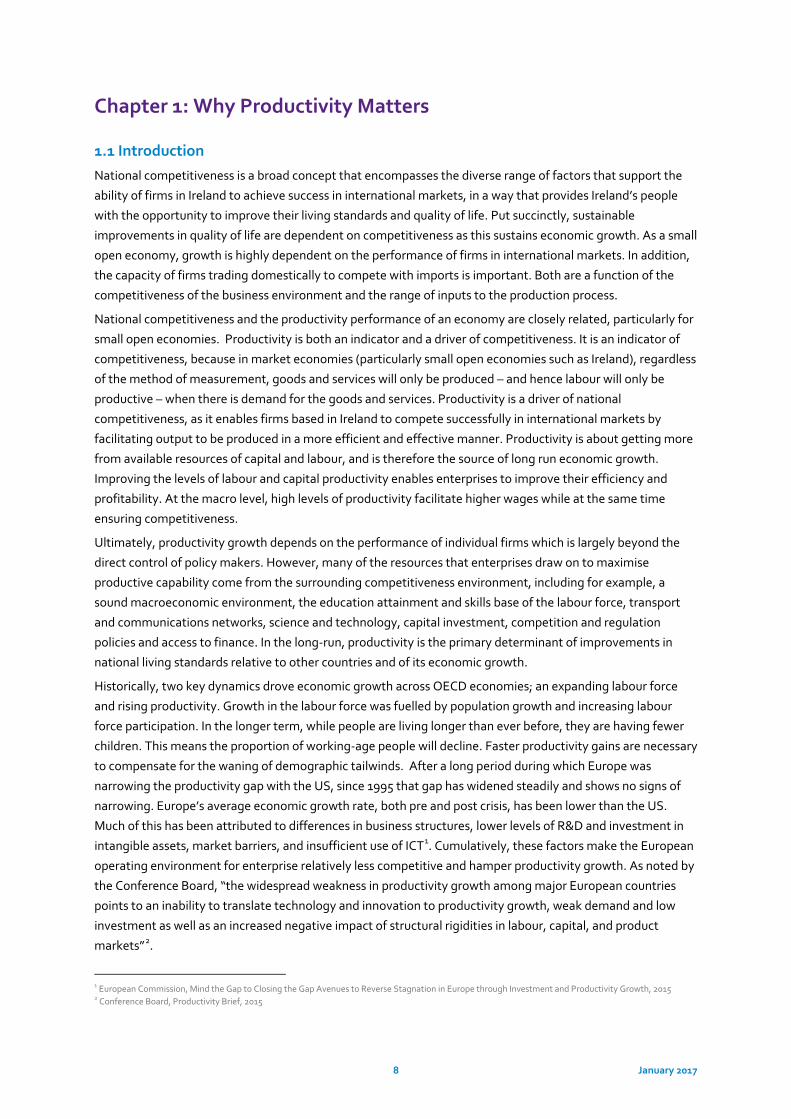
Chapter 1: Why Productivity Matters
1.1 Introduction
National competitiveness is a broad concept that encompasses the diverse range of factors that support the
ability of firms in Ireland to achieve success in international markets, in a way that provides Ireland’s people
with the opportunity to improve their living standards and quality of life. Put succinctly, sustainable
improvements in quality of life are dependent on competitiveness as this sustains economic growth. As a small
open economy, growth is highly dependent on the performance of firms in international markets. In addition,
the capacity of firms trading domestically to compete with imports is important. Both are a function of the
competitiveness of the business environment and the range of inputs to the production process.
National competitiveness and the productivity performance of an economy are closely related, particularly for
small open economies. Productivity is both an indicator and a driver of competitiveness. It is an indicator of
competitiveness, because in market economies (particularly small open economies such as Ireland), regardless
of the method of measurement, goods and services will only be produced – and hence labour will only be
productive – when there is demand for the goods and services. Productivity is a driver of national
competitiveness, as it enables firms based in Ireland to compete successfully in international markets by
facilitating output to be produced in a more efficient and effective manner. Productivity is about getting more
from available resources of capital and labour, and is therefore the source of long run economic growth.
Improving the levels of labour and capital productivity enables enterprises to improve their efficiency and
profitability. At the macro level, high levels of productivity facilitate higher wages while at the same time
ensuring competitiveness.
Ultimately, productivity growth depends on the performance of individual firms which is largely beyond the
direct control of policy makers. However, many of the resources that enterprises draw on to maximise
productive capability come from the surrounding competitiveness environment, including for example, a
sound macroeconomic environment, the education attainment and skills base of the labour force, transport
and communications networks, science and technology, capital investment, competition and regulation
policies and access to finance. In the long-run, productivity is the primary determinant of improvements in
national living standards relative to other countries and of its economic growth.
Historically, two key dynamics drove economic growth across OECD economies; an expanding labour force
and rising productivity. Growth in the labour force was fuelled by population growth and increasing labour
force participation. In the longer term, while people are living longer than ever before, they are having fewer
children. This means the proportion of working-age people will decline. Faster productivity gains are necessary
to compensate for the waning of demographic tailwinds. After a long period during which Europe was
narrowing the productivity gap with the US, since 1995 that gap has widened steadily and shows no signs of
narrowing. Europe’s average economic growth rate, both pre and post crisis, has been lower than the US.
Much of this has been attributed to differences in business structures, lower levels of R&D and investment in
intangible assets, market barriers, and insufficient use of ICT1. Cumulatively, these factors make the European
operating environment for enterprise relatively less competitive and hamper productivity growth. As noted by
the Conference Board, “the widespread weakness in productivity growth among major European countries
points to an inability to translate technology and innovation to productivity growth, weak demand and low
investment as well as an increased negative impact of structural rigidities in labour, capital, and product
markets”2.
1 European Commission, Mind the Gap to Closing the Gap Avenues to Reverse Stagnation in Europe through Investment and Productivity Growth, 2015 2 Conference Board, Productivity Brief, 2015
9 January 2017
Productivity is a measure of output produced per unit of input, and improvements in this regard are generally
regarded as the ultimate engine of long run economic growth. While increases in the level of the capital stock
(e.g., through higher investment) or in the supply of labour can expand the output capacity of an economy in
the short run, for mature or close-to-frontier economies such as Ireland, the potential contribution to growth
from these sources is declining. Contributions from additional capital investment are affected by diminishing
returns and technical change, and labour supply is running up against demographic constraints and potential
skills mismatches. The challenges in improving the quantity and quality of human and productive capital, and
enhancing total factor productivity (through technological change, innovation and the application of
competition policy) are complex and significant but key to achieving sustainable competitiveness resulting in
economic growth, jobs and improved living standards.
1.2 Recent Policy Developments
For the past decade, productivity growth has been subdued in most OECD countries. The global slowdown in
productivity growth has been attributed to a mix of cyclical factors such as low investment in physical capital,
in a context of weak global demand and structural factors such as inefficient markets, low levels of innovative
start-ups and skills mismatches. Recent research by the OECD3 also suggests a possible link between declining
productivity and rising income inequality as growing productivity dispersion across firms contributed to
widening of the wage distribution. Ultimately improving levels of labour and capital productivity enable
enterprises to increase their efficiency and profitability, and enhance the ability of countries to maintain
international competitive advantage and sustainably improve living standards.
From a policy perspective, there is increased emphasis nationally and internationally on the role of and drivers
of productivity as a means of facilitating economic growth. At national level, in 2015, the Government
published Enterprise 2025, a strategy which sets out a range of cross sectoral initiatives designed to support
the enterprise sector. Enterprise 2025 aims to enhance our relative competitiveness, leverage existing
comparative advantage in key sectors, address structural issues in the economy, enhance the capacity of
enterprises to innovate and improve productivity. In this regard, a key target of the strategy is to deliver 2-2.5
per cent productivity growth per annum in Irish companies. In addition, Foodwise 2025, the Government’s
strategic plan for the development of agri-food sector over the next decade sets out how the profitability and
viability will be driven by productivity improvements, particularly the adoption and application of innovative
processes and technologies.
At European level, while the EU is far from a homogeneous entity in terms of productivity, performance,
Europe’s average economic growth rate has been lower than the US partly due to a productivity gap. The
prolonged slowdown in global productivity has been subject of considerable debate across advanced
economies in recent years. Much of this is attributed by the European Commission to differences in business
structures, lower levels of R&D investment, single market barriers, and insufficient use of information and
communications technologies. In addition, higher costs (particularly energy), infrastructure pressures, and
fewer available sources of finance make the European operating environment for enterprise relatively less
competitive. Arising out of the 2015 report “Completing Europe's Economic and Monetary Union”- (the Five
President’s Report), the European Commission has published a Council Recommendation on Euro-area
National Productivity Boards to systematically track developments and inform the national debate in the field
of productivity and competitiveness.
3 The Productivity-Inclusiveness Nexus, OECD, 2016
10 January 2017
The OECD has had a longstanding focus on productivity: the OECD’s 2015 Economic Survey of Ireland
recommended that Ireland develop a stronger whole-of-government productivity agenda. In addition, in 2015,
building on its extensive datasets and research in the area of productivity, the OECD launched a Global Forum
on Productivity4 (GFP) to foster international co-operation between public bodies with responsibility for
promoting productivity-enhancing policies.
Recognising the importance that productivity plays as the key driver of longer term competitiveness and
prosperity is essential. In this regard, the prominence accorded to productivity performance in Enterprise 2025
(EP2025) is to be welcomed. While the policy mix that best supports robust and broader based productivity
growth varies between countries the Council welcomes the renewed policy focus on productivity at
international level.
1.3 Competitiveness and the Determinants of Productivity Growth
Research and analysis of the underlying components of economic performance indicates a wide range of
factors are particularly critical for determining the rate of productivity growth at national and firm level. Many
of these factors reflect the competitiveness policy inputs and essential conditions set out in the NCC’s
competitiveness framework.
Macroeconomic stability and fiscal policy
A stable macroeconomic environment is conducive to investment by firms seeking to introduce new products,
to adopt new production methods, or to undertake organisational changes that can lead to higher productivity
growth and more efficient use of resources. Regarding fiscal policy, personal and corporate tax policy are
particularly important to Ireland as a small open economy. Tax is an important consideration in investment
decisions by firms, both in terms of corporate tax and the rate of return firms can expect in Ireland vis-à-vis
other environments and the incentives for individuals to work. The structure of tax policy is important in that
the tax burden has an impact on productivity. OECD research5 suggests that the tax burden on individuals,
particularly highly skilled individuals has a much stronger impact on productivity growth than the tax burden
on firms. A particularly negative effect is found for tax structures with a heavy weight on distortionary taxes
(including direct taxes on income and profits), which affect the choices of households and firms with respect to
the level and composition of their (human and physical) capital investment and discourage entrepreneurship.
Institutional effectiveness, competition and regulation
The institutional environment is determined by the legal and administrative framework within which
individuals, firms, and governments interact to generate wealth. The quality of institutions, regulation and
competition has a strong bearing on the factors which enhance productivity growth. It influences investment
decisions and the organisation of production and plays a key role in the ways in which societies distribute the
benefits and bear the costs of development strategies and policies. Removing rigidities in product market
regulation can support productivity growth, particularly in heavily regulated sectors.6 Competition and
competitive markets support productivity in three main ways. First, within firms, competition acts as a
4 http://www.oecd.org/global-forum-productivity/ 5 OECD, The Sources of Economic Growth in OECD Countries 2003, Central Bank, Productivity in Ireland: Trends and Issues, Quarterly Bulletin Spring, 2004 6See OECD Economic Outlook 2014 re link between firm, industry and macro-level growth performance and competition-enhancing product market regulation is found by Bourlès et al. (2010), Bouis et al. (2011), Conway, et al. (2006) and Griffith, et al. (2004).
11 January 2017
disciplining device in terms of resource allocation, placing pressure on the managers of firms to become more
efficient. Secondly, competition ensures that more productive firms increase their market share at the
expense of the less productive. These low productivity firms may then exit the market, to be replaced by
higher productivity firms. Thirdly, and perhaps most importantly, competition drives firms to innovate,
coming up with new products and processes which can lead to step-changes in efficiency.
Investment in physical and knowledge based capital
Investment in physical capital – machinery, equipment and buildings matters. The more capital that firms have
at their disposal, generally the better they are able to do their jobs, producing more and better quality output.
The availability of competitively priced world-class economic infrastructure (e.g. energy; telecoms; transport –
road, public transport, airport, seaports; waste and water) and related services is also critical to support
productivity growth. A significant body of research underscores the positive relationship between investment
in high-quality public infrastructure and economy-wide productivity. Research by the IMF7 suggests that a 1
percentage point of GDP increase in investment spending would increase the level of output by about 0.4
percent in the same year and by 1.5 percent after four years. Investment and growth in OECD economies is
increasingly driven by knowledge based capital (KBC). Three types of KBC can be distinguished:
1. Computerised information (software and databases);
2. Innovative property (patents, copyrights, designs, trademarks); and
3. Economic competencies (including brand equity, firm-specific human capital, networks joining
people and institutions, and organisational know-how that increase enterprise efficiency).
The development and diffusion of innovative products, services and processes provides the platform for
productivity growth and is thus an important driver of competitiveness. While research and development is
the main source of new technologies and productivity growth in the long run, the concept of innovation is a
broad one encompassing a wide range of activities in addition to R&D, such as organisational changes,
training, testing, marketing and design. At firm level, more intensive innovative activity is associated with
higher productivity growth. Economy-wide productivity and employment gains are generated when
innovations are diffused and widely adopted; meaning the strengthening of technology diffusion mechanisms
represents a key policy challenge. Effective innovation activity facilitates an increase in the productivity and
turnover of innovating firms. From a policy making perspective, the key issue is to foster a supportive
environment for investment in innovation and technology adoption. As noted by the OECD, synergic
investments in R&D, skills, organisational know-how (i.e. managerial quality) and other forms of knowledge-
based capital enable economies to absorb, adapt and reap the full benefits of new technologies8.
Productivity growth also entails sufficient investment in R&D, by both the public and private sector; the
presence of high-quality scientific research personnel and institutions; collaboration between universities and
industry; and advanced business processes and practices. Analyses of policies which support innovation
suggest that when R&D spending or patent applications increase, labour productivity and multi-factor
productivity rise in a statistically significant manner9. In order to create a supportive framework for R&D
activity, an economy needs a well-developed risk capital market, a good system to protect intellectual
property rights and adequately resourced efficient education and research support systems. =
7 IMF, World Economic Outlook,2014 8 OECD, The Future of Productivity, 2015 9 OECD Economic Outlook, Volume 2016 Issue 1
12 January 2017
Talent and skills
Talent and skills complement physical capital, and are needed to take advantage of investment in new
technologies and organisational structures. Increasing educational attainment levels and labour quality is
associated with large increases in productivity10. Evidence suggests that positive labour quality growth
contributes significantly to growth in labour productivity with approximately a third of labour productivity
growth attributable to improvements in labour quality. ECB research suggests that the main drivers of
improved labour quality are tertiary education and labour market experience. While acknowledging that other
(not measured) factors, such as quality of education are likely to also matter, the results suggest that policies
designed to promote growth in euro area human capital should be geared towards an increase in educational
attainment and increased on-the-job training both of which matter for productivity growth11. Research12
suggests that an important factor accounting for differences in productivity is variations in management
practices. For example, in the Manufacturing sector, managerial quality differs significantly between countries
and Ireland scores relatively poorly, particularly when compared to the US, Japan and Germany. Increasing
managerial quality in Manufacturing in Ireland to the best practice levels observed in the US could potentially
boost manufacturing productivity by over ten per cent13.
Skills mismatch is associated with lower aggregate labour productivity. The OECD estimates that
approximately 25 per cent of workers report a mismatch between their skills and those required to do their
job. A better use of talent could translate in to as much as a 10 per cent higher labour productivity in some
economies14. A greater focus on collaboration between industry and education and training providers is
important for reducing mismatches between demand and supply for skills and improving productivity
performance. Higher investment in basic research and policies that promote firm-university collaboration are
found to be effective tools that increase the capability of countries to absorb external knowledge and
technologies and increase productivity. Results from OECD firm-level micro data suggest that more R&D
collaboration between universities and firms reduces the productivity gap between the less productive and
most productive firms (Andrews et al., 2015)15.
Entrepreneurship, trade and access to finance
In most countries there is a divergent productivity performance at sectoral and national level between the
most productive enterprises and the long tail of relatively poorly performing firms with low or no productivity
growth. There is evidence that suggests a firm’s rate of growth, job creation, and export activity is related
more directly to the age of the business than to its size16. New firms are therefore especially relevant for
expanding productivity performance. New start-ups, particularly in ICT, are more inclined to engage in more
radical innovations which enhance productivity than incumbents who tend to adopt a more incremental
approach. A continuous flow of new business start-ups that can survive and thrive in international markets
strengthens the productivity base not only through the creation of new businesses, products and services but
also by stimulating improved performance in existing businesses. More than half of productivity growth at the
industry level has been attributed to new entrants. From a policy perspective therefore, facilitating
entrepreneurship, start-ups and firms of scale must be seen as the dynamo of productivity growth in the long
run.
10 OECD, The Future of Productivity, 2015 11 ECB, Growth in Euro area labour quality, Working Paper 575, 2006 12 Bloom, N. et al, Management Practices Across Firms and Countries, National Bureau of Economic Research, 2012 13 Ibid 14 OECD, The Future of Productivity, 2015 15 OECD, Frontier Firms, Technology Diffusion and Public Policy: Micro Evidence from OECD Countries,2016 16 IMF, Fiscal Monitor: Acting Now, Acting Together, 2016
13 January 2017
An economy’s ability to sustain productivity growth through learning from the global frontier will depend on
enhanced global trade and international investment. It has long been recognised that trade can be a spur to
productivity growth. Trade allows greater specialisation in activities where a country or a firm has a
comparative advantage. Access to a larger market allows firms to benefit from economies of scale, generating
larger volumes of activity without increasing the number of people employed or other inputs in the same
proportion. Firms which are more heavily exposed to international competition benefit from a larger market
and have a stronger incentive to innovate and find efficiency improvements than businesses which are more
sheltered in domestic markets. A recent working paper by IMF staff estimates that a 1 percentage point
decline in input tariffs is estimated to increase total factor productivity by about 2 percent17.
Access to competitively priced sources of finance for investment is also essential to facilitate enterprises
establish and expand their operations, invest in productivity enhancing infrastructure and skills and to
ultimately survive and scale. A recent ECB working paper suggests that financial constraints significantly lower
productivity growth with the effect particularly pronounced in innovative sectors and for small and micro sized
firms18.
Firm sophistication
Firm sophistication concerns two elements that are intricately linked: the quality of a country’s overall
business networks and the quality of individual firms’ operations and strategies. These factors are especially
important for countries at an advanced stage of development when, to a large extent, the more basic sources
of productivity improvements have been exhausted. The quality of a country’s business networks and
supporting industries, as measured by the quantity and quality of local suppliers and the extent of their
interaction, is important for a variety of reasons. When companies and suppliers from a particular sector are
interconnected in geographically proximate groups, i.e., clusters, efficiency is heightened, greater
opportunities for innovation in processes and products are created, and barriers to entry for new firms are
reduced. Individual firms’ advanced operations and strategies (branding, marketing, distribution, advanced
production processes, and the production of unique and sophisticated products) spill over into the economy
and lead to sophisticated and modern business processes across the country’s business sectors. The speed and
pervasiveness of technology diffusion, absorption and use throughout the economy is particularly important
for productivity. OECD research suggests that frontier technologies do not immediately diffuse to all firms.
Instead, they are first adopted by national frontier firms, and only diffuse to laggards once they are tested by
the leaders and adapted to country specific circumstances. As a technologically advanced economy, domestic
innovation, as opposed to imitation, increases in importance for Ireland.
17 IMF Working Paper, Reassessing the Productivity Gains from Trade Liberalization, 2016 18 ECB Working Paper 1823, Financial constraints and productivity: evidence from euro area companies, 2015
14 January 2017
2 Methodologies, Definitions and Scope
2.1. Methodologies
Measures of productivity are important barometers of the competitiveness of firms, sectors and economies.
Productivity is defined as a ratio between the output volume and the volume of inputs. In other words, it
measures how efficiently production inputs, such as labour and capital, are being used in an economy to
produce a given level of output. Accurately measuring productivity is a complex task. In deriving estimates of
productivity at national, sector, industry or firm level, both output and input data need to be assessed. There
are a number of ways to quantify and assess productivity performance. In general, productivity may be
considered in terms of single and multi-factor productivity measures. Single factor measures are those where
output is considered in relation to a single measure of input, such as, labour or capital. Multifactor productivity
measures relate output to a number of inputs, for example, capital, labour and intermediate inputs, such as,
energy and business services. The variables involved such as output, value-added, hours worked and changes
in capital stock are conceptually complicated. In addition, the data sources tend to use a mix of administrative,
survey and national accounts data.
While national accounts are the preferred source for productivity measurement, a caveat with the available
figures from an Irish perspective is that they tend to be based on Gross Domestic Product (GDP)19, which can
be particularly problematic for measuring economic activity in highly globalised economies such as Ireland.
Revisions to the 2015 National Income and Expenditure accounts in July 2016 led to an upgrade of the 2015
GDP growth to 26.3 per cent and GNP to 18.7 per cent. These revisions, which are in line with ESA2010 and
BPM6 methodology, are largely related to relocation of multinational companies to Ireland and the resulting
larger net exports contributions.
Various commentators have stated these revised figures are not reflective of actual economic activity taking
place in Ireland. Instead, these developments reflect the statistical ‘on-shoring’ of economic activity
associated with an increase in the size of the Irish capital stock arising from corporate restructuring and
balance sheet reclassification in the multinational sector, and also growth in aircraft leasing activity. As a
result, National Accounts data now include a very significant amount of activity carried out elsewhere, but
formally recorded as part of Irish GDP and GNP. Consequently, metrics derived from these measures, such as
GDP per hour worked require careful consideration, in particular when undertaking international comparisons.
A number of sources of data exist on international productivity developments that cover Ireland, however
unlike other jurisdictions (e.g. the UK’s Office of National Statistics), an authoritative set of national statistics
at the domestic level is not produced in Ireland. (See Box 2.1). The Conference Board’s Total Economy
Database (TED), Organisation for Economic Co-operation and Development (OECD), Eurostat and European
Central Bank (ECB) provide estimates of annual data covering Gross Domestic Product (GDP), employment,
hours worked, and using these it is possible to estimate productivity performance. However, across all of these
datasets issues arise regarding base years, price deflators, currency and exchange rates, constant and current
prices and disaggregation of performance by economic activity and hours worked. As outlined in Figure 2.1.1
there are discrepancies between international productivity datasets in terms of measurements, base years and
definitions used.
19 Gross Domestic Product (GDP) and Gross National Product (GNP) are closely related measures. GDP measures the total output of the economy in a period i.e. the value of work done by employees, companies and self-employed persons. This work generates incomes but not all of the incomes earned in the economy remain the property of residents (and residents may earn some income abroad). The total income remaining with Irish residents is the GNP and it differs from GDP by the net amount of incomes sent to or received from abroad. In Ireland's case, for many years past, the amount belonging to persons
abroad has exceeded the amount received from abroad, due mainly to the profits of foreign-owned companies, and our GNP is, therefore, less than our GDP.
15 January 2017
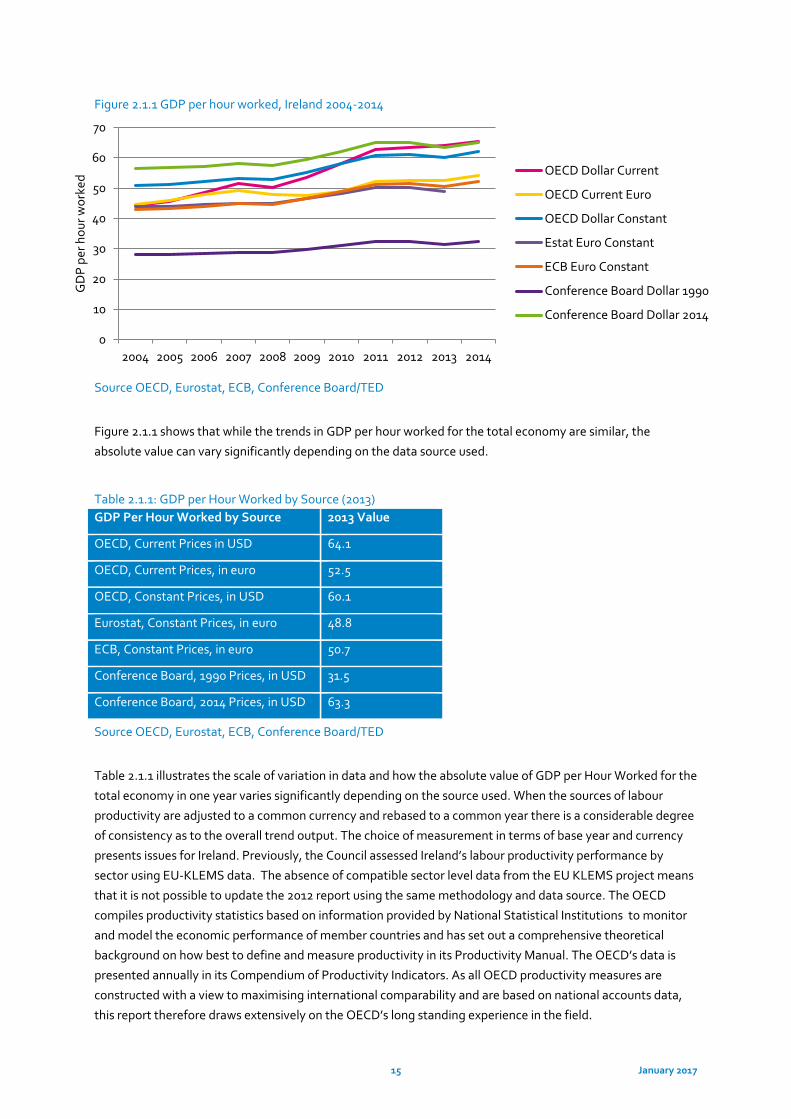
Figure 2.1.1 GDP per hour worked, Ireland 2004-2014
Source OECD, Eurostat, ECB, Conference Board/TED
Figure 2.1.1 shows that while the trends in GDP per hour worked for the total economy are similar, the
absolute value can vary significantly depending on the data source used.
Table 2.1.1: GDP per Hour Worked by Source (2013) GDP Per Hour Worked by Source 2013 Value
OECD, Current Prices in USD 64.1
OECD, Current Prices, in euro 52.5
OECD, Constant Prices, in USD 60.1
Eurostat, Constant Prices, in euro 48.8
ECB, Constant Prices, in euro 50.7
Conference Board, 1990 Prices, in USD 31.5
Conference Board, 2014 Prices, in USD 63.3
Source OECD, Eurostat, ECB, Conference Board/TED
Table 2.1.1 illustrates the scale of variation in data and how the absolute value of GDP per Hour Worked for the
total economy in one year varies significantly depending on the source used. When the sources of labour
productivity are adjusted to a common currency and rebased to a common year there is a considerable degree
of consistency as to the overall trend output. The choice of measurement in terms of base year and currency
presents issues for Ireland. Previously, the Council assessed Ireland’s labour productivity performance by
sector using EU-KLEMS data. The absence of compatible sector level data from the EU KLEMS project means
that it is not possible to update the 2012 report using the same methodology and data source. The OECD
compiles productivity statistics based on information provided by National Statistical Institutions to monitor
and model the economic performance of member countries and has set out a comprehensive theoretical
background on how best to define and measure productivity in its Productivity Manual. The OECD’s data is
presented annually in its Compendium of Productivity Indicators. As all OECD productivity measures are
constructed with a view to maximising international comparability and are based on national accounts data,
this report therefore draws extensively on the OECD’s long standing experience in the field.
0
10
20
30
40
50
60
70
2004 2005 2006 2007 2008 2009 2010 2011 2012 2013 2014
GD
P pe
r hou
r wor
ked OECD Dollar Current
OECD Current Euro
OECD Dollar Constant
Estat Euro Constant
ECB Euro Constant
Conference Board Dollar 1990
Conference Board Dollar 2014
16 January 2017
2.2. Definitions
The following section sets out the main definitions used throughout this report drawing on the OECD’s
Measuring Productivity Manual.
Output
Output is a key methodological consideration of particular relevance at sectoral and firm level. Productivity
analysis distinguishes between productivity measures that consider movements of output in terms of gross
output and those which use a gross value-added concept. Measures of output include total economic output,
gross domestic product and value added; inputs include labour and capital. Gross Domestic Product (GDP) and
Gross Value Added (GVA) are both compiled from National Accounts data based on a common conceptual
framework which almost all OECD countries follow in the compilation of their accounts. GVA is the value of
output less the value of intermediate consumption (i.e., the difference between the value of goods and
services produced and the cost of raw materials and other inputs used in production). It is a measure of the
contribution to GDP made by an individual producer, industry or sector. The choice is largely dependent on
whether the productivity measure relates only to primary inputs (such as labour and capital) or intermediate
inputs (such as materials, energy and business services). In general the OECD concludes that when only
primary inputs are involved then GVA should be used as this does not include intermediate consumption.
Labour productivity
Measures of labour productivity show how productively labour is used to generate gross output or value
added. Expressed as a ratio, it represents the volume of output produced per unit of labour input. Labour
productivity may be calculated in terms of either output per person employed (Gross Domestic Product and
Value Added) or output per hour worked. The OECD define hours worked as “Hours actually worked reflect
regular hours worked by full-time and part-time workers, paid and unpaid overtime, hours worked in
additional jobs, excluding time not worked because of public holidays, annual paid leaves, strikes and labour
disputes, bad weather, economic conditions and other reasons”. Labour input is defined as total hours worked
by all persons engaged in production i.e. employees plus self-employed, broken down by sector. The OECD
consider labour input is most appropriately measured as the total number of hours actually worked, this is,
effectively used in production, whether paid or not (System of National Accounts 2008).
Capital productivity
Capital productivity is a measure of how effectively capital is used to generate output or value added. Capital
productivity reflects the combined influence of labour, intermediate inputs, technical change, and efficiency
change, economies of scale, capacity utilisation and measurement errors. It is defined as the ratio between the
volume of output, measured as GDP, and the volume of capital input, defined as the flow of productive
services that capital delivers in production, i.e. capital services. Capital services refer to the flow of productive
services provided by an asset used in production. Capital services reflect a (physical) quantity, and are
considered the appropriate measure of capital input by the OECD.
Multifactor productivity
Multifactor productivity (MFP), also referred to as Total Factor Productivity, is measured as a residual, i.e. that
part of output growth that cannot be explained by growth in labour and capital inputs. It reflects the overall
efficiency with which labour and capital inputs are used together in the production process. Changes in MFP
reflect the effects of changes in management practices, brand names, organisational change, general
knowledge, network effects, spill overs from production factors, adjustment costs, economies of scale, the
17 January 2017
effects of (imperfect) competition and measurement errors. In simple terms therefore, if labour and capital
inputs remain unchanged between two periods, any changes in output reflect changes in MFP.
Sectoral data
Macro level productivity data is supplemented with a range of benchmarks of key sectors broken down by
NACE Rev. 2 classification. Data are provided for the total economy and individual sectors.
A –Agriculture, Forestry and Fishing
C – Manufacturing
F – Construction
G– I Wholesale and Retail trade; repair of motor vehicles and motorcycles; H – Transportation and
storage; I – Accommodation and food service activities;
J – Information and communication (ICT);
K – Financial and insurance activities;
M – Professional, scientific and technical activities; N-Administrative and Secretarial support activities
Activities that are generally often provided by non-market producers such as public sector activities are
excluded. According to the OECD “this reflects the fact that non-market activities are measured on a sum-of-
costs approach in current prices, with an implicit imputation made for labour productivity growth (usually
zero) for volume estimates, together with an assumption of zero net operating surplus”20. The analysis of Irish
productivity trends at sectoral level in this report draws on the OECD and complimentary CSO datasets.
International comparisons
To facilitate international comparisons of labour productivity levels over time, GDP in national currency and at
current prices are converted to a common currency by the OECD (US dollars), using constant (2010)
Purchasing Power Parities (PPPs). In productivity analysis there are advantages and disadvantages in using
either the current or constant PPP approach. The OECD considers that in comparing differences in
productivity growth across countries, the constant PPP approach is best applied as this method ensures the
price structure is constant and changes in output are determined by changes in volume rather than price as
prices do not vary over time. It should be noted that in the analysis of sectors set out in Chapter 5 that data on
output per hour at sectoral level is only presented for Ireland. This is because the OECD provides international
comparisons of indices and growth rates of sectoral productivity but not the levels. This is due to the absence
of reliable industry-level PPPs, which are needed to carry out cross-country comparisons. Subject to data
availability, in this report, Ireland’s national productivity performance from 2004 to 2014 and at the sectoral
level is considered, drawing extensively on OECD productivity and national accounts data. Where possible,
and subject to data availability, Ireland’s performance is compared with the following:
The Euro area 19 as a key trading partner and representative of Ireland’s economic peer group;
The US, as the source of much inward and outward direct investment, an important trading partner and
traditional global leader in productivity growth;
The UK, as a key trading partner and competitor for foreign direct investment;
Denmark, as a relatively small but globalised small advanced European economy.
20 OECD Compendium of Productivity Indicators, 2016
18 January 2017
A number of sources of data exist on international productivity developments (OECD, Conference Board, EU KLEMS), however unlike other jurisdictions (e.g. the UK ONS), an authoritative set of national statistics at the domestic level is not produced in Ireland
Box 2. 1: Irish Productivity Data
In depth analysis of Ireland’s performance is severely limited by the absence of comprehensive, sectoral level and
firm level data. Evidenced based policy making relies on the availability of data to identify issues, devise
responses and assess progress.
In the Council’s 2015 Competitiveness Challenge, the Council recommended that the potential to develop and
publish a comprehensive productivity dataset should be explored by the CSO. Such an exercise should consider
measures of labour (both overall and on a per hour worked basis), capital and total factor productivity. Data is
required for both productivity levels and growth rates, and data should be disaggregated to the degree possible
to identify sectoral trends. Such a dataset should draw on existing CSO data.
The Department of Finance and the Department of Jobs, Enterprise and Innovation have engaged with the
Central Statistics Office to develop and publish a comprehensive national productivity dataset, as a priority. This
would allow the various practitioners to delve into the detail of the proposed compendium and develop a clear
roadmap to ensure that the final product is as comprehensive and robust as possible, and meets the needs of all
interested parties.
19 January 2017
3. Labour Productivity Performance 2004-2014
3.1 Overview
This chapter outlines Ireland’s national labour productivity levels and growth rates from 2004 – 2014 with
reference to the US, UK, Denmark and Euro area.
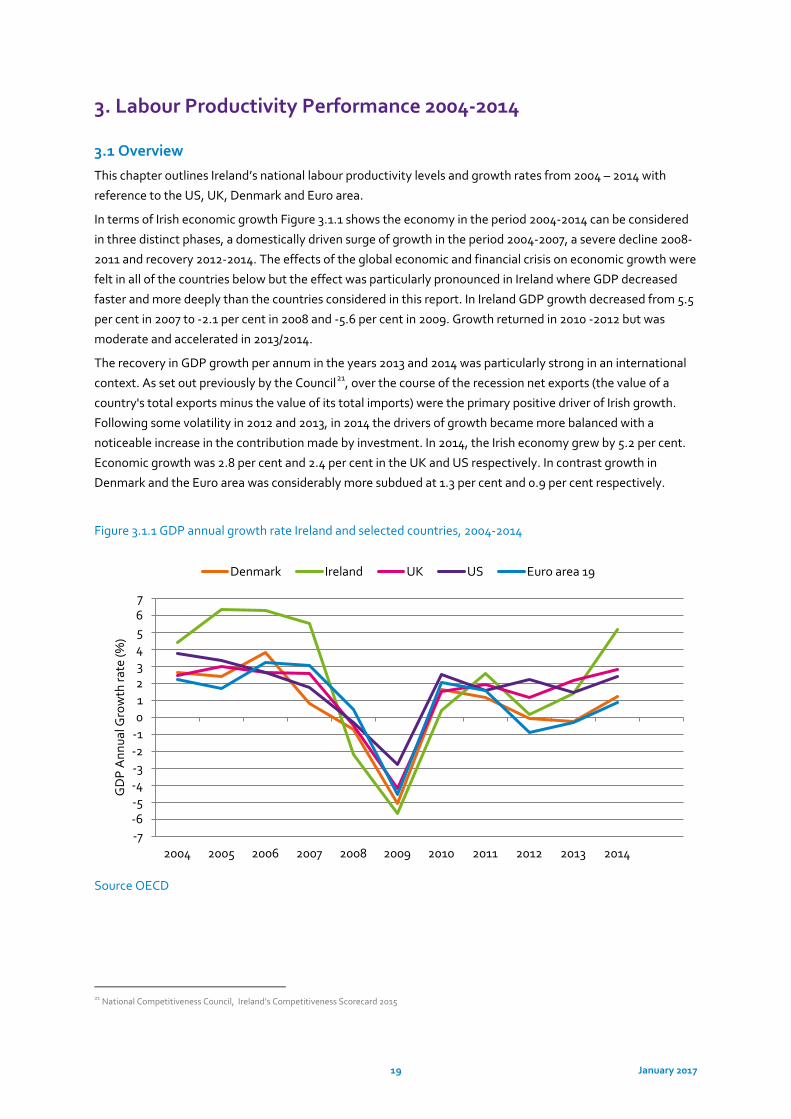
In terms of Irish economic growth Figure 3.1.1 shows the economy in the period 2004-2014 can be considered
in three distinct phases, a domestically driven surge of growth in the period 2004-2007, a severe decline 2008-
2011 and recovery 2012-2014. The effects of the global economic and financial crisis on economic growth were
felt in all of the countries below but the effect was particularly pronounced in Ireland where GDP decreased
faster and more deeply than the countries considered in this report. In Ireland GDP growth decreased from 5.5
per cent in 2007 t0 -2.1 per cent in 2008 and -5.6 per cent in 2009. Growth returned in 2010 -2012 but was
moderate and accelerated in 2013/2014.
The recovery in GDP growth per annum in the years 2013 and 2014 was particularly strong in an international
context. As set out previously by the Council21, over the course of the recession net exports (the value of a
country's total exports minus the value of its total imports) were the primary positive driver of Irish growth.
Following some volatility in 2012 and 2013, in 2014 the drivers of growth became more balanced with a
noticeable increase in the contribution made by investment. In 2014, the Irish economy grew by 5.2 per cent.
Economic growth was 2.8 per cent and 2.4 per cent in the UK and US respectively. In contrast growth in
Denmark and the Euro area was considerably more subdued at 1.3 per cent and 0.9 per cent respectively.
Figure 3.1.1 GDP annual growth rate Ireland and selected countries, 2004-2014
Source OECD
21 National Competitiveness Council, Ireland’s Competitiveness Scorecard 2015
-7-6-5-4-3-2-101234567
2004 2005 2006 2007 2008 2009 2010 2011 2012 2013 2014
GD
P A
nnua
l Gro
wth
rate
(%)
Denmark Ireland UK US Euro area 19
20 January 2017
3.2 Productivity and the Economic Cycle in Ireland
The factors driving productivity growth over time are difficult to measure and growth can be cyclical and
counter cyclical depending on the drivers of economic growth in individual countries. The economic cycle and
more generally trends in the composition of value added and employment – can have a significant effect on
measured productivity levels. This is particularly relevant for understanding the apparent improvement in
Ireland’s productivity performance. Previous NCC research22 set out how the downturn in the economic cycle
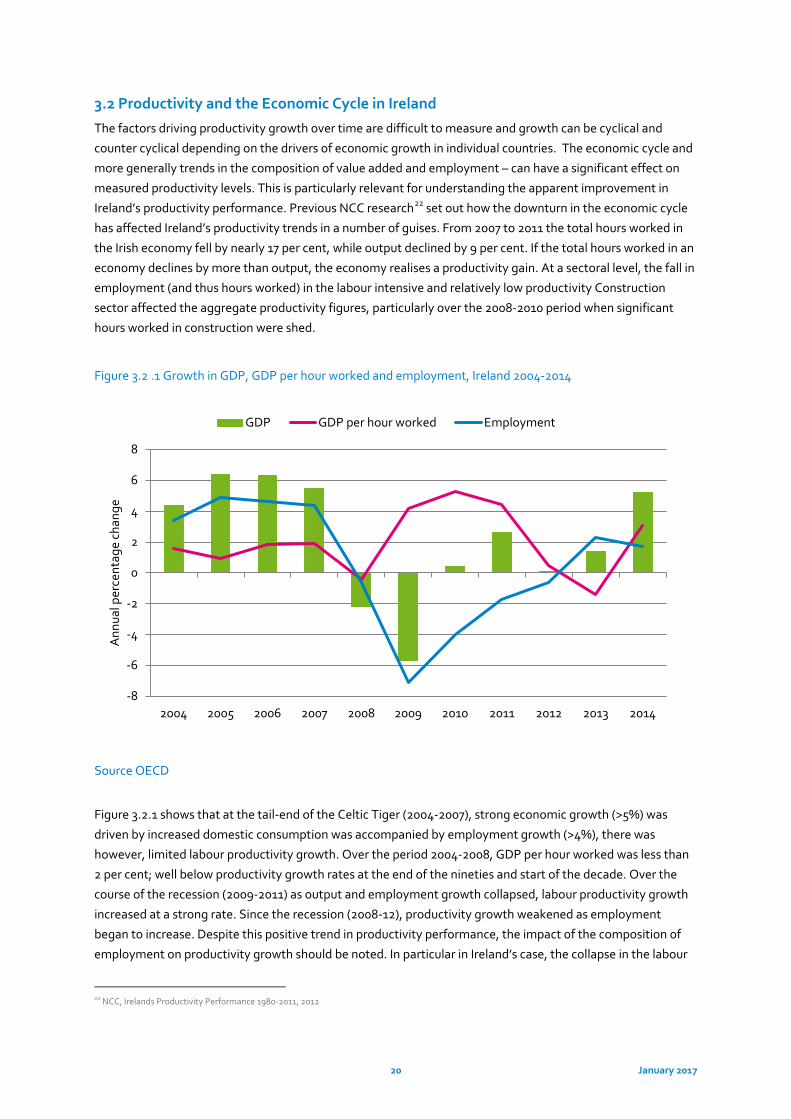
has affected Ireland’s productivity trends in a number of guises. From 2007 to 2011 the total hours worked in
the Irish economy fell by nearly 17 per cent, while output declined by 9 per cent. If the total hours worked in an
economy declines by more than output, the economy realises a productivity gain. At a sectoral level, the fall in
employment (and thus hours worked) in the labour intensive and relatively low productivity Construction
sector affected the aggregate productivity figures, particularly over the 2008-2010 period when significant
hours worked in construction were shed.
Figure 3.2 .1 Growth in GDP, GDP per hour worked and employment, Ireland 2004-2014
Source OECD
Figure 3.2.1 shows that at the tail-end of the Celtic Tiger (2004-2007), strong economic growth (>5%) was
driven by increased domestic consumption was accompanied by employment growth (>4%), there was
however, limited labour productivity growth. Over the period 2004-2008, GDP per hour worked was less than
2 per cent; well below productivity growth rates at the end of the nineties and start of the decade. Over the
course of the recession (2009-2011) as output and employment growth collapsed, labour productivity growth
increased at a strong rate. Since the recession (2008-12), productivity growth weakened as employment
began to increase. Despite this positive trend in productivity performance, the impact of the composition of
employment on productivity growth should be noted. In particular in Ireland’s case, the collapse in the labour
22 NCC, Irelands Productivity Performance 1980-2011, 2012
-8
-6
-4
-2
0
2
4
6
8
2004 2005 2006 2007 2008 2009 2010 2011 2012 2013 2014
Ann
ual p
erce
ntag
e ch
ange
GDP GDP per hour worked Employment
21 January 2017
intensive Construction sector and Ireland’s growing base of multinationals in high value added sectors
(particularly in the Pharma and ICT sectors ) disguises to a degree underperforming sectors and boosts
Ireland’s per capita productivity levels .
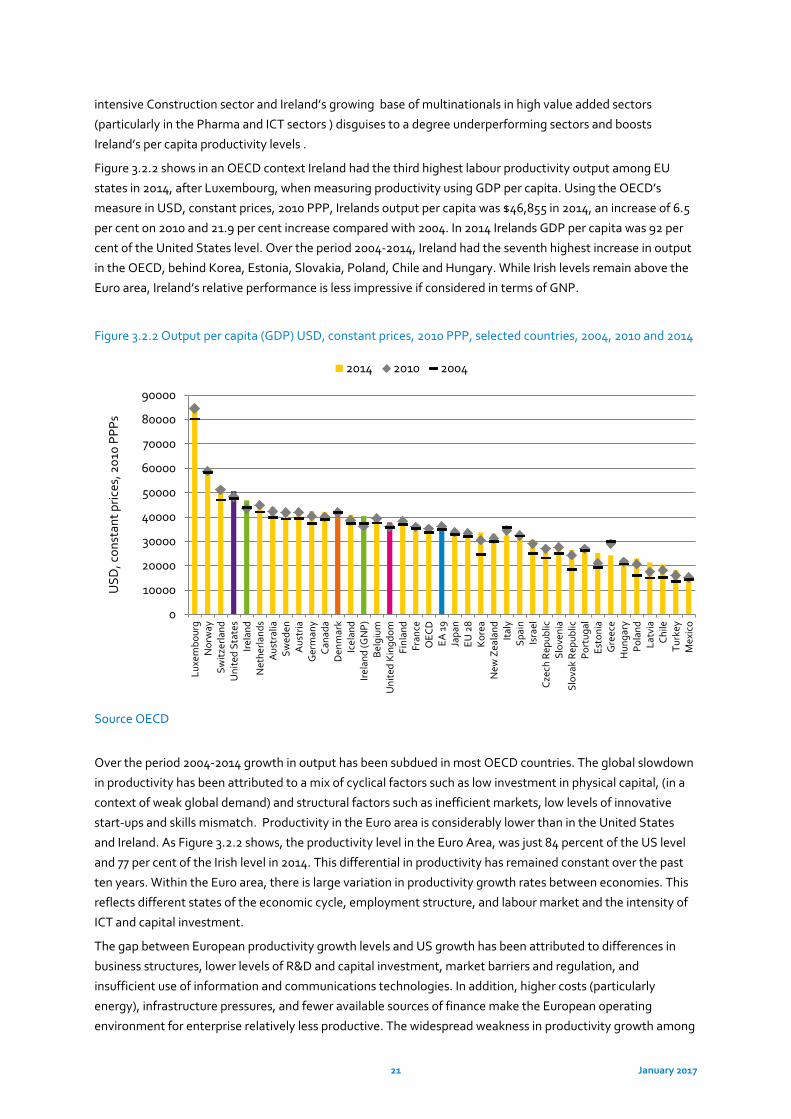
Figure 3.2.2 shows in an OECD context Ireland had the third highest labour productivity output among EU
states in 2014, after Luxembourg, when measuring productivity using GDP per capita. Using the OECD’s
measure in USD, constant prices, 2010 PPP, Irelands output per capita was $46,855 in 2014, an increase of 6.5
per cent on 2010 and 21.9 per cent increase compared with 2004. In 2014 Irelands GDP per capita was 92 per
cent of the United States level. Over the period 2004-2014, Ireland had the seventh highest increase in output
in the OECD, behind Korea, Estonia, Slovakia, Poland, Chile and Hungary. While Irish levels remain above the
Euro area, Ireland’s relative performance is less impressive if considered in terms of GNP.
Figure 3.2.2 Output per capita (GDP) USD, constant prices, 2010 PPP, selected countries, 2004, 2010 and 2014
Source OECD
Over the period 2004-2014 growth in output has been subdued in most OECD countries. The global slowdown
in productivity has been attributed to a mix of cyclical factors such as low investment in physical capital, (in a
context of weak global demand) and structural factors such as inefficient markets, low levels of innovative
start-ups and skills mismatch. Productivity in the Euro area is considerably lower than in the United States
and Ireland. As Figure 3.2.2 shows, the productivity level in the Euro Area, was just 84 percent of the US level
and 77 per cent of the Irish level in 2014. This differential in productivity has remained constant over the past
ten years. Within the Euro area, there is large variation in productivity growth rates between economies. This
reflects different states of the economic cycle, employment structure, and labour market and the intensity of
ICT and capital investment.
The gap between European productivity growth levels and US growth has been attributed to differences in
business structures, lower levels of R&D and capital investment, market barriers and regulation, and
insufficient use of information and communications technologies. In addition, higher costs (particularly
energy), infrastructure pressures, and fewer available sources of finance make the European operating
environment for enterprise relatively less productive. The widespread weakness in productivity growth among
0
10000
20000
30000
40000
50000
60000
70000
80000
90000
Luxe
mbo
urg
Nor
way
Switz
erla
ndU
nite
d St
ates
Irela
ndN
ethe
rland
sA
ustr
alia
Swed
enA
ustr
iaG
erm
any
Cana
daD
enm
ark
Icel
and
Irela
nd (G
NP)
Belg
ium
Uni
ted
Kin
gdom
Finl
and
Fran
ceO
ECD
EA 1
9Ja
pan
EU 2
8K
orea
New
Zea
land
Italy
Spai
nIs
rael
Czec
h Re
publ
icSl
oven
iaSl
ovak
Rep
ublic
Port
ugal
Esto
nia
Gre
ece
Hun
gary
Pola
ndLa
tvia
Chile
Turk
eyM
exic
o
USD
, con
stan
t pric
es, 2
010
PPPs
2014 2010 2004
22 January 2017
major European countries points to an inability to translate technology and innovation to productivity growth,
weak demand and low investment as well as an increased negative impact of structural rigidities in labour,
capital, and product markets. France and Germany have higher productivity levels than the Euro Area average
at 97 and 94 percent of the United States, respectively, while economies such as Spain and Italy only reach 77
percent and 76 percent, respectively. UK productivity is significantly below the levels recorded in Ireland and
the US, as well as other large economies such as France and Germany.
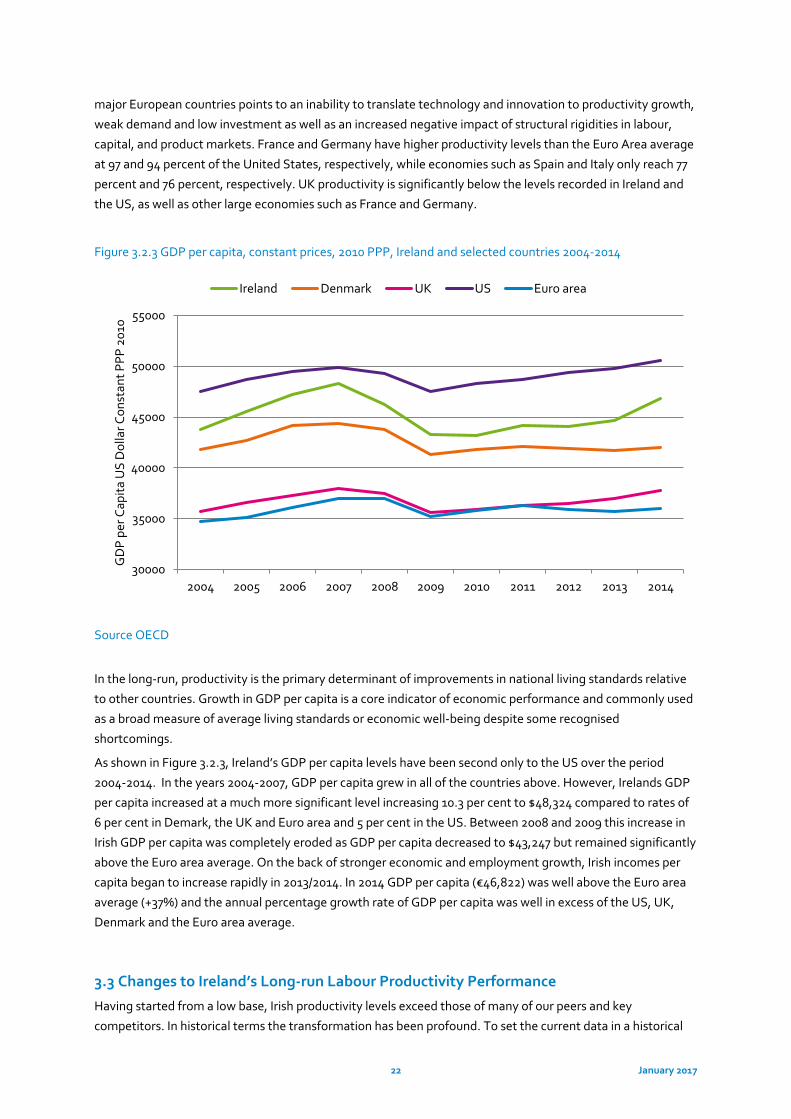
Figure 3.2.3 GDP per capita, constant prices, 2010 PPP, Ireland and selected countries 2004-2014
Source OECD
In the long-run, productivity is the primary determinant of improvements in national living standards relative
to other countries. Growth in GDP per capita is a core indicator of economic performance and commonly used
as a broad measure of average living standards or economic well-being despite some recognised
shortcomings.
As shown in Figure 3.2.3, Ireland’s GDP per capita levels have been second only to the US over the period
2004-2014. In the years 2004-2007, GDP per capita grew in all of the countries above. However, Irelands GDP
per capita increased at a much more significant level increasing 10.3 per cent to $48,324 compared to rates of
6 per cent in Demark, the UK and Euro area and 5 per cent in the US. Between 2008 and 2009 this increase in
Irish GDP per capita was completely eroded as GDP per capita decreased to $43,247 but remained significantly
above the Euro area average. On the back of stronger economic and employment growth, Irish incomes per
capita began to increase rapidly in 2013/2014. In 2014 GDP per capita (€46,822) was well above the Euro area
average (+37%) and the annual percentage growth rate of GDP per capita was well in excess of the US, UK,
Denmark and the Euro area average.
3.3 Changes to Ireland’s Long-run Labour Productivity Performance
Having started from a low base, Irish productivity levels exceed those of many of our peers and key
competitors. In historical terms the transformation has been profound. To set the current data in a historical
30000
35000
40000
45000
50000
55000
2004 2005 2006 2007 2008 2009 2010 2011 2012 2013 2014
GD
P pe
r Cap
ita U
S D
olla
r Con
stan
t PPP
201
0
Ireland Denmark UK US Euro area
23 January 2017
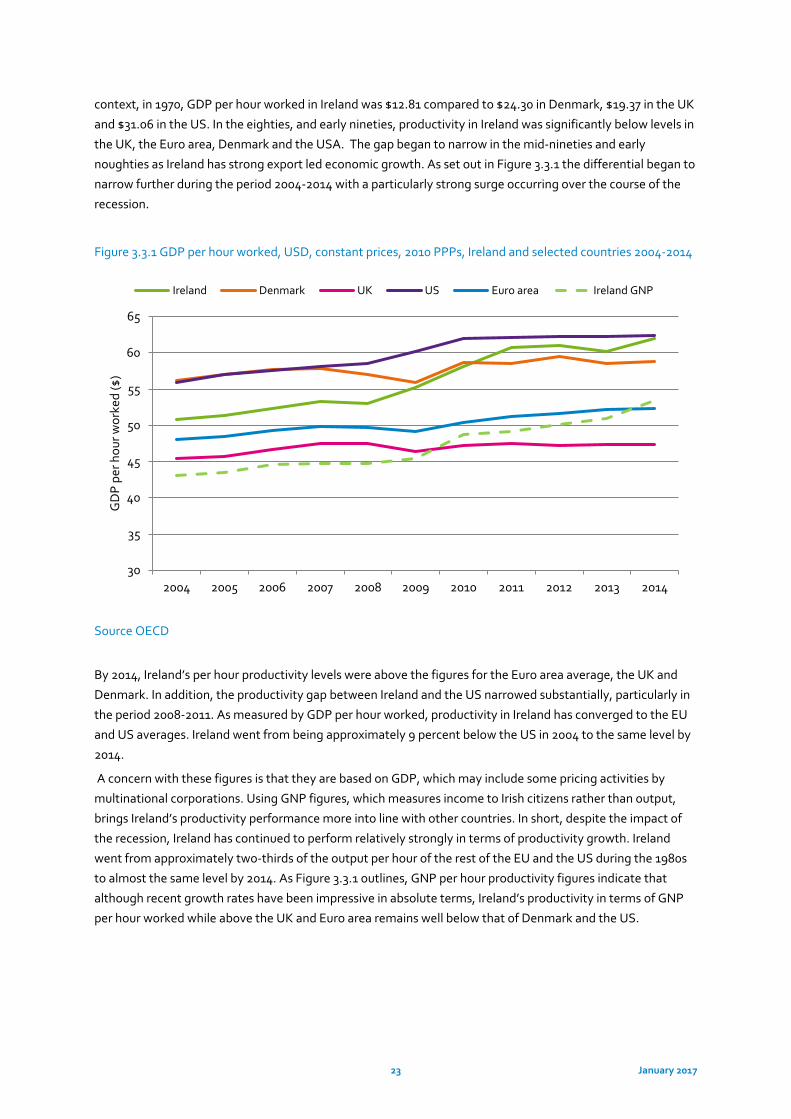
context, in 1970, GDP per hour worked in Ireland was $12.81 compared to $24.30 in Denmark, $19.37 in the UK
and $31.06 in the US. In the eighties, and early nineties, productivity in Ireland was significantly below levels in
the UK, the Euro area, Denmark and the USA. The gap began to narrow in the mid-nineties and early
noughties as Ireland has strong export led economic growth. As set out in Figure 3.3.1 the differential began to
narrow further during the period 2004-2014 with a particularly strong surge occurring over the course of the
recession.
Figure 3.3.1 GDP per hour worked, USD, constant prices, 2010 PPPs, Ireland and selected countries 2004-2014
Source OECD
Source OECD
By 2014, Ireland’s per hour productivity levels were above the figures for the Euro area average, the UK and
Denmark. In addition, the productivity gap between Ireland and the US narrowed substantially, particularly in
the period 2008-2011. As measured by GDP per hour worked, productivity in Ireland has converged to the EU
and US averages. Ireland went from being approximately 9 percent below the US in 2004 to the same level by
2014.
A concern with these figures is that they are based on GDP, which may include some pricing activities by
multinational corporations. Using GNP figures, which measures income to Irish citizens rather than output,
brings Ireland’s productivity performance more into line with other countries. In short, despite the impact of
the recession, Ireland has continued to perform relatively strongly in terms of productivity growth. Ireland
went from approximately two-thirds of the output per hour of the rest of the EU and the US during the 1980s
to almost the same level by 2014. As Figure 3.3.1 outlines, GNP per hour productivity figures indicate that
although recent growth rates have been impressive in absolute terms, Ireland’s productivity in terms of GNP
per hour worked while above the UK and Euro area remains well below that of Denmark and the US.
30
35
40
45
50
55
60
65
2004 2005 2006 2007 2008 2009 2010 2011 2012 2013 2014
GD
P pe
r hou
r wor
ked
($)
Ireland Denmark UK US Euro area Ireland GNP
24 January 2017
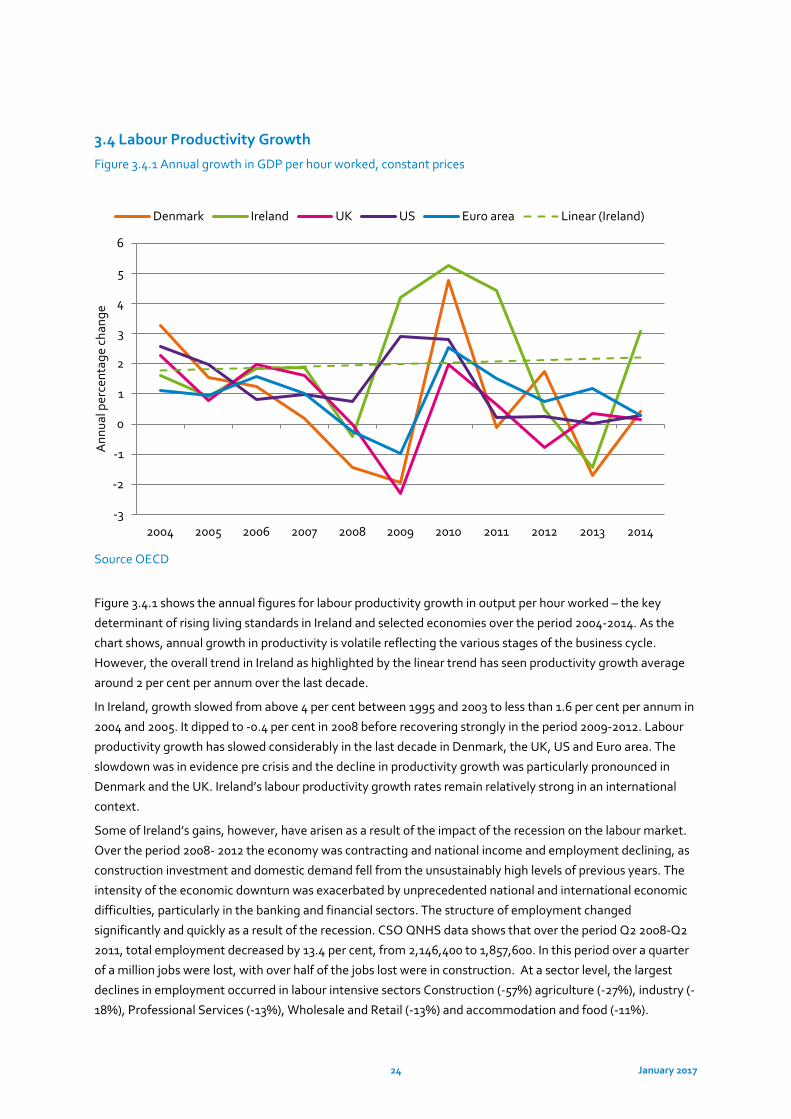
3.4 Labour Productivity Growth
Figure 3.4.1 Annual growth in GDP per hour worked, constant prices
Source OECD
Figure 3.4.1 shows the annual figures for labour productivity growth in output per hour worked – the key
determinant of rising living standards in Ireland and selected economies over the period 2004-2014. As the
chart shows, annual growth in productivity is volatile reflecting the various stages of the business cycle.
However, the overall trend in Ireland as highlighted by the linear trend has seen productivity growth average
around 2 per cent per annum over the last decade.
In Ireland, growth slowed from above 4 per cent between 1995 and 2003 to less than 1.6 per cent per annum in
2004 and 2005. It dipped to -0.4 per cent in 2008 before recovering strongly in the period 2009-2012. Labour
productivity growth has slowed considerably in the last decade in Denmark, the UK, US and Euro area. The
slowdown was in evidence pre crisis and the decline in productivity growth was particularly pronounced in
Denmark and the UK. Ireland’s labour productivity growth rates remain relatively strong in an international
context.
Some of Ireland’s gains, however, have arisen as a result of the impact of the recession on the labour market.
Over the period 2008- 2012 the economy was contracting and national income and employment declining, as
construction investment and domestic demand fell from the unsustainably high levels of previous years. The
intensity of the economic downturn was exacerbated by unprecedented national and international economic
difficulties, particularly in the banking and financial sectors. The structure of employment changed
significantly and quickly as a result of the recession. CSO QNHS data shows that over the period Q2 2008-Q2
2011, total employment decreased by 13.4 per cent, from 2,146,400 to 1,857,600. In this period over a quarter
of a million jobs were lost, with over half of the jobs lost were in construction. At a sector level, the largest
declines in employment occurred in labour intensive sectors Construction (-57%) agriculture (-27%), industry (-
18%), Professional Services (-13%), Wholesale and Retail (-13%) and accommodation and food (-11%).
-3
-2
-1
0
1
2
3
4
5
6
2004 2005 2006 2007 2008 2009 2010 2011 2012 2013 2014
Ann
ual p
erce
ntag
e ch
ange
Denmark Ireland UK US Euro area Linear (Ireland)
25 January 2017
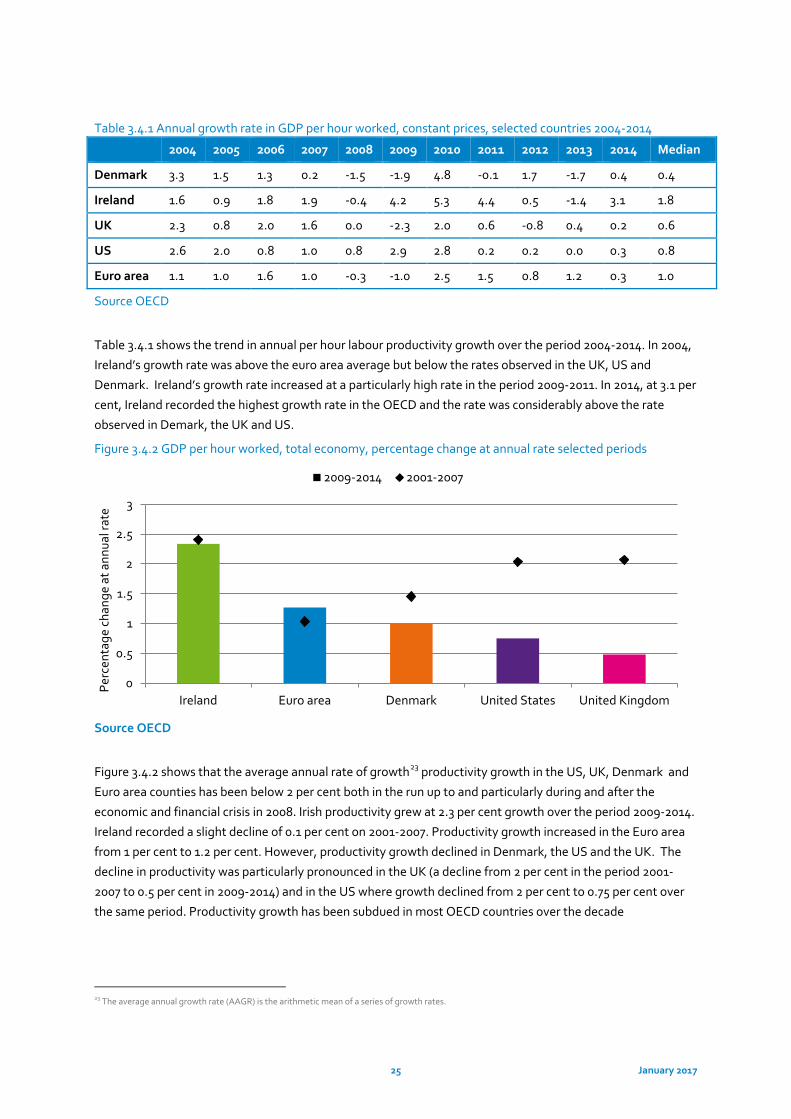
Table 3.4.1 Annual growth rate in GDP per hour worked, constant prices, selected countries 2004-2014
2004 2005 2006 2007 2008 2009 2010 2011 2012 2013 2014 Median
Denmark 3.3 1.5 1.3 0.2 -1.5 -1.9 4.8 -0.1 1.7 -1.7 0.4 0.4
Ireland 1.6 0.9 1.8 1.9 -0.4 4.2 5.3 4.4 0.5 -1.4 3.1 1.8
UK 2.3 0.8 2.0 1.6 0.0 -2.3 2.0 0.6 -0.8 0.4 0.2 0.6
US 2.6 2.0 0.8 1.0 0.8 2.9 2.8 0.2 0.2 0.0 0.3 0.8
Euro area 1.1 1.0 1.6 1.0 -0.3 -1.0 2.5 1.5 0.8 1.2 0.3 1.0
Source OECD
Table 3.4.1 shows the trend in annual per hour labour productivity growth over the period 2004-2014. In 2004,
Ireland’s growth rate was above the euro area average but below the rates observed in the UK, US and
Denmark. Ireland’s growth rate increased at a particularly high rate in the period 2009-2011. In 2014, at 3.1 per
cent, Ireland recorded the highest growth rate in the OECD and the rate was considerably above the rate
observed in Demark, the UK and US.
Figure 3.4.2 GDP per hour worked, total economy, percentage change at annual rate selected periods
Source OECD
Figure 3.4.2 shows that the average annual rate of growth23 productivity growth in the US, UK, Denmark and
Euro area counties has been below 2 per cent both in the run up to and particularly during and after the
economic and financial crisis in 2008. Irish productivity grew at 2.3 per cent growth over the period 2009-2014.
Ireland recorded a slight decline of 0.1 per cent on 2001-2007. Productivity growth increased in the Euro area
from 1 per cent to 1.2 per cent. However, productivity growth declined in Denmark, the US and the UK. The
decline in productivity was particularly pronounced in the UK (a decline from 2 per cent in the period 2001-
2007 to 0.5 per cent in 2009-2014) and in the US where growth declined from 2 per cent to 0.75 per cent over
the same period. Productivity growth has been subdued in most OECD countries over the decade
23 The average annual growth rate (AAGR) is the arithmetic mean of a series of growth rates.
0
0.5
1
1.5
2
2.5
3
Ireland Euro area Denmark United States United Kingdom
Perc
enta
ge c
hang
e at
ann
ual r
ate
2009-2014 2001-2007
26 January 2017
4. Trends in Employment and Hours Worked 2004-2014
4.1 Overview
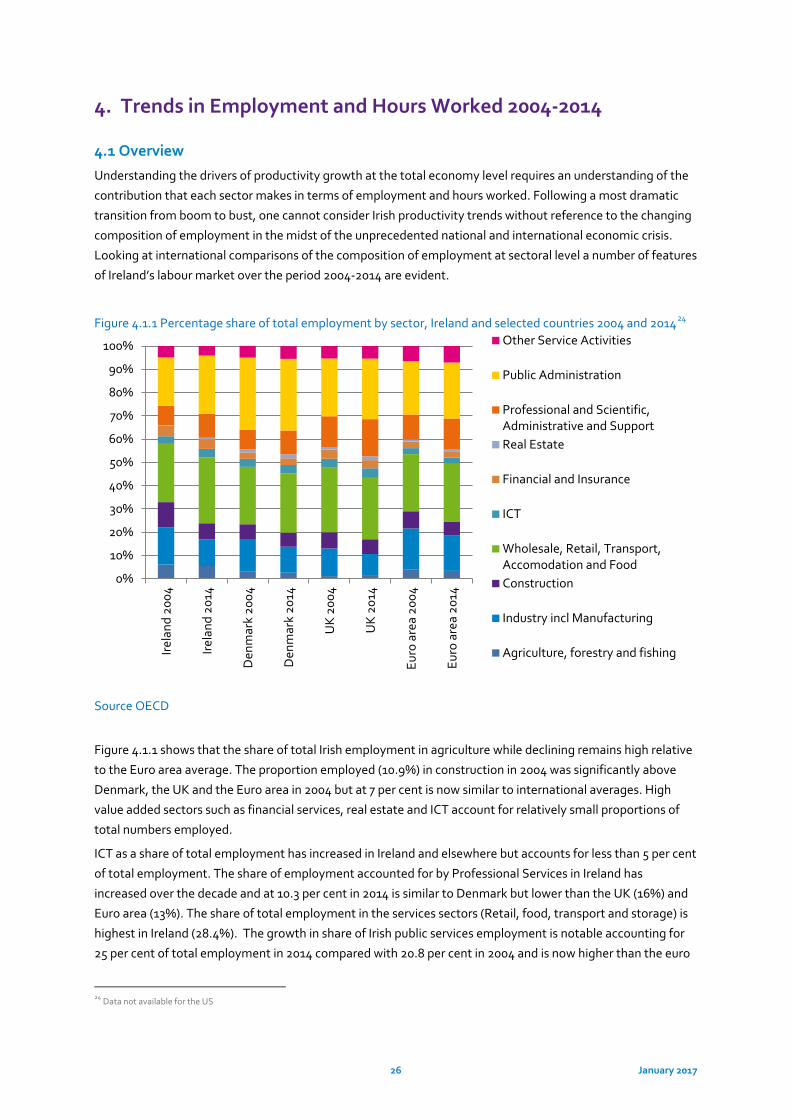
Understanding the drivers of productivity growth at the total economy level requires an understanding of the
contribution that each sector makes in terms of employment and hours worked. Following a most dramatic
transition from boom to bust, one cannot consider Irish productivity trends without reference to the changing
composition of employment in the midst of the unprecedented national and international economic crisis.
Looking at international comparisons of the composition of employment at sectoral level a number of features
of Ireland’s labour market over the period 2004-2014 are evident.
Figure 4.1.1 Percentage share of total employment by sector, Ireland and selected countries 2004 and 201424
Source OECD
Figure 4.1.1 shows that the share of total Irish employment in agriculture while declining remains high relative
to the Euro area average. The proportion employed (10.9%) in construction in 2004 was significantly above
Denmark, the UK and the Euro area in 2004 but at 7 per cent is now similar to international averages. High
value added sectors such as financial services, real estate and ICT account for relatively small proportions of
total numbers employed.
ICT as a share of total employment has increased in Ireland and elsewhere but accounts for less than 5 per cent
of total employment. The share of employment accounted for by Professional Services in Ireland has
increased over the decade and at 10.3 per cent in 2014 is similar to Denmark but lower than the UK (16%) and
Euro area (13%). The share of total employment in the services sectors (Retail, food, transport and storage) is
highest in Ireland (28.4%). The growth in share of Irish public services employment is notable accounting for
25 per cent of total employment in 2014 compared with 20.8 per cent in 2004 and is now higher than the euro
24 Data not available for the US
0%
10%
20%
30%
40%
50%
60%
70%
80%
90%
100%
Irela
nd 2
004
Irela
nd 2
014
Den
mar
k 20
04
Den
mar
k 20
14
UK
200
4
UK
201
4
Euro
are
a 20
04
Euro
are
a 20
14
Other Service Activities
Public Administration
Professional and Scientific,Administrative and SupportReal Estate
Financial and Insurance
ICT
Wholesale, Retail, Transport,Accomodation and FoodConstruction
Industry incl Manufacturing
Agriculture, forestry and fishing
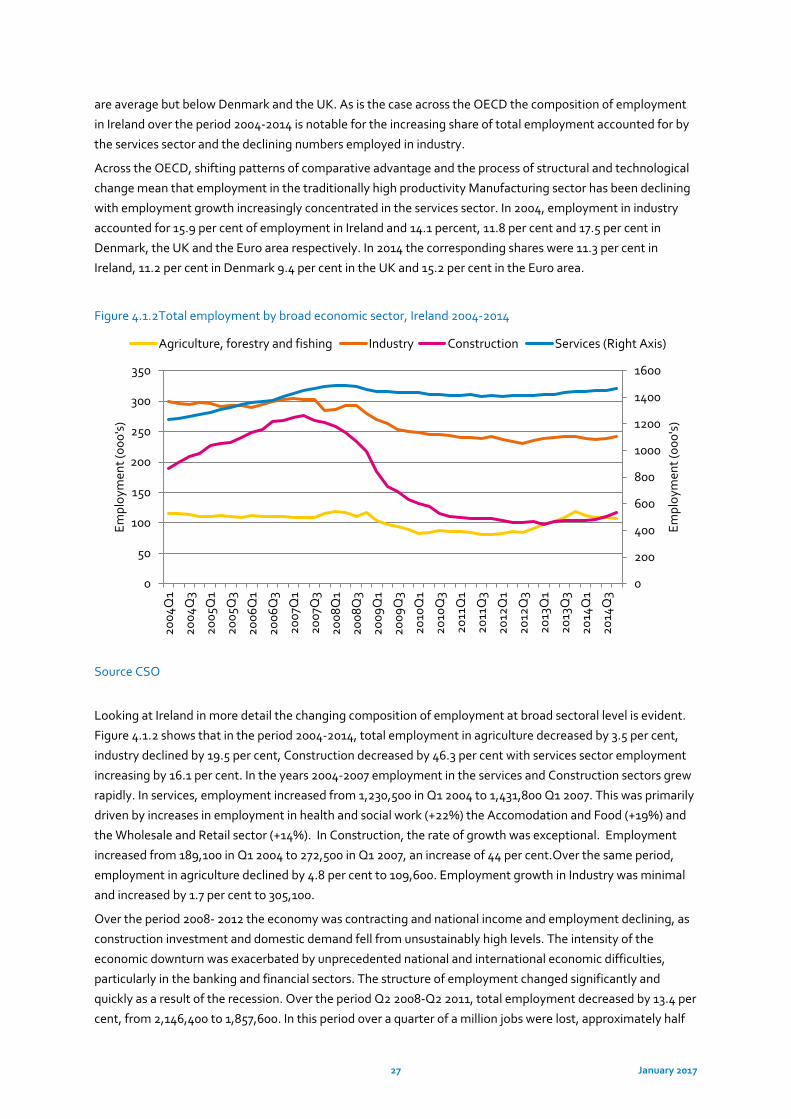
27 January 2017
are average but below Denmark and the UK. As is the case across the OECD the composition of employment
in Ireland over the period 2004-2014 is notable for the increasing share of total employment accounted for by
the services sector and the declining numbers employed in industry.
Across the OECD, shifting patterns of comparative advantage and the process of structural and technological
change mean that employment in the traditionally high productivity Manufacturing sector has been declining
with employment growth increasingly concentrated in the services sector. In 2004, employment in industry
accounted for 15.9 per cent of employment in Ireland and 14.1 percent, 11.8 per cent and 17.5 per cent in
Denmark, the UK and the Euro area respectively. In 2014 the corresponding shares were 11.3 per cent in
Ireland, 11.2 per cent in Denmark 9.4 per cent in the UK and 15.2 per cent in the Euro area.
Figure 4.1.2Total employment by broad economic sector, Ireland 2004-2014
Source CSO
Looking at Ireland in more detail the changing composition of employment at broad sectoral level is evident.
Figure 4.1.2 shows that in the period 2004-2014, total employment in agriculture decreased by 3.5 per cent,
industry declined by 19.5 per cent, Construction decreased by 46.3 per cent with services sector employment
increasing by 16.1 per cent. In the years 2004-2007 employment in the services and Construction sectors grew
rapidly. In services, employment increased from 1,230,500 in Q1 2004 to 1,431,800 Q1 2007. This was primarily
driven by increases in employment in health and social work (+22%) the Accomodation and Food (+19%) and
the Wholesale and Retail sector (+14%). In Construction, the rate of growth was exceptional. Employment
increased from 189,100 in Q1 2004 to 272,500 in Q1 2007, an increase of 44 per cent.Over the same period,
employment in agriculture declined by 4.8 per cent to 109,600. Employment growth in Industry was minimal
and increased by 1.7 per cent to 305,100.
Over the period 2008- 2012 the economy was contracting and national income and employment declining, as
construction investment and domestic demand fell from unsustainably high levels. The intensity of the
economic downturn was exacerbated by unprecedented national and international economic difficulties,
particularly in the banking and financial sectors. The structure of employment changed significantly and
quickly as a result of the recession. Over the period Q2 2008-Q2 2011, total employment decreased by 13.4 per
cent, from 2,146,400 to 1,857,600. In this period over a quarter of a million jobs were lost, approximately half
0
200
400
600
800
1000
1200
1400
1600
0
50
100
150
200
250
300
350
2004
Q1
2004
Q3
2005
Q1
2005
Q3
2006
Q1
2006
Q3
2007
Q1
2007
Q3
2008
Q1
2008
Q3
2009
Q1
2009
Q3
2010
Q1
2010
Q3
2011
Q1
2011
Q3
2012
Q1
2012
Q3
2013
Q1
2013
Q3
2014
Q1
2014
Q3
Empl
oym
ent (
000'
s)
Empl
oym
ent (
000'
s)
Agriculture, forestry and fishing Industry Construction Services (Right Axis)
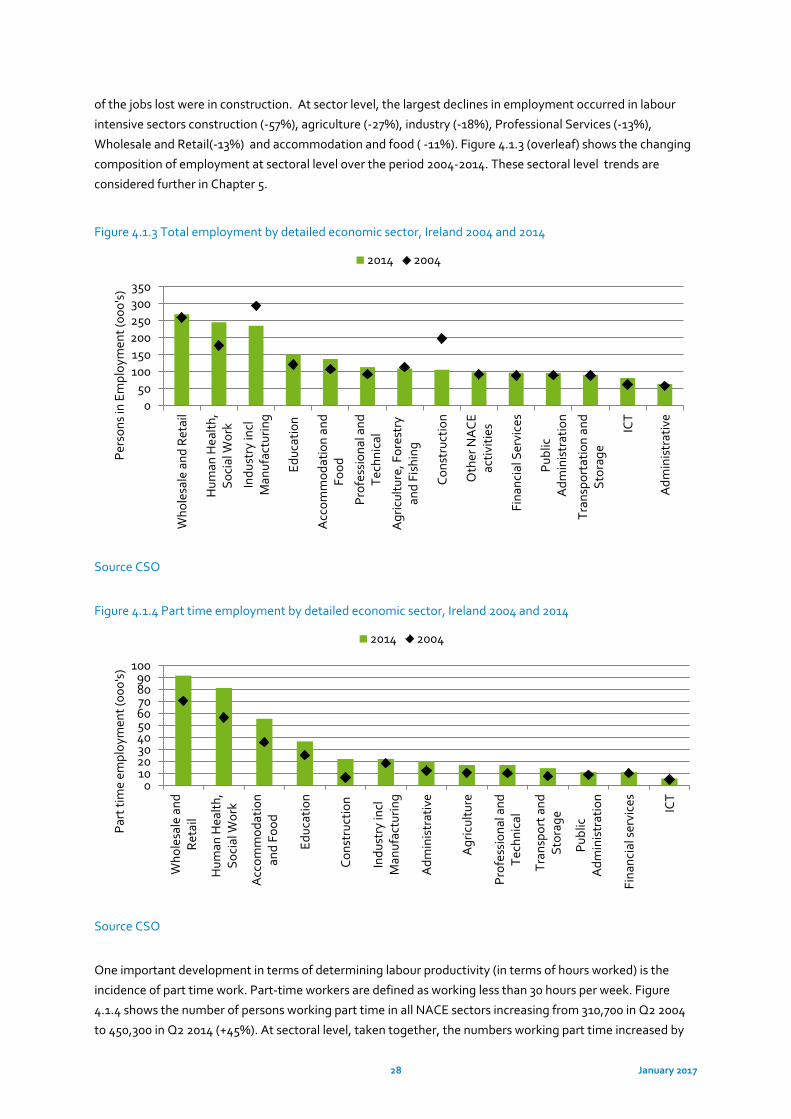
28 January 2017
of the jobs lost were in construction. At sector level, the largest declines in employment occurred in labour
intensive sectors construction (-57%), agriculture (-27%), industry (-18%), Professional Services (-13%),
Wholesale and Retail(-13%) and accommodation and food ( -11%). Figure 4.1.3 (overleaf) shows the changing
composition of employment at sectoral level over the period 2004-2014. These sectoral level trends are
considered further in Chapter 5.
Figure 4.1.3 Total employment by detailed economic sector, Ireland 2004 and 2014
Source CSO
Figure 4.1.4 Part time employment by detailed economic sector, Ireland 2004 and 2014
Source CSO
One important development in terms of determining labour productivity (in terms of hours worked) is the
incidence of part time work. Part-time workers are defined as working less than 30 hours per week. Figure
4.1.4 shows the number of persons working part time in all NACE sectors increasing from 310,700 in Q2 2004
to 450,300 in Q2 2014 (+45%). At sectoral level, taken together, the numbers working part time increased by
050
100150200250300350
Who
lesa
le a
nd R
etai
l
Hum
an H
ealth
,So
cial
Wor
k
Indu
stry
incl
Man
ufac
turin
g
Educ
atio
n
Acc
omm
odat
ion
and
Food
Prof
essi
onal
and
Tech
nica
l
Agr
icul
ture
, For
estr
yan
d Fi
shin
g
Cons
truc
tion
Oth
er N
ACE
activ
ities
Fina
ncia
l Ser
vice
s
Publ
icA
dmin
istr
atio
n
Tran
spor
tatio
n an
dSt
orag
e
ICT
Adm
inis
trat
ive
Pers
ons
in E
mpl
oym
ent (
000'
s)
2014 2004
0102030405060708090
100
Who
lesa
le a
ndRe
tail
Hum
an H
ealth
,So
cial
Wor
k
Acc
omm
odat
ion
and
Food
Educ
atio
n
Cons
truc
tion
Indu
stry
incl
Man
ufac
turin
g
Adm
inis
trat
ive
Agr
icul
ture
Prof
essi
onal
and
Tech
nica
l
Tran
spor
t and
Stor
age
Publ
icA
dmin
istr
atio
n
Fina
ncia
l ser
vice
s
ICT
Part
tim
e em
ploy
men
t (00
0's)
2014 2004
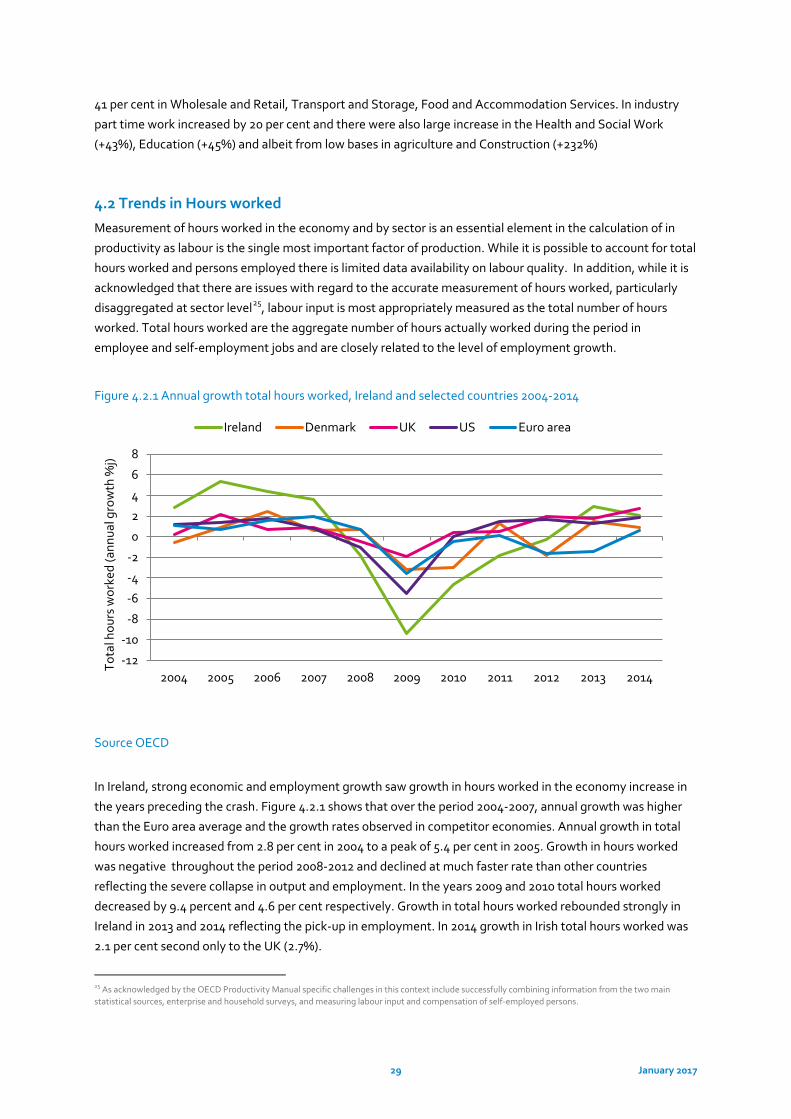
29 January 2017
41 per cent in Wholesale and Retail, Transport and Storage, Food and Accommodation Services. In industry
part time work increased by 20 per cent and there were also large increase in the Health and Social Work
(+43%), Education (+45%) and albeit from low bases in agriculture and Construction (+232%)
4.2 Trends in Hours worked
Measurement of hours worked in the economy and by sector is an essential element in the calculation of in
productivity as labour is the single most important factor of production. While it is possible to account for total
hours worked and persons employed there is limited data availability on labour quality. In addition, while it is
acknowledged that there are issues with regard to the accurate measurement of hours worked, particularly
disaggregated at sector level25, labour input is most appropriately measured as the total number of hours
worked. Total hours worked are the aggregate number of hours actually worked during the period in
employee and self-employment jobs and are closely related to the level of employment growth.
Figure 4.2.1 Annual growth total hours worked, Ireland and selected countries 2004-2014
Source OECD
Source OECD
In Ireland, strong economic and employment growth saw growth in hours worked in the economy increase in
the years preceding the crash. Figure 4.2.1 shows that over the period 2004-2007, annual growth was higher
than the Euro area average and the growth rates observed in competitor economies. Annual growth in total
hours worked increased from 2.8 per cent in 2004 to a peak of 5.4 per cent in 2005. Growth in hours worked
was negative throughout the period 2008-2012 and declined at much faster rate than other countries
reflecting the severe collapse in output and employment. In the years 2009 and 2010 total hours worked
decreased by 9.4 percent and 4.6 per cent respectively. Growth in total hours worked rebounded strongly in
Ireland in 2013 and 2014 reflecting the pick-up in employment. In 2014 growth in Irish total hours worked was
2.1 per cent second only to the UK (2.7%).
25 As acknowledged by the OECD Productivity Manual specific challenges in this context include successfully combining information from the two main statistical sources, enterprise and household surveys, and measuring labour input and compensation of self-employed persons.
-12
-10
-8
-6
-4
-2
0
2
4
6
8
2004 2005 2006 2007 2008 2009 2010 2011 2012 2013 2014
Tota
l hou
rs w
orke
d (a
nnua
l gro
wth
%j)
Ireland Denmark UK US Euro area
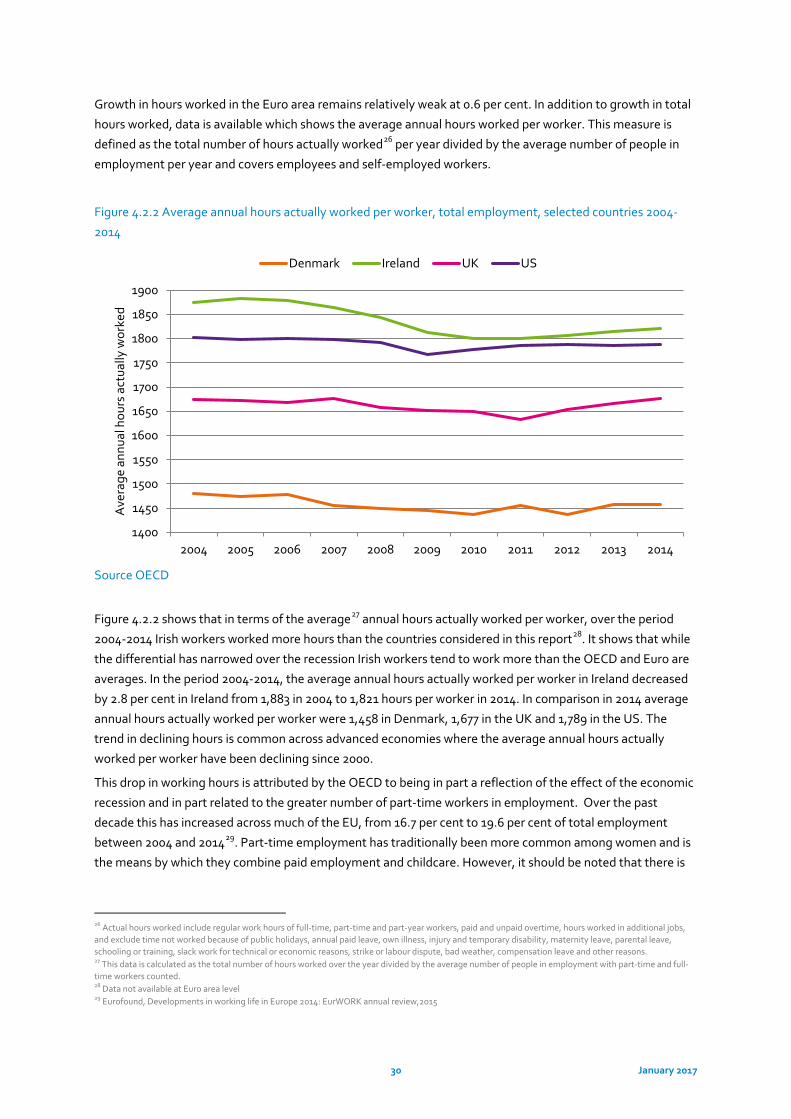
30 January 2017
Growth in hours worked in the Euro area remains relatively weak at 0.6 per cent. In addition to growth in total
hours worked, data is available which shows the average annual hours worked per worker. This measure is
defined as the total number of hours actually worked26 per year divided by the average number of people in
employment per year and covers employees and self-employed workers.
Figure 4.2.2 Average annual hours actually worked per worker, total employment, selected countries 2004-
2014
Source OECD
Figure 4.2.2 shows that in terms of the average27 annual hours actually worked per worker, over the period
2004-2014 Irish workers worked more hours than the countries considered in this report28. It shows that while
the differential has narrowed over the recession Irish workers tend to work more than the OECD and Euro are
averages. In the period 2004-2014, the average annual hours actually worked per worker in Ireland decreased
by 2.8 per cent in Ireland from 1,883 in 2004 to 1,821 hours per worker in 2014. In comparison in 2014 average
annual hours actually worked per worker were 1,458 in Denmark, 1,677 in the UK and 1,789 in the US. The
trend in declining hours is common across advanced economies where the average annual hours actually
worked per worker have been declining since 2000.
This drop in working hours is attributed by the OECD to being in part a reflection of the effect of the economic
recession and in part related to the greater number of part-time workers in employment. Over the past
decade this has increased across much of the EU, from 16.7 per cent to 19.6 per cent of total employment
between 2004 and 201429. Part-time employment has traditionally been more common among women and is
the means by which they combine paid employment and childcare. However, it should be noted that there is
26 Actual hours worked include regular work hours of full-time, part-time and part-year workers, paid and unpaid overtime, hours worked in additional jobs, and exclude time not worked because of public holidays, annual paid leave, own illness, injury and temporary disability, maternity leave, parental leave, schooling or training, slack work for technical or economic reasons, strike or labour dispute, bad weather, compensation leave and other reasons. 27 This data is calculated as the total number of hours worked over the year divided by the average number of people in employment with part-time and full-time workers counted. 28 Data not available at Euro area level 29 Eurofound, Developments in working life in Europe 2014: EurWORK annual review,2015
1400
1450
1500
1550
1600
1650
1700
1750
1800
1850
1900
2004 2005 2006 2007 2008 2009 2010 2011 2012 2013 2014
Ave
rage
ann
ual h
ours
act
ually
wor
ked
Denmark Ireland UK US
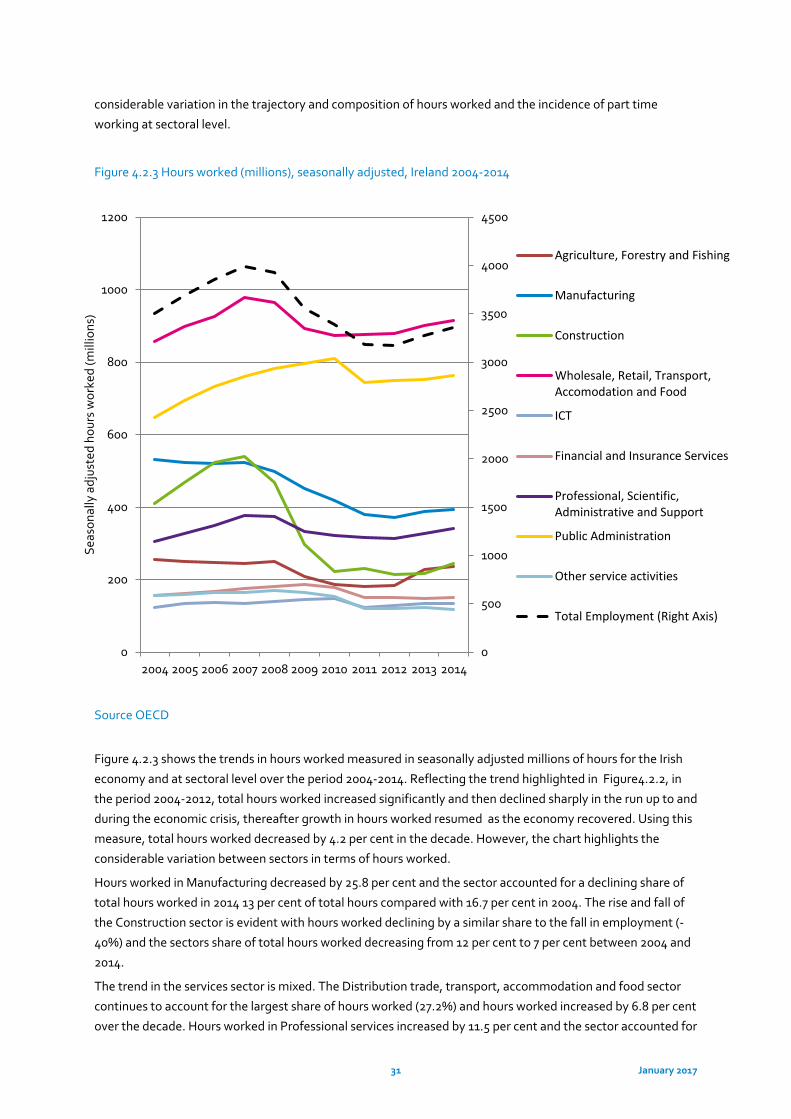
31 January 2017
considerable variation in the trajectory and composition of hours worked and the incidence of part time
working at sectoral level.
Figure 4.2.3 Hours worked (millions), seasonally adjusted, Ireland 2004-2014
Source OECD
Figure 4.2.3 shows the trends in hours worked measured in seasonally adjusted millions of hours for the Irish
economy and at sectoral level over the period 2004-2014. Reflecting the trend highlighted in Figure4.2.2, in
the period 2004-2012, total hours worked increased significantly and then declined sharply in the run up to and
during the economic crisis, thereafter growth in hours worked resumed as the economy recovered. Using this
measure, total hours worked decreased by 4.2 per cent in the decade. However, the chart highlights the
considerable variation between sectors in terms of hours worked.
Hours worked in Manufacturing decreased by 25.8 per cent and the sector accounted for a declining share of
total hours worked in 2014 13 per cent of total hours compared with 16.7 per cent in 2004. The rise and fall of
the Construction sector is evident with hours worked declining by a similar share to the fall in employment (-
40%) and the sectors share of total hours worked decreasing from 12 per cent to 7 per cent between 2004 and
2014.
The trend in the services sector is mixed. The Distribution trade, transport, accommodation and food sector
continues to account for the largest share of hours worked (27.2%) and hours worked increased by 6.8 per cent
over the decade. Hours worked in Professional services increased by 11.5 per cent and the sector accounted for
0
500
1000
1500
2000
2500
3000
3500
4000
4500
0
200
400
600
800
1000
1200
2004 2005 2006 2007 2008 2009 2010 2011 2012 2013 2014
Seas
onal
ly a
djus
ted
hour
s w
orke
d (m
illio
ns)
Agriculture, Forestry and Fishing
Manufacturing
Construction
Wholesale, Retail, Transport,Accomodation and Food
ICT
Financial and Insurance Services
Professional, Scientific,Administrative and Support
Public Administration
Other service activities
Total Employment (Right Axis)

32 January 2017
10.1 per cent of hours worked in 2014 (+1.4%). Hours worked in ICT increased by 9.6 per cent and the sector
accounted for a relatively small and static share of total hours worked (4.5%). The significant increase in hours
worked in the broad public services sector is notable with hours worked increasing by 25 per cent in the period
2004-2010 and the sectors share of total hours worked increasing from 18.5 per cent to 22.8 per cent over the
decade to 2014.
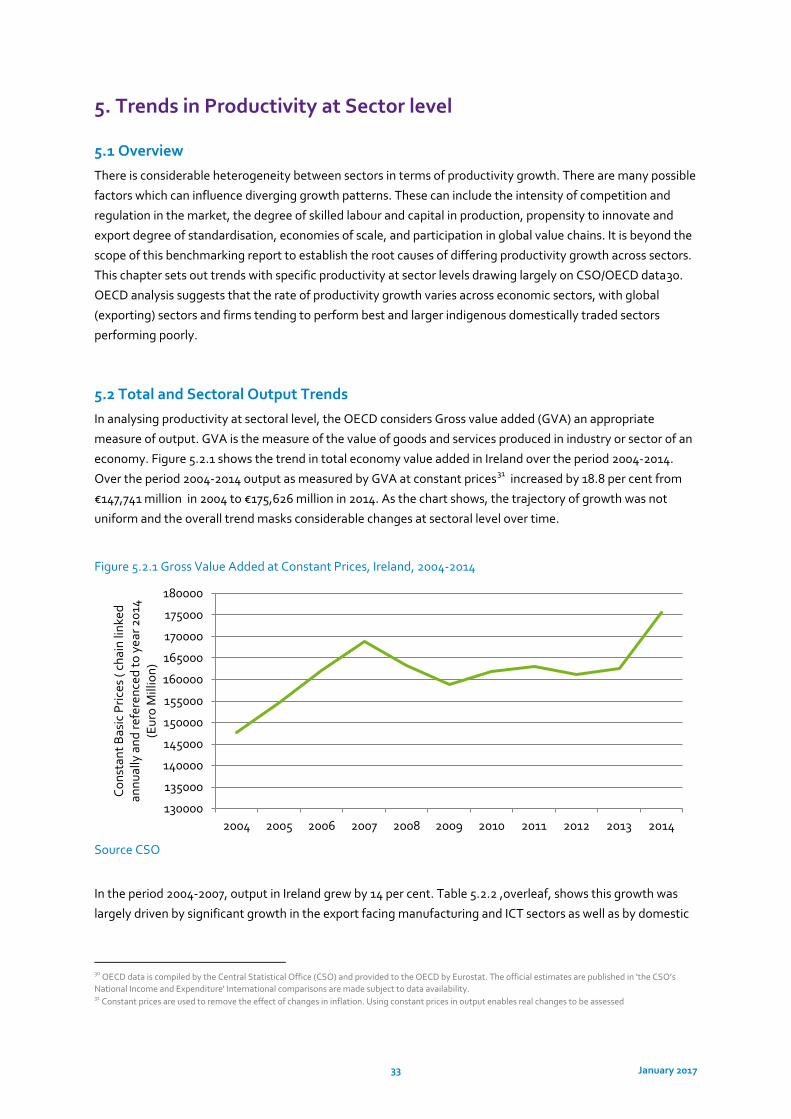
33 January 2017
5. Trends in Productivity at Sector level
5.1 Overview
There is considerable heterogeneity between sectors in terms of productivity growth. There are many possible
factors which can influence diverging growth patterns. These can include the intensity of competition and
regulation in the market, the degree of skilled labour and capital in production, propensity to innovate and
export degree of standardisation, economies of scale, and participation in global value chains. It is beyond the
scope of this benchmarking report to establish the root causes of differing productivity growth across sectors.
This chapter sets out trends with specific productivity at sector levels drawing largely on CSO/OECD data30.
OECD analysis suggests that the rate of productivity growth varies across economic sectors, with global
(exporting) sectors and firms tending to perform best and larger indigenous domestically traded sectors
performing poorly.
5.2 Total and Sectoral Output Trends
In analysing productivity at sectoral level, the OECD considers Gross value added (GVA) an appropriate
measure of output. GVA is the measure of the value of goods and services produced in industry or sector of an
economy. Figure 5.2.1 shows the trend in total economy value added in Ireland over the period 2004-2014.
Over the period 2004-2014 output as measured by GVA at constant prices31 increased by 18.8 per cent from
€147,741 million in 2004 to €175,626 million in 2014. As the chart shows, the trajectory of growth was not
uniform and the overall trend masks considerable changes at sectoral level over time.
Figure 5.2.1 Gross Value Added at Constant Prices, Ireland, 2004-2014
Source CSO
In the period 2004-2007, output in Ireland grew by 14 per cent. Table 5.2.2 ,overleaf, shows this growth was
largely driven by significant growth in the export facing manufacturing and ICT sectors as well as by domestic
30 OECD data is compiled by the Central Statistical Office (CSO) and provided to the OECD by Eurostat. The official estimates are published in 'the CSO’s National Income and Expenditure' International comparisons are made subject to data availability. 31 Constant prices are used to remove the effect of changes in inflation. Using constant prices in output enables real changes to be assessed
130000
135000
140000
145000
150000
155000
160000
165000
170000
175000
180000
2004 2005 2006 2007 2008 2009 2010 2011 2012 2013 2014
Cons
tant
Bas
ic P
rices
( ch
ain
linke
d an
nual
ly a
nd re
fere
nced
to y
ear 2
014
(Eur
o M
illio
n)
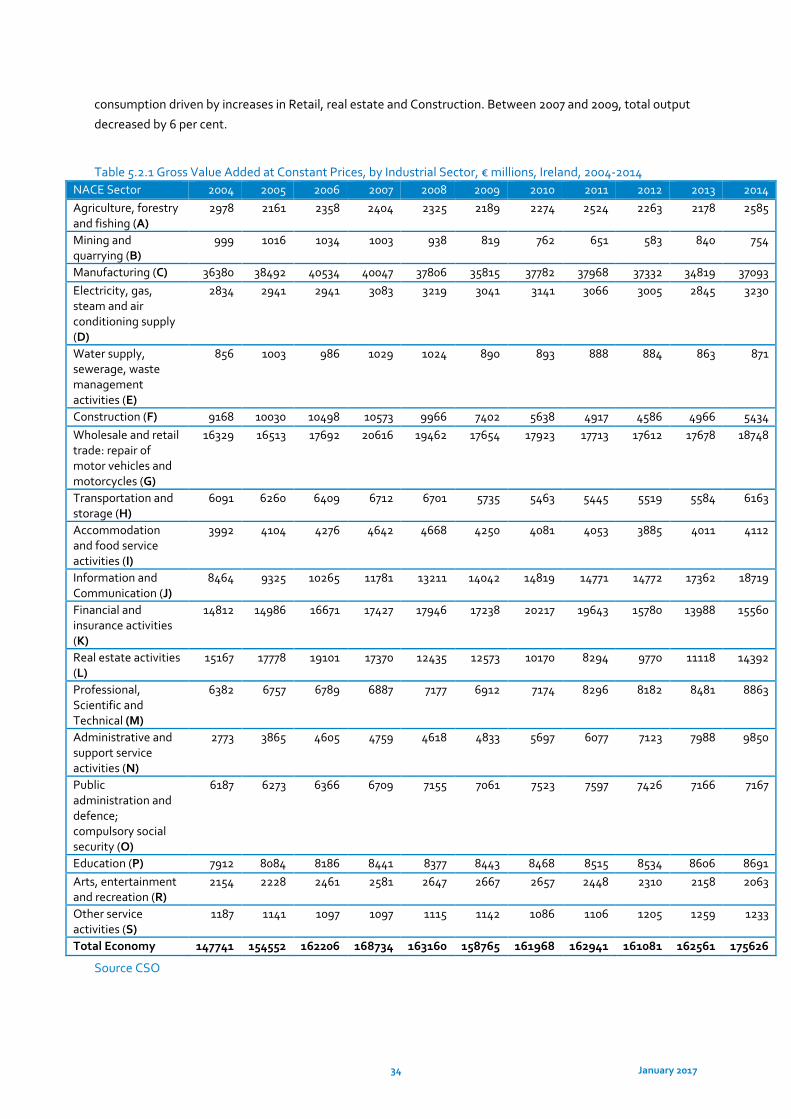
34 January 2017
consumption driven by increases in Retail, real estate and Construction. Between 2007 and 2009, total output
decreased by 6 per cent.
Table 5.2.1 Gross Value Added at Constant Prices, by Industrial Sector, € millions, Ireland, 2004-2014 NACE Sector 2004 2005 2006 2007 2008 2009 2010 2011 2012 2013 2014 Agriculture, forestry and fishing (A)
2978 2161 2358 2404 2325 2189 2274 2524 2263 2178 2585
Mining and quarrying (B)
999 1016 1034 1003 938 819 762 651 583 840 754
Manufacturing (C) 36380 38492 40534 40047 37806 35815 37782 37968 37332 34819 37093 Electricity, gas, steam and air conditioning supply (D)
2834 2941 2941 3083 3219 3041 3141 3066 3005 2845 3230
Water supply, sewerage, waste management activities (E)
856 1003 986 1029 1024 890 893 888 884 863 871
Construction (F) 9168 10030 10498 10573 9966 7402 5638 4917 4586 4966 5434 Wholesale and retail trade: repair of motor vehicles and motorcycles (G)
16329 16513 17692 20616 19462 17654 17923 17713 17612 17678 18748
Transportation and storage (H)
6091 6260 6409 6712 6701 5735 5463 5445 5519 5584 6163
Accommodation and food service activities (I)
3992 4104 4276 4642 4668 4250 4081 4053 3885 4011 4112
Information and Communication (J)
8464 9325 10265 11781 13211 14042 14819 14771 14772 17362 18719
Financial and insurance activities (K)
14812 14986 16671 17427 17946 17238 20217 19643 15780 13988 15560
Real estate activities (L)
15167 17778 19101 17370 12435 12573 10170 8294 9770 11118 14392
Professional, Scientific and Technical (M)
6382 6757 6789 6887 7177 6912 7174 8296 8182 8481 8863
Administrative and support service activities (N)
2773 3865 4605 4759 4618 4833 5697 6077 7123 7988 9850
Public administration and defence; compulsory social security (O)
6187 6273 6366 6709 7155 7061 7523 7597 7426 7166 7167
Education (P) 7912 8084 8186 8441 8377 8443 8468 8515 8534 8606 8691 Arts, entertainment and recreation (R)
2154 2228 2461 2581 2647 2667 2657 2448 2310 2158 2063
Other service activities (S)
1187 1141 1097 1097 1115 1142 1086 1106 1205 1259 1233
Total Economy 147741 154552 162206 168734 163160 158765 161968 162941 161081 162561 175626
Source CSO
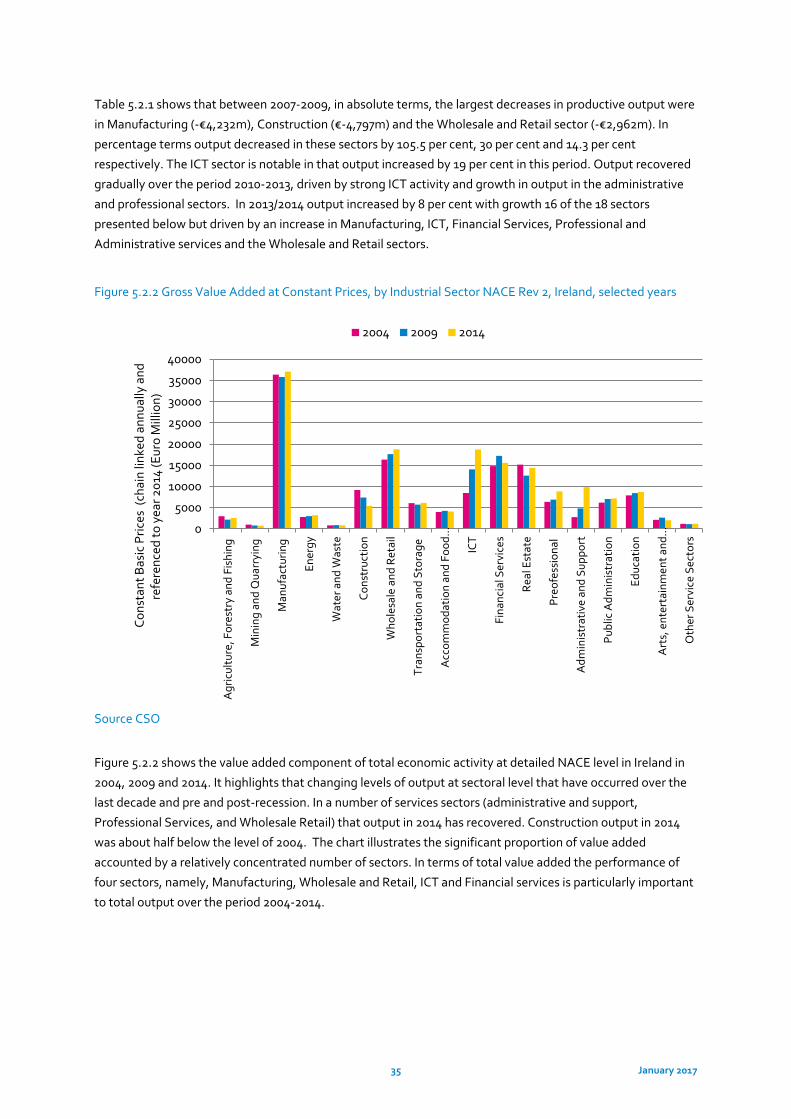
35 January 2017
Table 5.2.1 shows that between 2007-2009, in absolute terms, the largest decreases in productive output were
in Manufacturing (-€4,232m), Construction (€-4,797m) and the Wholesale and Retail sector (-€2,962m). In
percentage terms output decreased in these sectors by 105.5 per cent, 30 per cent and 14.3 per cent
respectively. The ICT sector is notable in that output increased by 19 per cent in this period. Output recovered
gradually over the period 2010-2013, driven by strong ICT activity and growth in output in the administrative
and professional sectors. In 2013/2014 output increased by 8 per cent with growth 16 of the 18 sectors
presented below but driven by an increase in Manufacturing, ICT, Financial Services, Professional and
Administrative services and the Wholesale and Retail sectors.
Figure 5.2.2 Gross Value Added at Constant Prices, by Industrial Sector NACE Rev 2, Ireland, selected years
Source CSO
Figure 5.2.2 shows the value added component of total economic activity at detailed NACE level in Ireland in
2004, 2009 and 2014. It highlights that changing levels of output at sectoral level that have occurred over the
last decade and pre and post-recession. In a number of services sectors (administrative and support,
Professional Services, and Wholesale Retail) that output in 2014 has recovered. Construction output in 2014
was about half below the level of 2004. The chart illustrates the significant proportion of value added
accounted by a relatively concentrated number of sectors. In terms of total value added the performance of
four sectors, namely, Manufacturing, Wholesale and Retail, ICT and Financial services is particularly important
to total output over the period 2004-2014.
0
5000
10000
15000
20000
25000
30000
35000
40000
Agr
icul
ture
, For
estr
y an
d Fi
shin
g
Min
ing
and
Qua
rryi
ng
Man
ufac
turin
g
Ener
gy
Wat
er a
nd W
aste
Cons
truc
tion
Who
lesa
le a
nd R
etai
l
Tran
spor
tatio
n an
d St
orag
e
Acc
omm
odat
ion
and
Food
…
ICT
Fina
ncia
l Ser
vice
s
Real
Est
ate
Preo
fess
iona
l
Adm
inis
trat
ive
and
Supp
ort
Publ
ic A
dmin
istr
atio
n
Educ
atio
n
Art
s, e
nter
tain
men
t and
…
Oth
er S
ervi
ce S
ecto
rs
Con
stan
t Bas
ic P
rices
(ch
ain
linke
d an
nual
ly a
nd
refe
renc
ed to
yea
r 201
4 (E
uro
Mill
ion)
2004 2009 2014
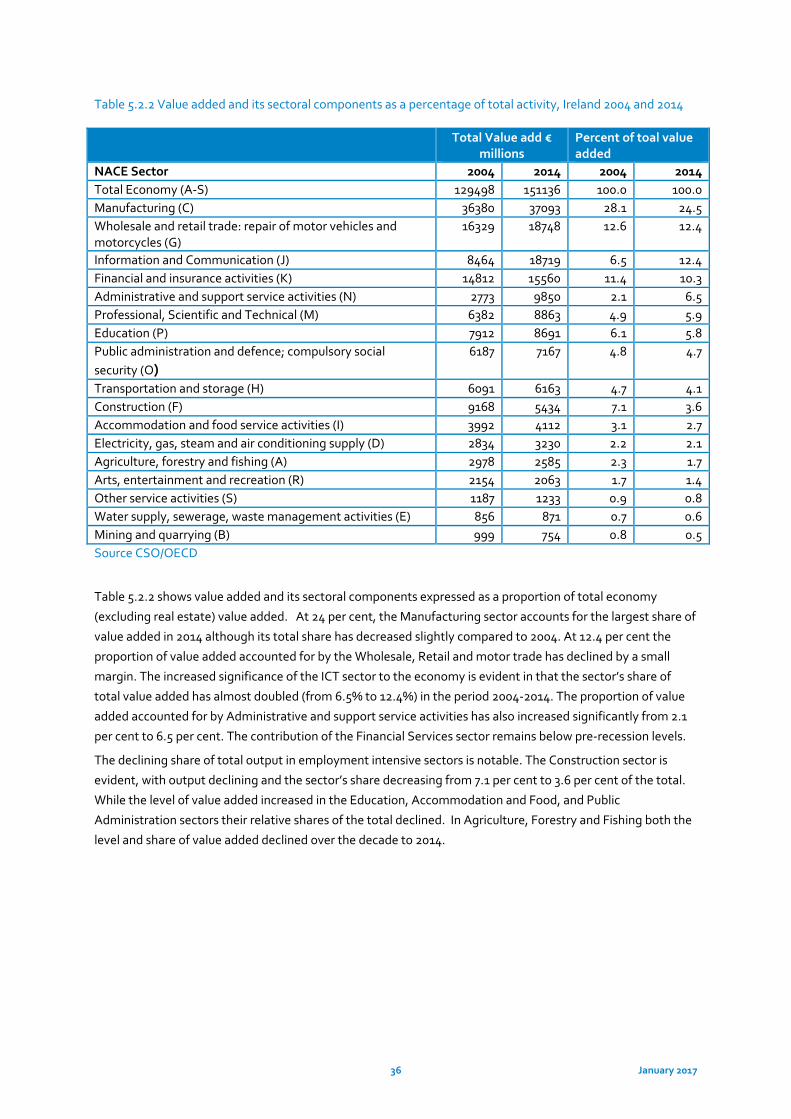
36 January 2017
Table 5.2.2 Value added and its sectoral components as a percentage of total activity, Ireland 2004 and 2014 Total Value add €
millions Percent of toal value added
NACE Sector 2004 2014 2004 2014 Total Economy (A-S) 129498 151136 100.0 100.0 Manufacturing (C) 36380 37093 28.1 24.5 Wholesale and retail trade: repair of motor vehicles and motorcycles (G)
16329 18748 12.6 12.4
Information and Communication (J) 8464 18719 6.5 12.4 Financial and insurance activities (K) 14812 15560 11.4 10.3 Administrative and support service activities (N) 2773 9850 2.1 6.5 Professional, Scientific and Technical (M) 6382 8863 4.9 5.9 Education (P) 7912 8691 6.1 5.8 Public administration and defence; compulsory social security (O)
6187 7167 4.8 4.7
Transportation and storage (H) 6091 6163 4.7 4.1 Construction (F) 9168 5434 7.1 3.6 Accommodation and food service activities (I) 3992 4112 3.1 2.7 Electricity, gas, steam and air conditioning supply (D) 2834 3230 2.2 2.1 Agriculture, forestry and fishing (A) 2978 2585 2.3 1.7 Arts, entertainment and recreation (R) 2154 2063 1.7 1.4 Other service activities (S) 1187 1233 0.9 0.8 Water supply, sewerage, waste management activities (E) 856 871 0.7 0.6 Mining and quarrying (B) 999 754 0.8 0.5 Source CSO/OECD
Table 5.2.2 shows value added and its sectoral components expressed as a proportion of total economy
(excluding real estate) value added. At 24 per cent, the Manufacturing sector accounts for the largest share of
value added in 2014 although its total share has decreased slightly compared to 2004. At 12.4 per cent the
proportion of value added accounted for by the Wholesale, Retail and motor trade has declined by a small
margin. The increased significance of the ICT sector to the economy is evident in that the sector’s share of
total value added has almost doubled (from 6.5% to 12.4%) in the period 2004-2014. The proportion of value
added accounted for by Administrative and support service activities has also increased significantly from 2.1
per cent to 6.5 per cent. The contribution of the Financial Services sector remains below pre-recession levels.
The declining share of total output in employment intensive sectors is notable. The Construction sector is
evident, with output declining and the sector’s share decreasing from 7.1 per cent to 3.6 per cent of the total.
While the level of value added increased in the Education, Accommodation and Food, and Public
Administration sectors their relative shares of the total declined. In Agriculture, Forestry and Fishing both the
level and share of value added declined over the decade to 2014.
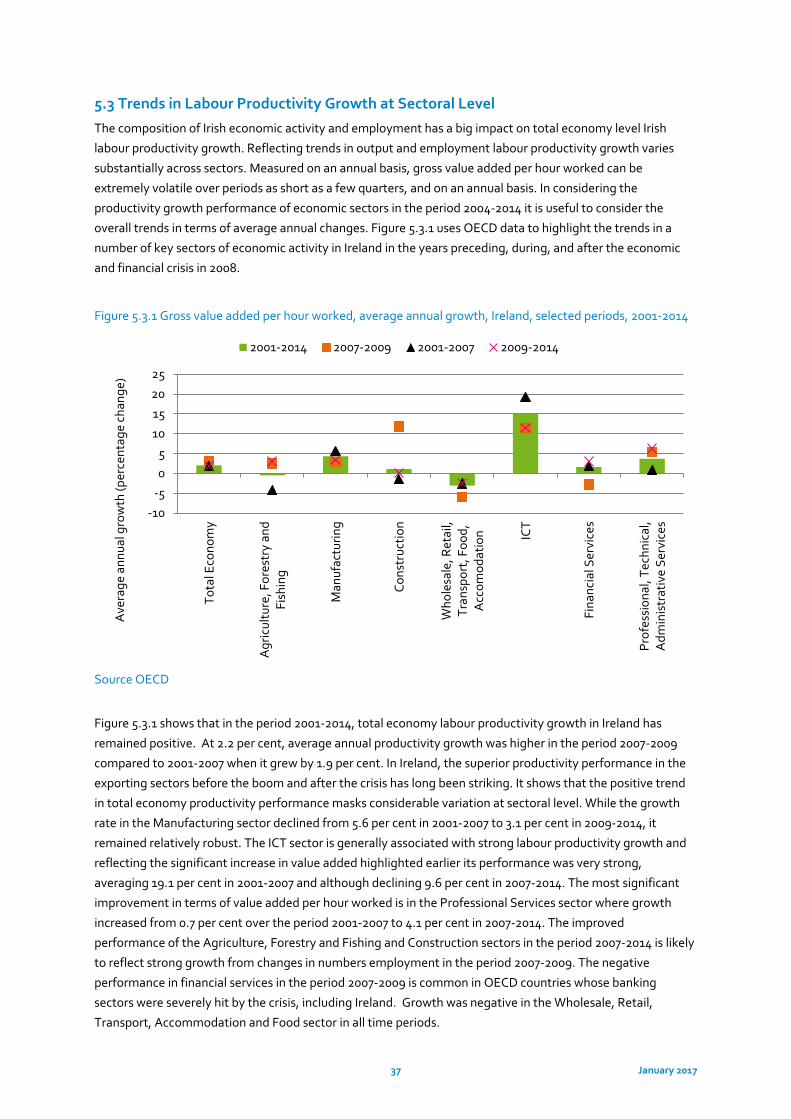
37 January 2017
5.3 Trends in Labour Productivity Growth at Sectoral Level
The composition of Irish economic activity and employment has a big impact on total economy level Irish
labour productivity growth. Reflecting trends in output and employment labour productivity growth varies
substantially across sectors. Measured on an annual basis, gross value added per hour worked can be
extremely volatile over periods as short as a few quarters, and on an annual basis. In considering the
productivity growth performance of economic sectors in the period 2004-2014 it is useful to consider the
overall trends in terms of average annual changes. Figure 5.3.1 uses OECD data to highlight the trends in a
number of key sectors of economic activity in Ireland in the years preceding, during, and after the economic
and financial crisis in 2008.
Figure 5.3.1 Gross value added per hour worked, average annual growth, Ireland, selected periods, 2001-2014
Source OECD
Figure 5.3.1 shows that in the period 2001-2014, total economy labour productivity growth in Ireland has
remained positive. At 2.2 per cent, average annual productivity growth was higher in the period 2007-2009
compared to 2001-2007 when it grew by 1.9 per cent. In Ireland, the superior productivity performance in the
exporting sectors before the boom and after the crisis has long been striking. It shows that the positive trend
in total economy productivity performance masks considerable variation at sectoral level. While the growth
rate in the Manufacturing sector declined from 5.6 per cent in 2001-2007 to 3.1 per cent in 2009-2014, it
remained relatively robust. The ICT sector is generally associated with strong labour productivity growth and
reflecting the significant increase in value added highlighted earlier its performance was very strong,
averaging 19.1 per cent in 2001-2007 and although declining 9.6 per cent in 2007-2014. The most significant
improvement in terms of value added per hour worked is in the Professional Services sector where growth
increased from 0.7 per cent over the period 2001-2007 to 4.1 per cent in 2007-2014. The improved
performance of the Agriculture, Forestry and Fishing and Construction sectors in the period 2007-2014 is likely
to reflect strong growth from changes in numbers employment in the period 2007-2009. The negative
performance in financial services in the period 2007-2009 is common in OECD countries whose banking
sectors were severely hit by the crisis, including Ireland. Growth was negative in the Wholesale, Retail,
Transport, Accommodation and Food sector in all time periods.
-10-505
10152025
Tota
l Eco
nom
y
Agr
icul
ture
, For
estr
y an
dFi
shin
g
Man
ufac
turin
g
Cons
truc
tion
Who
lesa
le, R
etai
l,Tr
ansp
ort,
Foo
d,A
ccom
odat
ion IC
T
Fina
ncia
l Ser
vice
s
Prof
essi
onal
, Tec
hnic
al,
Adm
inis
trat
ive
Serv
ices
Ave
rage
ann
ual g
row
th (p
erce
ntag
e ch
ange
)
2001-2014 2007-2009 2001-2007 2009-2014
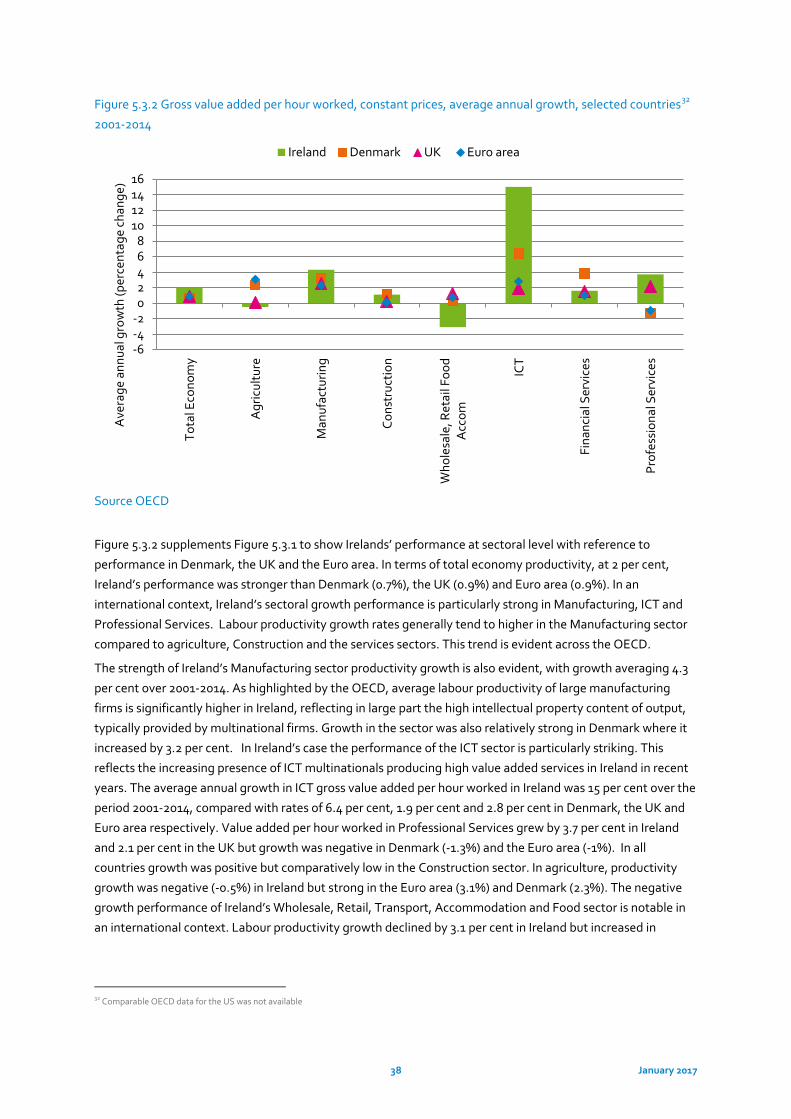
38 January 2017
Figure 5.3.2 Gross value added per hour worked, constant prices, average annual growth, selected countries32
2001-2014
Source OECD
Figure 5.3.2 supplements Figure 5.3.1 to show Irelands’ performance at sectoral level with reference to
performance in Denmark, the UK and the Euro area. In terms of total economy productivity, at 2 per cent,
Ireland’s performance was stronger than Denmark (0.7%), the UK (0.9%) and Euro area (0.9%). In an
international context, Ireland’s sectoral growth performance is particularly strong in Manufacturing, ICT and
Professional Services. Labour productivity growth rates generally tend to higher in the Manufacturing sector
compared to agriculture, Construction and the services sectors. This trend is evident across the OECD.
The strength of Ireland’s Manufacturing sector productivity growth is also evident, with growth averaging 4.3
per cent over 2001-2014. As highlighted by the OECD, average labour productivity of large manufacturing
firms is significantly higher in Ireland, reflecting in large part the high intellectual property content of output,
typically provided by multinational firms. Growth in the sector was also relatively strong in Denmark where it
increased by 3.2 per cent. In Ireland’s case the performance of the ICT sector is particularly striking. This
reflects the increasing presence of ICT multinationals producing high value added services in Ireland in recent
years. The average annual growth in ICT gross value added per hour worked in Ireland was 15 per cent over the
period 2001-2014, compared with rates of 6.4 per cent, 1.9 per cent and 2.8 per cent in Denmark, the UK and
Euro area respectively. Value added per hour worked in Professional Services grew by 3.7 per cent in Ireland
and 2.1 per cent in the UK but growth was negative in Denmark (-1.3%) and the Euro area (-1%). In all
countries growth was positive but comparatively low in the Construction sector. In agriculture, productivity
growth was negative (-0.5%) in Ireland but strong in the Euro area (3.1%) and Denmark (2.3%). The negative
growth performance of Ireland’s Wholesale, Retail, Transport, Accommodation and Food sector is notable in
an international context. Labour productivity growth declined by 3.1 per cent in Ireland but increased in
32 Comparable OECD data for the US was not available
-6-4-202468
10121416
Tota
l Eco
nom
y
Agr
icul
ture
Man
ufac
turin
g
Cons
truc
tion
Who
lesa
le, R
etai
l Foo
dA
ccom
ICT
Fina
ncia
l Ser
vice
s
Prof
essi
onal
Ser
vice
s
Ave
rage
ann
ual g
row
th (p
erce
ntag
e ch
ange
)
Ireland Denmark UK Euro area
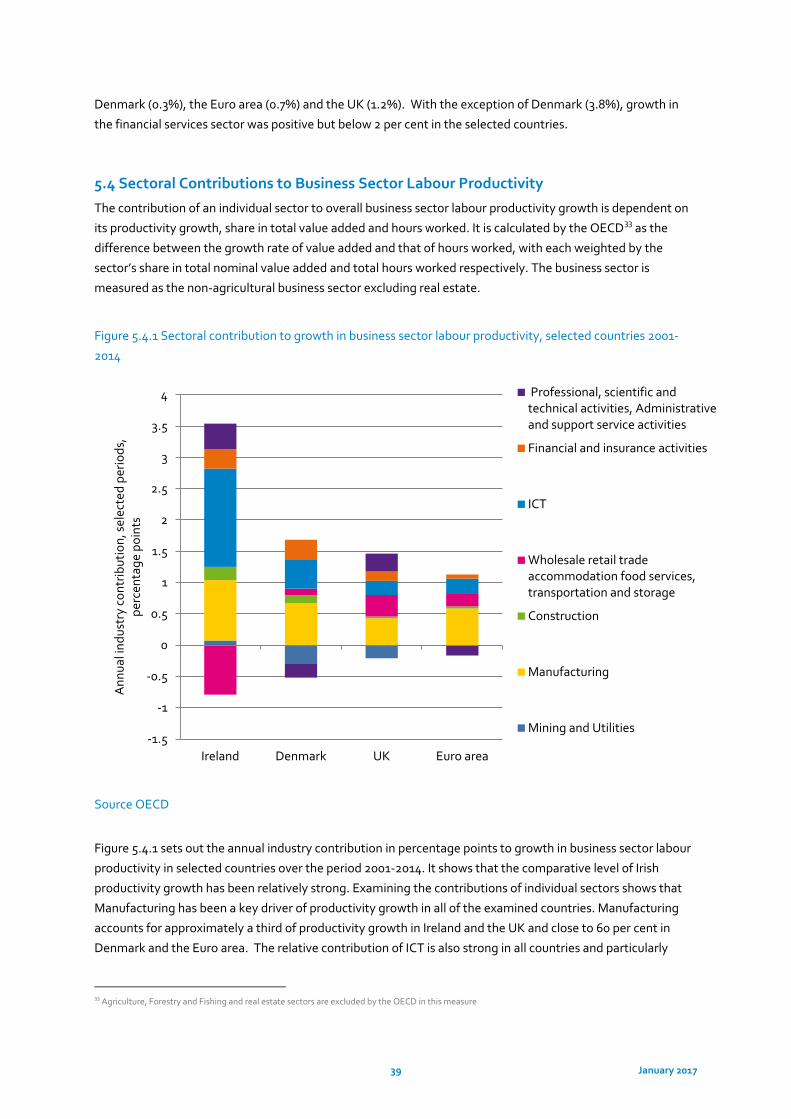
39 January 2017
Denmark (0.3%), the Euro area (0.7%) and the UK (1.2%). With the exception of Denmark (3.8%), growth in
the financial services sector was positive but below 2 per cent in the selected countries.
5.4 Sectoral Contributions to Business Sector Labour Productivity
The contribution of an individual sector to overall business sector labour productivity growth is dependent on
its productivity growth, share in total value added and hours worked. It is calculated by the OECD33 as the
difference between the growth rate of value added and that of hours worked, with each weighted by the
sector’s share in total nominal value added and total hours worked respectively. The business sector is
measured as the non-agricultural business sector excluding real estate.
Figure 5.4.1 Sectoral contribution to growth in business sector labour productivity, selected countries 2001-
2014
Source OECD
Figure 5.4.1 sets out the annual industry contribution in percentage points to growth in business sector labour
productivity in selected countries over the period 2001-2014. It shows that the comparative level of Irish
productivity growth has been relatively strong. Examining the contributions of individual sectors shows that
Manufacturing has been a key driver of productivity growth in all of the examined countries. Manufacturing
accounts for approximately a third of productivity growth in Ireland and the UK and close to 60 per cent in
Denmark and the Euro area. The relative contribution of ICT is also strong in all countries and particularly
33 Agriculture, Forestry and Fishing and real estate sectors are excluded by the OECD in this measure
-1.5
-1
-0.5
0
0.5
1
1.5
2
2.5
3
3.5
4
Ireland Denmark UK Euro area
Ann
ual i
ndus
try
cont
ribut
ion,
sel
ecte
d pe
riods
, pe
rcen
tage
poi
nts
Professional, scientific andtechnical activities, Administrativeand support service activities
Financial and insurance activities
ICT
Wholesale retail tradeaccommodation food services,transportation and storage
Construction
Manufacturing
Mining and Utilities
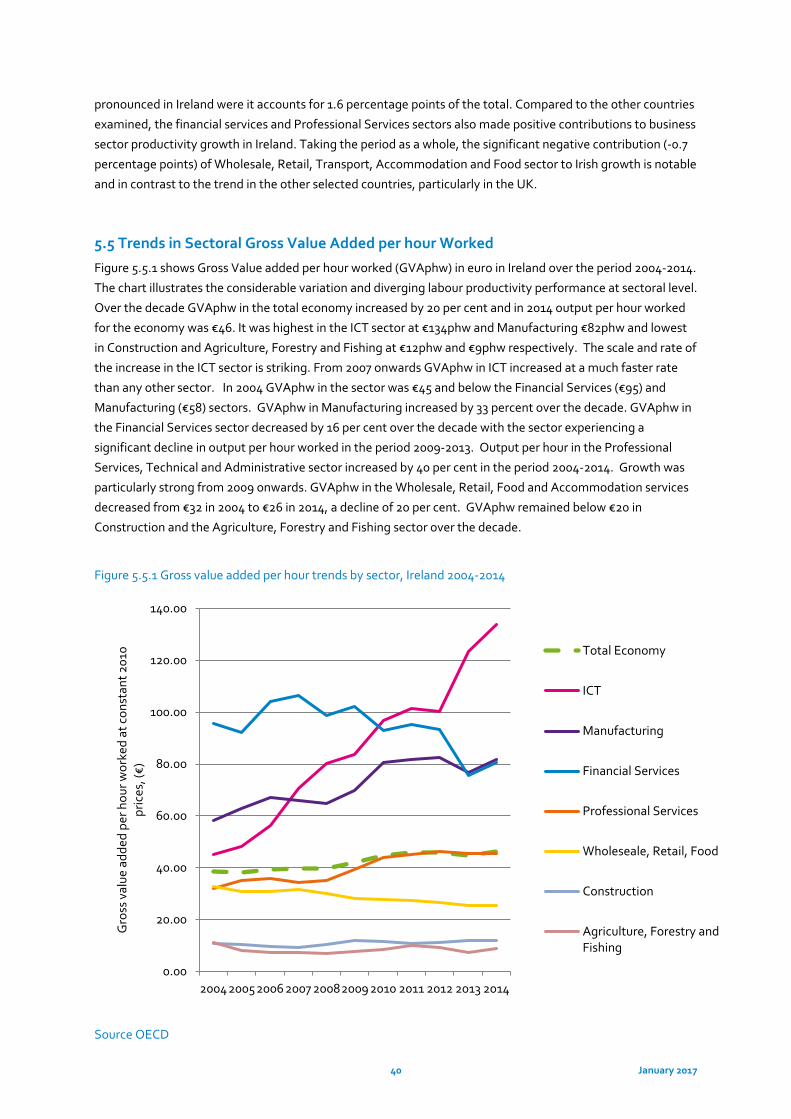
40 January 2017
pronounced in Ireland were it accounts for 1.6 percentage points of the total. Compared to the other countries
examined, the financial services and Professional Services sectors also made positive contributions to business
sector productivity growth in Ireland. Taking the period as a whole, the significant negative contribution (-0.7
percentage points) of Wholesale, Retail, Transport, Accommodation and Food sector to Irish growth is notable
and in contrast to the trend in the other selected countries, particularly in the UK.
5.5 Trends in Sectoral Gross Value Added per hour Worked
Figure 5.5.1 shows Gross Value added per hour worked (GVAphw) in euro in Ireland over the period 2004-2014.
The chart illustrates the considerable variation and diverging labour productivity performance at sectoral level.
Over the decade GVAphw in the total economy increased by 20 per cent and in 2014 output per hour worked
for the economy was €46. It was highest in the ICT sector at €134phw and Manufacturing €82phw and lowest
in Construction and Agriculture, Forestry and Fishing at €12phw and €9phw respectively. The scale and rate of
the increase in the ICT sector is striking. From 2007 onwards GVAphw in ICT increased at a much faster rate
than any other sector. In 2004 GVAphw in the sector was €45 and below the Financial Services (€95) and
Manufacturing (€58) sectors. GVAphw in Manufacturing increased by 33 percent over the decade. GVAphw in
the Financial Services sector decreased by 16 per cent over the decade with the sector experiencing a
significant decline in output per hour worked in the period 2009-2013. Output per hour in the Professional
Services, Technical and Administrative sector increased by 40 per cent in the period 2004-2014. Growth was
particularly strong from 2009 onwards. GVAphw in the Wholesale, Retail, Food and Accommodation services
decreased from €32 in 2004 to €26 in 2014, a decline of 20 per cent. GVAphw remained below €20 in
Construction and the Agriculture, Forestry and Fishing sector over the decade.
Figure 5.5.1 Gross value added per hour trends by sector, Ireland 2004-2014
Source OECD
0.00
20.00
40.00
60.00
80.00
100.00
120.00
140.00
200420052006 2007 20082009 2010 2011 2012 2013 2014
Gro
ss v
alue
add
ed p
er h
our w
orke
d at
con
stan
t 201
0 pr
ices
, (€)
Total Economy
ICT
Manufacturing
Financial Services
Professional Services
Wholeseale, Retail, Food
Construction
Agriculture, Forestry andFishing
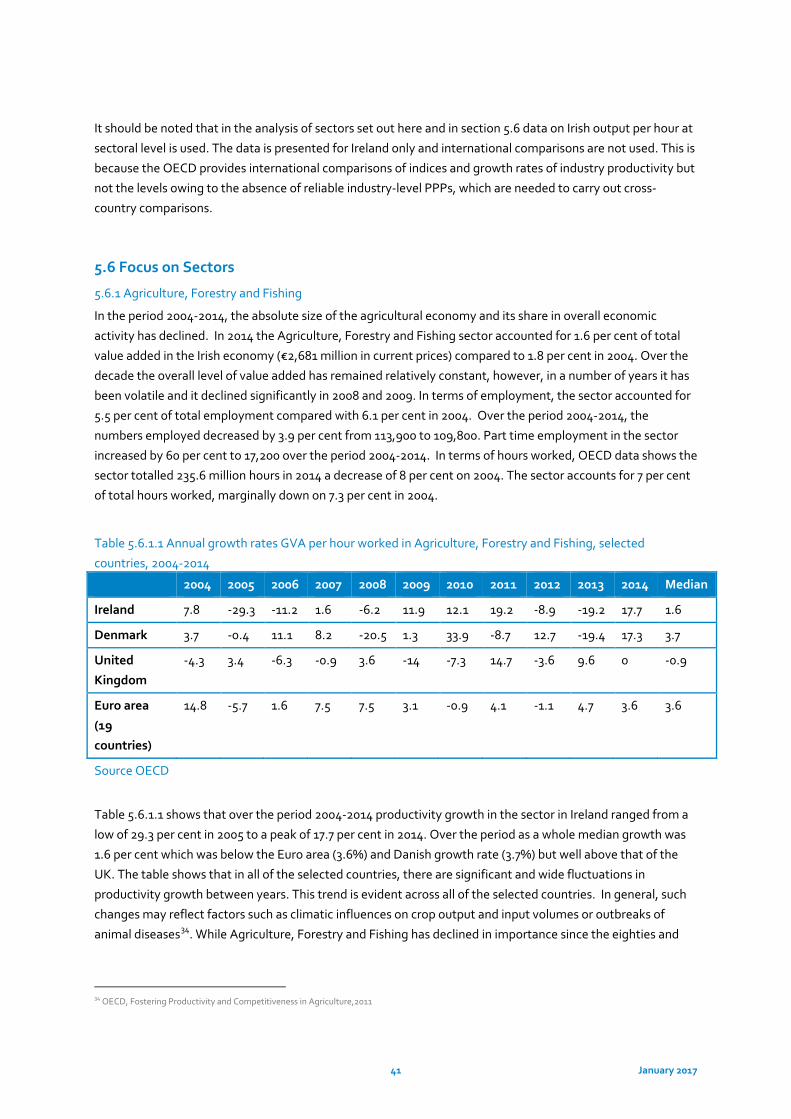
41 January 2017
It should be noted that in the analysis of sectors set out here and in section 5.6 data on Irish output per hour at
sectoral level is used. The data is presented for Ireland only and international comparisons are not used. This is
because the OECD provides international comparisons of indices and growth rates of industry productivity but
not the levels owing to the absence of reliable industry-level PPPs, which are needed to carry out cross-
country comparisons.
5.6 Focus on Sectors
5.6.1 Agriculture, Forestry and Fishing
In the period 2004-2014, the absolute size of the agricultural economy and its share in overall economic
activity has declined. In 2014 the Agriculture, Forestry and Fishing sector accounted for 1.6 per cent of total
value added in the Irish economy (€2,681 million in current prices) compared to 1.8 per cent in 2004. Over the
decade the overall level of value added has remained relatively constant, however, in a number of years it has
been volatile and it declined significantly in 2008 and 2009. In terms of employment, the sector accounted for
5.5 per cent of total employment compared with 6.1 per cent in 2004. Over the period 2004-2014, the
numbers employed decreased by 3.9 per cent from 113,900 to 109,800. Part time employment in the sector
increased by 60 per cent to 17,200 over the period 2004-2014. In terms of hours worked, OECD data shows the
sector totalled 235.6 million hours in 2014 a decrease of 8 per cent on 2004. The sector accounts for 7 per cent
of total hours worked, marginally down on 7.3 per cent in 2004.
Table 5.6.1.1 Annual growth rates GVA per hour worked in Agriculture, Forestry and Fishing, selected
countries, 2004-2014
2004 2005 2006 2007 2008 2009 2010 2011 2012 2013 2014 Median
Ireland 7.8 -29.3 -11.2 1.6 -6.2 11.9 12.1 19.2 -8.9 -19.2 17.7 1.6
Denmark 3.7 -0.4 11.1 8.2 -20.5 1.3 33.9 -8.7 12.7 -19.4 17.3 3.7
United
Kingdom
-4.3 3.4 -6.3 -0.9 3.6 -14 -7.3 14.7 -3.6 9.6 0 -0.9
Euro area
(19
countries)
14.8 -5.7 1.6 7.5 7.5 3.1 -0.9 4.1 -1.1 4.7 3.6 3.6
Source OECD
Table 5.6.1.1 shows that over the period 2004-2014 productivity growth in the sector in Ireland ranged from a
low of 29.3 per cent in 2005 to a peak of 17.7 per cent in 2014. Over the period as a whole median growth was
1.6 per cent which was below the Euro area (3.6%) and Danish growth rate (3.7%) but well above that of the
UK. The table shows that in all of the selected countries, there are significant and wide fluctuations in
productivity growth between years. This trend is evident across all of the selected countries. In general, such
changes may reflect factors such as climatic influences on crop output and input volumes or outbreaks of
animal diseases34. While Agriculture, Forestry and Fishing has declined in importance since the eighties and
34 OECD, Fostering Productivity and Competitiveness in Agriculture,2011
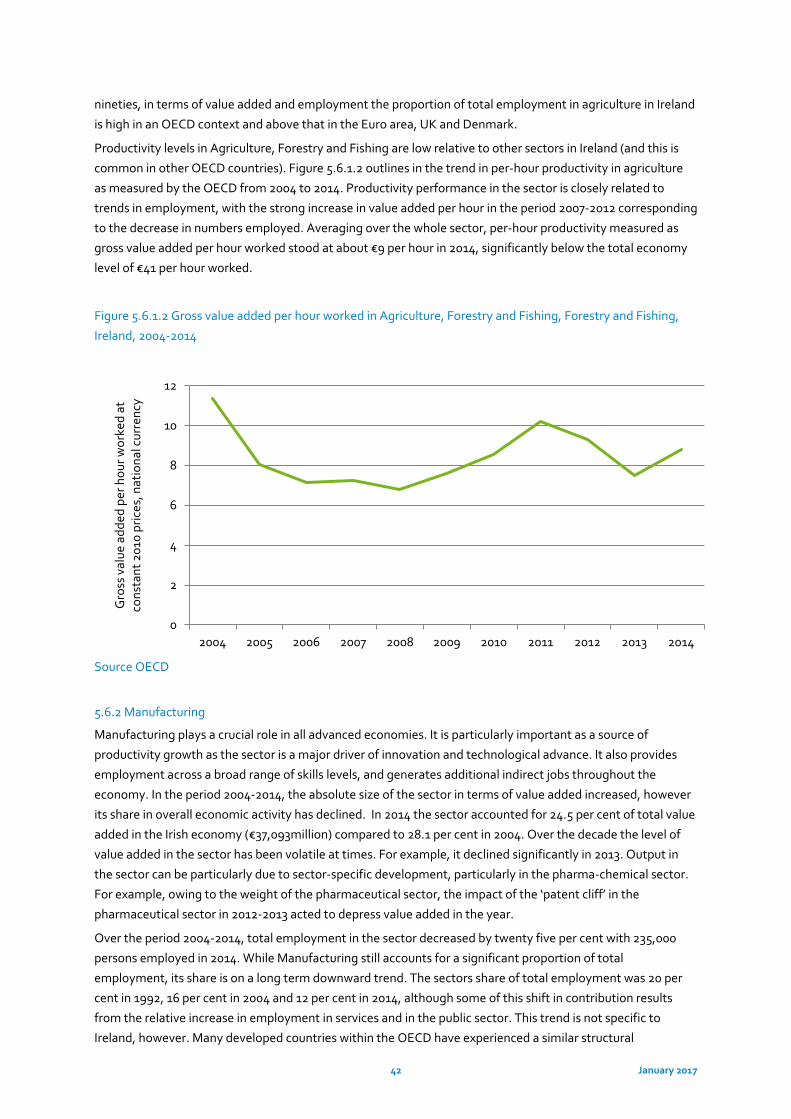
42 January 2017
nineties, in terms of value added and employment the proportion of total employment in agriculture in Ireland
is high in an OECD context and above that in the Euro area, UK and Denmark.
Productivity levels in Agriculture, Forestry and Fishing are low relative to other sectors in Ireland (and this is
common in other OECD countries). Figure 5.6.1.2 outlines in the trend in per-hour productivity in agriculture
as measured by the OECD from 2004 to 2014. Productivity performance in the sector is closely related to
trends in employment, with the strong increase in value added per hour in the period 2007-2012 corresponding
to the decrease in numbers employed. Averaging over the whole sector, per-hour productivity measured as
gross value added per hour worked stood at about €9 per hour in 2014, significantly below the total economy
level of €41 per hour worked.
Figure 5.6.1.2 Gross value added per hour worked in Agriculture, Forestry and Fishing, Forestry and Fishing,
Ireland, 2004-2014
Source OECD
5.6.2 Manufacturing
Manufacturing plays a crucial role in all advanced economies. It is particularly important as a source of
productivity growth as the sector is a major driver of innovation and technological advance. It also provides
employment across a broad range of skills levels, and generates additional indirect jobs throughout the
economy. In the period 2004-2014, the absolute size of the sector in terms of value added increased, however
its share in overall economic activity has declined. In 2014 the sector accounted for 24.5 per cent of total value
added in the Irish economy (€37,093million) compared to 28.1 per cent in 2004. Over the decade the level of
value added in the sector has been volatile at times. For example, it declined significantly in 2013. Output in
the sector can be particularly due to sector-specific development, particularly in the pharma-chemical sector.
For example, owing to the weight of the pharmaceutical sector, the impact of the ‘patent cliff’ in the
pharmaceutical sector in 2012-2013 acted to depress value added in the year.
Over the period 2004-2014, total employment in the sector decreased by twenty five per cent with 235,000
persons employed in 2014. While Manufacturing still accounts for a significant proportion of total
employment, its share is on a long term downward trend. The sectors share of total employment was 20 per
cent in 1992, 16 per cent in 2004 and 12 per cent in 2014, although some of this shift in contribution results
from the relative increase in employment in services and in the public sector. This trend is not specific to
Ireland, however. Many developed countries within the OECD have experienced a similar structural
0
2
4
6
8
10
12
2004 2005 2006 2007 2008 2009 2010 2011 2012 2013 2014
Gro
ss v
alue
add
ed p
er h
our w
orke
d at
co
nsta
nt 2
010
pric
es, n
atio
nal c
urre
ncy
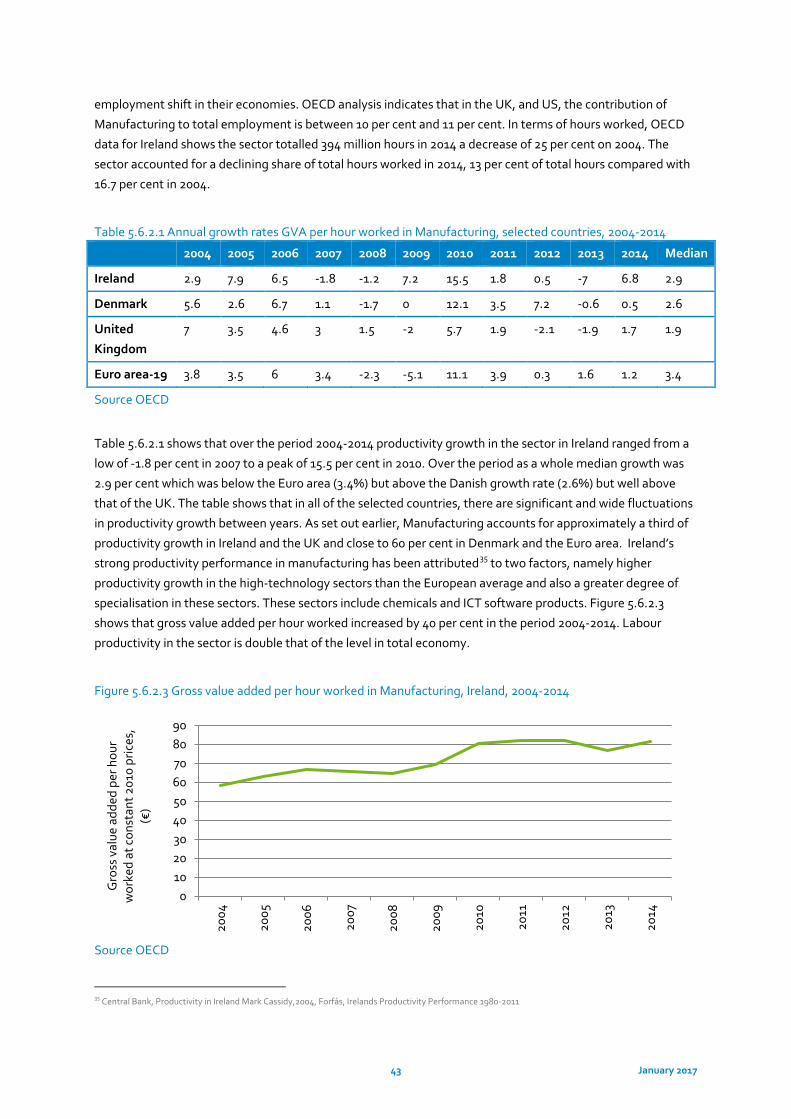
43 January 2017
employment shift in their economies. OECD analysis indicates that in the UK, and US, the contribution of
Manufacturing to total employment is between 10 per cent and 11 per cent. In terms of hours worked, OECD
data for Ireland shows the sector totalled 394 million hours in 2014 a decrease of 25 per cent on 2004. The
sector accounted for a declining share of total hours worked in 2014, 13 per cent of total hours compared with
16.7 per cent in 2004.
Table 5.6.2.1 Annual growth rates GVA per hour worked in Manufacturing, selected countries, 2004-2014
2004 2005 2006 2007 2008 2009 2010 2011 2012 2013 2014 Median
Ireland 2.9 7.9 6.5 -1.8 -1.2 7.2 15.5 1.8 0.5 -7 6.8 2.9
Denmark 5.6 2.6 6.7 1.1 -1.7 0 12.1 3.5 7.2 -0.6 0.5 2.6
United
Kingdom
7 3.5 4.6 3 1.5 -2 5.7 1.9 -2.1 -1.9 1.7 1.9
Euro area-19 3.8 3.5 6 3.4 -2.3 -5.1 11.1 3.9 0.3 1.6 1.2 3.4
Source OECD
Table 5.6.2.1 shows that over the period 2004-2014 productivity growth in the sector in Ireland ranged from a
low of -1.8 per cent in 2007 to a peak of 15.5 per cent in 2010. Over the period as a whole median growth was
2.9 per cent which was below the Euro area (3.4%) but above the Danish growth rate (2.6%) but well above
that of the UK. The table shows that in all of the selected countries, there are significant and wide fluctuations
in productivity growth between years. As set out earlier, Manufacturing accounts for approximately a third of
productivity growth in Ireland and the UK and close to 60 per cent in Denmark and the Euro area. Ireland’s
strong productivity performance in manufacturing has been attributed35 to two factors, namely higher
productivity growth in the high-technology sectors than the European average and also a greater degree of
specialisation in these sectors. These sectors include chemicals and ICT software products. Figure 5.6.2.3
shows that gross value added per hour worked increased by 40 per cent in the period 2004-2014. Labour
productivity in the sector is double that of the level in total economy.
Figure 5.6.2.3 Gross value added per hour worked in Manufacturing, Ireland, 2004-2014
Source OECD
35 Central Bank, Productivity in Ireland Mark Cassidy,2004, Forfás, Irelands Productivity Performance 1980-2011
0102030405060708090
2004
2005
2006
2007
2008
2009
2010
2011
2012
2013
2014
Gro
ss v
alue
add
ed p
er h
our
wor
ked
at c
onst
ant 2
010
pric
es,
(€)
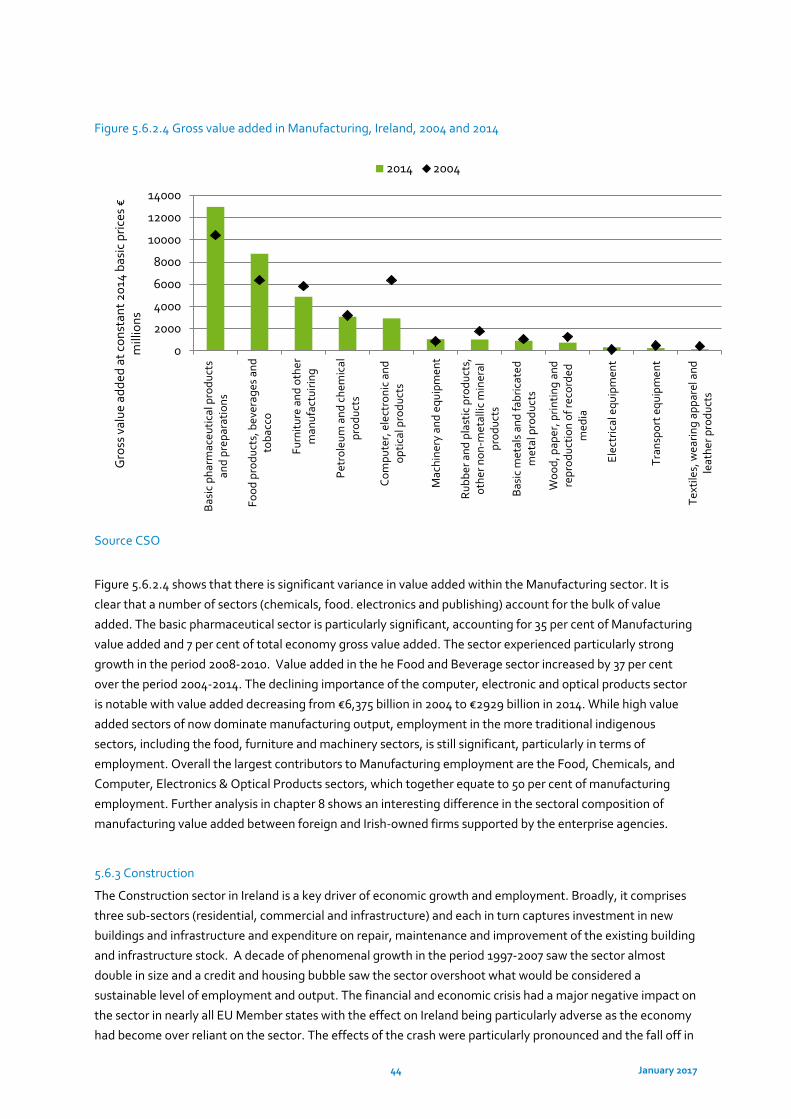
44 January 2017
Figure 5.6.2.4 Gross value added in Manufacturing, Ireland, 2004 and 2014
Source CSO
Figure 5.6.2.4 shows that there is significant variance in value added within the Manufacturing sector. It is
clear that a number of sectors (chemicals, food. electronics and publishing) account for the bulk of value
added. The basic pharmaceutical sector is particularly significant, accounting for 35 per cent of Manufacturing
value added and 7 per cent of total economy gross value added. The sector experienced particularly strong
growth in the period 2008-2010. Value added in the he Food and Beverage sector increased by 37 per cent
over the period 2004-2014. The declining importance of the computer, electronic and optical products sector
is notable with value added decreasing from €6,375 billion in 2004 to €2929 billion in 2014. While high value
added sectors of now dominate manufacturing output, employment in the more traditional indigenous
sectors, including the food, furniture and machinery sectors, is still significant, particularly in terms of
employment. Overall the largest contributors to Manufacturing employment are the Food, Chemicals, and
Computer, Electronics & Optical Products sectors, which together equate to 50 per cent of manufacturing
employment. Further analysis in chapter 8 shows an interesting difference in the sectoral composition of
manufacturing value added between foreign and Irish-owned firms supported by the enterprise agencies.
5.6.3 Construction
The Construction sector in Ireland is a key driver of economic growth and employment. Broadly, it comprises
three sub-sectors (residential, commercial and infrastructure) and each in turn captures investment in new
buildings and infrastructure and expenditure on repair, maintenance and improvement of the existing building
and infrastructure stock. A decade of phenomenal growth in the period 1997-2007 saw the sector almost
double in size and a credit and housing bubble saw the sector overshoot what would be considered a
sustainable level of employment and output. The financial and economic crisis had a major negative impact on
the sector in nearly all EU Member states with the effect on Ireland being particularly adverse as the economy
had become over reliant on the sector. The effects of the crash were particularly pronounced and the fall off in
0
2000
4000
6000
8000
10000
12000
14000Ba
sic
phar
mac
eutic
al p
rodu
cts
and
prep
arat
ions
Food
pro
duct
s, b
ever
ages
and
toba
cco
Furn
iture
and
oth
erm
anuf
actu
iring
Petr
oleu
m a
nd c
hem
ical
prod
ucts
Com
pute
r, e
lect
roni
c an
dop
tical
pro
duct
s
Mac
hine
ry a
nd e
quip
men
t
Rubb
er a
nd p
last
ic p
rodu
cts,
othe
r non
-met
allic
min
eral
prod
ucts
Basi
c m
etal
s an
d fa
bric
ated
met
al p
rodu
cts
Woo
d, p
aper
, prin
ting
and
repr
oduc
tion
of re
cord
edm
edia
Elec
tric
al e
quip
men
t
Tran
spor
t equ
ipm
ent
Text
iles,
wea
ring
appa
rel a
ndle
athe
r pro
duct
s
Gro
ss v
alue
add
ed a
t con
stan
t 201
4 ba
sic
pric
es €
m
illio
ns
2014 2004
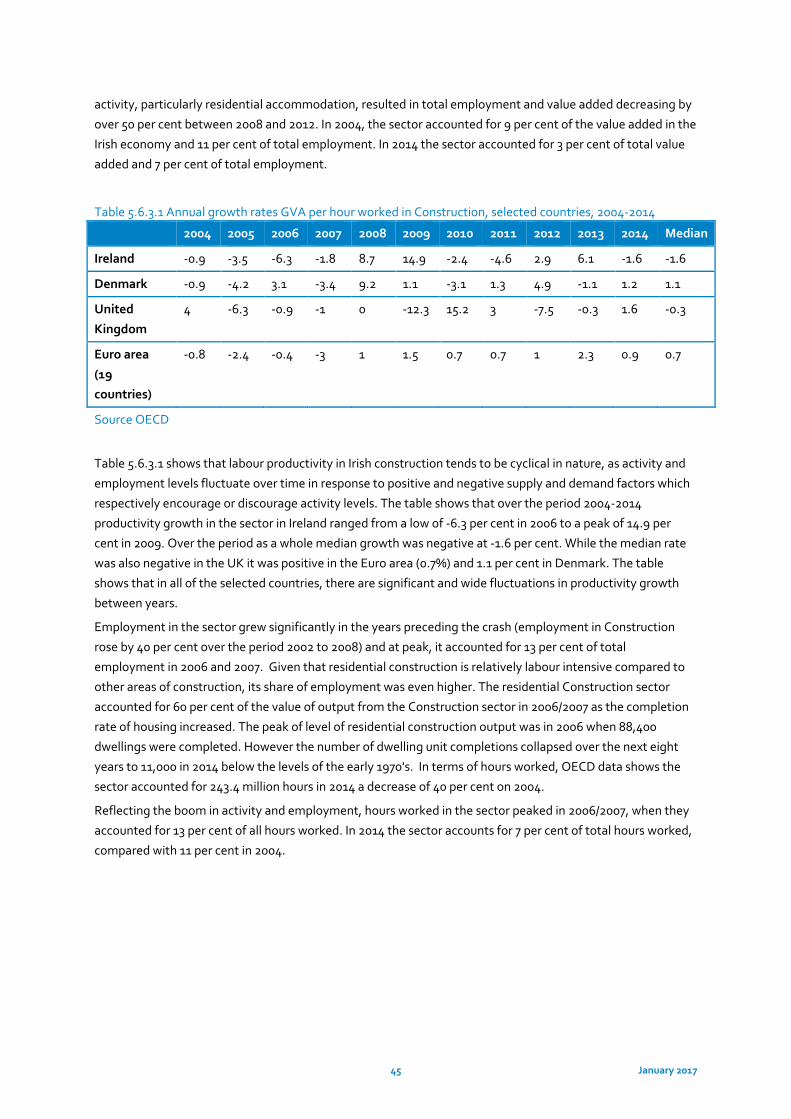
45 January 2017
activity, particularly residential accommodation, resulted in total employment and value added decreasing by
over 50 per cent between 2008 and 2012. In 2004, the sector accounted for 9 per cent of the value added in the
Irish economy and 11 per cent of total employment. In 2014 the sector accounted for 3 per cent of total value
added and 7 per cent of total employment.
Table 5.6.3.1 Annual growth rates GVA per hour worked in Construction, selected countries, 2004-2014
2004 2005 2006 2007 2008 2009 2010 2011 2012 2013 2014 Median
Ireland -0.9 -3.5 -6.3 -1.8 8.7 14.9 -2.4 -4.6 2.9 6.1 -1.6 -1.6
Denmark -0.9 -4.2 3.1 -3.4 9.2 1.1 -3.1 1.3 4.9 -1.1 1.2 1.1
United
Kingdom
4 -6.3 -0.9 -1 0 -12.3 15.2 3 -7.5 -0.3 1.6 -0.3
Euro area
(19
countries)
-0.8 -2.4 -0.4 -3 1 1.5 0.7 0.7 1 2.3 0.9 0.7
Source OECD
Table 5.6.3.1 shows that labour productivity in Irish construction tends to be cyclical in nature, as activity and
employment levels fluctuate over time in response to positive and negative supply and demand factors which
respectively encourage or discourage activity levels. The table shows that over the period 2004-2014
productivity growth in the sector in Ireland ranged from a low of -6.3 per cent in 2006 to a peak of 14.9 per
cent in 2009. Over the period as a whole median growth was negative at -1.6 per cent. While the median rate
was also negative in the UK it was positive in the Euro area (0.7%) and 1.1 per cent in Denmark. The table
shows that in all of the selected countries, there are significant and wide fluctuations in productivity growth
between years.
Employment in the sector grew significantly in the years preceding the crash (employment in Construction
rose by 40 per cent over the period 2002 to 2008) and at peak, it accounted for 13 per cent of total
employment in 2006 and 2007. Given that residential construction is relatively labour intensive compared to
other areas of construction, its share of employment was even higher. The residential Construction sector
accounted for 60 per cent of the value of output from the Construction sector in 2006/2007 as the completion
rate of housing increased. The peak of level of residential construction output was in 2006 when 88,400
dwellings were completed. However the number of dwelling unit completions collapsed over the next eight
years to 11,000 in 2014 below the levels of the early 1970's. In terms of hours worked, OECD data shows the
sector accounted for 243.4 million hours in 2014 a decrease of 40 per cent on 2004.
Reflecting the boom in activity and employment, hours worked in the sector peaked in 2006/2007, when they
accounted for 13 per cent of all hours worked. In 2014 the sector accounts for 7 per cent of total hours worked,
compared with 11 per cent in 2004.
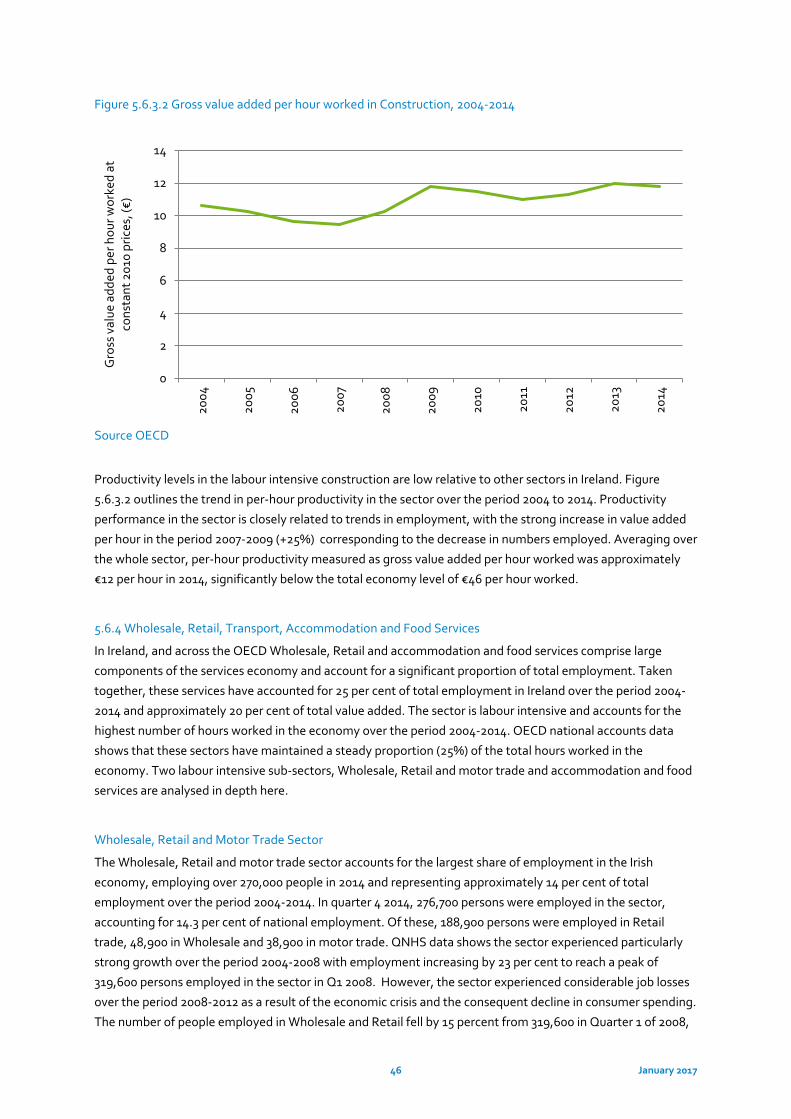
46 January 2017
Figure 5.6.3.2 Gross value added per hour worked in Construction, 2004-2014
Source OECD
Productivity levels in the labour intensive construction are low relative to other sectors in Ireland. Figure
5.6.3.2 outlines the trend in per-hour productivity in the sector over the period 2004 to 2014. Productivity
performance in the sector is closely related to trends in employment, with the strong increase in value added
per hour in the period 2007-2009 (+25%) corresponding to the decrease in numbers employed. Averaging over
the whole sector, per-hour productivity measured as gross value added per hour worked was approximately
€12 per hour in 2014, significantly below the total economy level of €46 per hour worked.
5.6.4 Wholesale, Retail, Transport, Accommodation and Food Services
In Ireland, and across the OECD Wholesale, Retail and accommodation and food services comprise large
components of the services economy and account for a significant proportion of total employment. Taken
together, these services have accounted for 25 per cent of total employment in Ireland over the period 2004-
2014 and approximately 20 per cent of total value added. The sector is labour intensive and accounts for the
highest number of hours worked in the economy over the period 2004-2014. OECD national accounts data
shows that these sectors have maintained a steady proportion (25%) of the total hours worked in the
economy. Two labour intensive sub-sectors, Wholesale, Retail and motor trade and accommodation and food
services are analysed in depth here.
Wholesale, Retail and Motor Trade Sector
The Wholesale, Retail and motor trade sector accounts for the largest share of employment in the Irish
economy, employing over 270,000 people in 2014 and representing approximately 14 per cent of total
employment over the period 2004-2014. In quarter 4 2014, 276,700 persons were employed in the sector,
accounting for 14.3 per cent of national employment. Of these, 188,900 persons were employed in Retail
trade, 48,900 in Wholesale and 38,900 in motor trade. QNHS data shows the sector experienced particularly
strong growth over the period 2004-2008 with employment increasing by 23 per cent to reach a peak of
319,600 persons employed in the sector in Q1 2008. However, the sector experienced considerable job losses
over the period 2008-2012 as a result of the economic crisis and the consequent decline in consumer spending.
The number of people employed in Wholesale and Retail fell by 15 percent from 319,600 in Quarter 1 of 2008,
0
2
4
6
8
10
12
14
2004
2005
2006
2007
2008
2009
2010
2011
2012
2013
2014
Gro
ss v
alue
add
ed p
er h
our w
orke
d at
co
nsta
nt 2
010
pric
es, (
€)
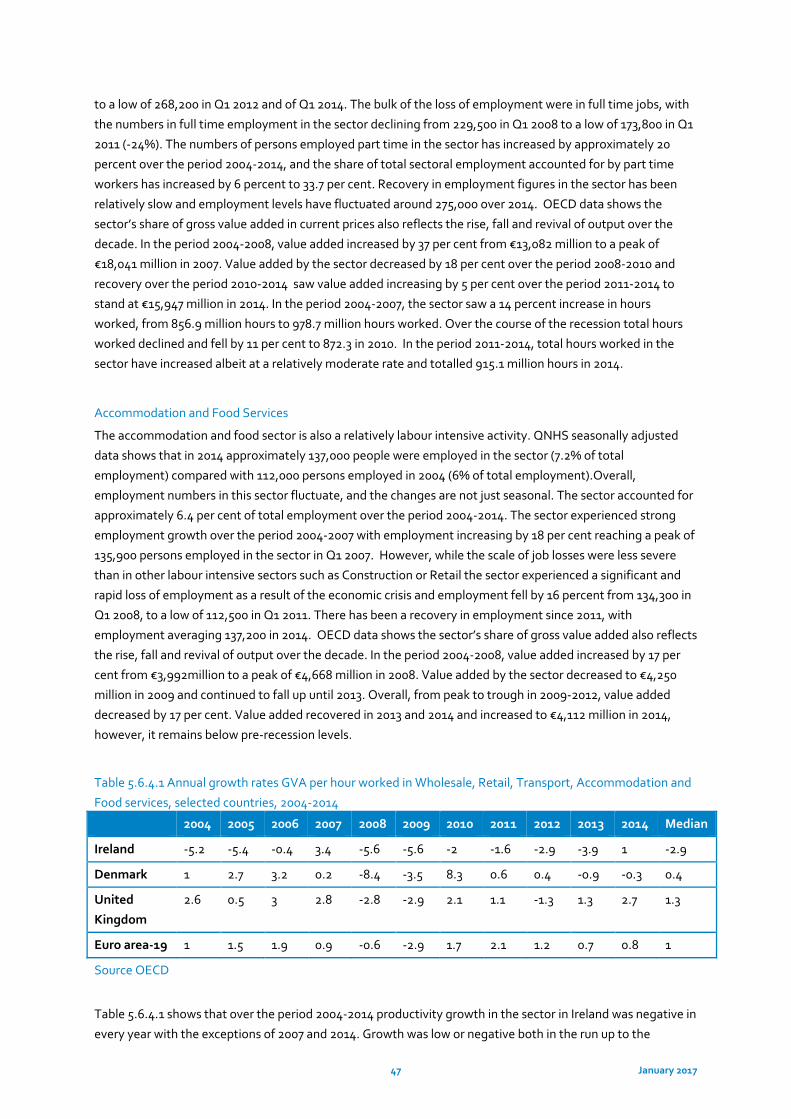
47 January 2017
to a low of 268,200 in Q1 2012 and of Q1 2014. The bulk of the loss of employment were in full time jobs, with
the numbers in full time employment in the sector declining from 229,500 in Q1 2008 to a low of 173,800 in Q1
2011 (-24%). The numbers of persons employed part time in the sector has increased by approximately 20
percent over the period 2004-2014, and the share of total sectoral employment accounted for by part time
workers has increased by 6 percent to 33.7 per cent. Recovery in employment figures in the sector has been
relatively slow and employment levels have fluctuated around 275,000 over 2014. OECD data shows the
sector’s share of gross value added in current prices also reflects the rise, fall and revival of output over the
decade. In the period 2004-2008, value added increased by 37 per cent from €13,082 million to a peak of
€18,041 million in 2007. Value added by the sector decreased by 18 per cent over the period 2008-2010 and
recovery over the period 2010-2014 saw value added increasing by 5 per cent over the period 2011-2014 to
stand at €15,947 million in 2014. In the period 2004-2007, the sector saw a 14 percent increase in hours
worked, from 856.9 million hours to 978.7 million hours worked. Over the course of the recession total hours
worked declined and fell by 11 per cent to 872.3 in 2010. In the period 2011-2014, total hours worked in the
sector have increased albeit at a relatively moderate rate and totalled 915.1 million hours in 2014.
Accommodation and Food Services
The accommodation and food sector is also a relatively labour intensive activity. QNHS seasonally adjusted
data shows that in 2014 approximately 137,000 people were employed in the sector (7.2% of total
employment) compared with 112,000 persons employed in 2004 (6% of total employment).Overall,
employment numbers in this sector fluctuate, and the changes are not just seasonal. The sector accounted for
approximately 6.4 per cent of total employment over the period 2004-2014. The sector experienced strong
employment growth over the period 2004-2007 with employment increasing by 18 per cent reaching a peak of
135,900 persons employed in the sector in Q1 2007. However, while the scale of job losses were less severe
than in other labour intensive sectors such as Construction or Retail the sector experienced a significant and
rapid loss of employment as a result of the economic crisis and employment fell by 16 percent from 134,300 in
Q1 2008, to a low of 112,500 in Q1 2011. There has been a recovery in employment since 2011, with
employment averaging 137,200 in 2014. OECD data shows the sector’s share of gross value added also reflects
the rise, fall and revival of output over the decade. In the period 2004-2008, value added increased by 17 per
cent from €3,992million to a peak of €4,668 million in 2008. Value added by the sector decreased to €4,250
million in 2009 and continued to fall up until 2013. Overall, from peak to trough in 2009-2012, value added
decreased by 17 per cent. Value added recovered in 2013 and 2014 and increased to €4,112 million in 2014,
however, it remains below pre-recession levels.
Table 5.6.4.1 Annual growth rates GVA per hour worked in Wholesale, Retail, Transport, Accommodation and
Food services, selected countries, 2004-2014
2004 2005 2006 2007 2008 2009 2010 2011 2012 2013 2014 Median
Ireland -5.2 -5.4 -0.4 3.4 -5.6 -5.6 -2 -1.6 -2.9 -3.9 1 -2.9
Denmark 1 2.7 3.2 0.2 -8.4 -3.5 8.3 0.6 0.4 -0.9 -0.3 0.4
United
Kingdom
2.6 0.5 3 2.8 -2.8 -2.9 2.1 1.1 -1.3 1.3 2.7 1.3
Euro area-19 1 1.5 1.9 0.9 -0.6 -2.9 1.7 2.1 1.2 0.7 0.8 1
Source OECD
Table 5.6.4.1 shows that over the period 2004-2014 productivity growth in the sector in Ireland was negative in
every year with the exceptions of 2007 and 2014. Growth was low or negative both in the run up to the
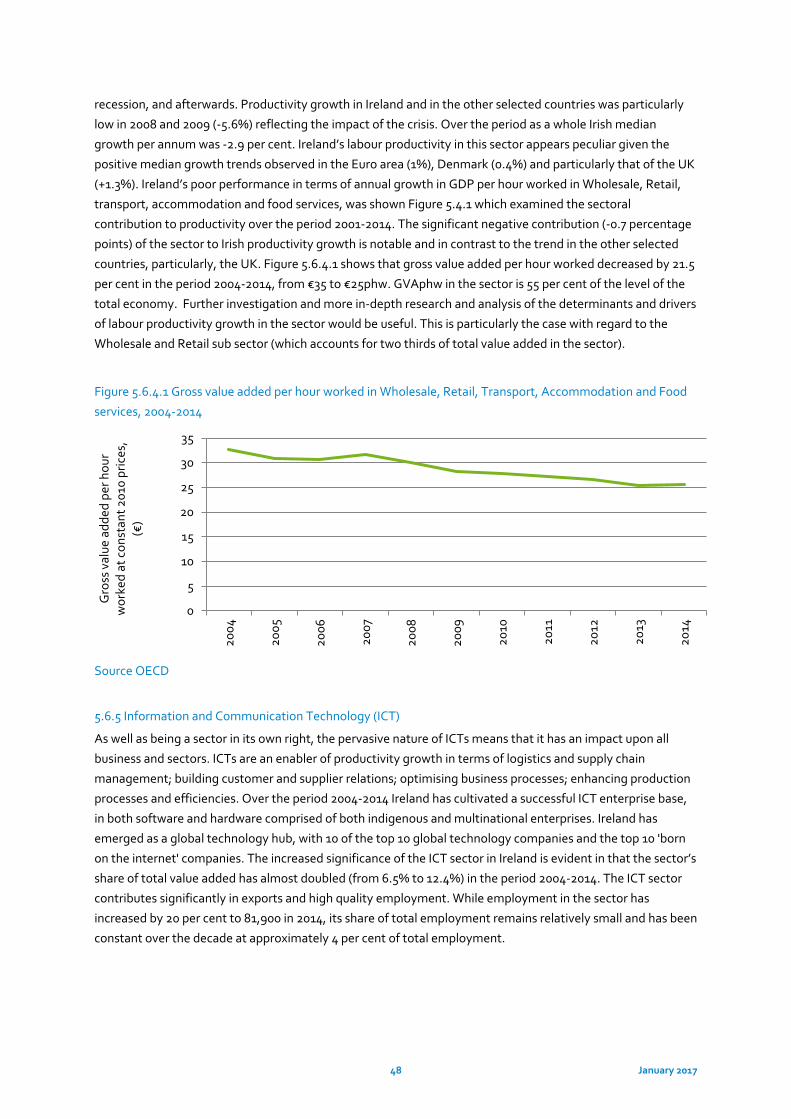
48 January 2017
recession, and afterwards. Productivity growth in Ireland and in the other selected countries was particularly
low in 2008 and 2009 (-5.6%) reflecting the impact of the crisis. Over the period as a whole Irish median
growth per annum was -2.9 per cent. Ireland’s labour productivity in this sector appears peculiar given the
positive median growth trends observed in the Euro area (1%), Denmark (0.4%) and particularly that of the UK
(+1.3%). Ireland’s poor performance in terms of annual growth in GDP per hour worked in Wholesale, Retail,
transport, accommodation and food services, was shown Figure 5.4.1 which examined the sectoral
contribution to productivity over the period 2001-2014. The significant negative contribution (-0.7 percentage
points) of the sector to Irish productivity growth is notable and in contrast to the trend in the other selected
countries, particularly, the UK. Figure 5.6.4.1 shows that gross value added per hour worked decreased by 21.5
per cent in the period 2004-2014, from €35 to €25phw. GVAphw in the sector is 55 per cent of the level of the
total economy. Further investigation and more in-depth research and analysis of the determinants and drivers
of labour productivity growth in the sector would be useful. This is particularly the case with regard to the
Wholesale and Retail sub sector (which accounts for two thirds of total value added in the sector).
Figure 5.6.4.1 Gross value added per hour worked in Wholesale, Retail, Transport, Accommodation and Food
services, 2004-2014
Source OECD
5.6.5 Information and Communication Technology (ICT)
As well as being a sector in its own right, the pervasive nature of ICTs means that it has an impact upon all
business and sectors. ICTs are an enabler of productivity growth in terms of logistics and supply chain
management; building customer and supplier relations; optimising business processes; enhancing production
processes and efficiencies. Over the period 2004-2014 Ireland has cultivated a successful ICT enterprise base,
in both software and hardware comprised of both indigenous and multinational enterprises. Ireland has
emerged as a global technology hub, with 10 of the top 10 global technology companies and the top 10 'born
on the internet' companies. The increased significance of the ICT sector in Ireland is evident in that the sector’s
share of total value added has almost doubled (from 6.5% to 12.4%) in the period 2004-2014. The ICT sector
contributes significantly in exports and high quality employment. While employment in the sector has
increased by 20 per cent to 81,900 in 2014, its share of total employment remains relatively small and has been
constant over the decade at approximately 4 per cent of total employment.
0
5
10
15
20
25
30
35
2004
2005
2006
2007
2008
2009
2010
2011
2012
2013
2014
Gro
ss v
alue
add
ed p
er h
our
wor
ked
at c
onst
ant 2
010
pric
es,
(€)
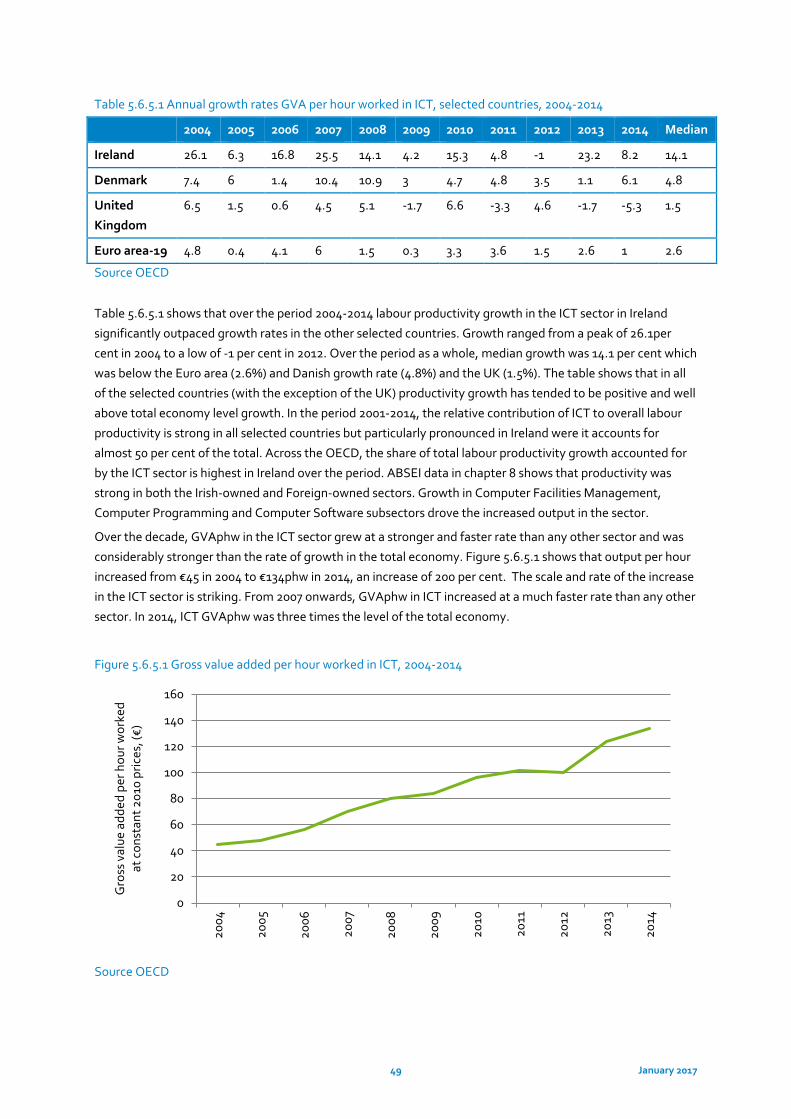
49 January 2017
Table 5.6.5.1 Annual growth rates GVA per hour worked in ICT, selected countries, 2004-2014
2004 2005 2006 2007 2008 2009 2010 2011 2012 2013 2014 Median
Ireland 26.1 6.3 16.8 25.5 14.1 4.2 15.3 4.8 -1 23.2 8.2 14.1
Denmark 7.4 6 1.4 10.4 10.9 3 4.7 4.8 3.5 1.1 6.1 4.8
United
Kingdom
6.5 1.5 0.6 4.5 5.1 -1.7 6.6 -3.3 4.6 -1.7 -5.3 1.5
Euro area-19 4.8 0.4 4.1 6 1.5 0.3 3.3 3.6 1.5 2.6 1 2.6
Source OECD
Table 5.6.5.1 shows that over the period 2004-2014 labour productivity growth in the ICT sector in Ireland
significantly outpaced growth rates in the other selected countries. Growth ranged from a peak of 26.1per
cent in 2004 to a low of -1 per cent in 2012. Over the period as a whole, median growth was 14.1 per cent which
was below the Euro area (2.6%) and Danish growth rate (4.8%) and the UK (1.5%). The table shows that in all
of the selected countries (with the exception of the UK) productivity growth has tended to be positive and well
above total economy level growth. In the period 2001-2014, the relative contribution of ICT to overall labour
productivity is strong in all selected countries but particularly pronounced in Ireland were it accounts for
almost 50 per cent of the total. Across the OECD, the share of total labour productivity growth accounted for
by the ICT sector is highest in Ireland over the period. ABSEI data in chapter 8 shows that productivity was
strong in both the Irish-owned and Foreign-owned sectors. Growth in Computer Facilities Management,
Computer Programming and Computer Software subsectors drove the increased output in the sector.
Over the decade, GVAphw in the ICT sector grew at a stronger and faster rate than any other sector and was
considerably stronger than the rate of growth in the total economy. Figure 5.6.5.1 shows that output per hour
increased from €45 in 2004 to €134phw in 2014, an increase of 200 per cent. The scale and rate of the increase
in the ICT sector is striking. From 2007 onwards, GVAphw in ICT increased at a much faster rate than any other
sector. In 2014, ICT GVAphw was three times the level of the total economy.
Figure 5.6.5.1 Gross value added per hour worked in ICT, 2004-2014
Source OECD
0
20
40
60
80
100
120
140
160
2004
2005
2006
2007
2008
2009
2010
2011
2012
2013
2014
Gro
ss v
alue
add
ed p
er h
our w
orke
d at
con
stan
t 201
0 pr
ices
, (€)
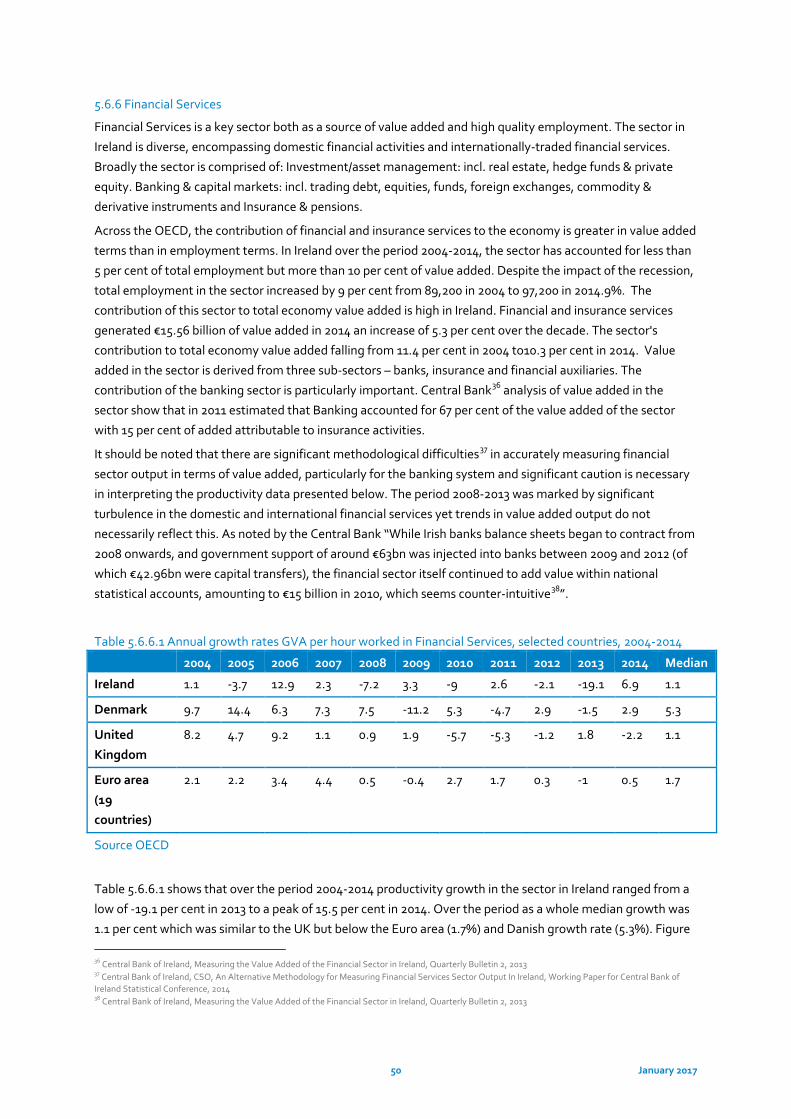
50 January 2017
5.6.6 Financial Services
Financial Services is a key sector both as a source of value added and high quality employment. The sector in
Ireland is diverse, encompassing domestic financial activities and internationally-traded financial services.
Broadly the sector is comprised of: Investment/asset management: incl. real estate, hedge funds & private
equity. Banking & capital markets: incl. trading debt, equities, funds, foreign exchanges, commodity &
derivative instruments and Insurance & pensions.
Across the OECD, the contribution of financial and insurance services to the economy is greater in value added
terms than in employment terms. In Ireland over the period 2004-2014, the sector has accounted for less than
5 per cent of total employment but more than 10 per cent of value added. Despite the impact of the recession,
total employment in the sector increased by 9 per cent from 89,200 in 2004 to 97,200 in 2014.9%. The
contribution of this sector to total economy value added is high in Ireland. Financial and insurance services
generated €15.56 billion of value added in 2014 an increase of 5.3 per cent over the decade. The sector's
contribution to total economy value added falling from 11.4 per cent in 2004 to10.3 per cent in 2014. Value
added in the sector is derived from three sub-sectors – banks, insurance and financial auxiliaries. The
contribution of the banking sector is particularly important. Central Bank36 analysis of value added in the
sector show that in 2011 estimated that Banking accounted for 67 per cent of the value added of the sector
with 15 per cent of added attributable to insurance activities.
It should be noted that there are significant methodological difficulties37 in accurately measuring financial
sector output in terms of value added, particularly for the banking system and significant caution is necessary
in interpreting the productivity data presented below. The period 2008-2013 was marked by significant
turbulence in the domestic and international financial services yet trends in value added output do not
necessarily reflect this. As noted by the Central Bank “While Irish banks balance sheets began to contract from
2008 onwards, and government support of around €63bn was injected into banks between 2009 and 2012 (of
which €42.96bn were capital transfers), the financial sector itself continued to add value within national
statistical accounts, amounting to €15 billion in 2010, which seems counter-intuitive38”.
Table 5.6.6.1 Annual growth rates GVA per hour worked in Financial Services, selected countries, 2004-2014
2004 2005 2006 2007 2008 2009 2010 2011 2012 2013 2014 Median
Ireland 1.1 -3.7 12.9 2.3 -7.2 3.3 -9 2.6 -2.1 -19.1 6.9 1.1
Denmark 9.7 14.4 6.3 7.3 7.5 -11.2 5.3 -4.7 2.9 -1.5 2.9 5.3
United
Kingdom
8.2 4.7 9.2 1.1 0.9 1.9 -5.7 -5.3 -1.2 1.8 -2.2 1.1
Euro area
(19
countries)
2.1 2.2 3.4 4.4 0.5 -0.4 2.7 1.7 0.3 -1 0.5 1.7
Source OECD
Table 5.6.6.1 shows that over the period 2004-2014 productivity growth in the sector in Ireland ranged from a
low of -19.1 per cent in 2013 to a peak of 15.5 per cent in 2014. Over the period as a whole median growth was
1.1 per cent which was similar to the UK but below the Euro area (1.7%) and Danish growth rate (5.3%). Figure
36 Central Bank of Ireland, Measuring the Value Added of the Financial Sector in Ireland, Quarterly Bulletin 2, 2013 37 Central Bank of Ireland, CSO, An Alternative Methodology for Measuring Financial Services Sector Output In Ireland, Working Paper for Central Bank of Ireland Statistical Conference, 2014 38 Central Bank of Ireland, Measuring the Value Added of the Financial Sector in Ireland, Quarterly Bulletin 2, 2013
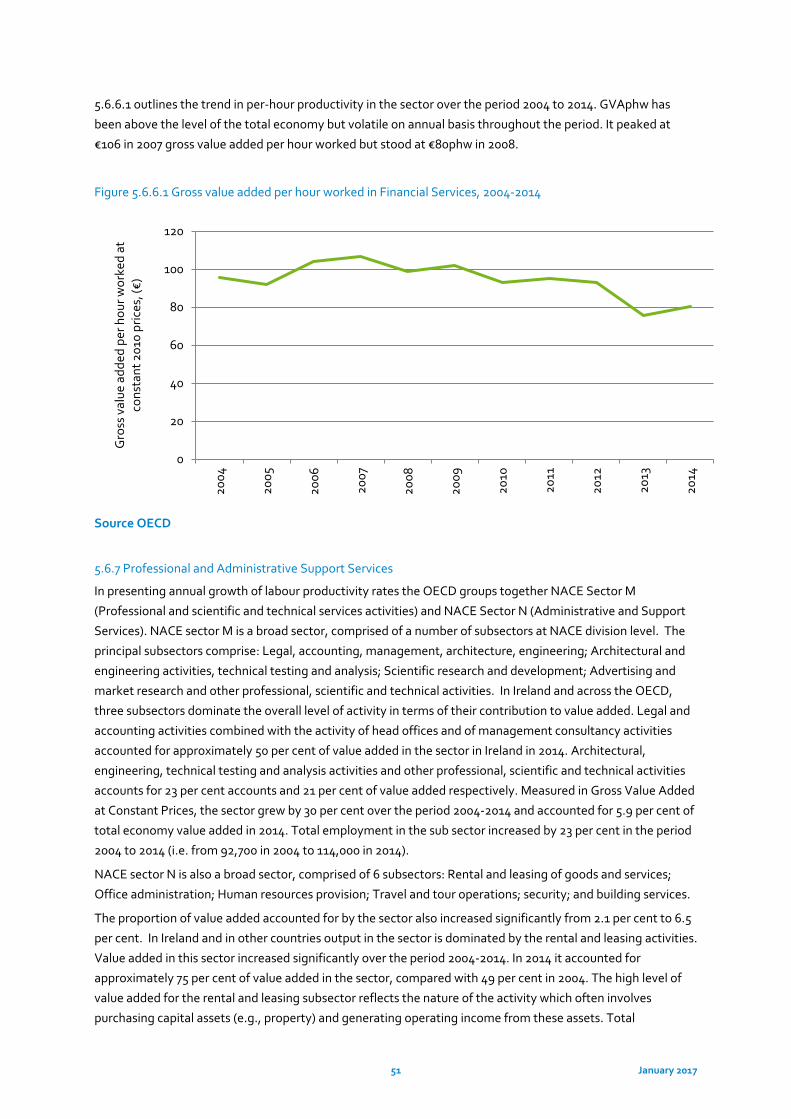
51 January 2017
5.6.6.1 outlines the trend in per-hour productivity in the sector over the period 2004 to 2014. GVAphw has
been above the level of the total economy but volatile on annual basis throughout the period. It peaked at
€106 in 2007 gross value added per hour worked but stood at €80phw in 2008.
Figure 5.6.6.1 Gross value added per hour worked in Financial Services, 2004-2014
Source OECD
5.6.7 Professional and Administrative Support Services
In presenting annual growth of labour productivity rates the OECD groups together NACE Sector M
(Professional and scientific and technical services activities) and NACE Sector N (Administrative and Support
Services). NACE sector M is a broad sector, comprised of a number of subsectors at NACE division level. The
principal subsectors comprise: Legal, accounting, management, architecture, engineering; Architectural and
engineering activities, technical testing and analysis; Scientific research and development; Advertising and
market research and other professional, scientific and technical activities. In Ireland and across the OECD,
three subsectors dominate the overall level of activity in terms of their contribution to value added. Legal and
accounting activities combined with the activity of head offices and of management consultancy activities
accounted for approximately 50 per cent of value added in the sector in Ireland in 2014. Architectural,
engineering, technical testing and analysis activities and other professional, scientific and technical activities
accounts for 23 per cent accounts and 21 per cent of value added respectively. Measured in Gross Value Added
at Constant Prices, the sector grew by 30 per cent over the period 2004-2014 and accounted for 5.9 per cent of
total economy value added in 2014. Total employment in the sub sector increased by 23 per cent in the period
2004 to 2014 (i.e. from 92,700 in 2004 to 114,000 in 2014).
NACE sector N is also a broad sector, comprised of 6 subsectors: Rental and leasing of goods and services;
Office administration; Human resources provision; Travel and tour operations; security; and building services.
The proportion of value added accounted for by the sector also increased significantly from 2.1 per cent to 6.5
per cent. In Ireland and in other countries output in the sector is dominated by the rental and leasing activities.
Value added in this sector increased significantly over the period 2004-2014. In 2014 it accounted for
approximately 75 per cent of value added in the sector, compared with 49 per cent in 2004. The high level of
value added for the rental and leasing subsector reflects the nature of the activity which often involves
purchasing capital assets (e.g., property) and generating operating income from these assets. Total
0
20
40
60
80
100
12020
04
2005
2006
2007
2008
2009
2010
2011
2012
2013
2014
Gro
ss v
alue
add
ed p
er h
our w
orke
d at
co
nsta
nt 2
010
pric
es, (
€)
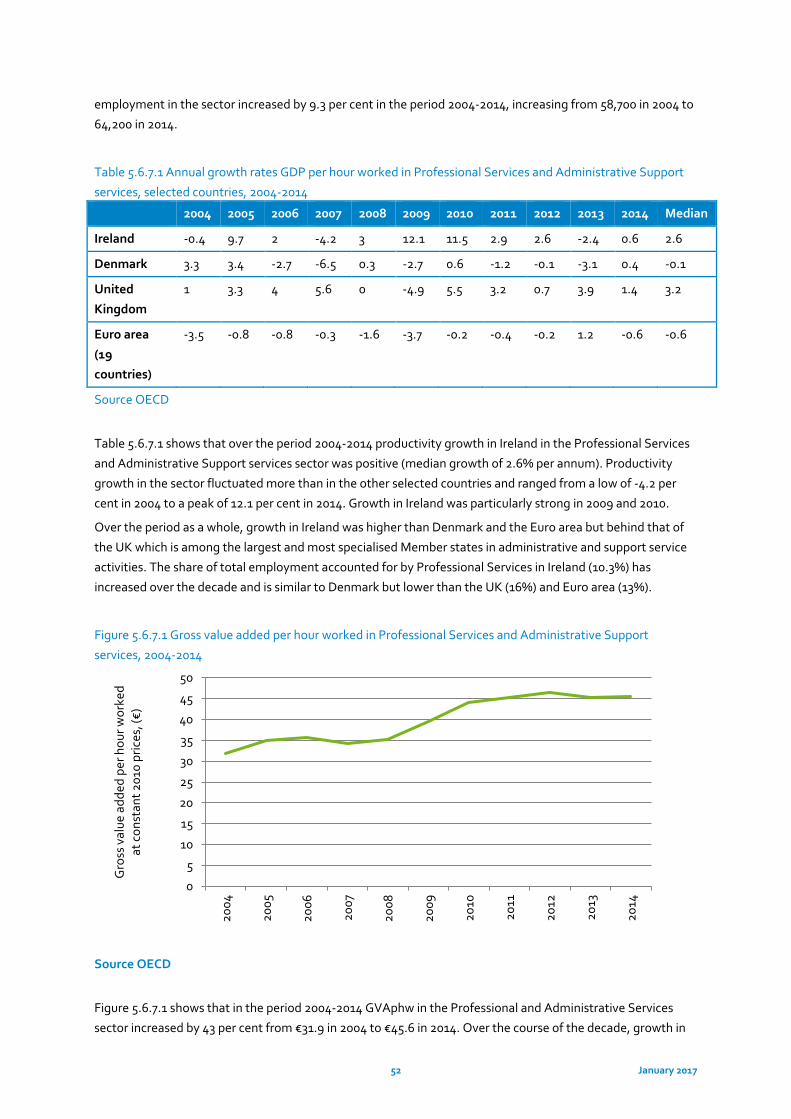
52 January 2017
employment in the sector increased by 9.3 per cent in the period 2004-2014, increasing from 58,700 in 2004 to
64,200 in 2014.
Table 5.6.7.1 Annual growth rates GDP per hour worked in Professional Services and Administrative Support
services, selected countries, 2004-2014
2004 2005 2006 2007 2008 2009 2010 2011 2012 2013 2014 Median
Ireland -0.4 9.7 2 -4.2 3 12.1 11.5 2.9 2.6 -2.4 0.6 2.6
Denmark 3.3 3.4 -2.7 -6.5 0.3 -2.7 0.6 -1.2 -0.1 -3.1 0.4 -0.1
United
Kingdom
1 3.3 4 5.6 0 -4.9 5.5 3.2 0.7 3.9 1.4 3.2
Euro area
(19
countries)
-3.5 -0.8 -0.8 -0.3 -1.6 -3.7 -0.2 -0.4 -0.2 1.2 -0.6 -0.6
Source OECD
Table 5.6.7.1 shows that over the period 2004-2014 productivity growth in Ireland in the Professional Services
and Administrative Support services sector was positive (median growth of 2.6% per annum). Productivity
growth in the sector fluctuated more than in the other selected countries and ranged from a low of -4.2 per
cent in 2004 to a peak of 12.1 per cent in 2014. Growth in Ireland was particularly strong in 2009 and 2010.
Over the period as a whole, growth in Ireland was higher than Denmark and the Euro area but behind that of
the UK which is among the largest and most specialised Member states in administrative and support service
activities. The share of total employment accounted for by Professional Services in Ireland (10.3%) has
increased over the decade and is similar to Denmark but lower than the UK (16%) and Euro area (13%).
Figure 5.6.7.1 Gross value added per hour worked in Professional Services and Administrative Support
services, 2004-2014
Source OECD
Figure 5.6.7.1 shows that in the period 2004-2014 GVAphw in the Professional and Administrative Services
sector increased by 43 per cent from €31.9 in 2004 to €45.6 in 2014. Over the course of the decade, growth in
0
5
10
15
20
25
30
35
40
45
50
2004
2005
2006
2007
2008
2009
2010
2011
2012
2013
2014
Gro
ss v
alue
add
ed p
er h
our w
orke
d at
con
stan
t 201
0 pr
ices
, (€)
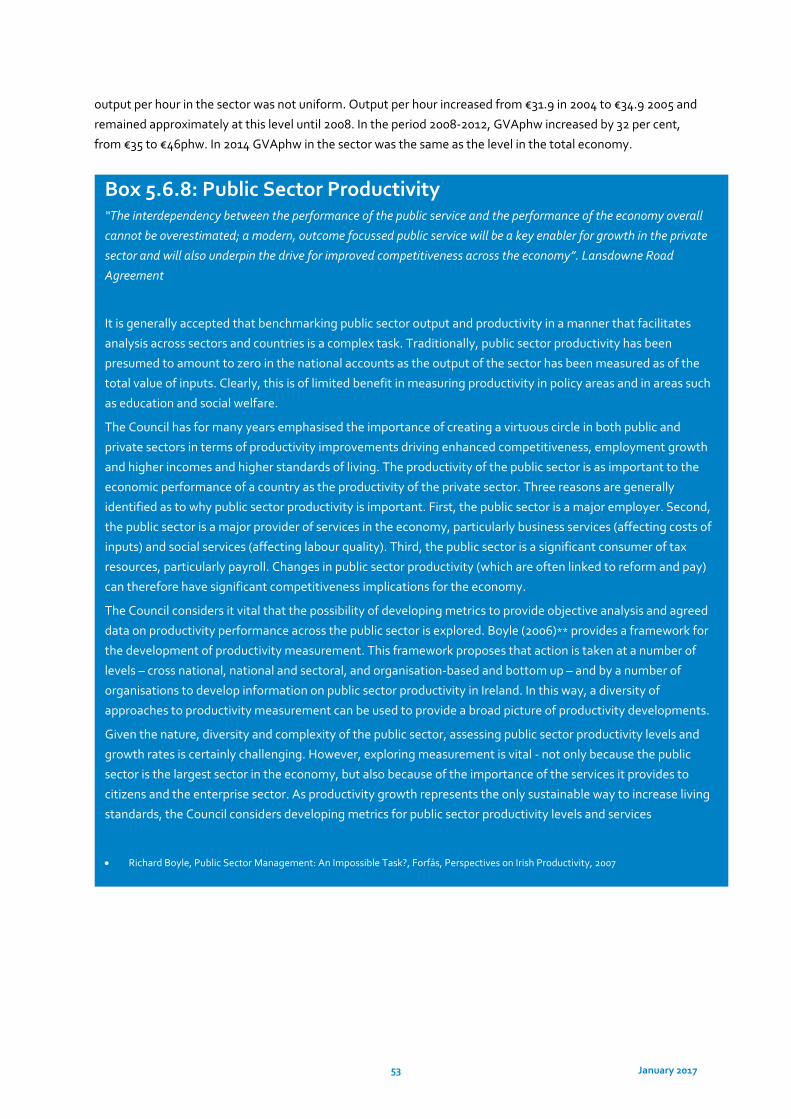
53 January 2017
output per hour in the sector was not uniform. Output per hour increased from €31.9 in 2004 to €34.9 2005 and
remained approximately at this level until 2008. In the period 2008-2012, GVAphw increased by 32 per cent,
from €35 to €46phw. In 2014 GVAphw in the sector was the same as the level in the total economy.
Box 5.6.8: Public Sector Productivity “The interdependency between the performance of the public service and the performance of the economy overall
cannot be overestimated; a modern, outcome focussed public service will be a key enabler for growth in the private
sector and will also underpin the drive for improved competitiveness across the economy”. Lansdowne Road
Agreement
It is generally accepted that benchmarking public sector output and productivity in a manner that facilitates
analysis across sectors and countries is a complex task. Traditionally, public sector productivity has been
presumed to amount to zero in the national accounts as the output of the sector has been measured as of the
total value of inputs. Clearly, this is of limited benefit in measuring productivity in policy areas and in areas such
as education and social welfare.
The Council has for many years emphasised the importance of creating a virtuous circle in both public and
private sectors in terms of productivity improvements driving enhanced competitiveness, employment growth
and higher incomes and higher standards of living. The productivity of the public sector is as important to the
economic performance of a country as the productivity of the private sector. Three reasons are generally
identified as to why public sector productivity is important. First, the public sector is a major employer. Second,
the public sector is a major provider of services in the economy, particularly business services (affecting costs of
inputs) and social services (affecting labour quality). Third, the public sector is a significant consumer of tax
resources, particularly payroll. Changes in public sector productivity (which are often linked to reform and pay)
can therefore have significant competitiveness implications for the economy.
The Council considers it vital that the possibility of developing metrics to provide objective analysis and agreed
data on productivity performance across the public sector is explored. Boyle (2006)** provides a framework for
the development of productivity measurement. This framework proposes that action is taken at a number of
levels – cross national, national and sectoral, and organisation-based and bottom up – and by a number of
organisations to develop information on public sector productivity in Ireland. In this way, a diversity of
approaches to productivity measurement can be used to provide a broad picture of productivity developments.
Given the nature, diversity and complexity of the public sector, assessing public sector productivity levels and
growth rates is certainly challenging. However, exploring measurement is vital - not only because the public
sector is the largest sector in the economy, but also because of the importance of the services it provides to
citizens and the enterprise sector. As productivity growth represents the only sustainable way to increase living
standards, the Council considers developing metrics for public sector productivity levels and services
• Richard Boyle, Public Sector Management: An Impossible Task?, Forfás, Perspectives on Irish Productivity, 2007
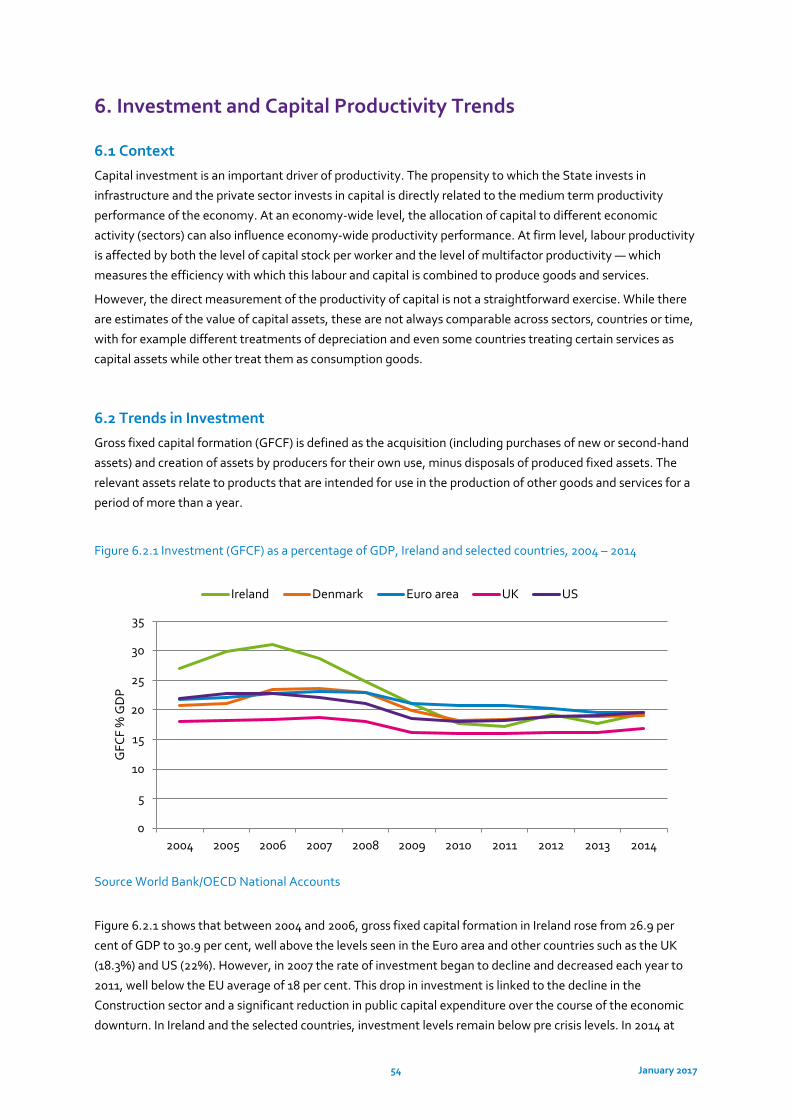
54 January 2017
6. Investment and Capital Productivity Trends
6.1 Context
Capital investment is an important driver of productivity. The propensity to which the State invests in
infrastructure and the private sector invests in capital is directly related to the medium term productivity
performance of the economy. At an economy-wide level, the allocation of capital to different economic
activity (sectors) can also influence economy-wide productivity performance. At firm level, labour productivity
is affected by both the level of capital stock per worker and the level of multifactor productivity — which
measures the efficiency with which this labour and capital is combined to produce goods and services.
However, the direct measurement of the productivity of capital is not a straightforward exercise. While there
are estimates of the value of capital assets, these are not always comparable across sectors, countries or time,
with for example different treatments of depreciation and even some countries treating certain services as
capital assets while other treat them as consumption goods.
6.2 Trends in Investment
Gross fixed capital formation (GFCF) is defined as the acquisition (including purchases of new or second-hand
assets) and creation of assets by producers for their own use, minus disposals of produced fixed assets. The
relevant assets relate to products that are intended for use in the production of other goods and services for a
period of more than a year.
Figure 6.2.1 Investment (GFCF) as a percentage of GDP, Ireland and selected countries, 2004 – 2014
Source World Bank/OECD National Accounts
Figure 6.2.1 shows that between 2004 and 2006, gross fixed capital formation in Ireland rose from 26.9 per
cent of GDP to 30.9 per cent, well above the levels seen in the Euro area and other countries such as the UK
(18.3%) and US (22%). However, in 2007 the rate of investment began to decline and decreased each year to
2011, well below the EU average of 18 per cent. This drop in investment is linked to the decline in the
Construction sector and a significant reduction in public capital expenditure over the course of the economic
downturn. In Ireland and the selected countries, investment levels remain below pre crisis levels. In 2014 at
0
5
10
15
20
25
30
35
2004 2005 2006 2007 2008 2009 2010 2011 2012 2013 2014
GFC
F %
GD
P
Ireland Denmark Euro area UK US
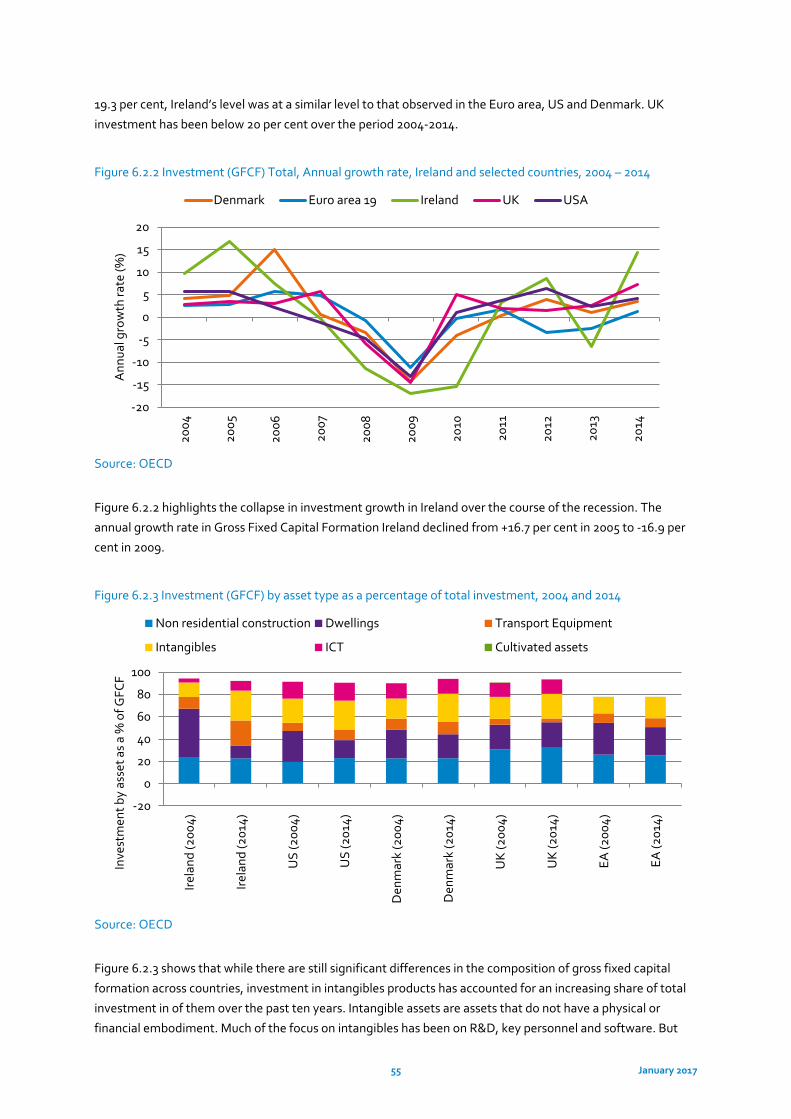
55 January 2017
19.3 per cent, Ireland’s level was at a similar level to that observed in the Euro area, US and Denmark. UK
investment has been below 20 per cent over the period 2004-2014.
Figure 6.2.2 Investment (GFCF) Total, Annual growth rate, Ireland and selected countries, 2004 – 2014
Source: OECD
Figure 6.2.2 highlights the collapse in investment growth in Ireland over the course of the recession. The
annual growth rate in Gross Fixed Capital Formation Ireland declined from +16.7 per cent in 2005 to -16.9 per
cent in 2009.
Figure 6.2.3 Investment (GFCF) by asset type as a percentage of total investment, 2004 and 2014
Source: OECD
Figure 6.2.3 shows that while there are still significant differences in the composition of gross fixed capital
formation across countries, investment in intangibles products has accounted for an increasing share of total
investment in of them over the past ten years. Intangible assets are assets that do not have a physical or
financial embodiment. Much of the focus on intangibles has been on R&D, key personnel and software. But
-20
-15
-10
-5
0
5
10
15
20
2004
2005
2006
2007
2008
2009
2010
2011
2012
2013
2014
Ann
ual g
row
th ra
te (%
)
Denmark Euro area 19 Ireland UK USA
-20
0
20
40
60
80
100
Irela
nd (2
004)
Irela
nd (2
014)
US
(200
4)
US
(201
4)
Den
mar
k (2
004)
Den
mar
k (2
014)
UK
(200
4)
UK
(201
4)
EA (2
004)
EA (2
014)
Inve
stm
ent b
y as
set a
s a
% o
f GFC
F
Non residential construction Dwellings Transport Equipment
Intangibles ICT Cultivated assets
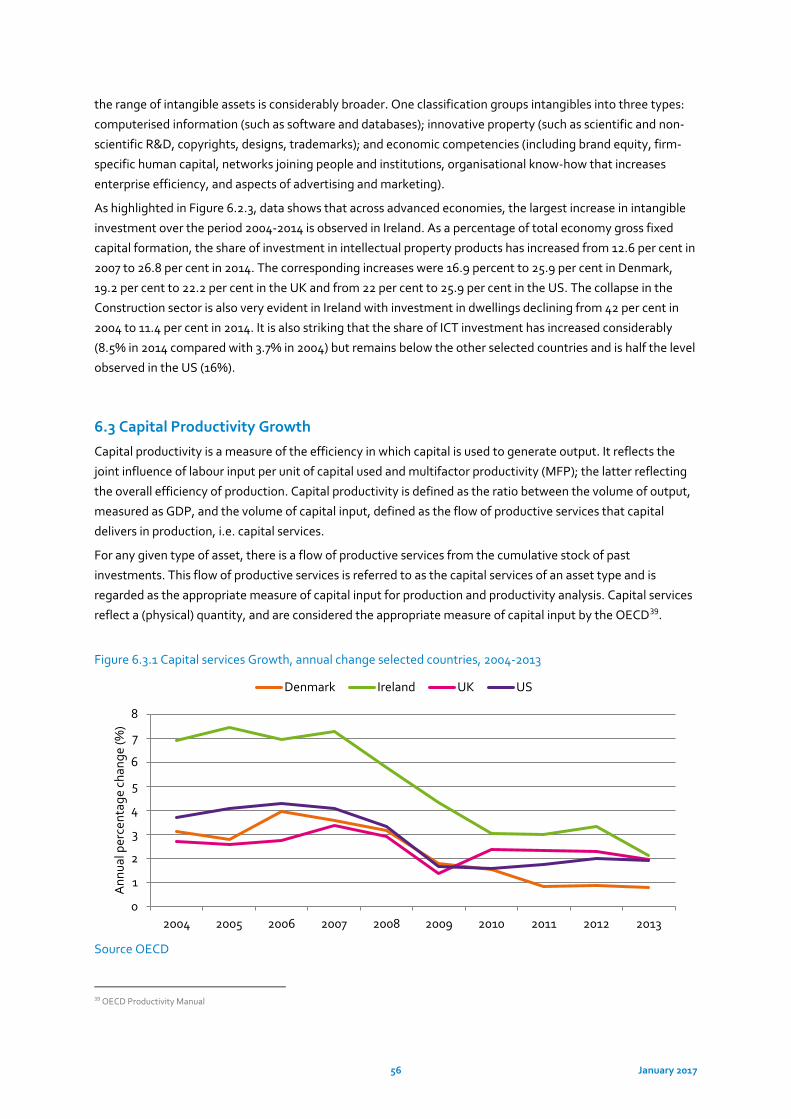
56 January 2017
the range of intangible assets is considerably broader. One classification groups intangibles into three types:
computerised information (such as software and databases); innovative property (such as scientific and non-
scientific R&D, copyrights, designs, trademarks); and economic competencies (including brand equity, firm-
specific human capital, networks joining people and institutions, organisational know-how that increases
enterprise efficiency, and aspects of advertising and marketing).
As highlighted in Figure 6.2.3, data shows that across advanced economies, the largest increase in intangible
investment over the period 2004-2014 is observed in Ireland. As a percentage of total economy gross fixed
capital formation, the share of investment in intellectual property products has increased from 12.6 per cent in
2007 to 26.8 per cent in 2014. The corresponding increases were 16.9 percent to 25.9 per cent in Denmark,
19.2 per cent to 22.2 per cent in the UK and from 22 per cent to 25.9 per cent in the US. The collapse in the
Construction sector is also very evident in Ireland with investment in dwellings declining from 42 per cent in
2004 to 11.4 per cent in 2014. It is also striking that the share of ICT investment has increased considerably
(8.5% in 2014 compared with 3.7% in 2004) but remains below the other selected countries and is half the level
observed in the US (16%).
6.3 Capital Productivity Growth
Capital productivity is a measure of the efficiency in which capital is used to generate output. It reflects the
joint influence of labour input per unit of capital used and multifactor productivity (MFP); the latter reflecting
the overall efficiency of production. Capital productivity is defined as the ratio between the volume of output,
measured as GDP, and the volume of capital input, defined as the flow of productive services that capital
delivers in production, i.e. capital services.
For any given type of asset, there is a flow of productive services from the cumulative stock of past
investments. This flow of productive services is referred to as the capital services of an asset type and is
regarded as the appropriate measure of capital input for production and productivity analysis. Capital services
reflect a (physical) quantity, and are considered the appropriate measure of capital input by the OECD39.
Figure 6.3.1 Capital services Growth, annual change selected countries, 2004-2013
Source OECD
39 OECD Productivity Manual
0
1
2
3
4
5
6
7
8
2004 2005 2006 2007 2008 2009 2010 2011 2012 2013
Ann
ual p
erce
ntag
e ch
ange
(%)
Denmark Ireland UK US
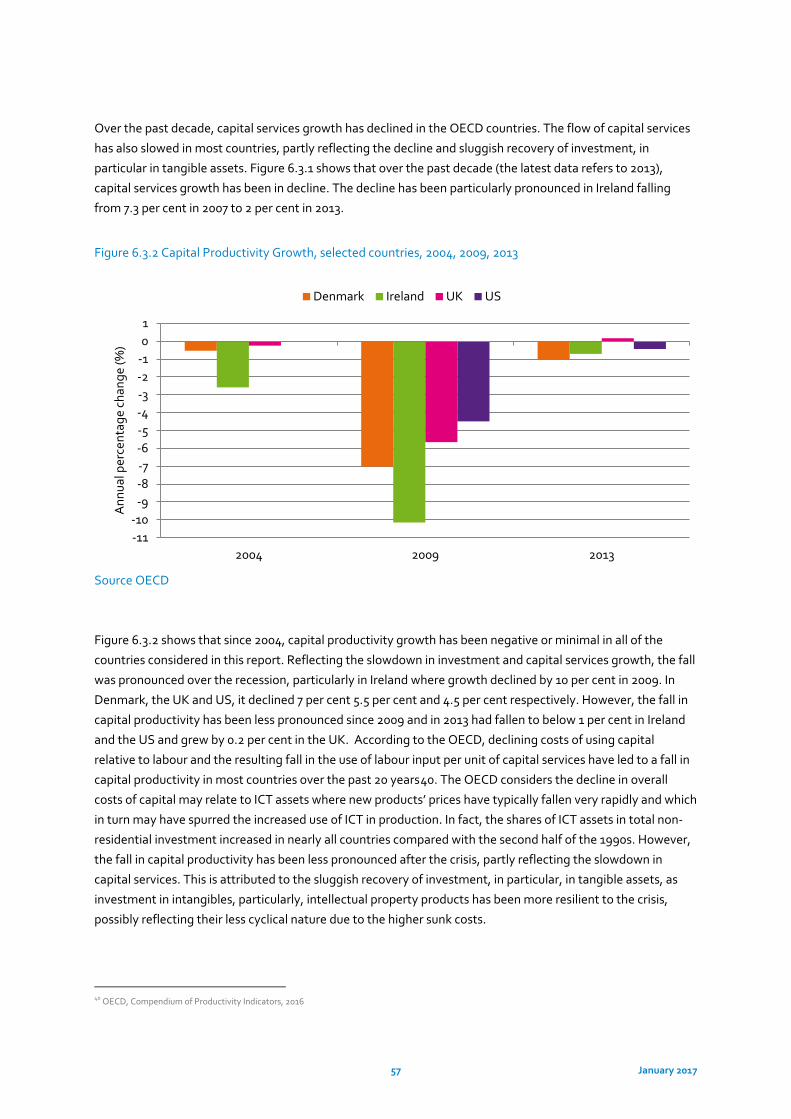
57 January 2017
Over the past decade, capital services growth has declined in the OECD countries. The flow of capital services
has also slowed in most countries, partly reflecting the decline and sluggish recovery of investment, in
particular in tangible assets. Figure 6.3.1 shows that over the past decade (the latest data refers to 2013),
capital services growth has been in decline. The decline has been particularly pronounced in Ireland falling
from 7.3 per cent in 2007 to 2 per cent in 2013.
Figure 6.3.2 Capital Productivity Growth, selected countries, 2004, 2009, 2013
Source OECD
Figure 6.3.2 shows that since 2004, capital productivity growth has been negative or minimal in all of the
countries considered in this report. Reflecting the slowdown in investment and capital services growth, the fall
was pronounced over the recession, particularly in Ireland where growth declined by 10 per cent in 2009. In
Denmark, the UK and US, it declined 7 per cent 5.5 per cent and 4.5 per cent respectively. However, the fall in
capital productivity has been less pronounced since 2009 and in 2013 had fallen to below 1 per cent in Ireland
and the US and grew by 0.2 per cent in the UK. According to the OECD, declining costs of using capital
relative to labour and the resulting fall in the use of labour input per unit of capital services have led to a fall in
capital productivity in most countries over the past 20 years40. The OECD considers the decline in overall
costs of capital may relate to ICT assets where new products’ prices have typically fallen very rapidly and which
in turn may have spurred the increased use of ICT in production. In fact, the shares of ICT assets in total non-
residential investment increased in nearly all countries compared with the second half of the 1990s. However,
the fall in capital productivity has been less pronounced after the crisis, partly reflecting the slowdown in
capital services. This is attributed to the sluggish recovery of investment, in particular, in tangible assets, as
investment in intangibles, particularly, intellectual property products has been more resilient to the crisis,
possibly reflecting their less cyclical nature due to the higher sunk costs.
40 OECD, Compendium of Productivity Indicators, 2016
-11-10
-9-8-7-6-5-4-3-2-101
2004 2009 2013
Ann
ual p
erce
ntag
e ch
ange
(%)
Denmark Ireland UK US
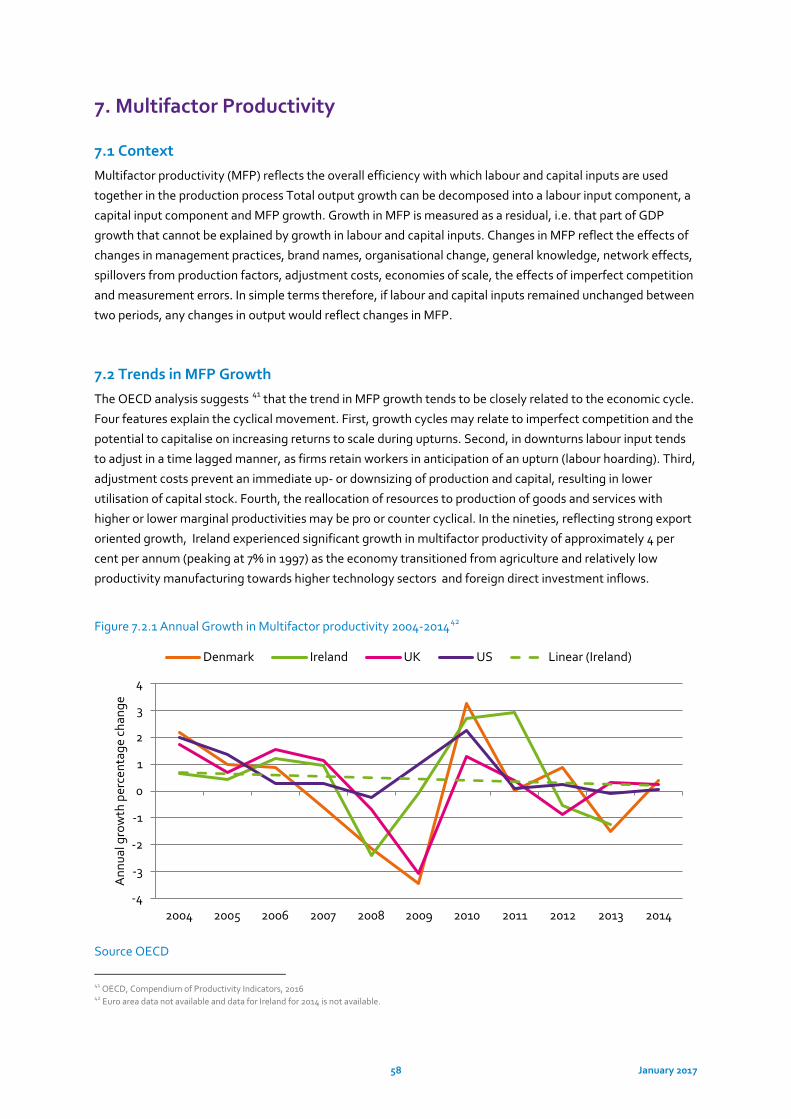
58 January 2017
7. Multifactor Productivity
7.1 Context
Multifactor productivity (MFP) reflects the overall efficiency with which labour and capital inputs are used
together in the production process Total output growth can be decomposed into a labour input component, a
capital input component and MFP growth. Growth in MFP is measured as a residual, i.e. that part of GDP
growth that cannot be explained by growth in labour and capital inputs. Changes in MFP reflect the effects of
changes in management practices, brand names, organisational change, general knowledge, network effects,
spillovers from production factors, adjustment costs, economies of scale, the effects of imperfect competition
and measurement errors. In simple terms therefore, if labour and capital inputs remained unchanged between
two periods, any changes in output would reflect changes in MFP.
7.2 Trends in MFP Growth
The OECD analysis suggests 41 that the trend in MFP growth tends to be closely related to the economic cycle.
Four features explain the cyclical movement. First, growth cycles may relate to imperfect competition and the
potential to capitalise on increasing returns to scale during upturns. Second, in downturns labour input tends
to adjust in a time lagged manner, as firms retain workers in anticipation of an upturn (labour hoarding). Third,
adjustment costs prevent an immediate up- or downsizing of production and capital, resulting in lower
utilisation of capital stock. Fourth, the reallocation of resources to production of goods and services with
higher or lower marginal productivities may be pro or counter cyclical. In the nineties, reflecting strong export
oriented growth, Ireland experienced significant growth in multifactor productivity of approximately 4 per
cent per annum (peaking at 7% in 1997) as the economy transitioned from agriculture and relatively low
productivity manufacturing towards higher technology sectors and foreign direct investment inflows.
Figure 7.2.1 Annual Growth in Multifactor productivity 2004-201442
Source OECD Source OECD
41 OECD, Compendium of Productivity Indicators, 2016 42 Euro area data not available and data for Ireland for 2014 is not available.
-4
-3
-2
-1
0
1
2
3
4
2004 2005 2006 2007 2008 2009 2010 2011 2012 2013 2014
Ann
ual g
row
th p
erce
ntag
e ch
ange
Denmark Ireland UK US Linear (Ireland)
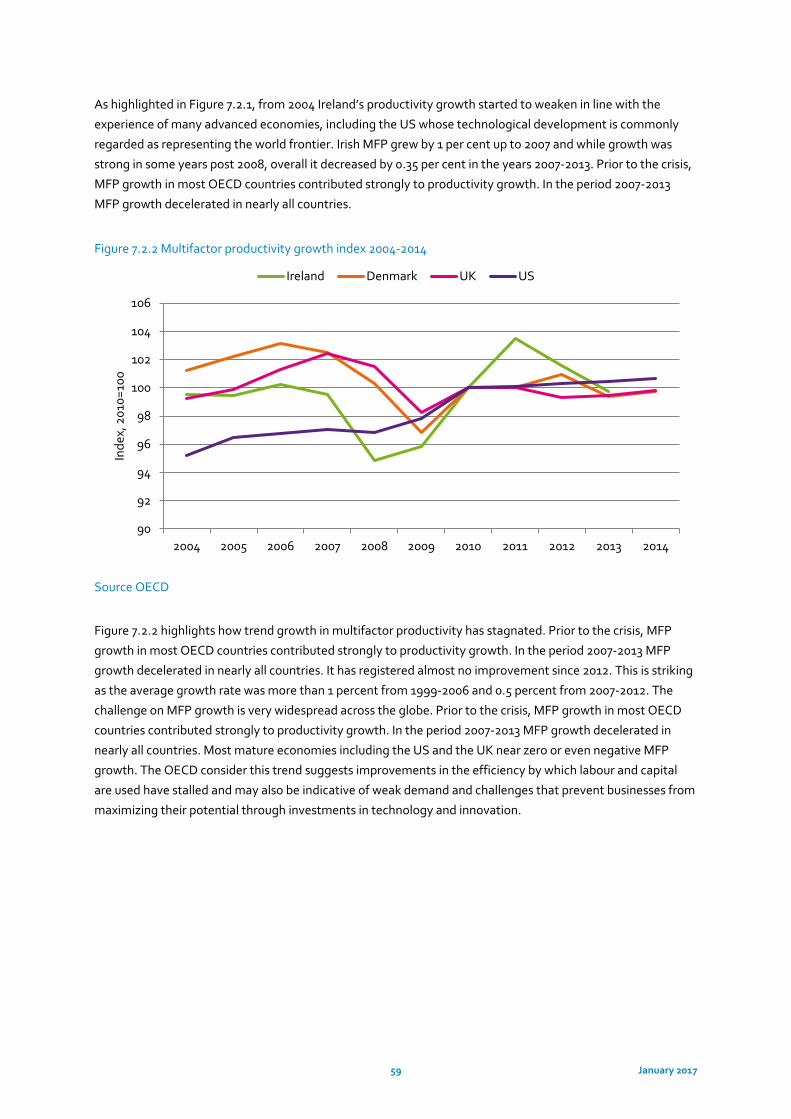
59 January 2017
As highlighted in Figure 7.2.1, from 2004 Ireland’s productivity growth started to weaken in line with the
experience of many advanced economies, including the US whose technological development is commonly
regarded as representing the world frontier. Irish MFP grew by 1 per cent up to 2007 and while growth was
strong in some years post 2008, overall it decreased by 0.35 per cent in the years 2007-2013. Prior to the crisis,
MFP growth in most OECD countries contributed strongly to productivity growth. In the period 2007-2013
MFP growth decelerated in nearly all countries.
Figure 7.2.2 Multifactor productivity growth index 2004-2014
Source OECD
Figure 7.2.2 highlights how trend growth in multifactor productivity has stagnated. Prior to the crisis, MFP
growth in most OECD countries contributed strongly to productivity growth. In the period 2007-2013 MFP
growth decelerated in nearly all countries. It has registered almost no improvement since 2012. This is striking
as the average growth rate was more than 1 percent from 1999-2006 and 0.5 percent from 2007-2012. The
challenge on MFP growth is very widespread across the globe. Prior to the crisis, MFP growth in most OECD
countries contributed strongly to productivity growth. In the period 2007-2013 MFP growth decelerated in
nearly all countries. Most mature economies including the US and the UK near zero or even negative MFP
growth. The OECD consider this trend suggests improvements in the efficiency by which labour and capital
are used have stalled and may also be indicative of weak demand and challenges that prevent businesses from
maximizing their potential through investments in technology and innovation.
90
92
94
96
98
100
102
104
106
2004 2005 2006 2007 2008 2009 2010 2011 2012 2013 2014
Inde
x, 2
010=
100
Ireland Denmark UK US
60 January 2017
8. Productivity and Firm Level Characteristics
8.1 Context
Productivity growth at firm-level is dependent on a wide range of factors, including sector of activity age and
size. Enterprise size classes are defined by the number of persons employed. The main classes by size are:
Micro firms: with less than 10 persons employed;
Small firms: with 10 to 49 persons employed;
Medium-sized firms: with 50 to 249 persons employed;
Large firms: with 250 or more persons employed.
CSO data43 shows there were over 238,000 active enterprises in the private business economy in Ireland in
2014, with over 1.3 million persons engaged. 31 per cent of persons engaged are in large firms, 28 per cent in
micro firms, 22 per cent in small firms and 19 per cent in medium firms. In most OECD countries, large firms
account for a considerable part of the value added of the business sector despite constituting less than 1% of
businesses. In Ireland, small and medium enterprises (SMEs) account for 72 per cent of persons engaged and
for 99.8 per cent of the total enterprise population. The performance of SMEs and micro enterprises matters in
Ireland and across the OECD, where they account for over 95 per cent of firms and 60-70 per cent of
employment and generate a large share of new jobs, particularly in the services sector. In terms of
international comparisons (latest data available is for 2013), Ireland’s largest sector of active firms, the
Services sector, at 51 per cent is higher than the EU average (46.5%) but lower than Demark (51%) and the UK
(57%).
8.2 Labour Productivity by Firm Size
Productivity generally tends to increase with firm size, as large firms exploit increasing returns to scale. While
larger firms are generally found to be more productive, increasingly the OECD find that productivity growth in
smaller firms may be spurred by ICT application and competitive advantages in specialty or high intellectual
property content activities. New small firms are often found to spur aggregate productivity growth as they
enter with new technologies and stimulate productivity-enhancing changes by incumbents. The reallocation
of resources across firms, driven by firm dynamics, is also expected to increase aggregate productivity through
a process of “creative destruction”, whereby innovative firms enter the market and expand while displacing
lower productivity firms. Across OECD member states, productivity developments are determined by the
diverging performance of three types of firms: the globally most productive (i.e. global frontier firms), the
most advanced firms nationally and laggard firms. Productivity growth of the globally most productive firms is
strong but the gap between high productivity firms and the rest has increased. The interaction between these
three cohorts combines to determine overall productivity performance. Analysing this development, the
OECD concludes that “the main source of the productivity slowdown is not so much a slowing of innovation by
the most globally advanced firms, but rather a slowing of the pace at which innovations spread throughout the
economy: a breakdown of the diffusion machine.”44
Figure 8.2.1 draws on data published in the OECD’s 2016 Entrepreneurship at a Glance report and shows that
in most countries compared to large firms there is a significant productivity gap between micro, small and
43 CSO, Business Demography 2014, 2016 44 OECD, The Future of Productivity, 2015
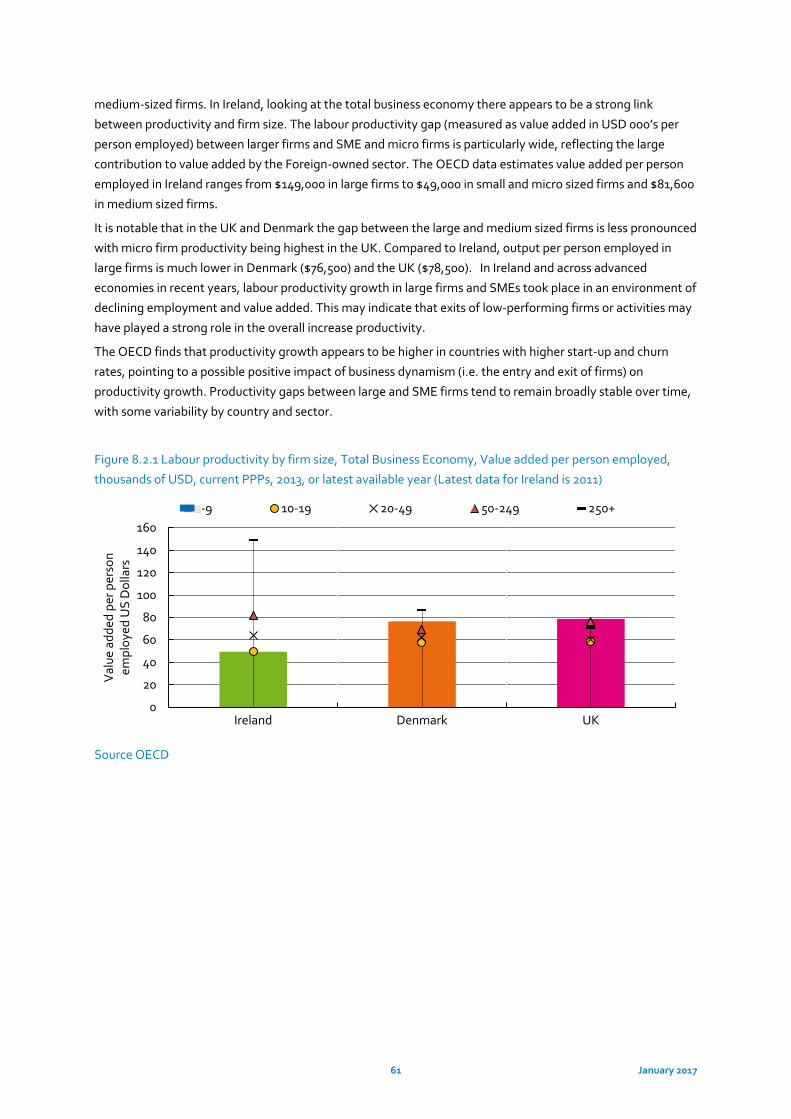
61 January 2017
medium-sized firms. In Ireland, looking at the total business economy there appears to be a strong link
between productivity and firm size. The labour productivity gap (measured as value added in USD 000’s per
person employed) between larger firms and SME and micro firms is particularly wide, reflecting the large
contribution to value added by the Foreign-owned sector. The OECD data estimates value added per person
employed in Ireland ranges from $149,000 in large firms to $49,000 in small and micro sized firms and $81,600
in medium sized firms.
It is notable that in the UK and Denmark the gap between the large and medium sized firms is less pronounced
with micro firm productivity being highest in the UK. Compared to Ireland, output per person employed in
large firms is much lower in Denmark ($76,500) and the UK ($78,500). In Ireland and across advanced
economies in recent years, labour productivity growth in large firms and SMEs took place in an environment of
declining employment and value added. This may indicate that exits of low-performing firms or activities may
have played a strong role in the overall increase productivity.
The OECD finds that productivity growth appears to be higher in countries with higher start-up and churn
rates, pointing to a possible positive impact of business dynamism (i.e. the entry and exit of firms) on
productivity growth. Productivity gaps between large and SME firms tend to remain broadly stable over time,
with some variability by country and sector.
Figure 8.2.1 Labour productivity by firm size, Total Business Economy, Value added per person employed,
thousands of USD, current PPPs, 2013, or latest available year (Latest data for Ireland is 2011)
Source OECD
0
20
40
60
80
100
120
140
160
Ireland Denmark UK
Val
ue a
dded
per
per
son
empl
oyed
US
Dol
lars
1-9 10-19 20-49 50-249 250+
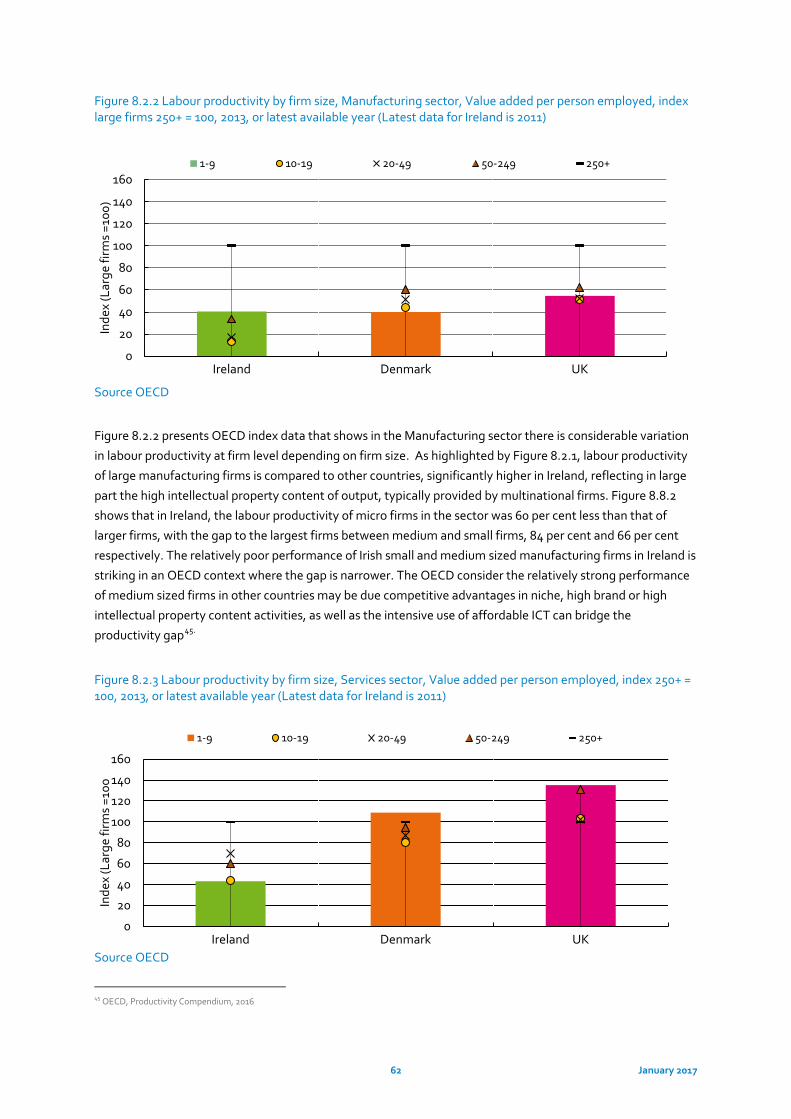
62 January 2017
Figure 8.2.2 Labour productivity by firm size, Manufacturing sector, Value added per person employed, index large firms 250+ = 100, 2013, or latest available year (Latest data for Ireland is 2011)
Source OECD
Figure 8.2.2 presents OECD index data that shows in the Manufacturing sector there is considerable variation
in labour productivity at firm level depending on firm size. As highlighted by Figure 8.2.1, labour productivity
of large manufacturing firms is compared to other countries, significantly higher in Ireland, reflecting in large
part the high intellectual property content of output, typically provided by multinational firms. Figure 8.8.2
shows that in Ireland, the labour productivity of micro firms in the sector was 60 per cent less than that of
larger firms, with the gap to the largest firms between medium and small firms, 84 per cent and 66 per cent
respectively. The relatively poor performance of Irish small and medium sized manufacturing firms in Ireland is
striking in an OECD context where the gap is narrower. The OECD consider the relatively strong performance
of medium sized firms in other countries may be due competitive advantages in niche, high brand or high
intellectual property content activities, as well as the intensive use of affordable ICT can bridge the
productivity gap45.
Figure 8.2.3 Labour productivity by firm size, Services sector, Value added per person employed, index 250+ = 100, 2013, or latest available year (Latest data for Ireland is 2011)
Source OECD
45 OECD, Productivity Compendium, 2016
0
20
40
60
80
100
120
140
160
Ireland Denmark UK
Inde
x (L
arge
firm
s =1
00)
1-9 10-19 20-49 50-249 250+
0
20
40
60
80
100
120
140
160
Ireland Denmark UK
Inde
x (L
arge
firm
s =1
00
1-9 10-19 20-49 50-249 250+
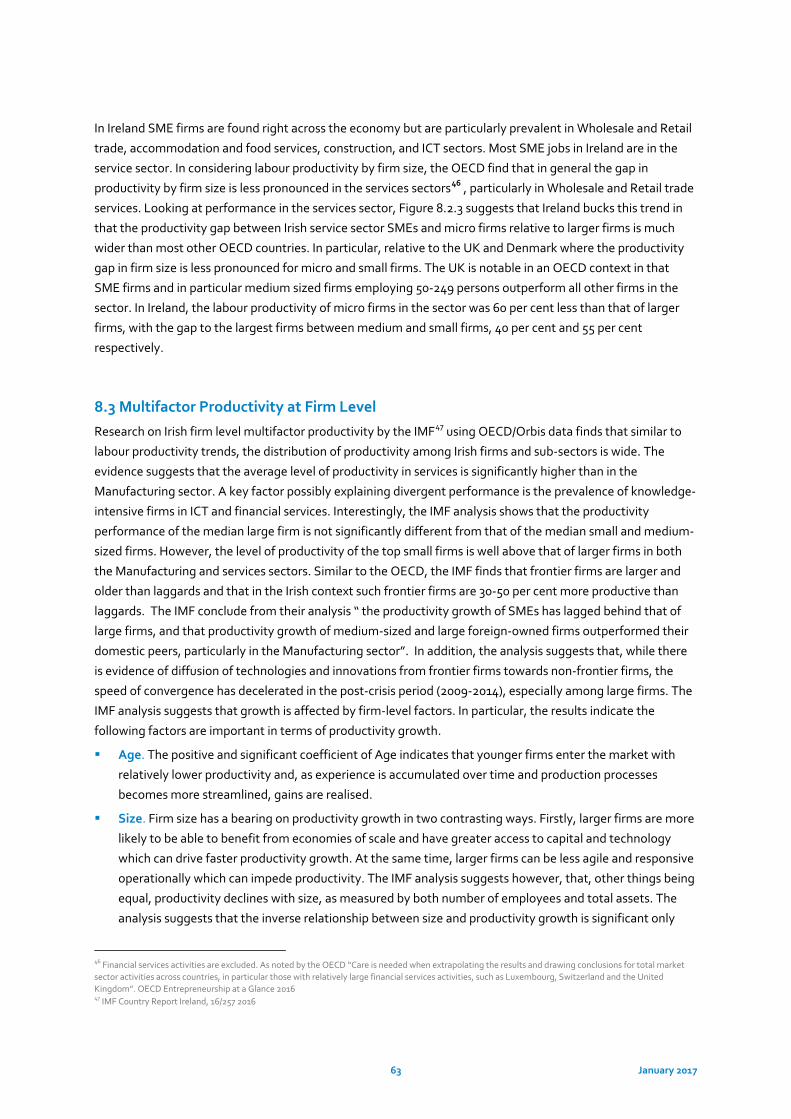
63 January 2017
In Ireland SME firms are found right across the economy but are particularly prevalent in Wholesale and Retail
trade, accommodation and food services, construction, and ICT sectors. Most SME jobs in Ireland are in the
service sector. In considering labour productivity by firm size, the OECD find that in general the gap in
productivity by firm size is less pronounced in the services sectors46 , particularly in Wholesale and Retail trade
services. Looking at performance in the services sector, Figure 8.2.3 suggests that Ireland bucks this trend in
that the productivity gap between Irish service sector SMEs and micro firms relative to larger firms is much
wider than most other OECD countries. In particular, relative to the UK and Denmark where the productivity
gap in firm size is less pronounced for micro and small firms. The UK is notable in an OECD context in that
SME firms and in particular medium sized firms employing 50-249 persons outperform all other firms in the
sector. In Ireland, the labour productivity of micro firms in the sector was 60 per cent less than that of larger
firms, with the gap to the largest firms between medium and small firms, 40 per cent and 55 per cent
respectively.
8.3 Multifactor Productivity at Firm Level
Research on Irish firm level multifactor productivity by the IMF47 using OECD/Orbis data finds that similar to
labour productivity trends, the distribution of productivity among Irish firms and sub-sectors is wide. The
evidence suggests that the average level of productivity in services is significantly higher than in the
Manufacturing sector. A key factor possibly explaining divergent performance is the prevalence of knowledge-
intensive firms in ICT and financial services. Interestingly, the IMF analysis shows that the productivity
performance of the median large firm is not significantly different from that of the median small and medium-
sized firms. However, the level of productivity of the top small firms is well above that of larger firms in both
the Manufacturing and services sectors. Similar to the OECD, the IMF finds that frontier firms are larger and
older than laggards and that in the Irish context such frontier firms are 30-50 per cent more productive than
laggards. The IMF conclude from their analysis “ the productivity growth of SMEs has lagged behind that of
large firms, and that productivity growth of medium-sized and large foreign-owned firms outperformed their
domestic peers, particularly in the Manufacturing sector”. In addition, the analysis suggests that, while there
is evidence of diffusion of technologies and innovations from frontier firms towards non-frontier firms, the
speed of convergence has decelerated in the post-crisis period (2009-2014), especially among large firms. The
IMF analysis suggests that growth is affected by firm-level factors. In particular, the results indicate the
following factors are important in terms of productivity growth.
Age. The positive and significant coefficient of Age indicates that younger firms enter the market with
relatively lower productivity and, as experience is accumulated over time and production processes
becomes more streamlined, gains are realised.
Size. Firm size has a bearing on productivity growth in two contrasting ways. Firstly, larger firms are more
likely to be able to benefit from economies of scale and have greater access to capital and technology
which can drive faster productivity growth. At the same time, larger firms can be less agile and responsive
operationally which can impede productivity. The IMF analysis suggests however, that, other things being
equal, productivity declines with size, as measured by both number of employees and total assets. The
analysis suggests that the inverse relationship between size and productivity growth is significant only
46 Financial services activities are excluded. As noted by the OECD “Care is needed when extrapolating the results and drawing conclusions for total market sector activities across countries, in particular those with relatively large financial services activities, such as Luxembourg, Switzerland and the United Kingdom”. OECD Entrepreneurship at a Glance 2016 47 IMF Country Report Ireland, 16/257 2016
64 January 2017
among small firms, which may reflect the prevalence of highly productive start-ups. As noted by the IMF
“This may suggest that most of the factors, which support higher productivity growth among large firms,
are already captured by other variables such as access to finance, innovation, and financial resilience”.
Innovation. Consistent with other studies, the IMF conclude that innovation activities, as measured by
the ratio of intangible assets-to-total assets have a positive effect on growth.
Access to finance and liquidity. The findings indicate that access to funding contributes to productivity
growth. Consistent with this, the results also show that firms with lower cash flow as a share of operating
revenue have, on average, lower productivity gains. Firms in financial distress are also impaired from
realising productivity gains as profitability is limited, and is primarily used to service debt costs.
Ownership. The IMF suggest that the impact on productivity of ownership (foreign or Irish) is uncertain.
Foreign ownership is found to have a positive effect on productivity growth on large and medium-sized
firms and a negative effect among small firms. The IMF suggests that Foreign-owned large and medium-
sized firms “are positioned higher in the value chain and thus are more knowledge-intensive compared to
foreign-owned small firms”.
8.4 Productivity and Firm Ownership
Ireland’s productivity performance (in common with many other countries) is built upon a narrow base of
sectors, and indeed, it is likely in some cases, companies. The presence of foreign multinationals in Ireland,
particularly in the Pharma and ICT sectors has a significant impact on gross domestic product, value added and
accordingly on measures of Irish productivity. Data is not available at OECD level with regard to the
productivity performance of firms disaggregated by foreign ownership.
However, the Annual Business Survey of Economic Impact48 (ABSEI) conducted by the Department of Jobs,
Enterprise and Innovation details employment, sales, exports; value added and direct expenditure for Irish-
owned and Foreign-owned firms. In the ABSEI, value added is calculated as the total sales of a firm less the
cost of materials and services purchased. As a result, it can provide an indication of the specific contribution of
firms/sectors in terms of economic activity and an imperfect proxy for productivity as measured by value
added per person employed rather than hours worked.
The ABSEI shows that value added by all agency client companies increased over the period 2004-2014 by
24.8 per cent and in 2014 amounted to €59.44 billion. 80 per cent of this value was generated in Foreign-
owned firms. Value added by Foreign-owned firms amounted to €47.3 billion of the total in 2014 an increase of
21 per cent on 2004 levels. In terms of the sectoral composition of Foreign-owned value added, the
Manufacturing sector accounts for 58 per cent of total Foreign-owned value added. In the foreign sector, the
contribution of chemicals to total value added (26%) is particularly significant. ICT accounts for 26 per cent of
Foreign-owned value added. Financial services and other services account for the remaining value added.
Value added by Irish-owned firms has been on an upward trend since 2004 and was estimated at €12.1 billion
in 2014, an increase of 42 per cent on 2004. In 2014 the majority (54.7%) of value added by Irish-owned firms
was generated by firms operating in the Manufacturing sector with value added by ICT firms at 13 per cent.
Financial services and other services account for the remaining value added.
48 The Annual Business Survey of Economic Impact is a survey of approximately 4000 client companies of the agencies Enterprise Ireland, IDA Ireland and Údarás na Gaeltachta employing ten or more employees in Ireland. It comprises all the Manufacturing, ICT and Other Services sectors.
65 January 2017
In terms of ABSEI employment49, total employment in agency supported companies increased from 266,334
in 2004 to 286,036 in 2014 (+7.4%). Considering total (Irish and foreign) employment by sectoral share,
Manufacturing is the dominant employer with 54.8 per cent of total agency supported employment in 2014.
The Medical Devices sector holds 15.3 per cent of employment, with the Chemicals sector the next most
significant in terms of employment with 14.1 per cent. In Services, the Information, Communications and
Computer Services sector has the highest share of total employment, at 37.7 per cent in 2014. Employment in
Foreign-owned firms accounted for 55 per cent of total agency employment in 2004 and 49.9 percent in 2014.
Over the period 2004 to 2014, employment in Foreign-owned firms declined by 2.5 per cent from 146,475 to
142,791, with the largest absolute decline witnessed in traditional Manufacturing sectors such as the
Computer, Electronic & Optical Products sector. This was offset by a large increase in medical devices
employment and by an increase in services employment, particularly computer programming and Financial
Services. Total employment in Irish-owned firms increased to 143,248 in 2014 (+19.5%) compared with
119,886 in 2004. Significant increases in employment are evident in the Information, Communications & Other
Services sectors where employment increased by 92 per cent in the period 2004-2014. This strong growth
accounted for the vast majority of the increase in Irish-owned employment. Employment in Irish-owned
manufacturing declined by 4 per cent in the period 2004-2014, with notable declines evident in traditional
Manufacturing sectors such as non-metallic minerals and wood products.
Table 8.4.1 Value Added per person employed, €000’s, Irish and Foreign-Owned firms 2004 and 2014
ABSEI Sector Irish
2004
Irish
2014
Foreign
2004
Foreign
2014
Manufacturing & Other Industry (including Primary
Production)
€k €k €k €k
Agriculture, Fishing, Forestry, Mining & Quarrying 49.9 59.4 25.7 na
Food, Drink & Tobacco 44.8 71.6 267.4 527.7
Textiles, Clothing, Footwear & Leather 45.2 68 62.5 19.5
Wood & Wood Products 49.6 45.7 106.4 76.6
Paper & Printing 51.3 66.5 118.9 59
Chemicals 47 68 648.9 608.7
Rubber & Plastics 66.4 71 133.9 178.8
Non-Metallic Minerals 70.5 64.4 200 71
Basic & Fabricated Metal Products 51.4 58.3 72.5 108.6
Computer, Electronic & Optical Products 40.4 64.9 246.1 442.1
Electrical equipment 52.9 88.2 50.1 133.5
Machinery & Equipment 48.8 65.5 101.1 113.2
Transport Equipment 48.6 64.9 64.9 85.9
Medical Device Manufacturing 10.4 25.1 133.1 184.9
49 Employment data is calculated on the basis of data from the ABSEI and are not directly comparable with the results of the DJEI ‘Annual Employment Survey’. The DJEI Annual Employment Survey is a census of employment in all agency-assisted companies as at 31st October. The ABSEI is based on a sample of agency-assisted companies with 10+ employees and is undertaken in the first two quarters of the year.
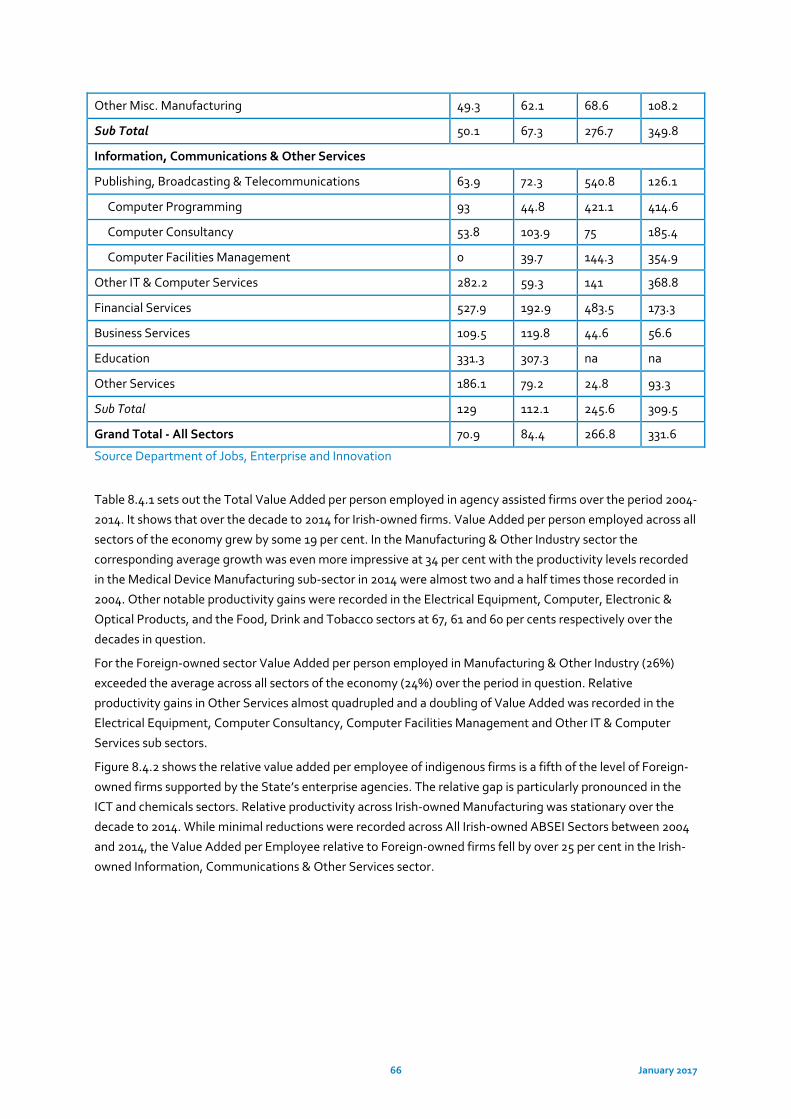
66 January 2017
Other Misc. Manufacturing 49.3 62.1 68.6 108.2
Sub Total 50.1 67.3 276.7 349.8
Information, Communications & Other Services
Publishing, Broadcasting & Telecommunications 63.9 72.3 540.8 126.1
Computer Programming 93 44.8 421.1 414.6
Computer Consultancy 53.8 103.9 75 185.4
Computer Facilities Management 0 39.7 144.3 354.9
Other IT & Computer Services 282.2 59.3 141 368.8
Financial Services 527.9 192.9 483.5 173.3
Business Services 109.5 119.8 44.6 56.6
Education 331.3 307.3 na na
Other Services 186.1 79.2 24.8 93.3
Sub Total 129 112.1 245.6 309.5
Grand Total - All Sectors 70.9 84.4 266.8 331.6
Source Department of Jobs, Enterprise and Innovation
Table 8.4.1 sets out the Total Value Added per person employed in agency assisted firms over the period 2004-
2014. It shows that over the decade to 2014 for Irish-owned firms. Value Added per person employed across all
sectors of the economy grew by some 19 per cent. In the Manufacturing & Other Industry sector the
corresponding average growth was even more impressive at 34 per cent with the productivity levels recorded
in the Medical Device Manufacturing sub-sector in 2014 were almost two and a half times those recorded in
2004. Other notable productivity gains were recorded in the Electrical Equipment, Computer, Electronic &
Optical Products, and the Food, Drink and Tobacco sectors at 67, 61 and 60 per cents respectively over the
decades in question.
For the Foreign-owned sector Value Added per person employed in Manufacturing & Other Industry (26%)
exceeded the average across all sectors of the economy (24%) over the period in question. Relative
productivity gains in Other Services almost quadrupled and a doubling of Value Added was recorded in the
Electrical Equipment, Computer Consultancy, Computer Facilities Management and Other IT & Computer
Services sub sectors.
Figure 8.4.2 shows the relative value added per employee of indigenous firms is a fifth of the level of Foreign-
owned firms supported by the State’s enterprise agencies. The relative gap is particularly pronounced in the
ICT and chemicals sectors. Relative productivity across Irish-owned Manufacturing was stationary over the
decade to 2014. While minimal reductions were recorded across All Irish-owned ABSEI Sectors between 2004
and 2014, the Value Added per Employee relative to Foreign-owned firms fell by over 25 per cent in the Irish-
owned Information, Communications & Other Services sector.
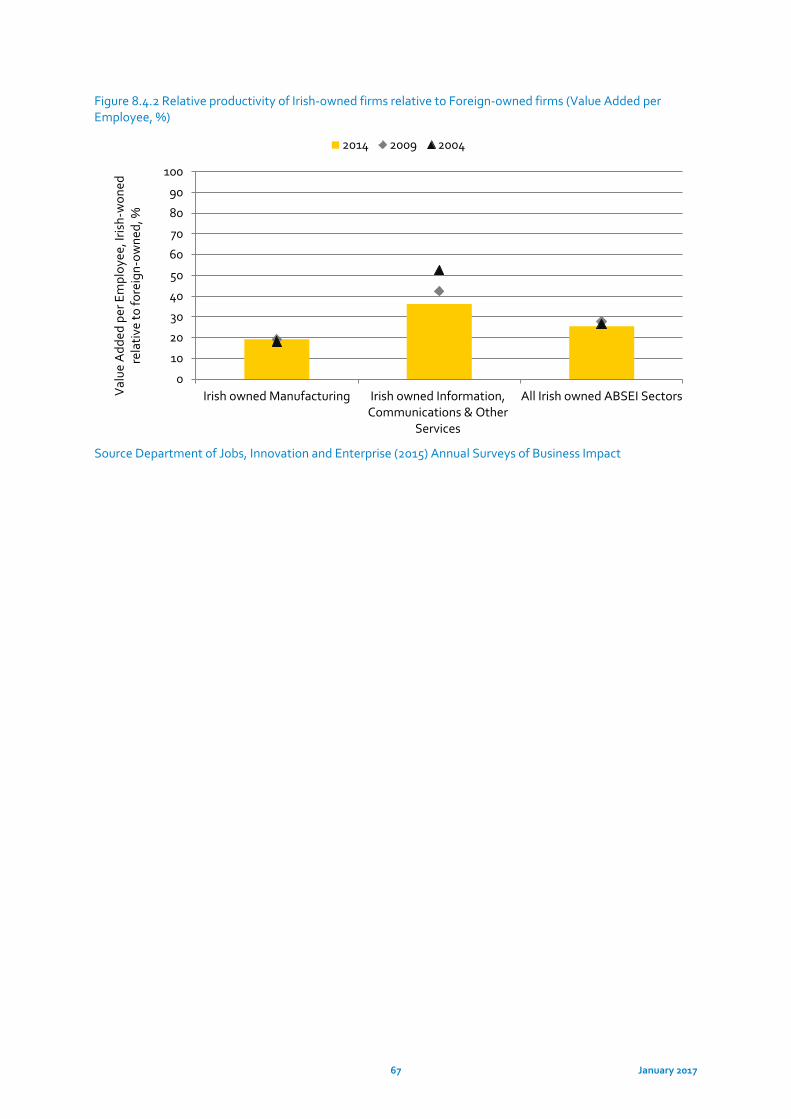
67 January 2017
Figure 8.4.2 Relative productivity of Irish-owned firms relative to Foreign-owned firms (Value Added per Employee, %)
Source Department of Jobs, Innovation and Enterprise (2015) Annual Surveys of Business Impact
0
10
20
30
40
50
60
70
80
90
100
Irish owned Manufacturing Irish owned Information,Communications & Other
Services
All Irish owned ABSEI SectorsVal
ue A
dded
per
Em
ploy
ee, I
rish-
won
ed
rela
tive
to fo
reig
n-ow
ned,
%
2014 2009 2004
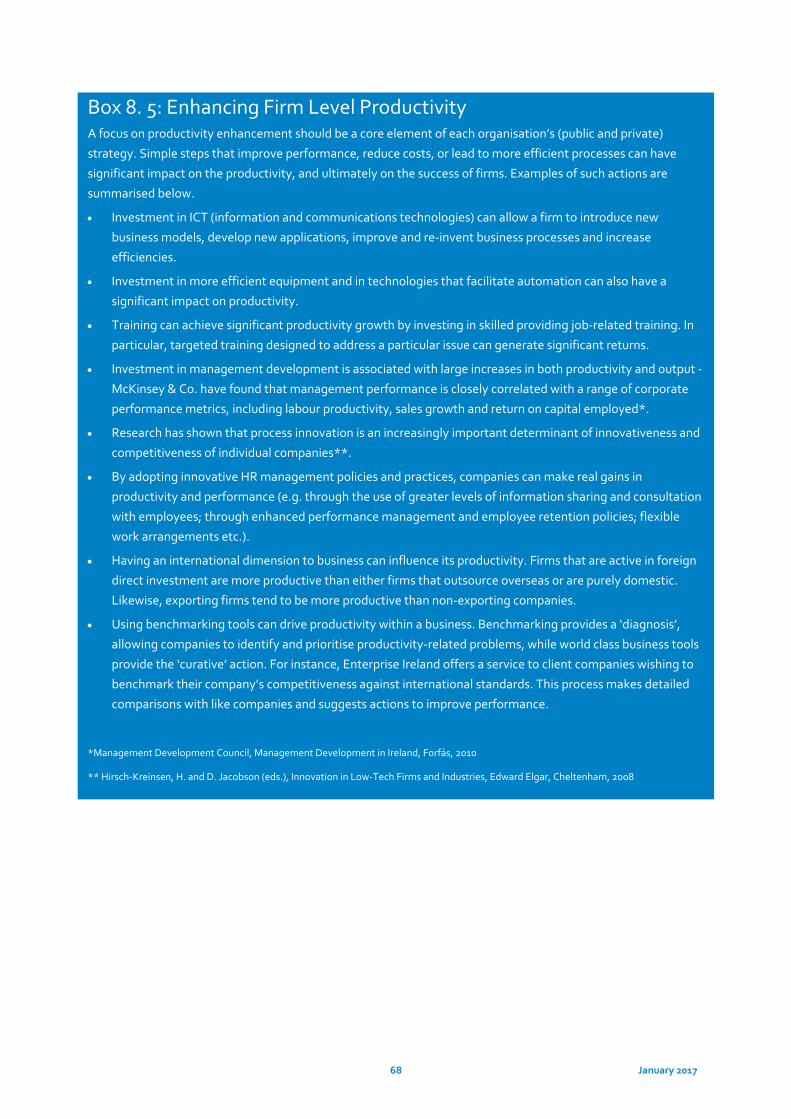
68 January 2017
Box 8. 5: Enhancing Firm Level Productivity A focus on productivity enhancement should be a core element of each organisation’s (public and private)
strategy. Simple steps that improve performance, reduce costs, or lead to more efficient processes can have
significant impact on the productivity, and ultimately on the success of firms. Examples of such actions are
summarised below.
• Investment in ICT (information and communications technologies) can allow a firm to introduce new
business models, develop new applications, improve and re-invent business processes and increase
efficiencies.
• Investment in more efficient equipment and in technologies that facilitate automation can also have a
significant impact on productivity.
• Training can achieve significant productivity growth by investing in skilled providing job-related training. In
particular, targeted training designed to address a particular issue can generate significant returns.
• Investment in management development is associated with large increases in both productivity and output -
McKinsey & Co. have found that management performance is closely correlated with a range of corporate
performance metrics, including labour productivity, sales growth and return on capital employed*.
• Research has shown that process innovation is an increasingly important determinant of innovativeness and
competitiveness of individual companies**.
• By adopting innovative HR management policies and practices, companies can make real gains in
productivity and performance (e.g. through the use of greater levels of information sharing and consultation
with employees; through enhanced performance management and employee retention policies; flexible
work arrangements etc.).
• Having an international dimension to business can influence its productivity. Firms that are active in foreign
direct investment are more productive than either firms that outsource overseas or are purely domestic.
Likewise, exporting firms tend to be more productive than non-exporting companies.
• Using benchmarking tools can drive productivity within a business. Benchmarking provides a ‘diagnosis’,
allowing companies to identify and prioritise productivity-related problems, while world class business tools
provide the ‘curative’ action. For instance, Enterprise Ireland offers a service to client companies wishing to
benchmark their company’s competitiveness against international standards. This process makes detailed
comparisons with like companies and suggests actions to improve performance.
*Management Development Council, Management Development in Ireland, Forfás, 2010
** Hirsch-Kreinsen, H. and D. Jacobson (eds.), Innovation in Low-Tech Firms and Industries, Edward Elgar, Cheltenham, 2008
69 January 2017
9. Conclusions and Implications for Policy
Productivity is a multi-dimensional concept; it reflects our ability to produce more output by better combining
inputs, thanks to new ideas, technological innovations and new business models. The challenges in improving
the quantity and quality of human and productive capital, and enhancing productivity are complex and
significant but key to achieving sustainable economic growth, jobs and improved living standards.
Irish labour productivity and multifactor productivity performance is currently positive and above the OECD
average and that of the UK, US and Euro area. However, shifts in the composition of employment and the
influence of the FDI sector dominate Ireland’s performance. Increasing productivity across all sectors and
occupations remains a significant challenge in ensuring that the economic recovery underway transitions into
sustainable growth. The benchmarking exercise undertaken in this report highlights a relatively overall strong
productivity performance for Ireland over the period 2004-2014. However, this masks significant disparity
across sectors in terms of productivity performance per hours worked and in terms of output. In particular,
performance is heavily influenced by the FDI sector. Even allowing for the impact of Foreign-owned MNC’s on
certain sectors, adjusted productivity estimates by the NCC (2012) suggest that productivity levels in Ireland
are high relative to competitor countries. This report shows the significant variation between sectors and the
extent to which national productivity data can mask significant changes at sectoral and firm level.
The OECD study “The Future of Productivity” demonstrates the importance of diffusion of innovations that
drive the productivity growth of frontier firms to other firms. The OECD finds that the productivity of frontier
industrial firms increased by 3 per cent per annum more than that of other firms in the same sector. That gap
increases to 5 per cent in the services sector, where firms have lower levels of skills and productivity, in
addition to stricter regulation. Future growth will depend to a large extent on reviving the diffusion machine in
each of the national sectors, a factor which propelled a productivity convergence between countries for a large
part of the 20th century. The most effective interventions to boost productivity such as skills programmes,
technology adoption, business process improvements, and regulatory change are likely to need to be sector
specific.
The challenges in improving the quantity and quality of human and productive capital, and enhancing total
factor productivity (through technological change, innovation and the application of competition policy) are
significant but key to achieving sustainable competitiveness resulting in economic growth, jobs and improved
living standards. It is difficult however for policymakers to directly target macro level productivity
performance through single policy measures. For example, capital investment provides the infrastructure
necessary for enterprise to conduct their operations in a more efficient manner; education and training
programmes produce more highly skilled workers who can adapt to the changing needs of employers; and
measures to improve credit flows and access to finance ensure that firms have the resources necessary to
make investments in technologies to improve their processes, products and services. Innovation is at the heart
of the productivity agenda. Innovative economies tend to be more productive, more adaptable and better able
to support higher living standards. High levels of innovation require investment in research and development
(R&D), by both the public and private sector; the presence of high-quality scientific research personnel and
institutions; collaboration between universities and industry; and the application of advanced business
processes and practices by enterprise. Competition policy also has a role in driving efficiencies, boosting
productivity and stimulating innovation. Recognising that firms do not just compete on price, competition
fosters innovation in the form of new products and services and supports economic growth as firms realise
they must offer new and improved products and services to stay ahead of their competitors. The narrow base
of companies and sectors driving overall productivity performance leaves Ireland vulnerable to external shocks
but also serves to highlight the scope for reform.
70 January 2017
The OECD’s research suggests that a key factor affecting an economy’s ability to sustain long term
productivity will be participation in global trade and international investment. It has long been recognised that
trade can be a spur to productivity growth and there is a vast literature documenting the positive effects of
trade on productivity performance. Firms which are more heavily exposed to international competition benefit
from a larger market and will have a stronger incentive to innovate and find efficiency improvements than
businesses which are more sheltered in domestic markets.
Recognising the importance that productivity plays as the key driver of longer term competitiveness and
prosperity is essential. In this regard, the prominence accorded to productivity performance in Enterprise 2025
(EP2025) is to be welcomed. EP2025 sets out a target for Ireland to achieve 2- 2.5 per cent growth in
productivity per annum over the next ten years. Taking a whole of enterprise approach, EP2025 sets out a
range of actions to improve the operating environment for amongst firms and sectors, boosting
internationalisation, fostering emerging sectors, and stimulating innovation are all set out.
The policy mix that best supports robust and broader based productivity growth varies significantly between
countries reflecting country-specific conditions such as the composition of their economies and state of
economic development50. Given the multiple factors that can influence productivity growth, the impact of
reforms on productivity growth will vary considerably between countries. As set out in the 2016
Competitiveness Challenge report the Council consider the following factors as particularly important to
broadening and deepening Irish productivity growth in the medium term.
Extending global connectedness, via trade, FDI, and participation in Global Value Chains (GVCs);
Fostering innovative indigenous start-ups, scaling and improving survival rates;
Deepening innovation capacity, capability and activity at firm level, particularly in SMEs and Ireland’s non-
exporting sectors
9.1 Extending Global Connectedness via Trade, FDI, and Participation in Global Value Chains
As a small open economy, Ireland’s ability to achieve sustainable growth is dependent on our ability to trade
internationally and maintain export trade competitiveness. Trade can facilitate productivity growth in that it
drives greater specialisation in activities where a country or a firm has a comparative advantage. Access to a
larger market allows firms to benefit from economies of scale, generating larger volumes of activity without
increasing the number of people employed or other inputs in the same proportion. Firms which are more
heavily exposed to international competition benefit from a larger market and will have a stronger incentive to
innovate and find efficiency improvements than businesses which are more sheltered in domestic markets.
The empirical evidence suggests strong link between trade, productivity and growth. Long-term evidence
from EU countries shows that a 1 per cent increase in the openness of the economy leads to an increase of 0.6
per cent in labour productivity51. A recent working paper by the IMF52 notes that reductions in barriers to trade
have been a driver of both output and productivity growth. While barriers to trade in advanced countries have
been reduced substantially in recent decades, there is scope for elimination of remaining tariffs and barriers to
inward investment which would yield positive productivity gains. This preliminary analysis by the IMF suggests
that the scale of the aggregate productivity gain from eliminating barriers to trade is related to sector level
tariff rates and each sector’s importance nationally. The working paper estimates that Ireland would be one of
50 See McQuinn, K., and Whelan, K., Europe's Long-Term Growth Prospects: With and Without Structural Reforms, 2015; and IMF, The New Normal: A Sector-Level Perspective on Productivity Trends in Advanced Economies, 2015 51 European Commission, Raising Productivity Growth: Key Messages from the European Competitiveness Report, 2007 52 IMF, Reassessing the Productivity Gains from Trade Liberalization, IMF Working Paper, 2016
71 January 2017
the biggest beneficiaries of reduced tariffs estimated potential productivity gain for Ireland from eliminating
remaining tariff barriers is estimated at 7.7 per cent. Historically, the removal of barriers to trade and
enhanced access to new and existing markets has been an important driver of Irish economic development. As
well as substantial intra-EU trade, Ireland has significant trading links outside of the EU. Ireland’s export
destinations, however, are very concentrated and over a third of our goods exports go to two countries: the US
and the UK. Multilateral trade agreements improve access to imports with benefits for both enterprise and
consumers in Ireland. The EU now has the competence to negotiate agreements and in this context, Ireland
needs to continue to ensure its interests are progressed in such negotiations. As set out in the Programme for
Government, safeguarding Ireland’s defensive and offensive interests in the context of any future
international trade negotiations is a key priority. A number of challenges and uncertainties lie ahead given the
outcome of the UK Referendum on EU Membership, not least insofar as our trading relationships are
concerned. Opportunities arising from negotiated trade agreements need to be utilised, recognising that
Ireland’s approach to the negotiation of free trade agreements must be informed by the need to acknowledge
and address the concerns of stakeholders.
An open trade policy allows firms to fully benefit from international production networks. The ability to learn
from the firms with high levels of productivity is stronger in economies that are more connected with the
global frontier via trade; are more integrated in GVCs. A key issue for future productivity is how to best
capitalise on the benefits of GVC participation. Over 70 per cent of global trade is now in intermediate goods
and services and in capital goods. The growth of GVCs has increased the interconnectedness of economies
and led to a growing specialisation in specific activities and stages in value chains, rather than in entire
industries. Participation in GVCs is, therefore, a critical component of a country’s ability to increase
productivity and compete internationally. Inward investment brings many benefits such as job creation,
increasing tax revenue, competition and boosting trade. OECD data suggests that FDI in Ireland is largely
responsible for Ireland’s high participation rates in GVCs. GVC participation may boost productivity via a
number of channels, including stronger competitive pressures that reduce the cost of intermediate inputs and
access to a wider variety of foreign inputs that embody more productive technology. Enhancing exports from
indigenous firms and increasing linkages and supporting greater linkages across the FDI and indigenous
enterprise sectors offers potential to deepen indigenous firms’ links in GVCs and increase productivity.
The international evidence on productivity spillovers from multinationals is somewhat mixed. Research53
indicates that to benefit from the presence of FDI, firms’ absorptive capacity is particularly important (i.e. they
must possess certain capabilities before they can usefully apply knowledge gained from a multinational). This
suggests that policies which strengthen the absorptive capacity of indigenous firms are central to enhancing
productivity levels through knowledge diffusion. In addition, policies which encourage multinationals to
generate linkages with the domestic economy and providing new and potential investors with information on
the availability sub-suppliers are important. The development of greater linkages between Irish-owned firms
and Foreign-owned firms also offers Ireland a potential competitive advantage in terms of attracting FDI and
developing Ireland’s indigenous enterprise base and should be progressed as a priority. The Council welcomes
the ongoing partnership of IDA Ireland with Enterprise Ireland and its indigenous base of companies in
identifying synergies, enhancing clusters and participation in site visits. The Enterprise Ireland/IDA Ireland
Global Sourcing initiative provides procurement teams of multinational companies, not only in Ireland but also
internationally, with access to innovative Irish companies in all sectors. Under the Global Sourcing Initiative,
both IDA Ireland and Enterprise Ireland are working together to maximise the opportunity for greater sourcing
of materials and services by multinationals from indigenous. The Council considers that the enterprise
53 See OECD, Interconnected Economies - Benefiting from Global Value Chains, 2013; and Forfás, Perspectives on Irish Productivity, 2007
72 January 2017
agencies should continue to work towards deepening the partnership of Irish-owned firms with the
multinational sector in Ireland to facilitate productivity growth through technology partnerships, investment
or other collaborative engagements.
9.2 Facilitating Start-ups and Scaling of Firms
As noted by the OECD, in most countries there is a divergent productivity performance at sectoral and
national level between the most productive enterprises and the long tail of relatively poorly performing firms
with low or no productivity growth. Developing a cadre of firms of sufficient scale and capability to make the
leap and succeed in international markets is integral to competitiveness. In Ireland and across the OECD, firm
size appears to matter in terms of productivity performance. In Ireland as set out in chapter 8, larger firms tend
to be on average more productive than smaller ones, particularly in the Services Sector. In the Manufacturing
sector, the gap is also pronounced reflecting the presence of high value added multinationals and reflecting
gains from returns to scale, for instance through capital-intensive production and intellectual property
ownership. In Ireland, small and medium sized enterprises account for 99.8 per cent of the total enterprise
population and for 69 per cent of total persons engaged. At the same time, there is evidence that suggests a
firm’s rate of growth, job creation, and export activity is related more directly to the age of the business than
to its size. New firms are however especially relevant for expanding productivity and innovation performance.
New start-ups, particularly in ICT, are more inclined to engage in more radical innovations which enhance
productivity than incumbents who tend to adopt a more incremental approach. A continuous flow of new
business start-ups that can survive and thrive in international markets strengthens the productivity base not
only through the creation of new businesses, products and services but also by stimulating improved
performance in existing businesses. More than half of productivity growth at the industry level has been
attributed to new entrants. From a policy perspective therefore, facilitating entrepreneurship, start-ups and
firms of scale must be seen as the dynamo of productivity growth in the long run.
In Ireland, the number of active enterprises and business births remains below pre-crisis levels. CSO data
shows there were approximately 238,000 active enterprises in the private business economy in Ireland in 2014,
compared to over 244,000 in 2008. The Services sector accounted for 51 per cent of all enterprises in 2014
which is higher than the EU average (46.5%) but lower than the UK (57%) and six other EU member states. The
data shows there were 16,257 new enterprise births in 2014, an increase of nearly 18 per cent on 2013. 85 per
cent of enterprises created in 2013 were still active in 2014. Of the 17,843 enterprises birthed in 2009, 61 per
cent survived to 2014. However, simply measuring the number of individual entrepreneurs or company
incorporations is insufficient. Policies that fail to consider the quality of entrepreneurial activity are not likely
to succeed. The 5 year survival rate also underlines the importance of policies which support start up activity
being accompanied by complementary approaches which facilitate new firms surviving and scaling. To be
effective, investment by the State in entrepreneurs must continue to be well targeted, avoid deadweight loss
and evaluate the potential quality of entrepreneurial activity, particularly potential to scale. State support to
start-ups through Enterprise Ireland in the form of feasibility funding, Competitive Start Funds, HPSU54
supports and the LEO network is critical.
There are particular and significant challenges in relation to building scale, in areas such as leadership
capabilities, strategic focus, and acquisitions strategy and company structure. Scaling interventions may
require a variety of different supports at appropriate stages of development. Policy must continue to assist
Irish-owned firms to grow to scale and capture new market opportunities, which will increase their
54 High Potential Start Ups (HPSUs) are start-up businesses with the potential to develop an innovative product or service for sale on international markets and the potential to create 10 jobs and €1m in sales within 3 to 4 years of starting up.
73 January 2017
contribution to growth and exports. While no single policy intervention can be expected to generate critical
impact on increasing start up levels, various coordinated interventions taken together can combine to create
an environment that facilitates the creation of start-ups of scale. This requires institutional arrangements that
facilitate efficient firm entry, growth, and exit. While demands on Government finances are intense;
investment to stimulate enterprise development must continue be prioritised. In addition, improving the
administrative and regulatory environment, increasing the efficiency of the public administration are cost-
effective means to stimulate enterprise productivity. Easing the administrative burden that regulations create
can improve firm level productivity by reducing costs and minimising the time businesses spend fulfilling
regulatory requirements. Well-developed capital markets and markets for seed and early stage finance
bankruptcy laws that do not excessively penalise failure, low entry barriers to entrepreneurship are
instrumental to increasing productivity through the development of innovative start-ups. The World Bank’s
annual Doing Business report sheds light on how easy or difficult it is for a local entrepreneur to open and run a
small to medium-size business when complying with relevant regulations. In 2016, Ireland achieved an ease of
doing business ranking for 2017 of 18th out of 190 economies – a fall of 3 places from the previous year. While
Ireland’s performance and overall score has improved, other countries have also improved their performance
and improved at a faster rate. Ireland is 5th in the Euro Area and performs very strongly in the EU overall,
behind Denmark, UK, Finland and Sweden. The UK is ranked 7th, a fall of 1 place from last year. This result for
Ireland shows we cannot take business competitiveness for granted. While we are improving our performance
other countries continue to reform and we must continue the implementation of high-level reforms to
improve business competitiveness environment. It is acknowledged that Ireland’s ranking is not just a question
of Ireland's absolute deterioration in these categories but rather a matter of other countries improving their
position relative to Ireland's. Economies at the upper end of the rankings’ scale find it harder to get high
impact from their reforms due to their already strong performance (i.e. as a country nears the frontier or limit
of best practice, the harder marginal improvements are to achieve).
9.3 Deepening Innovation Capacity, Capability and Activity at Firm Level
While aggregate productivity levels remain subdued the OECD finds that those firms that can combine
technological change, organisational and process innovation continue to experience growth. There are many
benefits for firms undertaking innovation and these have impacts on productivity including greater
responsiveness and understanding of customer demands, faster turnaround times, reduced waste and cost
levels, efficiencies from organisational improvements in product design and quality.
Economy-wide productivity and employment gains are generated when innovations are diffused and widely
adopted, making strengthening technology diffusion mechanisms a key policy priority. Effective innovation
activity facilitates an increase in the productivity and turnover. The extent of innovation activity undertaken
and the speed and pervasiveness of innovation diffusion, absorption and use throughout the economy are
critically important for productivity growth. From a policy making perspective the key issue is in fostering a
supportive environment for investment in innovation and technology adoption. As noted by the OECD in the
Future of Productivity, synergic investments in R&D, skills, organisational know-how (i.e. managerial quality)
and other forms of knowledge-based capital enable economies to absorb adapt and reap the full benefits of
new technologies .
More intensive innovative activity is associated with higher productivity growth. Innovation active enterprises
are defined as those which have carried out a product, process, organisational or marketing innovation or
exercise an intellectual property right. Recently published results from the Community Innovation Survey
74 January 2017
(CIS)55 show that innovation activity rate for enterprises based in Ireland increased from 59 per cent to 61 per
cent in the period 2012-2014. While the increase is relatively small, in a European context Ireland continues to
perform strongly and has the 3rd highest innovation rate of all countries for whom data has been published.
While the overall results are positive, the detailed findings suggest significant variation in the level of
innovative activity carried out by indigenous and Foreign-owned enterprises and between and within sectors.
The Council considers that there is therefore further scope to increase innovation activities in Irish enterprise,
particularly in Irish-owned SMEs, particularly in the services sector.
Total expenditure on innovation activities in Irish Industry and Selected Services sectors was almost €3.8bn in
2014, a 4 per cent increase in two years. The main driver for this increase was a 34 per cent increase in the
acquisition of machinery, equipment and software which accounted for 31 per cent of total expenditure in
2014. In-house R&D accounted for 50 per cent of all expenditure. External R&D and acquisition of external
knowledge represented 10 per cent and 6 percent of expenditure respectively. Innovation active enterprises
generated 85 per cent of total turnover in these two sectors. While Foreign-owned enterprises account for
only 18 per cent of all relevant enterprises, they account for 61 per cent of all innovation-related expenditure,
including €1.3bn on in-house R&D. Innovation spend is dependent on an extremely narrow base of
enterprises. Overall, the largest 50 enterprises (1%) of all relevant enterprises accounted for two thirds of
innovation expenditure. The most frequent of innovation activity undertaken was product or process (49%)
followed by organisational (44%) and marketing innovation (40%).
38 per cent of enterprises had process innovations in the period 2012-2014, while 36 per cent were engaged in
product innovations. 27 per cent of enterprises engaged in both. 45 per cent of Industry enterprises were
engaged in process innovation compared to 34 per cent of enterprises in Selected Services. Foreign-owned
enterprises were more likely to engage in product innovations, process innovations or both compared to Irish-
owned enterprises. Almost 23 per cent of the turnover of Foreign-owned enterprises was generated as a result
of new to the market and new to firm product innovations which is double the turnover generated by Irish-
owned enterprises. The gains associated with new technologies are best realised when firms make
complementary investments in organisational change and upskilling. New methods of organising work
responsibilities and decision-making (39%) and the introduction of new business practices (38%) were the
most cited innovations. An organisational innovation was introduced by 68 per cent of large enterprises, 54
per cent of medium sized enterprises and 41 per cent of small enterprises.
From a productivity perspective, increasing participation on programmes based on productivity programmes
such as Lean56 appears to be an important means of increasing both innovative activity and productivity. The
application of Lean principles is designed to build enterprise capability and capacity in people and processes.
Enterprise Ireland provides supports for companies to enhance productivity, improve competitiveness and
realise transformational change based primarily on Lean principles. Evaluation analysis57 of the Lean
programme has found significant participating firms exhibit considerable productivity gains. The econometric
analysis shows Lean delivered positive benefits to participating companies in terms of sales, employment and
value added per employee. 77 per cent of participating reported improvements in productivity and/or capacity
increases in their final project reports. Lean client companies had an annual productivity value that was of the
order of €37,000 per employee higher than companies in the control group uplift of 20 percent. This analysis
excludes capacity increases that have yet to impact on sales and future assessments of Lean may show a more
pronounced effect on productivity performance over the long run.
55 CSO, Community Innovation Survey (CIS) 2012-2014, 2016 56 The application of Lean principles is designed to build enterprise capability and capacity in people and processes. The core idea is to maximize customer value while minimizing waste. Simply, lean means creating more value for customers with fewer resources. See http://www.lean.org/WhatsLean/ 57 Forfás, Evaluation of Enterprise Supports for Start Ups and Entrepreneurship, 2014
75 January 2017
In the area of innovation policies, it is important that R&D tax incentives are designed so as to be equally
accessible to incumbent, young and new firms. Improving conditions for the creation and growth of new firms
increases their direct job-creating potential, and for creating higher productivity at sectoral level. Innovation
vouchers are common across the OECD and refer to small lines of credit provided to small and medium-sized
enterprises (SMEs) to purchase services from public knowledge providers with a view to introducing
innovations (new products, processes or services) in their business operations
The speed and pervasiveness of technology diffusion, absorption and use throughout the economy is
particularly important for productivity. OECD research suggests that frontier technologies do not immediately
diffuse to all firms. Instead, they are first adopted by national frontier firms, and only diffuse to laggards once
they are tested by the leaders and adapted to country specific circumstances. As a technologically advanced
economy, domestic innovation as opposed to imitation increases in importance. In Ireland the CIS shows that
of those firms undertaking innovative activity, 31 per cent engaged in some co-operative activity when
developing their innovations with 23 per cent of cases who engaged in technological innovation working with
partners located in Ireland. The CIS results indicate there is potential to further increase levels of collaboration
and co-operative activity between firms based in Ireland and also with the public research system.
The Council supports the policy emphasis in recent years which has sought to stimulate collaboration between
research institutes and both Foreign-owned and Irish-owned enterprises. Initiatives to increase knowledge
transfer, particularly the mobility of personnel between research and enterprise are also welcome. As set out
in Innovation 202058 a correlation exists between collaboration activities (ranging from Innovation Vouchers
and Innovation Partnerships to Technology Centres) and quantifiable increases in company turnover – these
can be as much as seven times the investment in these instruments0. For example, as set out in Innovation
2020, for every €1 invested in Innovation Vouchers and Innovation Partnerships respectively, company
turnover increased by €7. In addition, novel initiatives such as the Technology Showcase and Health
Innovation Hub Ireland which is designed to drive collaboration between the health system and enterprise
leading to the development and commercialisation of new healthcare technologies, products and services,
emerging from within the health system and/or enterprise are welcome. Highly proficient leadership, with
ambition, vision and strong management teams is critical for establishing the environment that facilitates an
innovative culture. Research into management practices across firms and countries suggests that an
important factor accounting for differences in productivity is variations in management practices. From a
policy perspective, a number of areas are considered relevant to enhancing management quality. Firstly,
competitive markets are important in that well managed firms gain greater market share and allocative
resources as badly managed less productive firms wither and exit the market. The quality of management
education and multinational presence are valuable in improving management practices across the economy.
Management skill levels at all levels are an essential element in driving improved productivity performance. At
a global level, the available research shows that there is a strong relationship between management practice
and business performance. The OECD has found a positive relationship between management development,
management practice and the bottom line performance of a firm. Management capability has a direct impact
on the innovation performance of firms also. For example, in the Manufacturing sector, managerial quality
differs significantly between countries and Ireland scores relatively poorly, particularly when compared to the
US, Japan and Germany. Increasing managerial quality in manufacturing in Ireland to the best practice levels
observed in the US could boost potentially boost manufacturing productivity by over ten per cent59.
Private companies already provide most of the funding for management development without recourse to the
State and the Council believes this pattern should continue. However, it considers policy needs to focus in the 58 Innovation 2020 is Ireland’s five year strategy on research and development, science and technology. 59 Bloom, N. et al, Management Practices Across Firms and Countries, National Bureau of Economic Research, 2012

76 January 2017
first instance on working with enterprise and maximising existing supports to enhance management capability
across the entire enterprise base, so that all firms have the potential to achieve a -step-up to higher
performance. Enterprises that have engaged in management development and/or mentoring programmes
tend to outperform those that have not. There is now a broad range of options available for enterprises, from
leadership programmes to mentor services and/or peer-to peer networks that can assist the CEO and
owner/manager at every stage of the company lifecycle. There needs to be a stronger policy emphasis on
management development across the enterprise base, and tailored to the scale and stage of the development
of the enterprise. Increasing productivity performance requires an increase in the take up of management
development amongst firms, and to identify whether elements of existing management development
programmes could be tailored to meet the needs of different cohorts of firms. Thereafter, mechanisms to
engage with firms (particularly locally trading SMEs) that do not currently participate in management
development are required to disseminate relevant modules.