Benchmarking and Performance Measures - Bill Steele … · Presentation Outline ! What is...
159
Benchmarking and Performance Measures NARUC Staff Subcommittee on Accounting and Finance Oklahoma City, Oklahoma April 21 -23, 2013 Presented By Bill Steele Steele & Associates
Transcript of Benchmarking and Performance Measures - Bill Steele … · Presentation Outline ! What is...

Benchmarking and Performance Measures
NARUC Staff Subcommittee on Accounting and Finance Oklahoma City, Oklahoma
April 21 -23, 2013 Presented By
Bill Steele Steele & Associates
Presentation Outline Ø What is benchmarking and performance
measures Ø Why Regulators should/should not have an
interest in Benchmarking and measuring a utility’s performance
Ø Steps in designing & developing a benchmarking program
Ø Present a Benchmarking scenario
2

What is Benchmarking Ø It is one of the family of analytical and regulatory tools
that helps regulators to evaluate the performance of utilities in their states
Ø It relies on measuring the efficiency of the service of a population of utility firms and comparing these efficiencies to similar firms
Ø In order to have effective Benchmarking one needs to establish “Performance Measurements” also called “Performance Standards”
3

What Are Performance Measures Ø Performance” refers to the outcomes of one
or more utility actions resulting from management decisions.
Ø These actions affect the various dimensions of a utility’s operations and services, including cost performance, reliability, and service quality, all of which affect consumer welfare.
Ø Performance measures traditional rely on historical data or on estimates derived from economic models and statistical techniques.
4

What Do We Mean by Performance Performance depends on two broad factors: Ø Management behavior, and Ø Market and business conditions, and other
factors beyond the control of a utility.
5

What Do We Mean by Performance Management behavior and other factors beyond the control of a utility affect the various dimensions of a utility’s operations: Ø Financial health Ø Costs Ø Asset management Ø Plant performance Ø Customer satisfaction Ø Quality of Service
6

What Are Performance Measures Different perspectives of Performance Standards n From an engineering perspective, efficiency may take on a strictly
physical form such as the ratio of person-hours of labor to kilowatt-hours of output.
n From an economic standpoint, efficiency reflects management behavior in minimizing costs over the long term.
n From an accounting standpoint it maybe the comparison of a utility’s performance over time or with other utilities.
n While performance evaluations often focus on cost, management also affects the non-cost aspect of utility performance
n the effects of outages and service interruptions to customers n the responsiveness of utility personnel to customer complaints and overall service
quality
7

Why Regulators Should Engage in Benchmarking
An important function of regulation is to measure and evaluate the performance of public utilities
Ø Effective regulation should require utilities to be held accountable for their performance
Ø The need to measure utility performance is a key component in determining “just and reasonable” rates or take other regulatory actions related to quality of service issues
8

Why Regulators Should Engage in Benchmarking Performance problems under regulation Ø Some will argue that traditional regulation tends to
give utilities weak incentives to minimize their costs and as a result some form of benchmarking and performance standards, becomes essential
Ø Measurement can lead to better regulatory incentives and improved utility performance.
Ø Performance measures may help lessen the information asymmetry which regulators inherently face in their oversight of utilities
9

Why Regulators Should Not Engage in Benchmarking
Ø Independent benchmarks, in and of themselves, do not create stronger performance incentives for utilities
Ø Benchmarked costs are not easily implemented or more reliable than actual company costs
Ø Benchmarking is an effort by regulators to micro manage a utility
10

Challenges In Benchmarking and Performance Measurements
Three general factors that affect utility performance: Ø The resources used by the utility such as labor,
materials and capital Ø Management skills, which determine what resources
a utility should use and how it should combine them to produce some “output,” and
Ø Market and business conditions over which the utility has little control (e.g., consumer size and behavior, geography, demographics, input prices)
11

Challenges In Benchmarking and Performance Measurements
Regulatory considerations for applying performance measures: Ø The first decision is to selected the functional areas to be Benchmarked as well
as the performance measures. Ø The impact of a functional area on a utility’s total cost or on quality of
service Ø The ease of measurement and reporting, Ø The influence of utility management in affecting performance Ø Examples of these performance measures would be are power plant
equivalent availability, operation and maintenance (O&M) expenditures, and service reliability levels.
Ø Improved performance in one area can reduce performance in another (e.g., cost and service quality).
Ø Capital versus expense Ø Traditional generation versus renewables and energy conservation
12

Challenges In Benchmarking and Performance Measurements
Regulatory considerations for applying performance measures:
Ø Varying degrees of difficulties exist in measuring performance (e.g., accounting ratios and econometric methods).
Ø Tradeoffs can exist between short-term and long-term performance (e.g., tree trimming, capital expenditures in general).
Ø Benchmarking can use as a reference, “average,” “exceptional,” or “standard” performance. In evaluating or measuring a utility’s performance, the analyst often needs to specify a “reference” or “baseline” performance.
13
Challenges In Benchmarking and Performance Measurements
Ø The use of performance measures requires careful interpretation of what they represent
Ø There is no single analytical tool likely to produce satisfactory results with benchmarking therefore using multiple methodologies is required
Ø Good regulatory decisions require a combination of quantifiable information and judgment
14

Designing & Developing Benchmarking Program
Ø Identify uses of benchmarking and performances measures
Ø Select utility functional areas for regulatory review Ø Calculate the performance measures Ø Compare a utility’s performance with a
predetermined benchmark Ø Assess a utility’s performance Ø Take action as required
15

Designing & Developing Benchmarking Program Attributes of good performance measures Ø Performance measures should be objective, quantifiable, and verifiable. Ø Good measures represent metrics with numerical values based on
public data and sound analytical techniques that anyone can replicate. Ø Benchmarking requires quantitative performance measures; otherwise,
regulators would find it difficult to determine whether a utility has performed satisfactorily.
Ø Some measures are estimates derived from advanced mathematical and statistical techniques. Other measures derived from actual accounting numbers are easier to calculate and replicate.
16

Designing & Developing a Benchmarking Program Select utility functional areas for regulatory review n It makes sense to select a functional area that has a substantial effect
on a utility’s costs or other dimensions of performance over which the utility has discretion. n the effect of a functional area on a utility’s total cost or consumer
value from reliable and high-quality utility service, n the ease of measurement and reporting n the effort needed to correlate performance measures with
management behavior, and n the influence of utility management in affecting performance.
17

Designing & Developing a Benchmarking Program Ø Calculate the performance measures
Ø Performance measures can derive directly from accounting or other statistics periodically compiled and reported by utilities; or utilities or regulatory staff can estimate performance measures using sophisticated analytical techniques.
Ø These techniques have the ability to separate the effects of management behavior from other factors in determining overall utility performance.
Ø Their applications require proficiency in statistics and other numerical methods.
Ø Compare a utility’s performance with a predetermined benchmark
Ø Take action as required
18

Designing & Developing a Benchmarking Program
Benchmarking Program Performance Measurement
System Reliability • Outage indices • Power quality indices
System Safety • Public safety measures • Employee safety measures
Customer Satisfaction • Customer complaints • Call center performance • Appointments • Metering and billing accuracy • Emergency response • Results of customer surveys
Financial Health • Liquidity • Equity • Leverage • Variable-rate debt • Return and valuation • Credit ratings
Production Costs • Utility total costs • Different categories of costs
Plant Performance • Equivalent forced outage rate on demand • Equivalent forced outage rate on peak • Heat rate • Outage rates • Availability factor • Capacity factor • Economic efficiency
19 * Table is from Ken Costello, NRRI paper “ Where does your Utility Stand?”, November 15, 2010

Designing & Developing a Benchmarking Program
Performance Measurement
Use Limitation
Statistical Method • Estimation of average performance as the predicted cost controlling for a utility’s exogenous conditions
• Ranking of the performances of different utilities based on the deviation between a utility’s actual performance and average performance
• Estimation of the effect of individual factors on cost • Application of statistical tests for performance evaluation
• Predictions of average performance sensitive to different assumptions, model design, the data, and econometric errors
• Requirement of substantial data
• Demand for skills in sophisticated econometric and statistical techniques
• Inclusion of only quantifiable factors
Accounting Cost and Non-Cost Ratios
• Provision of information that “red flags” or identifies potential problem areas at low cost
• Provision of preliminary information for in-depth inquiry • Comparison of a utility’s performance over time or with
other utilities
• No separation of management effects and other factors on performance
• Narrow-based measures that don’t account for interdependencies between utility functions
• No definite benchmark
Management Audits • Evaluation of current processes, policies and management practices for specific functional areas
• Recommendation on improvements or prudence of past actions
• Establishment of “process” standards for future performance
• Expensive to conduct • No “outcome” metric or benchmark
Total Factor Productivity • Quantification of the overall cost performance of a utility • Quantification of the effects of individual factors on
performance • Comparison of a utility’s performance over time or with
other utilities
• Estimation of some required data • No separation of management effects and
other factors on performance • No definite benchmark
Price • Comparison of a utility’s average cost with other utilities • No separation of management effects and other factors on performance
• No explicit benchmark
20 * Table is from Ken Costello, NRRI paper “ Where does your Utility Stand?”, November 15, 2010

Applications of Benchmarks Ø Regulatory incentive mechanisms
Ø Performance benchmark Ø Actual performance
Ø Periodic monitoring of utility performance outside a rate case Ø Performance for individual functional areas Ø Utility-wide performance
Ø Comparison of a utility’s actual performance with a benchmark, both in rate cases and other regulatory forums Ø Need to establish a benchmark Ø Different functions for benchmarking (e.g., monitor a utility’s
performance relative to other utilities’, establish targets or standards for utility performance, mitigate the cost-plus nature of regulation)
21

Applications of Benchmarks Ø Evaluation of the reasonableness of “cost-of-service” components,
adjustment of the rate of return on equity (ROE) Ø Rate-of-return regulation Ø Price-and-revenue cap regulation Ø Riders and trackers
Ø Preliminary review of a utility’s performance to determine further action Ø Examination of the reasons for performance differences across utilities Ø Publicity of a utility’s performance on a periodic basis
22

Examples of Benchmarking Studies
Ø “How Performance Measures Can Improve Regulation”, by Ken Costello, NRRI Report 10-09, June 2010
Ø “Benchmarking Electric Utilities: Combining Energy Conservation, Renewable Energy, and Financial Strength”, Final Report, Gainesville Regional Utilities, October 2004
Ø “Approaches to Setting Electric Distribution Reliability Standards and Outcomes”, by Serena Hesmondhalgh, William Zarakas and Toby Brown of The Brattle Group, January 2012.
Ø Ontario Energy Board “Benchmarking Consideration to Guide Ratemaking for the 2006 EDR”, by Thomas Adams and Alfredo Bertolotti, January 12, 2005
Ø “Where Does Your Utility Stand? A Regulator’s Guide to Defining, Measuring and Assessing Performance”, by Ken Costello, NRRI for the NARUC Committee on Ware, November 15, 2010.
Ø “Customer Service Quality Incentive Programs New York Energy Utilities”, by Sandra S. Sloane, Office of Consumer Services, June 2-5, 2008, Zagreb, Croatia
Ø “Service Quality Regulation for Detroit Edison: A Critical Assessment” by Larry Kaufmann, Pacific Economics Group, March 2007.
Ø CAMPUT “Benchmarking For Regulatory Purposes” prepared by: First Quartile Consulting, LLC and Elenchus Research Associates, Inc., April 2010
Ø “Benchmarking, Rate Case and Regulatory Commitment”, by Jeff D. Makholm, Ph.D., Senior Vice President, NERA for Australian Competition & Consumer Commission, Incentive Regulation and Overseas Development Conference, Sydney, Australia, November 15, 1999,
Benchmarking Scenario Background: Ø You have been asked by the newly appointment Chairman of
your Commission to prepare a simple benchmarking study for their review.
Ø The Chairman is skeptic of the whole idea of benchmarking but the other Commissioners do have some interest in the concept.
Ø The Chairman wants you to use public available accounting information and only wants a few straight forward examples that even the public would understand.
Ø The Chairman wants you to also give them a list of potential pitfalls of using the information contained in the simple benchmarking study.
24

Benchmarking Scenario n Sources of publicly available accounting information:
Ø FERC Form 1 Ø Utility Shareholders Annual Reports Ø Annual reports filed by the electric utilities with the
Commission Ø Surveillance reports filed by the electric utilities with the
Commission n Company A will be Benchmarked against other companies n Key observations will be discussed after Benchmarking
Scenarios
25

Benchmarking Scenario Benchmarking Targets: n Revenues n Expenses
n O&M n Transmission n A&G
n Capital: n Net Plant Investment
n Financial n Debt to equity ratios n Return on rate base
26
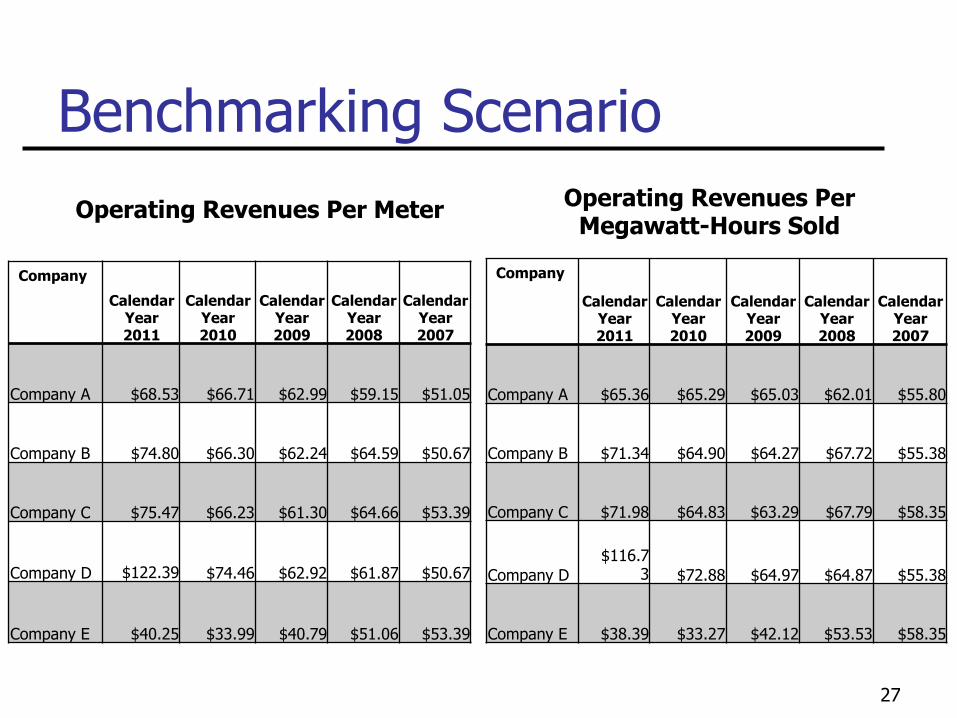
Benchmarking Scenario Operating Revenues Per Meter
Company
Calendar Year 2011
Calendar Year 2010
Calendar Year 2009
Calendar Year 2008
Calendar Year 2007
Company A $68.53 $66.71 $62.99 $59.15 $51.05
Company B $74.80 $66.30 $62.24 $64.59 $50.67
Company C $75.47 $66.23 $61.30 $64.66 $53.39
Company D
$122.39 $74.46 $62.92 $61.87 $50.67
Company E $40.25 $33.99 $40.79 $51.06 $53.39
Operating Revenues Per Megawatt-Hours Sold
Company
Calendar Year 2011
Calendar Year 2010
Calendar Year 2009
Calendar Year 2008
Calendar Year 2007
Company A $65.36 $65.29 $65.03 $62.01 $55.80
Company B $71.34 $64.90 $64.27 $67.72 $55.38
Company C $71.98 $64.83 $63.29 $67.79 $58.35
Company D
$116.7
3 $72.88 $64.97 $64.87 $55.38
Company E $38.39 $33.27 $42.12 $53.53 $58.35
27

Benchmarking Scenario Operation & Maintenance
Expense Per Meter
Company Calendar
Year 2011
Calendar Year 2010
Calendar Year 2009
Calendar Year 2008
Calendar Year 2007
Company A $47.32 $47.26 $43.42 $45.59 $37.23
Company B $47.65 $47.06 $42.80 $46.04 $34.69
Company C $47.90 $46.60 $40.66 $46.69 $34.37
Company D $48.03 $46.82 $41.96 $45.39 $33.07
Company E $38.91 $32.03 $31.77 $46.69 $47.34
Operation & Maintenance Expense Per Megawatt-Hours Sold
Company
Calendar Year 2011
Calendar Year 2010
Calendar Year 2009
Calendar Year 2008
Calendar Year 2007
Company A $47.32 $48.50 $47.00 $50.12 $42.66
Company B $47.65 $47.06 $42.80 $46.04 $34.69
Company C $47.90 $46.60 $40.66 $46.69 $34.37
Company D $48.03 $46.82 $41.96 $45.39 $33.07
Company E $38.91 $32.03 $31.77 $46.69 $47.34
28

Benchmarking Scenario
Transmission Expense Per Meter
Company Calendar
Year 2011
Calendar Year 2010
Calendar Year 2009
Calendar Year 2008
Calendar Year 2007
Company A $9.30 $8.28 $7.83 $7.25 $6.53
Company B $9.38 $8.16 $7.82 $7.34 $6.46
Company C $9.45 $8.23 $8.02 $7.07 $6.46
Company D $9.31 $8.29 $7.95 $7.14 $6.43
Company E $8.16 $8.09 $7.83 $7.21 $6.59
Transmission Expense Per Megawatt-Hours Sold
Company
Calendar Year 2011
Calendar Year 2010
Calendar Year 2009
Calendar Year 2008
Calendar Year 2007
Company A $8.87 $8.10 $8.08 $7.60 $7.14
Company B $8.95 $7.99 $8.07 $7.70 $7.06
Company C $9.01 $8.05 $8.28 $7.41 $7.06
Company D $8.88 $8.12 $8.21 $7.48 $7.02
Company E $7.78 $7.92 $8.08 $7.56 $7.21
29

Benchmarking Scenario
A & G Expense per meter:
Company Calendar
Year 2011
Calendar Year 2010
Calendar Year 2009
Calendar Year 2008
Calendar Year 2007
Company A $1.29 $1.29 $1.12 $0.79 $0.63
Company B $1.29 $1.26 $1.12 $0.79 $0.62
Company C $1.36 $1.43 $1.16 $0.82 $0.68
Company D $1.50 $1.77 $1.43 $1.43 $1.36
Company E $1.22 $1.23 $0.78 $1.02 $1.09
A & G Expense per Megawatt-hours sold:
Company
Calendar Year 2011
Calendar Year 2010
Calendar Year 2009
Calendar Year 2008
Calendar Year 2007
Company A $1.23 $1.23 $1.07 $0.75 $0.60
Company B $1.23 $1.20 $1.07 $0.75 $0.59
Company C $1.30 $1.36 $1.10 $0.78 $0.65
Company D $1.43 $1.69 $1.36 $1.36 $1.30
Company E $1.17 $1.17 $0.75 $0.97 $1.04
30
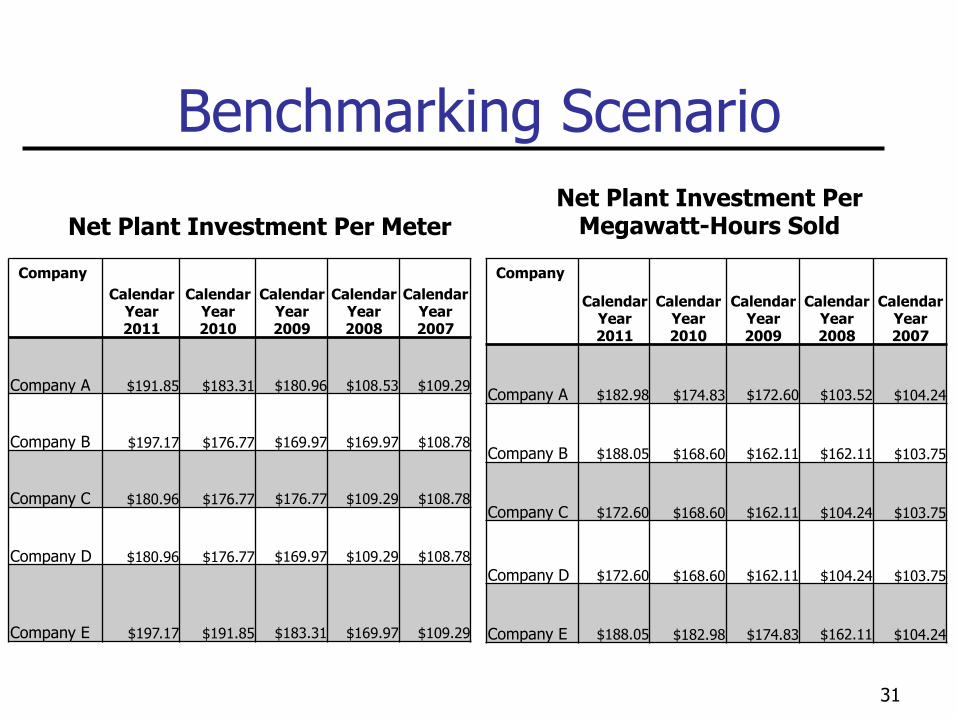
Benchmarking Scenario
Net Plant Investment Per Meter
Company Calendar
Year 2011
Calendar Year 2010
Calendar Year 2009
Calendar Year 2008
Calendar Year 2007
Company A $191.85 $183.31
$180.96
$108.53
$109.29
Company B $197.17 $176.77
$169.97
$169.97
$108.78
Company C $180.96 $176.77
$176.77
$109.29
$108.78
Company D $180.96 $176.77
$169.97
$109.29
$108.78
Company E $197.17 $191.85
$183.31
$169.97
$109.29
Net Plant Investment Per Megawatt-Hours Sold
Company
Calendar Year 2011
Calendar Year 2010
Calendar Year 2009
Calendar Year 2008
Calendar Year 2007
Company A
$182.98 $174.83
$172.60
$103.52 $104.24
Company B
$188.05 $168.60
$162.11
$162.11 $103.75
Company C
$172.60 $168.60
$162.11 $104.24 $103.75
Company D
$172.60 $168.60
$162.11 $104.24 $103.75
Company E
$188.05 $182.98 $174.83
$162.11 $104.24
31

Benchmarking Scenario Equity as a % of Total
Capitalization
Company Calendar
Year 2011
Calendar Year 2010
Calendar Year 2009
Calendar Year 2008
Calendar Year 2007
Company A 60% 59% 58% 55% 55%
Company B 55% 55% 58% 58% 60%
Company C 55% 55% 55% 58% 60%
Company D 57% 58% 59% 60% 60%
Company E 60% 59% 58% 58% 57%
Return on Rate Base Company
Calendar Year 2011
Calendar Year 2010
Calendar Year 2009
Calendar Year 2008
Calendar Year 2007
Company A 10.50% 10.50% 10.00% 9.75% 9.65%
Company B 9.75% 9.75% 9.65% 9.60% 9.55%
Company C 9.55% 9.60% 9.75% 9.75% 10.00%
Company D 10.00% 10.50% 10.00% 9.75% 10.00%
Company E 10.50% 10.50% 10.00% 9.75% 9.65%
32

Key Observations Concerning the Benchmarking Scenario n Performance standards have not been established such as what is
outstanding, average and below standard performance. n Input data is missing, verification of input data is critical. This leads to
crucial questions the need to be answered such as: n Are these companies utilities peers/comparable for benchmarking. n Are there differences in these companies that need to be considered such as:
n Differences in demographics n Differences in geographic regions n Differences in generation mix n Differences in load characteristics (winter vs. summer peaking) n Government impacts such as Renewable and Clean Air standards n Mergers and consolidations n Changes in accounting systems n Non-recurring events n Economic events
33

Concluding Remarks n Effective regulation requires regulators to hold utilities accountable for their
performance. n If regulators hope to set regulatory standards, determine “just and reasonable”
rates or take other actions integral to their duties, they need to measure utility performance and acquire other information to evaluate utility performance
n Performance measures offer regulators a tool that is useful for different purposes in different venues
n Regulators first should recognize the shortcomings of the performance measures for benchmarking purposes. They need to exercise caution in interpreting and using the measures
n A good approach is to use different benchmarking methods to compare and evaluate the results, rather than rely on a single method
n In summary, benchmarking and performance measurements are on of the many tools regulators should have in their regulatory tool box
34

Purpose of Presentation Ø To set forth a process of educating a
decision maker, i.e. Commissioner on the nuts and bolts aspects of benchmarking and performance measures.
35
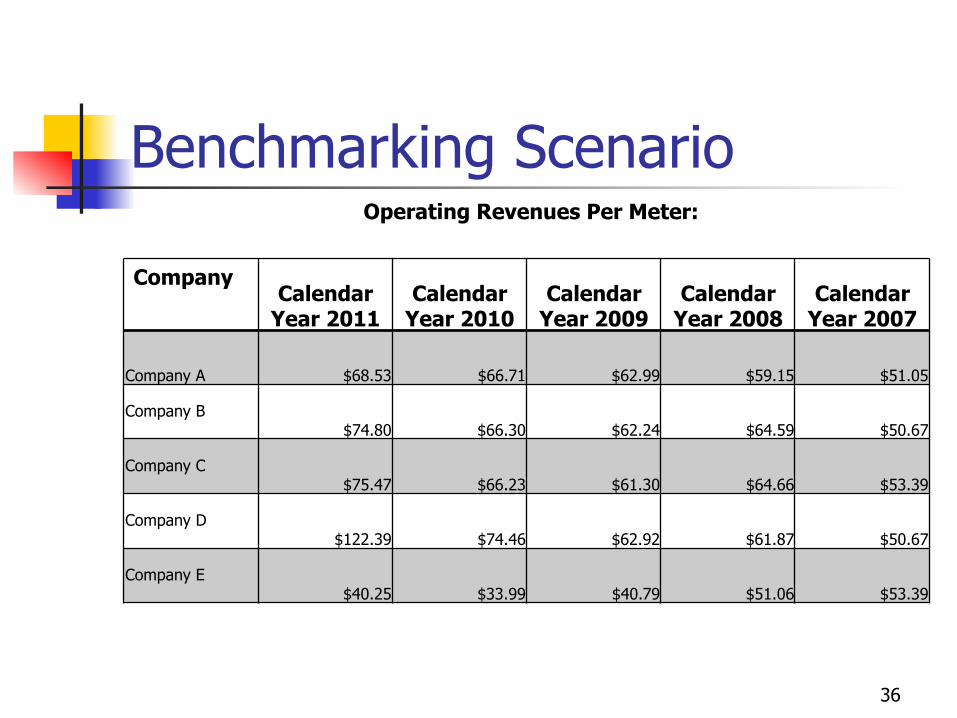
Benchmarking Scenario Operating Revenues Per Meter:
36
Company Calendar
Year 2011 Calendar
Year 2010 Calendar
Year 2009 Calendar
Year 2008 Calendar
Year 2007
Company A $68.53 $66.71 $62.99 $59.15 $51.05
Company B $74.80 $66.30 $62.24 $64.59 $50.67
Company C $75.47 $66.23 $61.30 $64.66 $53.39
Company D $122.39 $74.46 $62.92 $61.87 $50.67
Company E $40.25 $33.99 $40.79 $51.06 $53.39
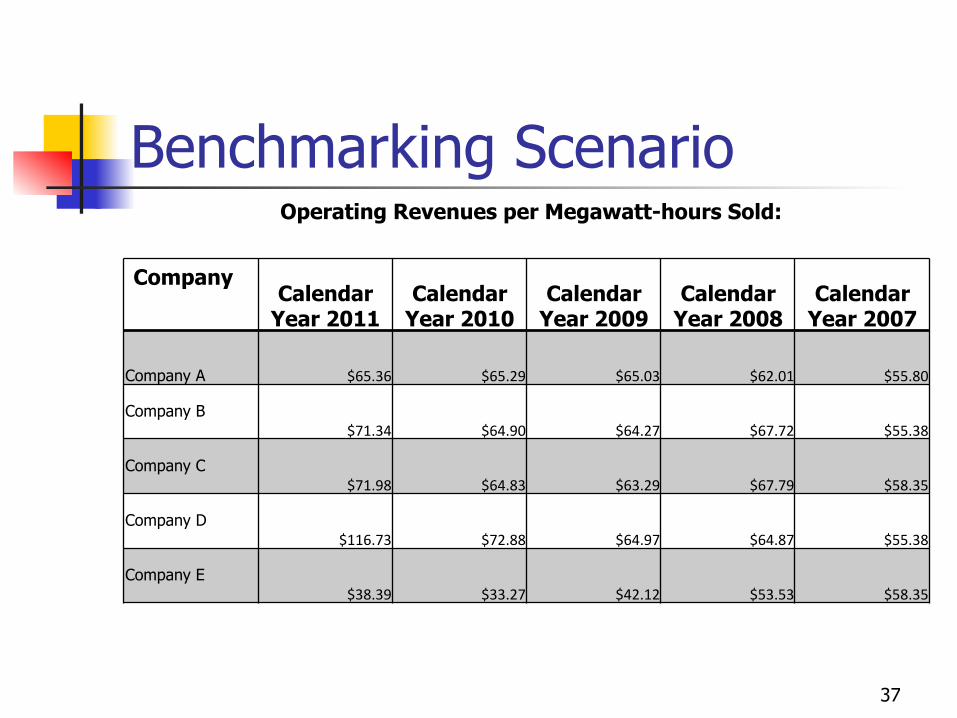
Benchmarking Scenario Operating Revenues per Megawatt-hours Sold:
37
Company Calendar
Year 2011 Calendar
Year 2010 Calendar
Year 2009 Calendar
Year 2008 Calendar
Year 2007
Company A $65.36 $65.29 $65.03 $62.01 $55.80
Company B $71.34 $64.90 $64.27 $67.72 $55.38
Company C $71.98 $64.83 $63.29 $67.79 $58.35
Company D $116.73 $72.88 $64.97 $64.87 $55.38
Company E $38.39 $33.27 $42.12 $53.53 $58.35

Benchmarking Scenario Operation & Maintenance Expense (UOSA) per meter:
38
Company Calendar
Year 2011 Calendar
Year 2010 Calendar
Year 2009 Calendar
Year 2008 Calendar
Year 2007
Company A $47.32 $47.26 $43.42 $45.59 $37.23
Company B $47.65 $47.06 $42.80 $46.04 $34.69
Company C $47.90 $46.60 $40.66 $46.69 $34.37
Company D $48.03 $46.82 $41.96 $45.39 $33.07
Company E $38.91 $32.03 $31.77 $46.69 $47.34

Benchmarking Scenario Operation & Maintenance Expense (UOSA) per meter:
39
Company Calendar
Year 2011 Calendar
Year 2010 Calendar
Year 2009 Calendar
Year 2008 Calendar
Year 2007
Company A $49.62 $49.55 $45.53 $47.80 $39.03
Company B $49.96 $49.34 $44.87 $48.27 $36.37
Company C $50.23 $48.86 $42.63 $48.95 $36.03
Company D $50.36 $49.09 $43.99 $47.59 $34.67
Company E $40.79 $33.59 $33.31 $48.95 $49.63

Benchmarking Scenario Operation & Maintenance Expense (UOSA) per Megawatt-hours sold:
40
Company Calendar
Year 2011 Calendar
Year 2010 Calendar
Year 2009 Calendar
Year 2008 Calendar
Year 2007
Company A $47.32 $48.50 $47.00 $50.12 $42.66
Company B $47.65 $47.06 $42.80 $46.04 $34.69
Company C $47.90 $46.60 $40.66 $46.69 $34.37
Company D $48.03 $46.82 $41.96 $45.39 $33.07
Company E $38.91 $32.03 $31.77 $46.69 $47.34

End of Revisions to Presentation on February 18, 2013.
41

Use of Performance Measures Ø The challenge for regulators is to determine what
constitutes a well-performing utility. Ø What do they consider acceptable performance?
These are questions that regulators need to address if they are to exploit fully the information contained in performance measures for regulatory actions such as prudence determination and rate setting.
Ø The measurement of performance trends in the absence of a standard, for example, might limit regulatory action to further review, not to a determination of cost recovery.
42

Where to start n This particular paper helps regulators to form a context,
rationale, and a general framework for initiating a strategy to measure and evaluate the performance of utilities in their states.
n It begins with a discussion on major questions that regulators should address before applying performance measures.
n The paper also provides guidance to regulators on how to better gauge utility performance in non-cost functional areas such as reliability and other dimensions of service quality. Such evaluation allows regulators to satisfy the objective of consumer protection.
43

This paper provides regulators with the following information:
1. The rationale for why regulators should measure and evaluate utility performance; 2. Guidance on how regulators can best apply performance measures in various areas of utility operations; 3. General interpretations of utility performance and alternative regulatory responses; 4. Different performance measures that regulators can use; 5. The uses and limitations of different performance measures and performance measurement techniques; 6. The different regulatory venues for the application of performance measures, both within and outside a rate case; and 7. A general framework and sequence of steps that regulators can take to initiate performance measurement and evaluation tasks.
44

An Illustration of a Regulatory-Review Process
Regulation itself affects utility management behavior n Together with factors that fall outside the control of a
utility, management behavior determines a utility’s performance. Regulatory rules, policies and practices directly and indirectly affect utility performance. Utility performance, in turn, can influence regulatory actions.
n Poor utility performance, for example, might induce regulators to provide utilities with stronger incentives and disincentives or to establish standards for future performance.
45

An Illustration of a Regulatory-Review Process
Regulators should initially assess the utility’s performance by comparing actual performance with a pre-specified standard. n Any substantial deviation can reflect n exceptionally good or bad performance. The
utility would then have the opportunity to respond to the evidence of bad performance, with subsequent evaluation by the regulator.
46

An Illustration of a Regulatory-Review Process
Based on its review, the regulator can then take a particular action. n The action may affect cost recovery by the utility, lead to a
more detailed investigation such as a retrospective management audit or induce the regulator to institute a mechanism that would reward or penalize the utility for exceptional performance. The regulator can take other actions or no action in response to its assessment.
n One such action might include rewarding the utility for above-average performance that the regulator judged to reflect exceptional management behavior.
47
An Illustration of a Regulatory-Review Process
Performance measures can help regulators determine “just and reasonable rates.” n The objective of the proposed regulatory approach is to enhance the
ability of state commissions to make informed decisions. n Accountability requires regulatory assurance that utility costs
incorporated in rates reflect prudent, efficient, effective and customer-responsive management behavior.
n Accountability also demands that regulators recognize the financial interests of utilities; namely, to permit prudent and efficient utilities a reasonable opportunity to earn a fair rate of return and attract capital to serve the long-term interest of their customers.
n Performance measures can provide regulators with a tool to achieve these outcomes.
48

How Performance Measures Can Improve Regulation n Regulation’s central purpose is to induce high-quality performance from
our utilities. To achieve this objective, regulators must measure and evaluate utility actions, then inject the evaluation’s results into regulatory decisions.
n Measurement can lead to better regulatory incentives and improved utility performance. Improved performance, in turn, can lead to lower rates over time, higher quality of service, fewer rate cases, and avoidance of excessive utility costs.
n Performance measurement can detect subpar utility management that could lead to further investigation, cost disallowances, or a change in regulatory incentives.
n It can also help regulators determine whether utilities are satisfying stated objectives or targets. Performance measurement can also help regulators reward utilities for superior performance that benefits customers through lower rates or higher quality of service.
n Compared to their foreign counterparts (especially European countries),1 U.S. regulators
n have relied less on performance measures as a benchmarking tool to set rates and evaluate utility
n performance. In most U.S. applications, benchmarking has focused on operation and
n maintenance expenses rather than total cost performance. n In the absence of quantifiable performance measures, it becomes
difficult for regulators n to know if utilities are falling short of, meeting, or surpassing
predetermined objectives or targets.
49

How Performance Measures Can Improve Regulation n Performance measures can empower regulators to grade utilities, mindful of the
limitations of the particular measures for appropriate regulatory actions. n Performance measurement can accompany special incentive mechanisms,
management audits and other detailed investigations, and specific actions on cost recovery.
n This paper addresses several questions. First, it provides reasons for why state public utility commissions (or “regulators”) would want to measure utility performance. Next, it identifies the challenge that regulators face in interpreting performance measures for various applications.
n The paper then provides an overview of the different techniques for performance measurement. A previous NRRI paper detailed some of these techniques.
n Finally, it identifies specific applications of performance measurement in different regulatory venues, including rate cases, the development of incentive mechanisms, and periodic oversight.
50

This paper helps regulators by providing them with the following information: n 1. The rationale for why regulator should measure and evaluate utility
performance; n 2. Caveats on how regulators can best apply performance measures in various
areas of utility operations; n 3. General categories of utility performance and alternative regulatory
responses; n 4. Different performance measures that regulators can use; n 5. The uses and limitations of different performance measures and performance
measurement techniques; n 6. The different regulatory venues for the application of performance measures,
both within and outside a rate case; and n 7. A general framework and sequence of steps that regulators can take to
initiate performance measurement and evaluation tasks.
51

I. What Do We Mean by Performance”?
Multi-dimensional nature of performance n “Performance” refers to the outcomes of one or more utility actions resulting
from management decisions. n These actions affect the various dimensions of a utility’s operations and services,
including cost performance, reliability, and service quality, all of which affect consumer welfare.
n Performance is the “proof of the pudding,” determining how a utility’s actions affect its customers and the public.
n This paper focuses on quantifying with objective information (e.g., actual numerical “performance” outcomes based on accounting data) how well a single utility or a group of utilities address these multiple dimensions.
n Performance measures rely on historical data or on estimates derived from economic models and statistical techniques.
n The latter metrics contain an element of error in measuring actual performance that regulators need to interpret carefully.
52

I. What Do We Mean by “Performance”? Performance standards n Regulators can consider performance from different perspectives. One perspective is efficiency. n From an engineering perspective, efficiency takes on a strictly physical form. n The ratio of person-hours of labor to kilowatt-hours of output is an example. This perspective n disregards costs and assumes that a lower input-to-output ratio is desirable. This perspective, by n itself, is limiting: A utility can increase its labor productivity by simply reducing its employees n and substituting inputs such as capital or outsourcing; these alternatives, however, might be n expensive enough to increase the utility’s overall costs. n From an economic standpoint, efficiency reflects management behavior in minimizing n costs over the long term. Management, for example, can affect a utility’s cost performance by: n (1) adjusting inputs to reflect the relative input prices, (2) exerting the optimal amounts of n managerial effort to control costs, (3) constraining costly managerial expenditures (e.g., on n expensive art and furniture) and other sources of waste (i.e., X-inefficiency), and (4) adopting n new innovations and technologies when cost-beneficial. n Another way to consider performance is by means of comparison. If the regulator’s n standard for power plant equivalent availability2 is 80 percent and the utility performs at 70
53

I. What Do We Mean by “Performance”? n percent, the efficiency ratio is 0.875 (70/80). Efficiency is a relative term whose measurement n requires a benchmark or standard of performance. The standard might be the average n performance of other utilities or the maximum efficiency that the regulator feels the utility under n review can achieve. n The evaluation of utility performance often relates to “prudence.” One widely applied n definition of prudence is decisions consistent with what a “reasonable person” would do, basedon information available to the
utility at the time of those decisions. The prudence standard n focuses on actions, not outcomes.3 One criticism of the prudence standard is that a utility can n satisfy it without performing at an above-average level. It establishes a threshold of minimum n acceptable performance; it does not distinguish acceptable performance from exceptional n performance. Grading and evaluation are done dichotomously: the utility’s behavior is either n acceptable or unacceptable; there are no intermediary levels of utility-management behavior.4 n While performance evaluations often focus on cost, management also affects the non-cost n aspect of utility performance. The effects of outages and service interruptions to customers n depend on the response of utilities in restoring service and in isolating these incidents to selected n areas to minimize the overall effect on customers. Utility performance also reflects the n responsiveness of utility personnel to customer complaints and overall service quality.
54

II. Why Should Regulators Measure Utility Performance?
Performance problems under regulation n Regulation has an obligation to induce high-quality utility performance, whether it is n customer service, physical operation of the utility system, service reliability, cost controls, or the n adoption of new technologies. The economics literature shows that public utilities left n unregulated, or regulated ineffectively, would perform suboptimally. They would set prices too n high, price discriminate among customers, provide an inferior quality of service, deploy a n nonoptimal mix of inputs, and expend too little effort to control costs and innovate.5 n Further, economic theory predicts that regulated utilities subject to rate of return n regulation would perform at less than the highest possible allocative or productive efficiency.6 n Traditional regulation tends to give utilities weak incentives to minimize their costs. To the n extent a utility can pass on to customers additional costs and also pass on any cost savings it n achieves, it has diluted any economic incentive to perform efficiently. Since rate-of-return n regulation, by itself, will not produce the desired performance, some form of performance n standards, including measurement, evaluation, and consequences, becomes more essential.
55

II. Why Should Regulators Measure Utility Performance? B. Regulators have an information disadvantage n In traditional regulation, the regulator is at a disadvantage relative to the utility in n interpreting the utility’s performance. Do the actual costs reflect competent utility management, n or do they include wasteful costs that the utility could have avoided? The utility generally would n defend these costs as reflecting their best effort under the circumstances. Some utilities would, n therefore, be inclined to provide misleading information about their managerial efforts and cost n opportunities. They may portray themselves as high-cost providers because of an unfavorable n business environment. Under existing incentives, utilities may act rationally by exerting less- n than-desirable managerial effort to reduce costs. After all, the opportunity cost for managers to n spend more time and effort at their job is lost leisure time and more discomfort. The regulator n might deem extant incentives as inadequate for motivating exceptional utility performance. n Performance measures and their various applications by regulators can help lessen the n information asymmetry they inherently face in their oversight of utilities.
56

II. Why Should Regulators Measure Utility Performance? n If regulators had good information about how utilities should perform, they could readily n set performance standards that the utility would have to meet or suffer the consequences. In the n real world, however, the regulator faces the problem of less-than-perfect information about the n efforts of utility management and the utility’s cost opportunities. Cost-saving opportunities n differ across utilities, depending on the inherent features of their production technology, n exogenous input costs, and other factors that cause costs to vary by location because of their n attributes. Utilities serving rural areas, for example, tend to have higher average costs than urban n utilities. n The regulator observes outcome (e.g., power plant reliability) but does not have a utility’s n expertise in assessing how management produced that outcome. Since regulators lack the n required information to identify optimal performance, they have to resort to alternative actions, n such as special incentives or judgment of a utility’s performance based on the information n provided to them by the utility and other sources.
57

III. The Challenge Facing Regulators in Measuring and Evaluating Utility Performance
n The appropriate use of performance measures requires careful interpretation of what they represent.
n Some measures reflect a utility’s short-term performance, mostly factors beyond utility management control.
n Other measures estimate performance in some functional area that is subject to statistical error.
n Good regulatory decisions require a combination of quantifiable information and judgment. Performance metrics in conjunction with other information can empower regulators to take consequential actions.
n The action might involve cost and other adjustments in a rate case, a detailed investigation of the utility triggered by preliminary evidence of subpar utility performance, or penalties or rewards for exceptional performance.
58

III. The Challenge Facing Regulators in Measuring and Evaluating Utility Performance
n Factors affecting utility performance n Utility performance depends on three general factors: n 1. The resources used, n 2. Management skills, which determine what resources a utility should use and how it n should combine them to produce some “output,” and n 3. Market and business conditions over which the utility has little control.
n Utility performance derives from two distinct factors: internal efficiencies and external n conditions. The first factor encompasses resources used, and the management skills that n determine how to combine and deploy those resources. The second factor accounts for market n and business conditions over which an individual utility has little or no control. Events over n which a utility has no control, such as abnormal weather or economic conditions, however, n should not exonerate the utility for how it responds to these incidents. If a storm causes a utility n to interrupt service, it should reestablish service with the shortest possible delay consistent with
59

III. The Challenge Facing Regulators in Measuring and Evaluating Utility Performance
n general safety and the public welfare; nor do external events eliminate the utility’s responsibility n to anticipate and cost-effectively mitigate the effects of those events. n The appropriate uses of performance measures depend on their ability to separate out the n effects of external and internal factors on performance. As an illustration, the cost of providing n electricity is a function of the level of labor, fuel, and capital; their costs; consumer n demographics; size of different customers and their electricity usage over different periods of n time; and geographical characteristics of the utility’s service territory. Two distinct management n teams in charge of operating the same utility would likely produce different outcomes. The one n team may better economize on the use of labor; for different reasons it might elicit higher n productivity from the employees than the other management team. It might also operate its n power plants more efficiently, and adapt more optimally to changes in input prices. Overall, n even though both management teams face the same outside factors and have access to the same n resources, one team is more proficient, at least in controlling costs. We can then conclude that n one management team is superior to the other team, at least in terms of cost efficiency. n Appendix A illustrates the challenges to regulators in interpreting differences in one n broad performance measure across utilities, namely, retail price. Analysts face difficulty in n isolating the effect of management behavior on the differences, even when they apply the most n sophisticated techniques.
60

III. The Challenge Facing Regulators in Measuring and Evaluating Utility Performance
Regulatory considerations for applying performance measures n Performance measures quantify the effect of both management behavior and outside n factors on “outcome.” Utility management makes decisions on what actions to take—for n example, build a new power plant, procure natural gas under long-term contracts, hedge fuel n costs, or purchase gas. The outcomes and their effects on consumers and society as a whole, n however, depend to some degree on factors over which the utility has little or no control. n When not applied properly by regulators, performance measures can lead to wrong n decisions and perverse outcomes. Regulators should understand the limitations of performance n measures to avoid these problems and to use those measures most constructively. n The following list identifies several elements of performance measures and the methods n of measurement that regulators need to understand before applying them in different venues. n 1. The first decision is to select the functional areas for measuring utility performance. n Major criteria for selection are: (a) the effect of a functional area on a utility’s total n cost or on consumer value from reliable and high-quality utility service, (b) the ease n of measurement, (c) the effort required to interpret a performance measure, and (d) n the influence of utility management in affecting performance. The ultimate goal is tomaximize the net
benefits from society’s perspective, which involves comparing the n benefits from improved regulation with the costs of measuring and evaluating n performance. Examples of performance measures that meet at least some of these n criteria are power plant equivalent availability, operation and maintenance (O&M) n expenditures, and service reliability levels. All of the measures are quantifiable, are
61

III. The Challenge Facing Regulators in Measuring and Evaluating Utility Performance
n important in terms of affecting consumer well-being, and are subject to utility management n discretion. n 2. Improved performance in one area can reduce performance in another. An increase n in power plant performance can reduce a utility’s total factor productivity (TFP)7 or n increase its total costs. A reduction in maintenance and other costs, as a second n example, may jeopardize the utility’s service quality. These outcomes call for a n utility-wide cost-benefit test. When focused on a single component of utility n operations—in our example, power plant performance—regulatory actions can create n perverse incentives: The utility would tend to devote excessive resources to the n targeted area, in the process jeopardizing performance in other areas. An emphasis
62

III. The Challenge Facing Regulators in Measuring and Evaluating Utility Performance
n on cost reductions can cause service quality to suffer by reducing reliability and n customer service. 3. Improved performance in one area can increase performance in another. In a n complementary relationship, better performance in one area can directly lead to n improved performance in one or more other areas. As an example, an increase in n power-plant equivalent availability can reduce a utility’s fuel costs. A n complementary relationship between two or more areas of utility operations heightens n the importance of performance improvement in those areas. n 4. The previous two items indicate an interrelationship between different performance n areas of a utility that regulators should take into account. For regulators, this n association means that the cost-benefit effect of performance improvement in a single n area has a spillover effect on other areas that requires consideration. When the n association is negative, a seemingly attractive action to reduce purchased gas n expenses, for example, might result in additional costs from hiring consultants and n more in-house labor. The net effect might be to increase the utility’s overall costs, n although purchased gas costs would decline as intended. The implication for n regulators is that to focus on improved performance in a single area can produce a
63

III. The Challenge Facing Regulators in Measuring and Evaluating Utility Performance
n counterproductive outcome in the form of higher rates to consumers without any n corresponding increase in the value of service. n 5. Performance depends upon different factors, as mentioned above, some under a n utility’s control, others exogenous to a utility. The challenge for regulators is to n separate the effects of management from the effects of factors beyond a utility’s n control. Without separation, the proper applications of performance measures n become greatly restricted. Specifically, it is unreasonable for regulators to then apply n performance measures mechanically or as the sole source of information for n evaluating a utility’s performance. n 6. Performance measures are either estimates or actual accounting numbers. Total n factor productivity is an estimate of a utility’s overall performance in using labor, n capital, materials, and other inputs to produce and deliver a service. It is an estimate n because it assumes certain production behavior by the utility and requires data that
64

III. The Challenge Facing Regulators in Measuring and Evaluating Utility Performance
n represent estimates rather than actual unadjusted accounting numbers (e.g., capital n services). These performance measures require the use of statistical and econometric n techniques that make certain, and sometimes restrictive, assumptions. Other n performance measures derive directly from reported data for example, labor n productivity, unit cost for customer service, and total operation and maintenance n expense per customer. n 7. Varying degrees of difficulty exist in measuring performance. The more sophisticated n approaches, while in theory better suited for broader applications, are susceptible to n measurement and data errors. These approaches include econometric and total factor n productivity techniques. They require regulatory staff to have a good understanding n of statistical techniques and other quantitative methods. If staff members don’t have n this understanding, the regulator would then have to rely on outside consultants, which can cost a non-
minimal amount of money.
65

III. The Challenge Facing Regulators in Measuring and Evaluating Utility Performance
n 8. Regulators can use either ex post or ex ante measures of performance, or both in a n particular application. Regulators can apply the former measure for prudence n reviews or to compare a utility’s actual performance with the expected outcome. In n these applications, regulators can actually use both kinds of performance measures, n with the ex ante measure acting as a prospective standard for benchmarking a utility’s n performance. Assume that the regulator sets a customer service standard for a utility. n After observing the utility’s actual performance, the regulator can compare this n performance with the standard to help judge whether the utility acted prudently. n 9. Tradeoffs can exist between short-term and long-term performance. Additional n capital expenditures have the effect of temporarily reducing a utility’s total factor n productivity while increasing long-term productivity. Tree trimming is a good
66

III. The Challenge Facing Regulators in Measuring and Evaluating Utility Performance
n example in which spending more today would likely lead to lower costs in the future n because of fewer outages and lower maintenance costs. This kind of investment over n time benefits both the utility and its customers. Higher O&M costs in general n incurred today can lead to better utility performance in the long run. n 10. Benchmarking can use as a reference, “average,” “exceptional,” or “standard” n performance. In evaluating or measuring a utility’s performance, the analyst often n needs to specify a “reference” or “baseline” performance. Average performance can n represent the “mean” performance for a sample of comparable utilities. Some n regulators might interpret average performance as the costs incurred by an efficient n utility. To other regulators, average performance might reflect subpar performance if n they deem the “mean” utilities to be performing poorly, say, because of weak n regulatory incentives. Exceptional performance might include the performance of the
67
III. The Challenge Facing Regulators in Measuring and Evaluating Utility Performance
n first quartile of utilities or, more stringently, those utilities lying on or close to the n efficiency frontier measured by statistical or non-statistical approaches. Regulators n can designate “standard performance” as a target for a utility to achieve or surpass. n The standard itself can reflect the average performance of a sample of utilities or the n performance of the top comparable utilities. n Regulators should consider whether they should view “standard” performance as a n moving target, rather than as a static concept that remains constant over time. As n technology improves and the utility adopts better management practices, regulators n would expect the utility to improve its performance over time. Regulators might also n press utilities to move in the direction of “frontier” performance in which they would n adopt “best practice” technologies and management practices.
68

III. The Challenge Facing Regulators in Measuring and Evaluating Utility Performance
How might regulators interpret and use the results? n Regulators can interpret a utility’s performance differently. Their interpretation affects what action they
take with regard to cost recovery, prudence reviews, and a follow-up investigation. The different interpretations include:
n 1. The utility is performing prudently; n 2. The utility is performing prudently but its performance can improve; n 3. The utility is performing worse than peer utilities; n 4. The utility is performing better than peer utilities; and n 5. The utility is performing unsatisfactorily. n Each interpretation has different implications for regulatory action. The regulator would n first need to have information before it can interpret utility performance. A performance metric n would seem essential: The regulator would need to compute the utility’s historical performance, n the performance of a group of utilities, or a predetermined performance standard based on cost, n engineering, and other information. In comparing performance across utilities, the regulator n would have to select a peer group whose characteristics are similar to the utility under review. n As an alternative, the utility could select a wider group of utilities and control for differences in n characteristics through statistical techniques and other quantitative methods. n For each of the above five interpretations of utility performance, a different regulatory n response would seem appropriate.
69

1. The utility is performing prudently;
n The first interpretation can result in no incremental regulatory action.
n The regulator might perceive utility performance as satisfactory in reflecting prudent utility behavior; that is, the utility’s performance coincides with acceptable management behavior.
70

2. The utility is performing prudently but its performance can improve;
n In the second interpretation, the regulator perceives utility performance as acceptable but believes that it can improve. “Prudence” here refers to utility management behavior that meets some minimum threshold but is not necessarily “above average.”
n The regulator might want to establish, for example, special incentives that would elicit “above average” performance or set a target that the utility would have to achieve by a specified future date.
n The regulator should first decide whether better performance for a specific area of operation is warranted (e.g., cost beneficial) from the perspective of consumers and the general public.
n An improvement in system reliability, for example, can produce smaller benefits to consumers than the additional costs they will have to pay.
71
3. The utility is performing worse than peer utilities;
n The third interpretation can result in a penalty for the utility or further regulatory action that would attempt to identify why the utility under review is performing below its peers.
n A comparison of a utility’s performance with other utilities involves “benchmarking.” n Benchmarking means setting a standard that is a point of comparison or reference for performance
appraisal. If, for example, the benchmark cost per customer is $X and a utility has a cost per customer of $1.2X, the utility is performing below the average level of its peers.
n The analyst can conduct a statistical test to determine whether the utility’s cost is significantly different than the mean cost for the peer group.
n The test would calculate a confidence interval that would indicate the accuracy of benchmarking and allow for hypothesis testing of cost performance.
n Use of this information depends on what regulators judge it to represent. If the numbers adjust for those cost factors beyond a utility’s control, then regulators might conclude that any residual is attributable to utility-management behavior. In this instance, the regulator might be more inclined to penalize the utility or investigate further why the utility’s performance falls below its peers.
72

4. The utility is performing better than peer utilities; n The fourth interpretation, in which the utility is performing above its peers, can
result in the regulator rewarding the utility for its performance. n It can give the utility a higher allowed rate of return or at least signal to the
utility that it won’t be penalized for its performance. n Analogous to the third interpretation, before rewarding the utility the regulator
should further investigate to judge whether the utility’s above-average performance is the product of exceptional management behavior or simply favorable conditions.
73

5. The utility is performing unsatisfactorily.
n The fifth interpretation of performance can cause the regulator to penalize the utility or take some other response that intends to improve the utility’s performance in the future.
n The regulator might require a management audit of the utility or set future targets for the utility to meet or else face penalties.
n In taking any action that directly affects a utility’s financial condition, the regulator should have good evidence that the utility’s poor performance reflects bad or imprudent management behavior. In other words, the regulator should clearly understand why the utility’s performance is subpar before taking any action that affects the utility’s financial condition.
74
IV. An Overview of Different Techniques for Measuring Performance A. Attributes of good performance measures n Performance measures should be objective, quantifiable, and verifiable. n One interpretation of these qualities is that good measures represent metrics with numerical
values based on public data and sound analytical techniques that anyone can replicate. n Benchmarking—that is, a comparison of a utility’s performance with some reference such as
its past performance or the average performance of similar utilities—requires quantitative performance measures; otherwise, regulators would find it difficult to determine whether a utility has performed satisfactorily.
n Some measures are estimates derived from advanced mathematical and statistical techniques. Replication and proper interpretation of these measures requires a high level of skills. Other measures derived from actual accounting numbers are easier to calculate and replicate.
n When establishing benchmarks, regulators should use performance measures that, as much as possible, reflect utility management behavior.
n One benchmark for regulators to consider is the performance of an “average utility.” If the regulator established a tighter or looser standard, a utility could face unfair penalties or enjoy windfall gains10 because of
75

IV. An Overview of Different Techniques for Measuring Performance n exogenous factors. n Assume, for example, that the benchmark represents the performance of the most efficient
utility and the regulator penalizes the utility for performing below this level. A utility can argue correctly that this outcome is incompatible with competitive markets where firms receive low returns when they perform below average, not if they perform less well than the highest performing firm; in competitive markets, firms receive above-normal returns when they perform above average.
n When performance measures do not separate management behavior from other factors, a utility, on the other hand, could profit or assume a top ranking even if only because of the favorable environment under which it operates.
76

IV. An Overview of Different Techniques for Measuring Performance B. Econometric methods, indexing, and data envelopment analysis n A March 2010 NRRI paper identified various approaches for measuring utility performance. n The approaches include econometric methods, indexing, and data envelopment n analysis (DEA).13 They differ in data requirements, ease of measurement, interpretation, and n other ways. Their uses by different regulatory bodies vary. U.S. regulators have more n experiences with the econometric and indexing approaches than with DEA. n In this country, the application of econometric methods for performance measurement n has mostly involved the estimation of statistical cost functions for operation and maintenance. n Performance for an individual utility relates to the difference between actual costs and predicted n costs.14 This method defines standard performance or the benchmark as the average performance n of utilities in the sample.15 In contrast, frontier cost functions define the standard as the best n performing utility. The difference between the two definitions of a benchmark for setting rates n can have large financial consequences for a utility trying to recover its costs. n A number of utilities have applied the statistical cost approach, most often to demonstrate to their
regulators that they have performed above average in the operational area under review. n As far as the author knows, no state public utility commission has taken the initiative in applying
econometric methods or DEA to monitor and evaluate the performance of energy utilities.16
77

V. An Overview of Different Techniques for Measuring Performance
n Performance measures offer regulators a tool that is useful for different purposes in different venues.
n This section will first identify three broad ways in which regulators can use performance measures.
n It will then discuss seven specific applications of performance measures.
n Regulators first should recognize the shortcomings of the performance measures for benchmarking purposes. They need to exercise caution in interpreting and using the measures.
n It is not uncommon for rankings of utility performance to vary depending on the measurement and benchmarking methods used.
n A good approach is to use different benchmarking methods to compare and evaluate the results, rather than rely on a single method.
78
V. An Overview of Different Techniques for Measuring Performance
A. General uses of performance measures and examples n Regulators can judge a utility’s actions in three general ways:
1. Evaluate the information used by a utility prior to an action. 2. Observe and evaluate the utility’s actual performance. 3. Retrospectively review the prudence of the utility in undertaking the action.
n Regulators can use performance measures in each of these three ways. The first way requires evaluation prior to an action, while the second and third evaluate utility performance after the fact.
n One example is the regulator periodically reviewing a utility’s construction performance in controlling cost and reaching scheduled milestones.
n Another example is a regulatory review of a utility’s prospective and retrospective actions with regard to customer service.
79

V. An Overview of Different Techniques for Measuring Performance
1. Illustration of service quality n The regulator might want to assess in advance whether a utility’s proposal to
improve its service quality is cost-beneficial. It might judge, after the fact, whether the utility’s actual service quality is satisfactory or requires additional review to determine whether the utility complied with the regulator’s standard.
n The regulator might establish service quality targets to compare periodically with the utility’s actual performance.
n The regulator might resort to an incentive mechanism that would reward a utility for surpassing a target and penalize it for performing below the target.
n Another option is for the regulator to penalize a utility for failing to meet pre-specified standards, but not reward it for superior performance. This option is premised on the belief that a utility should not earn a reward for fulfilling a primary obligation, such as providing high-quality service.
80

V. An Overview of Different Techniques for Measuring Performance
2. Illustration of energy-efficiency activities n In evaluating a utility’s proposed action, the regulator can review other utilities’ actions, in addition to the
outcome of those actions, to compare with what the utility under review is proposing. n If the utility, for example, proposes to invest in energy efficiency, the regulator can compare its estimated
costs with the actual costs incurred by other utilities for comparable investments. n The regulator can also compare the utility’s estimated benefits with the actual benefits for similar initiatives
undertaken by other utilities. n These comparisons can help the regulator gain access to information that is presumably more reliable and
objective than the information it receives from the utility under review. n They can, consequently, enhance the regulator’s ability to make an informed decision. n After the utility undertakes an action, the outcomes become measurable. Once the utility implements its
energy-efficiency initiatives, the regulator or some other party can measure the actual benefits. n The regulator can use the measurement to compare with the utility’s estimates to judge whether individual
initiatives should continue, expand, or terminate. n Measured performance by itself does not imply prudence or management competence; it can, however,
“red flag” a potential problem that needs correction or indicate that the utility’s performance is exceptionally bad, warranting further investigation.
81

V. An Overview of Different Techniques for Measuring Performance
3. Prudence review n Performance measures by themselves cannot determine whether a utility acted prudently. n If regulators use them in this capacity, the utility becomes highly susceptible to a whimsical n evaluation based on outcomes rather than the prudence of the decisions themselves. n A regulator who penalizes a utility for hedging its natural gas purchases when the spot
market price turns out to be lower than the hedged price is an example. Could the utility not have hedged, and would it have resulted in lower cost? Yes, no question—the utility had the option to purchase all of its gas at the spot price and would have benefited from doing so. But was the utility imprudent in
n deciding to hedge? We don’t know unless we do a detailed inquiry as to: (a) what the utility n knew at the time it made the decision, and (b) how it used that information to conclude
that n hedging was a reasonable alternative. The ratio of the hedged price to the actual price over n several years—a form of performance indicator—could suggest a problem requiring review.
82

V. An Overview of Different Techniques for Measuring Performance 4. Evaluation of a regulatory action n Another possible application of performance measures is to determine whether a particular
regulatory action or change in policy produced the intended improvement. n After establishing a new incentive mechanism for gas procurement, for example, the
regulator should want to know whether the mechanism improved the efficiency of a utility to purchase natural gas.
n A major challenge for the analyst is to attribute any improved performance to the incentive mechanism, per se, rather than to other factors: What would the utility’s gas costs have been in the absence of the incentive mechanism?
n Overall, performance measures can play an important, even if only a subordinate, role in the three general ways for regulators to evaluate a utility’s performance. By themselves, the measures lack the capability to assess management performance.
n Performance measures, however, can supplement other information to assist regulators in assuring customers that utilities do not flow through excessive costs to their customers and underperform in other ways.
83

V. An Overview of Different Techniques for Measuring Performance B. Specific applications 1. Regulatory incentive mechanisms n The core component of an incentive mechanism is the benchmark, which determines the specific costs and revenues
applicable to the mechanism, the strength and nature of incentives, the relative likelihood of award or penalty, and the utility’s exposure to risk as a result of the incentive mechanism. Appendix C describes one kind of incentive mechanism that highlights
n the importance of a benchmark in distributing the economic benefits between the utility’s n shareholders and consumers. n The rationale for an incentive mechanism is that it would motivate the utility to perform n at a higher level than that at which the utility performed previously. It has this effect by n decoupling revenues from a utility’s actual costs when its performance falls in the “exceptional” n category. Under one form of incentive mechanism, the utility earns no reward or receives no n penalty if actual costs equal (or are within a tolerance band around) the benchmark, and the n utility receives an incentive award if it beats the benchmark. In principle, then, the benchmark
84

V. An Overview of Different Techniques for Measuring Performance n should measure performance that results from reasonable management behavior reflecting n acceptable, but not superior, performance deserving of no award or penalty.19 The benchmark n could represent average or non-exceptional performance. As illustrated in Appendix C, the n wrong benchmark can have counterproductive results: They can cause higher rates for n customers and a windfall gain to the utility. Incentive mechanisms require performance n measures to calculate the magnitude of utility rewards or penalties (e.g., a prespecified n percentage of the difference between actual performance and the benchmark). n Performance measures applied to past utility actions can help regulators determine n whether an incentive mechanism had actually improved performance. Such a determination, n however, is extremely difficult to conduct. The regulator would need to determine how the n utility would have performed in the absence of the incentive mechanism. If the utility’s n performance substantially or even marginally improved with the mechanism, the regulator might infer that the
mechanism had a positive effect. But how much the mechanism improved n performance depends on the collective effects of other factors that might have changed.
85

V. An Overview of Different Techniques for Measuring Performance B. Specific applications 2. Periodic monitoring of utility performance outside a rate case a. Performance for individual functional areas n Monitoring has four major purposes: (1) report and evaluate utility performance in one n or more functional areas, (2) propose changes to regulatory policies and practices to improve n utility performance, (3) determine utility compliance with rules, guidelines, and expectations, n and (4) apply any mitigating actions when necessary. Performance measures offer regulators a n tool in conjunction with other information to carry out monitoring activities. Regulators might n want to quantify the performance of a utility in specific areas on an annual basis. If the measures n suggest a potential problem, regulators might further investigate with more detailed information n and analysis. n Periodic reviews can increase the regulator’s understanding of a utility system, and its components, in addition to its
actual performance. This understanding can assist regulators in n determining whether to adjust rates or take other actions based on evidence of exceptional n performance. Performance measures can help direct regulatory resources to those areas of utility n operations that are most in need of improvement. n Regulators may establish performance targets to evaluate a utility’s actual performance, n at least in terms of deciding whether to pursue further inquiry. Monitoring of a utility’s n performance can lead to: (1) regulatory actions aimed at avoiding recurrence of past problems or n (2) determining whether a utility has complied with a regulatory standard or obligation for a n functional area of operation. Did the utility continue to have bad customer service that needed n improvement? Did the utility meet the requirements established by the regulator for reliable n service? 86
V. An Overview of Different Techniques for Measuring Performance B. Specific applications 2. Periodic monitoring of utility performance outside a rate case b. Utility-wide performance n Econometrics, data envelopment analysis, and total factor productivity are distinct n approaches for measuring the overall cost performance of a utility. Although measuring a n utility’s cost performance in specific areas is important, it neglects the more substantial question n of how these “component” performances add up to the utility’s overall cost performance. After n all, it is the utility’s total cost that determines the rates it charges to different customers. n Appendix D shows how an improvement in total factor productivity reduces a utility’s n average costs and rates. By comparing a utility’s past growth rate of total factor productivity n with a peer group, the regulator is able to measure the effect of any differential on the utility’s n total cost. Assume that two utilities have different historical growth rates of TFP. This outcome n should cause the utility with the higher growth rate to have a lower percentage change in cost n over time, assuming other thing remaining the same. An increase in TFP is equivalent to a n decline in the real dollar cost of the aggregate input per unit of output. (See Appendix D for the n mathematical relationship between TFP and average costs.) The regulator might want to knowthe
additional dollars expended by the utility with the lower historical TFP growth. TFP depends n on several factors, including technical change, economies of scale, and the ability of utility n management to combine inputs to maximize output (i.e., productive efficiency).20 A comparison n of TFP growth rates across utilities, therefore, reflects a mixture of internal efficiencies and n external market conditions.
87

V. An Overview of Different Techniques for Measuring Performance
B. Specific applications 3. Comparison of a utility’s actual performance with a benchmark, both in rate cases and other regulatory forums n The measurement of performance is the first step toward a preliminary evaluation of a utility’s performance. n The next step is to develop a standard, which can include selecting peer n utilities and measuring their average performance. Regulators can then compare this average n performance with the performance under review. A statistically significant difference can attract n the regulator’s attention and lead to further action. n Analysts have assigned different functions for benchmarking. They include: n 1. Identify “best practices” in management processes and tools, n 2. Monitor relative performance across utilities, n 3. Identify areas of a utility’s operations that require needed attention or further n investigation, n 4. Establish targets or standards for utility performance, n 5. Mitigate the cost-plus nature of regulation, and n 6. Place the focus on outcomes instead of inputs. n As one application, regulators can then use the “benchmarking” results, along with other information, to determine
whether a utility should develop a plan to improve performance in a function the regulator deemed problematic. Regulators can apply this tool both within a rate case and in other regulatory venues.
88

V. An Overview of Different Techniques for Measuring Performance B. Specific applications 4. Evaluation of the reasonableness of “cost-of-service” components, adjustment of the rate of return on equity (ROE), and use of total factor productivity a. Rate-of-return regulation n Performance measures can assist regulators in a rate case. Regulators can adjust a utility’s allowed rate of return on equity for past performances. n They might reward a utility by adjusting upward the utility’s rate of return by 50 basis points for surpassing performance targets n established by the regulator. On the other side, a utility might receive a lower allowed ROE for n poor customer service or other subpar performance. n A major task of regulators in rate cases is to determine whether a utility overstated its n revenue requirements to justify a higher rate increase.21 Assume that a regulator uses a future n test year to determine new rates. The two broad factors affecting differences between historical n and future costs are forecasted changes in productivity and input prices. The utility’s forecasts of n costs are, therefore, dependent on expectations of its future productivity growth and input-prices n escalation. By understating the productivity gains, other things constant, the tendency is for the n utility to overstate its future revenue requirements and, therefore, the rate adjustment required for n earning a fair rate of return.22 Regulators should ask: Do the cost forecasts incorporate a change n in productivity that reflects good utility-management behavior and is comparable to the utility’s n historical performance? Regulators can use performance measures to determine whether future n test-year costs for specific functional areas reflect an appropriate baseline for setting new rates. n The regulator can observe historical values over a number of years to judge whether the change n in specific costs from current values to forecasted values is consistent with historical changes. n Changes in performance can supplement other information to determine reasonable costs for n setting new rates. n Appendix B illustrates a cost measure for individual utility functions adjusted for n inflation. Regulators can discern whether the implicit productivity change for a specific function n as projected by the utility is in line with historical changes. Assume, for example, that the utility n is projecting advertising costs per dollar revenue (in constant dollars) to increase by 10 percent n per annum over the next two years. If historically over the past five years, the per-annum n increase was only 2 percent, the regulator might rightly conclude that the utility is inflating n advertising costs in its future test-year filing, unless the utility provides a good explanation for n the higher growth rate in the future. 89
V. An Overview of Different Techniques for Measuring Performance
B. Specific applications 4. Evaluation of the reasonableness of “cost-of-service” components, adjustment of the rate of return on equity (ROE), and use of total factor productivity b. Price-and-revenue cap regulation n In a number of foreign countries, regulators have used performance measures as a benchmark to set the
parameters for a price-cap mechanism. n They apply statistical benchmarking to help determine the base price23 and the “stretch factor” component
of the Xfactor n for an individual utility based on changes in the TFP for peer utilities.24 One interpretation n of the base rate is that it represents the cost of an efficient utility, rather than strictly the cost of n the utility under review. Many of the price-cap plans include benchmarks for service quality. n One concern is that under price caps a utility would be strongly motivated to control costs, even n to the point of compromising service quality. A separate component using historical servicequality n levels as a benchmark would penalize a utility for falling below those levels (or, below n the lower bound of a pre-specified “band”).25
90

V. An Overview of Different Techniques for Measuring Performance
B. Specific applications 4. Evaluation of the reasonableness of “cost-of-service” components, adjustment of the rate of return on equity (ROE), and use of total factor productivity c. Riders n Regulators can tie rate adjustments outside a formal rate case to a
utility’s performance. n These adjustments occur within the confines of cost or formula-rate
riders.26 n Annual adjustments of base rates can depend, for example, on the
utility’s performance in customer service relative to some predetermined standard.
n Performance is, therefore, a factor in the context of both what the regulator expects from the utility and what outcome the utility achieves.
91

V. An Overview of Different Techniques for Measuring Performance 5. Preliminary review of a utility’s performance to determine further action n Performance measures can act as indicators of potential problem areas. n They can help regulators assess the benefits expected from a management audit or other thorough
investigation. n This use of performance measures involves detecting areas of a utility’s operation for which its current
performance compares unfavorably with other utilities, with the historical performance of the utility itself, or with the regulator’s predetermined desired outcome.
n A utility with certain costs that are “outliers” should undergo more detailed review to determine the reasons for its exceptional performance.
n One such detailed review that can uncover potential problem areas is a management audit, which this paper discussed in Part IV.C.1. An audit can evaluate past performance to determine cost recovery; or evaluate current management practices to recommend changes in these practices, such as work-force management and power-plant maintenance.
n These changes have the purpose of improving the utility’s future performance. n Narrow-based performance measures can provide the initial information to justify a management audit. n Management audits can help regulators better understand current utility processes and practices. They can
lead to changed utility actions that are more in line with “best practices.”
92

V. An Overview of Different Techniques for Measuring Performance 6. Examination of the reasons for performance differences across utilities n A statistical analysis can identify factors explaining why some utilities perform better in
certain operational areas than other utilities. n Why, for example, do some utilities have lower O&M expenses or higher equivalent
availability for coal power plants? Regulators should want n to know why some utilities under their jurisdiction are performing worse than other utilities. n Effective regulation would include inquiries into these questions—how else can regulators
know that the utilities under their jurisdiction are charging “just and reasonable” rates that reflect prudent and efficient utility management?
n This use of performance measures requires more than just calculating performance directly from accounting or other reported data; it also requires statistical analysis that measures the effects of individual factors on a utility’s performance.
93

V. An Overview of Different Techniques for Measuring Performance 7. Publicity of a utility’s performance on a periodic basis n The use of publicity to induce utility performance is uncommon in the U.S., but n regulators in other countries have more frequently used these tactics, especially in instances in n which a utility’s performance was poor.27 In Massachusetts, some utilities send in their n customers’ bills an annual report card on their performance. The regulator checks the accuracy n of the report before the utility releases it to the public. The information includes a comparison of n the utility’s commitment to a targeted performance level with its actual performance. n Performance areas for one utility, Western Massachusetts Electric Company, include: (a) the n utility’s response to customer calls, (b) average outages per customer, (c) the average number of n minutes without power per customer, and (d) customer complaints per thousand customers.28
94

VI. A Six-Step Approach for a “Performance” Initiative n Regulators can undertake six sequential tasks for developing a
“performance” initiative. n These are: n A. Identify the uses of performances measures n B. Select utility functional areas for regulatory review n C. Calculate the performance measures n E. Assess a utility’s performance n F. Take action
95

VI. A Six-Step Approach for a “Performance” Initiative
A. Identify the uses of performances measures n What purposes would they serve in improving utility
performance? n Regulators need to know how they can best apply
performance measures and not use them inappropriately. Part
n V.B discusses seven possible applications of performance measures.
96

VI. A Six-Step Approach for a “Performance” Initiative B. Select utility functional areas for regulatory review n Part III.C lists four criteria for selection: (a) the effect of a functional area on a utility’s n total cost or consumer value from reliable and high-quality utility service, (b) the ease of n measurement, (c) the effort needed to correlate performance measures with management n behavior, and (d) the influence of utility management in affecting performance. It makes
sense n to select a functional area that has a substantial effect on a utility’s costs or other
dimensions of n performance over which the utility has discretion.
97

VI. A Six-Step Approach for a “Performance” Initiative C. Calculate the performance measures n Performance measures can derive directly from accounting or
other statistics periodically compiled and reported by utilities; or utilities or regulatory staff can estimate performance measures using sophisticated analytical techniques.
n These techniques have the ability to separate the effects of management behavior from other factors in determining overall utility performance.
n Their applications require proficiency in statistics and other numerical methods.
98

VI. A Six-Step Approach for a “Performance” Initiative
D. Compare a utility’s performance with a predetermined benchmark n The benchmark can be the performances of other
utilities, the regulator's own standard, or n the utility’s own historical performance. A comparison
can help determine whether a utility’s n performance is exceptionally good or bad or falls
outside the range of “standard” performance.
99

VI. A Six-Step Approach for a “Performance” Initiative E. Assess a utility’s performance n The regulator can perform an internal review to further examine the
performance statistics to identify possible explanations for exceptionally good or bad performance.
n The regulator might also want the utility to respond to performance metrics showing its performance to lag behind the performances of other utilities.
100
VI. A Six-Step Approach for a “Performance” Initiative F. Take action n An action might include allowing a utility to recover costs for a
particular function, conducting a more detailed review of the utility’s behavior, or establishing stronger regulatory incentives for improved utility performance.
n With supplemental analysis, regulators can apply performance measures to disallow costs as well as penalize a utility in other ways.
n Symmetrical regulation would also reward a utility if its performance is exceptionally good—for example, if its performance exceeds the standard predetermined by the regulator because of outstanding management behavior.
101

NARUC Water Paper n Where Does Your Utility Stand? A
Regulator’s Guide to Defining, Measuring and Assessing Performance
102

I. Introduction A. An important function of regulation is to measure and evaluate the performance of public utilities. How else can regulation be effective?
1. Effective regulation requires it if utilities are to be held accountable for their performance.
2. After all, if regulators hope to set regulatory standards, determine “just and reasonable” rates or take other actions integral to their duties, they need to measure utility performance and acquire other information to evaluate utility performance.
103
I. Introduction
n B. U.S. regulators have under-exploited the benefits of performance measures. 1. Performance measures have several applications that regulators need to consider. 2. Regulators have made little use of performance measures for benchmarking (i.e.,
comparing one utility’s performance with a selected peer group). n C. Regulators should have interest in measuring utility performance.
1. Measurement can lead to better regulatory incentives and improved utility performance. Improved performance, in turn, can lead to lower rates over time, higher quality of service, fewer rate cases, and consumer protection against excessive utility costs.
2. Performance measurement can detect subpar utility performance that could lead to further investigation, cost disallowances or a change in regulatory incentives.
3. It can also help regulators determine whether utilities are satisfying stated objectives or targets.
4. Performance measurement can also help regulators reward utilities for superior performance that benefits customers via lower rates or higher service quality.
1.
104

II. What Do We Mean by Performance?
A. I define performance as the outcome of a single action. 1. Performance depends on two broad factors:
n Management behavior, and n Market and business conditions, and other factors beyond the control of a
utility 2. These actions affect the various dimensions of a utility’s operations (see also
Appendix A): n Reliability n Safety n Customer satisfaction n Financial health n Costs n Plant performance n Innovation n Asset management
3. Performance is the “proof of the pudding,” determining how a utility’s actions affect its customers and the public.
105

II. What Do We Mean by Performance?
n B. A tradeoff often exists between simplifying the measurement of performance and applying the measures in more regulatory decisions.
1. As an example, measuring the ability of utility management to control a specific cost item or total costs, to be used in rate setting or a prudence review, requires accounting for factors that lie beyond management’s influence.
2. Absent this consideration, any performance measure would have limited value for directly assessing utility-management behavior (i.e., the ability and effort of management to improve the utility’s performance).
3. When made across a sample of utilities, performance measures can provide a “red flag” that could trigger further regulatory review. The review could identify the reasons why some utilities have higher costs than other utilities or why their customer service is below average.
106

III. Why Should Regulators Measure Utility Performance?
A. Performance problems under regulation
1. The economics literature shows that public utilities left unregulated, or ineffectively regulated, would perform at a suboptimal level. They would: n Set prices too high, n Excessively price discriminate, n Provide an inferior quality of service, n Deploy a nonoptimal mix of inputs, and n Expend too little effort to control costs and innovate.
2. Studies on regulation have documented each of these effects, which depend on extant regulatory incentives and rules that govern utility behavior.
n B. Regulators have an information disadvantage 1. In traditional regulation, the regulator is at a disadvantage relative to the utility in
interpreting the utility’s performance.
107

III. Why Should Regulators Measure Utility Performance?
n Do the actual costs reflect competent utility management, or n Do they include wasteful costs that the utility could have avoided?
2. The utility generally would defend these costs as its best effort under the circumstances.
n In promoting their self-interest, many utilities would be inclined to provide incorrect or misleading information about their managerial efforts and cost opportunities.
n Performance measures and their application by regulators can help lessen the information asymmetry they inherently face in their oversight of utilities.
3. If regulators had good information about how utilities should perform, they could readily set performance standards that the utility would have to meet or suffer the consequences.
4. The regulator faces the problem of less-than-perfect information about the efforts of utility management and the utility’s cost opportunities.
5. The regulator observes outcome (e.g., water system reliability) but does not know how to assess management’s role in the outcome.
n Regulators lack the required information to identify optimal performance. n They have to resort, therefore, to alternative actions, such as special
incentives or judgment of a utility’s performance based on the information provided to them by the utility and other sources.
108
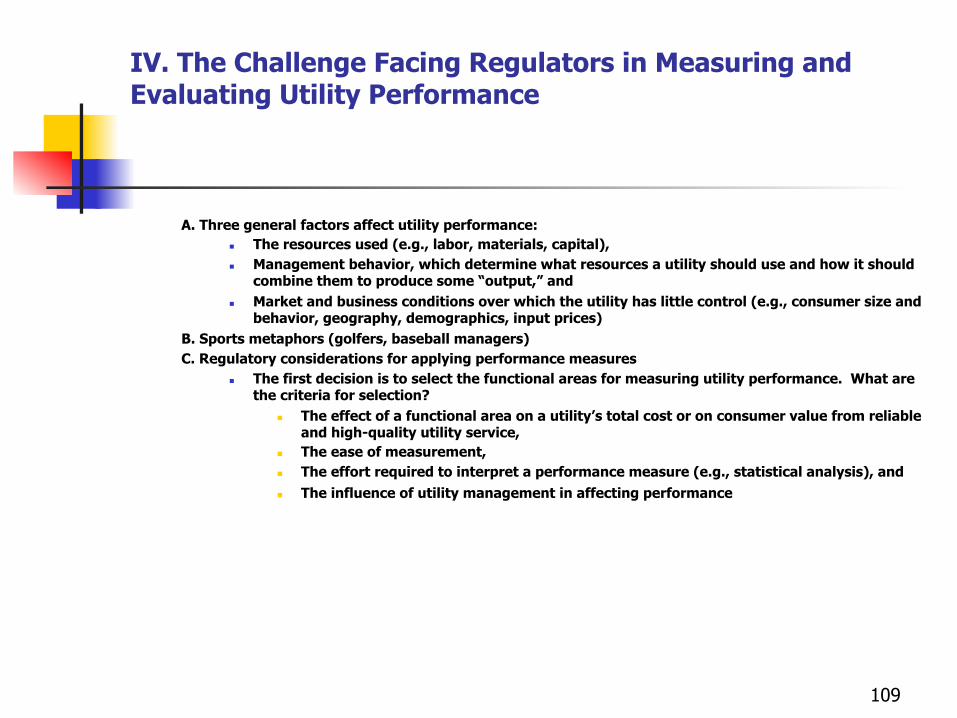
IV. The Challenge Facing Regulators in Measuring and Evaluating Utility Performance
A. Three general factors affect utility performance: n The resources used (e.g., labor, materials, capital), n Management behavior, which determine what resources a utility should use and how it should
combine them to produce some “output,” and n Market and business conditions over which the utility has little control (e.g., consumer size and
behavior, geography, demographics, input prices) B. Sports metaphors (golfers, baseball managers) C. Regulatory considerations for applying performance measures
n The first decision is to select the functional areas for measuring utility performance. What are the criteria for selection?
n The effect of a functional area on a utility’s total cost or on consumer value from reliable and high-quality utility service,
n The ease of measurement, n The effort required to interpret a performance measure (e.g., statistical analysis), and n The influence of utility management in affecting performance
109

IV. The Challenge Facing Regulators in Measuring and Evaluating Utility Performance
n Improved performance in one area can reduce performance in another (e.g., cost and service quality, TFP and sewerage plant performance).
n Performance depends upon different factors, some under a utility’s control, others exogenous to a utility (e.g., the retail price).
n Performance measures are either estimates or actual accounting numbers (e.g., water system reliability, total factor productivity which makes certain assumptions about the utility’s production process).
n Varying degrees of difficulties exist in measuring performance (e.g., accounting ratios and econometric methods).
n Regulators can use either ex post or ex ante measures of performance, or both in a particular application (e.g., standards and actual performance for service quality)
n Tradeoffs can exist between short-term and long-term performance (e.g., tree trimming, capital expenditures in general).
n Benchmarking can use as a reference: n “Average” performance (e.g., today’s baseline performance), n Historical trends, n “Exceptional” performance, or n “Standard” performance as determined by the regulator (e.g., the top quartile of utilities
in customer service)
110

V. General Interpretations of Utility Performance and Implications for Regulatory Action
n The utility is performing prudently. n The utility is performing prudently but
its performance can improve. n The utility is performing worse than
peer utilities. n The utility is performing better than
peer utilities. n The utility is performing
unsatisfactorily. 111

VI. An Overview of Different Techniques for Measuring Performance
A. Attributes of good performance measures n Performance measures should be objective, quantifiable and verifiable. One interpretation
of these qualities is that good measures represent metrics derived from public data and sound analytical techniques that anyone can replicate
n When establishing benchmarks, regulators should use performance measures that, as much as possible, reflect utility-management behavior.
n One benchmark for regulators to consider is the performance of an “average utility.” n When performance measures do not separate management behavior from other
factors: n A utility could profit or assume a top ranking even if only because of favorable
conditions under which it operates, or n It could be penalized for prudent and efficient behavior.
B. Econometric methods, indexing and data envelopment analysis (See NRRI Report 10-05) C. Additional ways to measure utility performance
n Management audits n Accounting ratios for individual functional areas (e.g., O&M expense per customer)
D. Uses and limitations of performance measurement (see Appendix B)
112

VII. Applications of Performance Measures in Different Regulatory Venues
A. Three general applications of performance measures n Evaluate the information used by a utility prior to an action (e.g., a utility proposing to improve its
service quality) n Observe and evaluate the utility’s actual performance (e.g., relative to a target previously
established by the regulator) n Retrospectively review the prudence of the utility in undertaking the action
B. Specific applications n Regulatory incentive mechanisms
n Performance benchmark n Actual performance
n Periodic monitoring of utility performance outside a rate case n Performance for individual functional areas n Utility-wide performance (e.g., total factor productivity, price, utility-wide average cost)
n Comparison of a utility’s actual performance with a benchmark, both in rate cases and other regulatory forums
n Need to establish a benchmark n Different functions for benchmarking (e.g., monitor a utility’s performance relative to other
utilities’, establish targets or standards for utility performance, mitigate the cost-plus nature of regulation)
n Evaluation of the reasonableness of “cost-of-service” components, adjustment of the rate of return on equity (ROE), and use of total factor productivity
n Rate-of-return regulation n Price-and-revenue cap regulation n Riders and trackers
n Preliminary review of a utility’s performance to determine further action n Examination of the reasons for performance differences across utilities n Publicity of a utility’s performance on a periodic basis 113

VIII. A Six-Step Approach for a “Performance” Initiative
A. Identify uses of performances measures n What purposes would they serve in improving utility performance? n Regulators need to know how they can best apply performance measures and not use them
inappropriately. B. Select utility functional areas for regulatory review
n There are four criteria for selection: n The effect of a functional area on a utility’s total cost or consumer value from reliable and
high-quality utility service, n The ease of measurement, n The effort needed to correlate performance measures with management behavior, and n The influence of utility management in affecting performance.
n It makes sense to select a functional area that has a substantial effect on a utility’s costs or other dimensions of performance over which the utility has discretion.
C. Calculate the performance measures n Performance measures can derive directly from accounting or other statistics periodically compiled
and reported by utilities, or n Utilities or regulatory staff can estimate performance measures using sophisticated analytical
techniques. n These techniques have the ability to separate the effects of management behavior from other
factors in determining overall utility performance. n Their applications require proficiency in statistics and other numerical methods.
n See Appendix C for AWWA’s listing of performance measures falling under five categories: n Organizational development n Customer relations
114
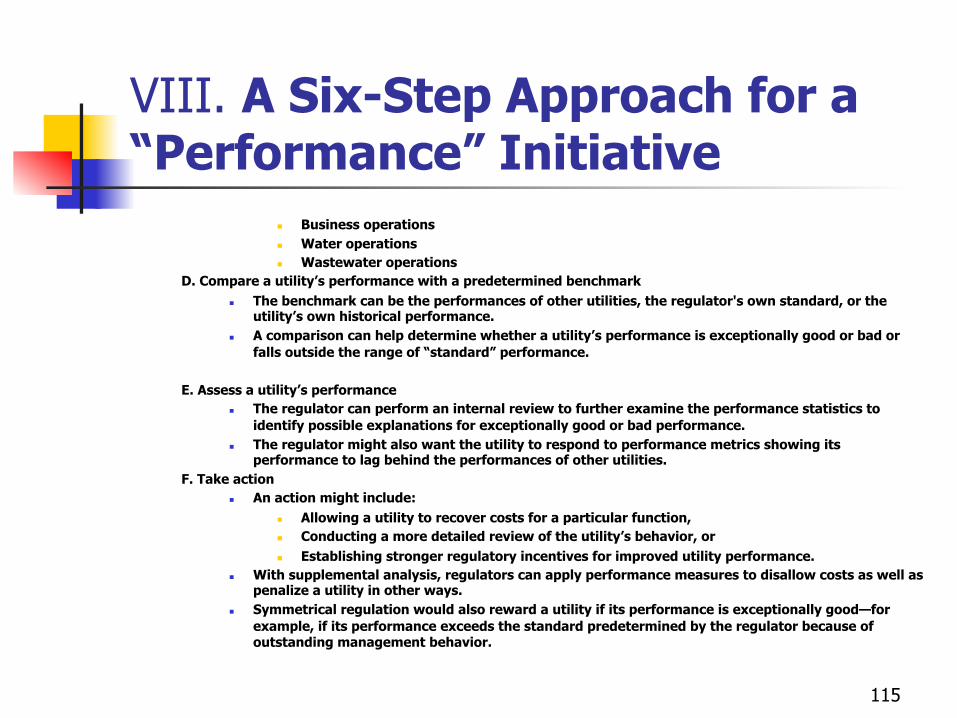
VIII. A Six-Step Approach for a “Performance” Initiative
n Business operations n Water operations n Wastewater operations
D. Compare a utility’s performance with a predetermined benchmark n The benchmark can be the performances of other utilities, the regulator's own standard, or the
utility’s own historical performance. n A comparison can help determine whether a utility’s performance is exceptionally good or bad or
falls outside the range of “standard” performance.
E. Assess a utility’s performance n The regulator can perform an internal review to further examine the performance statistics to
identify possible explanations for exceptionally good or bad performance. n The regulator might also want the utility to respond to performance metrics showing its
performance to lag behind the performances of other utilities. F. Take action
n An action might include: n Allowing a utility to recover costs for a particular function, n Conducting a more detailed review of the utility’s behavior, or n Establishing stronger regulatory incentives for improved utility performance.
n With supplemental analysis, regulators can apply performance measures to disallow costs as well as penalize a utility in other ways.
n Symmetrical regulation would also reward a utility if its performance is exceptionally good—for example, if its performance exceeds the standard predetermined by the regulator because of outstanding management behavior.
115

Notes from Ken Costello n How Utilities
n Utilities will have that benchmarking is too much micro management.
116

Notes from Ken Costello n However, if regulators are to regulate
properly then they need to have the ability to evaluate how well the utilities are working.
117

Notes from Ken Costello n Conceptionally benchmarking can also be
described as “red flagging” issues for further investigation and more detail. For example maybe during the period generation costs where higher because of forced outages. Ok why what was the reasons behind the forced outages?Basically there would be a need for staff or the Commission to ask for supplemental information.
n It would be up to staff to compile information.
118

Notes from Ken Costello n Adam Smith and the Invisible hand
Example. n Investment Houses evaluate and
benchmark utilities, why not regulators. Investment houses have a obligation to bond and shareholders, so do regulators to consumers and the public to evaluate and comment on the utilities performance.
119

Notes from Ken Costello n It is probably best to start and continue
the benchmarking process outside of a rate case in order that areas to benchmarked can be identified and the measurement criteria can be identified as well.
120

Notes from Ken Costello n The benchmarking process should be a
continuous process overtime in monitoring the utilities. It should so also be done in a cautious fashion. Commissions have a tendency to hesitate regarding benchmarking to make wrong decisions regarding the utilities.
121

Notes from Ken Costello n Regulators role places them in between
interests of the Consumer groups and industry.
122

Notes from Ken Costello n There is also this inherit fear on the
behalf of Commissions of being wrong since the utility has most of the information, i.e. Commissions regulate not manage utilities. Commissions need to overcome this fear since it is there responsibility to collect data to benchmark in order to determine the how well the utility is operating.
n Some areas to benchmark are customer service complaints.
123
Notes from Ken Costello n Regulatory responsibility to collect data. n Benchmarking leads to “red flags” but
discretion has to be used by the regulatory in investigating issues that have raised “red flags” to find out the reasons behind the red flags versus saying there is an issue on the part of the utility because a red flag was raised.
124

Notes from Ken Costello n An area for information for the start of
benchmarking could be the companies’ FERC annual reports.
n There is also the need for collaboration between the regulatory, utilities and OCCs in designing the areas to be benchmark and the criteria for measuring.
125

Notes from Ken Costello n Regulators need to do something
regarding benchmarking but it is a balancing act in not go too far or extreme but at the other end of the spectrum not doing anything.
126

Notes from Ken Costello n There is also the dilemma in that the
utility has the advantage of having the information therefore Commissions need to be cautious and make it an educational process. i.e. asymmetrical information.
127

Notes from Ken Costello n Commission must interpret information
which leads to the problem in that the utility could tell the Commission anything they want and say the Commission misinterpreted the information.
128

Notes from Ken Costello n For benchmarking there needs to be
scenarios develop and the regulator should not just give up and throw up there hands because it is too hard.
129

Notes from Ken Costello n Ken said the the water
presentation was probably too much information and the water industry was really upset about the presentation.
n Also need to emphasize that Benchmarking is not just an exercise in micro-management.
130

Notes from Ken Costello – Course outline n What is benchmarking of performance n Why measure performance reasons n What are the ways to measure (examples n What are the Pitfalls n Recognizing challenges
n Observing overt time
131
Notes from Ken Costello – Course outline
n Not necessarily a mechanism to penalize the utility
n Set a percentage as a reasonable target.
n Purchase gas costs. n Consumer complaints
132

Notes from Ken Costello – Course outline
n Some benchmarking might start with rule making
n Lost gas – pressure base n Examples volitity in gas or electric prices n Outages n Consumer Complaints.
Do a numeric example of Benchmarking see Ken’s papers.
133

Notes from Ken Costello – Course outline
n We need to bring into context on why we need to do benchmarking. That it should also be symmetrical
n How to address problems that arise from benchmarking is part of the responsibility of being in regulation.
n Need to look at final audience the Commissioners. It must be in a design and evaluation form that they can understand.
134

Notes from Ken Costello – Course outline
n Various forms of measurement from accounting to statistics to economics.
n When looking at benchmarking there also has to be an understanding of what is with the control of the utility and what is outside the control of the utility.
n It is part of the job of regulations and it is a worth while investment.
135

Notes from Ken Costello – Course outline
n “Regan’s quote, trust be verify.
136

Notes from Ken Costello – Course outline
n Example of benchmarking could be is why are outages more than normal. You will probably need to weight some of your benchmarking factors especially for small companies with % that with a few number of say meters a small change could result in a large percentage change versus companies with a larger customer base.
137
Notes from Ken Costello – Course outline
n Like depreciation studies benchmarking is best done outside a rate-case and if there are unresolved issues then the issues could potentially be raised in a rate case.
n Benchmarking can be used for risk assessment for doing audits on focusing on red flag issues.
138
Notes from Ken Costello – Course outline
n Benchmarking is in the public interest n Benchmarking is like preventive
medicine versus being reactive in a rate case.
139
Notes from Ken Costello – Course outline
n Benchmarking can be used outside of rate cases, like tractors and riders, incentive regulation, AFORS
n Freely admit it is an imperfect but the public is owed an obligation to verify that the utility is operating as efficiently as possible and their rates on are based on an efficient utility operation.
140

Notes from Ken Costello – Course outline
n Benchmarking is not a new issue and their will be resistance from the utilities.
n It is important to have information when doing benchmarking and it should not be done in a vacuum.
141

Techniques for Benchmarking and Performance Measurement n Metric Benchmarking:
n Numerical measurement of performance levels, and comparison with other industry specific utilities to identify areas needing improvement (e.g. staffing, numbers/connections, % line loss) % supply coverage, etc)
n Process Benchmarking n Identification of failing key processes and comparison
with best-in-class organizations to learn best practices with other utilities (billing and collection practices, management of maintenance, etc)
142

Techniques for Benchmarking and Performance Measurement n Metric benchmarking provides:
n Identification of those areas where there is an apparent performance gap
n An understanding of explanatory factors, such as physical characteristics, geography, weather, population, all key to understanding the apparent performance gap, and may add to or diminish that gap,, generating a real performance gap.
n All metric benchmarking data should therefore be treated with a degree of caution and not necessarily taken at face value.
143

Techniques for Benchmarking and Performance Measurement Process benchmarking: n Examines identified weak processes in conjunction
with process benchmarking partners, and seeks improvement.
n Partners may be outside of water industry n Best performance for own organization may not be
equal to best performance as determined by metric benchmarking of your peer, but rather the best that can be achieved in the particular circumstances and constraints that exist for you.
144

Designing & Developing a Benchmarking Program Process benchmarking methodology 2 n Prioritise and identify processes for comparison n • Multi-criteria decision analysis n • Collect data on selected processes n • Process analysis (process mapping) n • Detailed activity based costing n • Identify the performance gap (regression analysis, data n envelopment analysis, balanced scorecard) n • Identify partners (a creative exercise) n • Top rank performer n • Previous exposure to process benchmarking n • Inclination to provide relevant information n • Other specific criteria (public /private, size, process industry or n utility, product value, etc) n • Adopt a code of practice – and begin
145

Techniques for Benchmarking and Performance Measurement Process benchmarking methodology 1 n Identify all your processes, and sub-processes n • Analyze key aspects of processes n • High financial impact (leverage on costs, revenue n collection, - activity based costing) n • Importance to stakeholders (customers, regulators, n employees, community, media) n • Ability to be changed (can or cannot be changed)
146

Techniques for Benchmarking and Performance Measurement B. Econometric methods, indexing, and data envelopment analysis n A March 2010 NRRI paper identified various approaches for measuring utility performance. n The approaches include econometric methods, indexing, and data envelopment n analysis (DEA).13 They differ in data requirements, ease of measurement, interpretation, and n other ways. Their uses by different regulatory bodies vary. U.S. regulators have more n experiences with the econometric and indexing approaches than with DEA. n In this country, the application of econometric methods for performance measurement n has mostly involved the estimation of statistical cost functions for operation and maintenance. n Performance for an individual utility relates to the difference between actual costs and predicted costs. n This method defines standard performance or the benchmark as the average performance of utilities in the
sample. n In contrast, frontier cost functions define the standard as the best performing utility. n The difference between the two definitions of a benchmark for setting rates can have large financial
consequences for a utility trying to recover its costs. n A number of utilities have applied the statistical cost approach, most often to demonstrate to their
regulators that they have performed above average in the operational area under review. n As far as the author knows, no state public utility commission has taken the initiative in applying
econometric methods or DEA to monitor and evaluate the performance of energy utilities.
147

Designing & Developing a Benchmarking Program n Regulators can undertake six sequential tasks for developing a
“performance” initiative. n These are: n A. Identify the uses of performances measures n B. Select utility functional areas for regulatory review n C. Calculate the performance measures n E. Assess a utility’s performance n F. Take action
148

Techniques for Benchmarking and Performance Measurement A. Attributes of good performance measures n Performance measures should be objective, quantifiable, and verifiable. n One interpretation of these qualities is that good measures represent metrics with numerical
values based on public data and sound analytical techniques that anyone can replicate. n Benchmarking—that is, a comparison of a utility’s performance with some reference such as
its past performance or the average performance of similar utilities—requires quantitative performance measures; otherwise, regulators would find it difficult to determine whether a utility has performed satisfactorily.
n Some measures are estimates derived from advanced mathematical and statistical techniques. Replication and proper interpretation of these measures requires a high level of skills. Other measures derived from actual accounting numbers are easier to calculate and replicate.
n When establishing benchmarks, regulators should use performance measures that, as much as possible, reflect utility management behavior.
n One benchmark for regulators to consider is the performance of an “average utility.” If the regulator established a tighter or looser standard, a utility could face unfair penalties or enjoy windfall gains because of exogenous factors.
149
Techniques for Benchmarking and Performance Measurement n Assume, for example, that the benchmark represents the
performance of the most efficient utility and the regulator penalizes the utility for performing below this level. A utility can argue correctly that this outcome is incompatible with competitive markets where firms receive low returns when they perform below average, not if they perform less well than the highest performing firm; in competitive markets, firms receive above-normal returns when they perform above average.
n When performance measures do not separate management behavior from other factors, a utility, on the other hand, could profit or assume a top ranking even if only because of the favorable environment under which it operates.
150

Designing & Developing a Benchmarking Program F. Take action n An action might include allowing a utility to recover costs for a
particular function, conducting a more detailed review of the utility’s behavior, or establishing stronger regulatory incentives for improved utility performance.
n With supplemental analysis, regulators can apply performance measures to disallow costs as well as penalize a utility in other ways.
n Symmetrical regulation would also reward a utility if its performance is exceptionally good—for example, if its performance exceeds the standard predetermined by the regulator because of outstanding management behavior.
151
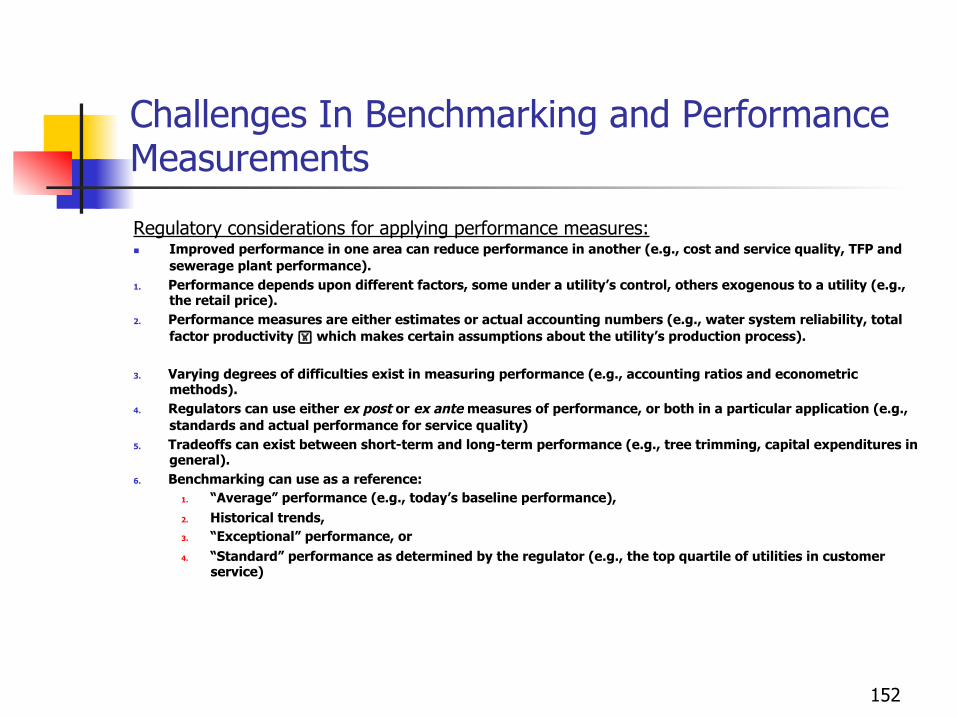
Challenges In Benchmarking and Performance Measurements
Regulatory considerations for applying performance measures: n Improved performance in one area can reduce performance in another (e.g., cost and service quality, TFP and
sewerage plant performance). 1. Performance depends upon different factors, some under a utility’s control, others exogenous to a utility (e.g.,
the retail price). 2. Performance measures are either estimates or actual accounting numbers (e.g., water system reliability, total
factor productivity which makes certain assumptions about the utility’s production process).
3. Varying degrees of difficulties exist in measuring performance (e.g., accounting ratios and econometric methods).
4. Regulators can use either ex post or ex ante measures of performance, or both in a particular application (e.g., standards and actual performance for service quality)
5. Tradeoffs can exist between short-term and long-term performance (e.g., tree trimming, capital expenditures in general).
6. Benchmarking can use as a reference: 1. “Average” performance (e.g., today’s baseline performance), 2. Historical trends, 3. “Exceptional” performance, or 4. “Standard” performance as determined by the regulator (e.g., the top quartile of utilities in customer
service)
152
The Pros & Cons of Benchmarking
n The pitfalls and challenges of benchmarking
n Lessons learned
153

Designing & Developing a Benchmarking Program
A. Identify the uses of performances measures n What purposes would they serve in improving utility
performance? n Regulators need to know how they can best apply
performance measures and not use them inappropriately. Part
n V.B discusses seven possible applications of performance measures.
154

Designing & Developing a Benchmarking Program B. Select utility functional areas for regulatory review n Part III.C lists four criteria for selection: (a) the effect of a functional area on a utility’s n total cost or consumer value from reliable and high-quality utility service, (b) the ease of n measurement, (c) the effort needed to correlate performance measures with management n behavior, and (d) the influence of utility management in affecting performance. It makes
sense n to select a functional area that has a substantial effect on a utility’s costs or other
dimensions of n performance over which the utility has discretion.
155

Designing & Developing a Benchmarking Program C. Calculate the performance measures n Performance measures can derive directly from accounting or
other statistics periodically compiled and reported by utilities; or utilities or regulatory staff can estimate performance measures using sophisticated analytical techniques.
n These techniques have the ability to separate the effects of management behavior from other factors in determining overall utility performance.
n Their applications require proficiency in statistics and other numerical methods.
156

Designing & Developing a Benchmarking Program
D. Compare a utility’s performance with a predetermined benchmark n The benchmark can be the performances of other
utilities, the regulator's own standard, or n the utility’s own historical performance. A comparison
can help determine whether a utility’s n performance is exceptionally good or bad or falls
outside the range of “standard” performance.
157

Designing & Developing a Benchmarking Program E. Assess a utility’s performance n The regulator can perform an internal review to further examine the
performance statistics to identify possible explanations for exceptionally good or bad performance.
n The regulator might also want the utility to respond to performance metrics showing its performance to lag behind the performances of other utilities.
158

Benchmarking Process n Step one to identify the functional area to be
benchmarked and establish the performance measure.
n Step two to Calculate the performance measure for the each functional area being benchmarked.
n Step three to compare the utility’s performance with the predetermined benchmark.
n Step four to take action as required.
159