Benchmarking and Best Practices Survey Results BRD ...
12
1 2013-2014 BREWERS’ RESOURCE DIRECTORY BREWERS’ RESOURCE DIRECTORY BRD 2013-2014 BENCHMARKING AND BESTPRACTICES SURVEY RESULTS BREWERS ASSOCIATION MEMBERS-ONLY EXCLUSIVE CONTENT • BREWERS ASSOCIATION MEMBERS-ONLY EXCLUSIVE CONTENT • BREWERS ASSOCIATION MEMBERS-ONLY EXCLUSIVE CONTENT • BREWERS ASSOCIATION MEMBERS The Brewers Association (BA) conducted a comprehensive survey of America’s craft brewers to establish and share industry benchmarks and best practices. This survey was developed in response to BA member requests for hard data that they could use to measure their businesses and in turn make them more efficient and successful. 2012 survey questions were revised slightly from the 2010 edition; importantly, the 2012 survey now includes the BA salary survey as well. Results were compiled and aggregated by BA staff. The results provide a valuable set of tools specific to America’s small and independent craft brewers. This section contains the highlights of the 2012 survey and newly a sampling of the BA salary survey results. Remaining data and more detailed in-depth salary information will be available in the Members-Only section of BrewersAssociation.org. Thank you to all who participated and may you find value in these results to help you grow with the industry. This is, indeed, an exciting time to be part of the craft beer community! Sincerely, Paul Gatza Brewers Association Kristi Switzer Brewers Publications Chris Swersey Technical Brewing Projects Coordinator
Transcript of Benchmarking and Best Practices Survey Results BRD ...
12013-2014 Brewers’ resource Directory
BREWERS’ RESOURCE DIRECTORYBRD2013-2014
BENCHMARKING AND BESTPRACTICES
SURVEY RESULTS• BREWERS ASSOCIATION MEMBERS-ONLY EXCLUSIVE CONTENT • BREWERS ASSOCIATION MEMBERS-ONLY EXCLUSIVE CONTENT • BREWERS ASSOCIATION MEMBERS-ONLY EXCLUSIVE CONTENT • BREWERS ASSOCIATION MEMBERS-ONLY EXCLUSIVE CONTENT
BREWERSASSOCIATION.ORG 107
Benchmarking and Best Practices Survey Results
BENCHMARKING AND BESTPRACTICES SURVEY RESULTS
The Brewers Association (BA) conducted a comprehensive survey of America’s craft brewers to establish and share industry benchmarks and best
practices. This survey was developed in response to BA member requests for hard data that they could use to measure their businesses and in turn make
them more efficient and successful.
2012 survey questions were revised slightly from the 2010 edition; importantly, the 2012 survey now includes the BA salary survey as well. Results were
compiled and aggregated by BA staff. The results provide a valuable set of tools specific to America’s small and independent craft brewers.
This section contains the highlights of the 2012 survey and newly a sampling of the BA salary survey results. Remaining data and more detailed in-depth
salary information will be available in the Members-Only section of BrewersAssociation.org.
Thank you to all who participated and may you find value in these results to help you grow with the industry. This is, indeed, an exciting time to be part of
the craft beer community!
Sincerely,
Paul Gatza
Brewers Association
Kristi Switzer
Brewers Publications
Chris Swersey
Technical Brewing Projects Coordinator
Benchmarking and Best Practices Survey Results
22013-2014 Brewers’ resource Directory
Benchmarking and Best Practices Survey Results
108 2013-2014 BREWERS’ RESOURCE DIRECTORY
Key
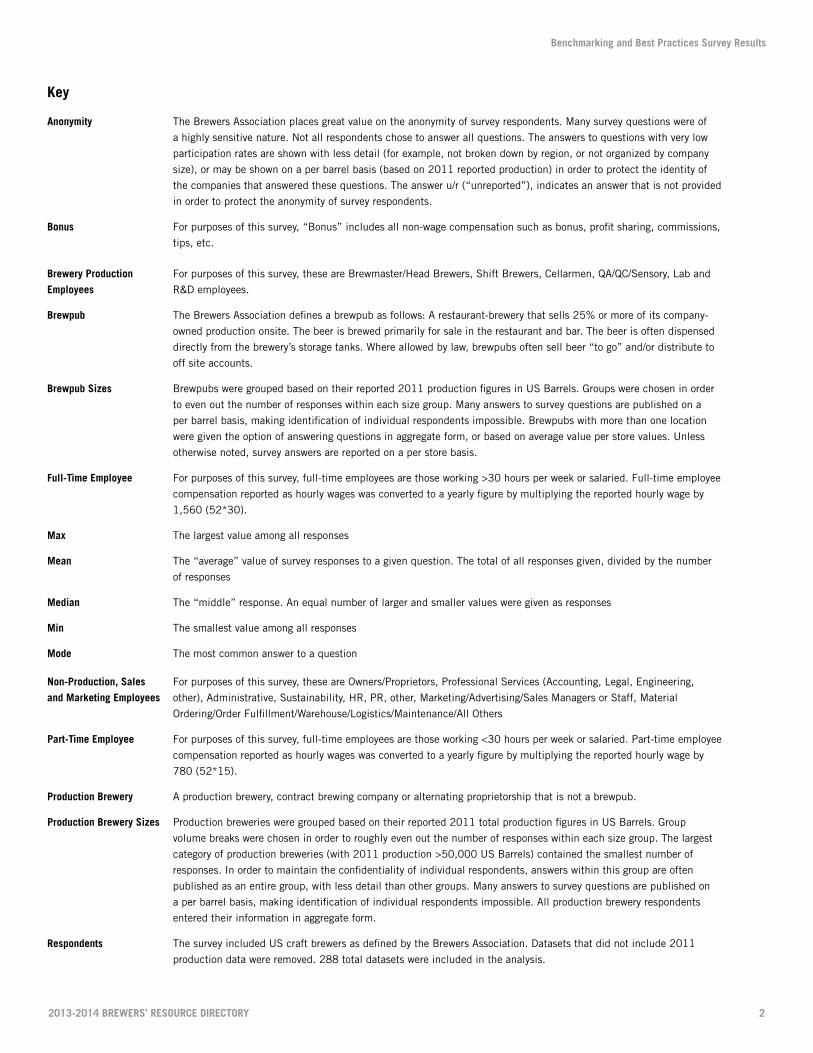
Anonymity The Brewers Association places great value on the anonymity of survey respondents. Many survey questions were of
a highly sensitive nature. Not all respondents chose to answer all questions. The answers to questions with very low
participation rates are shown with less detail (for example, not broken down by region, or not organized by company
size), or may be shown on a per barrel basis (based on 2011 reported production) in order to protect the identity of
the companies that answered these questions. The answer u/r (“unreported”), indicates an answer that is not provided
in order to protect the anonymity of survey respondents.
Bonus For purposes of this survey, “Bonus” includes all non-wage compensation such as bonus, profit sharing, commissions,
tips, etc.
Brewery Production For purposes of this survey, these are Brewmaster/Head Brewers, Shift Brewers, Cellarmen, QA/QC/Sensory, Lab and
Employees R&D employees.
Brewpub The Brewers Association defines a brewpub as follows: A restaurant-brewery that sells 25% or more of its company-
owned production onsite. The beer is brewed primarily for sale in the restaurant and bar. The beer is often dispensed
directly from the brewery’s storage tanks. Where allowed by law, brewpubs often sell beer “to go” and/or distribute to
off site accounts.
Brewpub Sizes Brewpubs were grouped based on their reported 2011 production figures in US Barrels. Groups were chosen in order
to even out the number of responses within each size group. Many answers to survey questions are published on a
per barrel basis, making identification of individual respondents impossible. Brewpubs with more than one location
were given the option of answering questions in aggregate form, or based on average value per store values. Unless
otherwise noted, survey answers are reported on a per store basis.
Full-Time Employee For purposes of this survey, full-time employees are those working >30 hours per week or salaried. Full-time employee
compensation reported as hourly wages was converted to a yearly figure by multiplying the reported hourly wage by
1,560 (52*30).
Max The largest value among all responses
Mean The “average” value of survey responses to a given question. The total of all responses given, divided by the number
of responses
Median The “middle” response. An equal number of larger and smaller values were given as responses
Min The smallest value among all responses
Mode The most common answer to a question
Non-Production, Sales For purposes of this survey, these are Owners/Proprietors, Professional Services (Accounting, Legal, Engineering,
and Marketing Employees other), Administrative, Sustainability, HR, PR, other, Marketing/Advertising/Sales Managers or Staff, Material
Ordering/Order Fulfillment/Warehouse/Logistics/Maintenance/All Others
Part-Time Employee For purposes of this survey, full-time employees are those working <30 hours per week or salaried. Part-time employee
compensation reported as hourly wages was converted to a yearly figure by multiplying the reported hourly wage by
780 (52*15).
Production Brewery A production brewery, contract brewing company or alternating proprietorship that is not a brewpub.
Production Brewery Sizes Production breweries were grouped based on their reported 2011 total production figures in US Barrels. Group
volume breaks were chosen in order to roughly even out the number of responses within each size group. The largest
category of production breweries (with 2011 production >50,000 US Barrels) contained the smallest number of
responses. In order to maintain the confidentiality of individual respondents, answers within this group are often
published as an entire group, with less detail than other groups. Many answers to survey questions are published on
a per barrel basis, making identification of individual respondents impossible. All production brewery respondents
entered their information in aggregate form.
Respondents The survey included US craft brewers as defined by the Brewers Association. Datasets that did not include 2011
production data were removed. 288 total datasets were included in the analysis.
Benchmarking and Best Practices Survey Results
32013-2014 Brewers’ resource DirectoryBREWERSASSOCIATION.ORG 109
Benchmarking and Best Practices Survey Results
Midwest Illinois, Indiana, Iowa, Kansas, Michigan, Minnesota, Missouri, Nebraska, North Dakota, Ohio, South Dakota, Wisconsin
Mountain West Arizona, Colorado, Nevada, New Mexico, Utah, Wyoming
Northeast Connecticut, Delaware, Maine, Maryland, Massachusetts, New Hampshire, New Jersey, New York, Pennsylvania, Rhode Island, Vermont, Virginia, Wash-ington DC, West Virginia
Paci�c California, Hawaii
Paci�c NW Alaska, Idaho, Montana, Oregon, Washington
South Arkansas, Florida, Georgia, Kentucky, Louisiana, Mississippi, North Carolina, Oklahoma, South Carolina, Tennessee, Texas
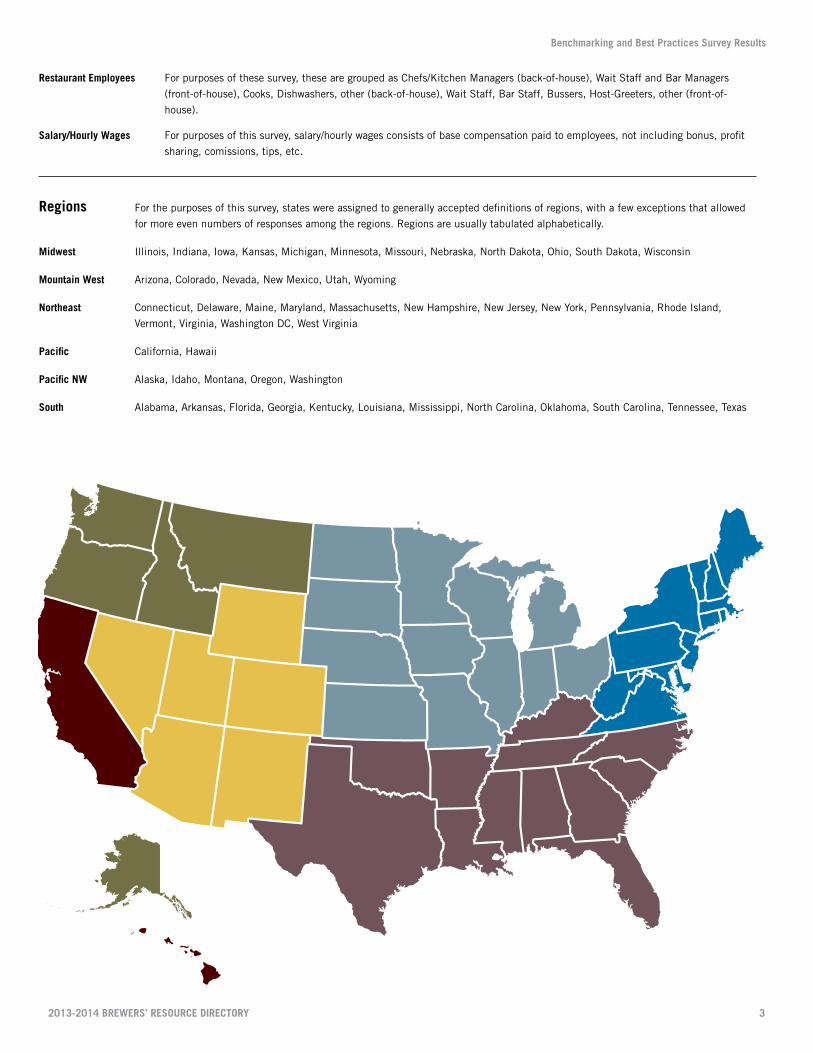
Regions For the purposes of this survey, states were assigned to generally accepted definitions of regions, with a few exceptions that allowed
for more even numbers of responses among the regions. Regions are usually tabulated alphabetically.
Midwest Illinois, Indiana, Iowa, Kansas, Michigan, Minnesota, Missouri, Nebraska, North Dakota, Ohio, South Dakota, Wisconsin
Mountain West Arizona, Colorado, Nevada, New Mexico, Utah, Wyoming
Northeast Connecticut, Delaware, Maine, Maryland, Massachusetts, New Hampshire, New Jersey, New York, Pennsylvania, Rhode Island,
Vermont, Virginia, Washington DC, West Virginia
Pacific California, Hawaii
Pacific NW Alaska, Idaho, Montana, Oregon, Washington
South Alabama, Arkansas, Florida, Georgia, Kentucky, Louisiana, Mississippi, North Carolina, Oklahoma, South Carolina, Tennessee, Texas
Restaurant Employees For purposes of these survey, these are grouped as Chefs/Kitchen Managers (back-of-house), Wait Staff and Bar Managers
(front-of-house), Cooks, Dishwashers, other (back-of-house), Wait Staff, Bar Staff, Bussers, Host-Greeters, other (front-of-
house).
Salary/Hourly Wages For purposes of this survey, salary/hourly wages consists of base compensation paid to employees, not including bonus, profit
sharing, comissions, tips, etc.
42013-2014 Brewers’ resource Directory
Benchmarking and Best Practices Survey Results
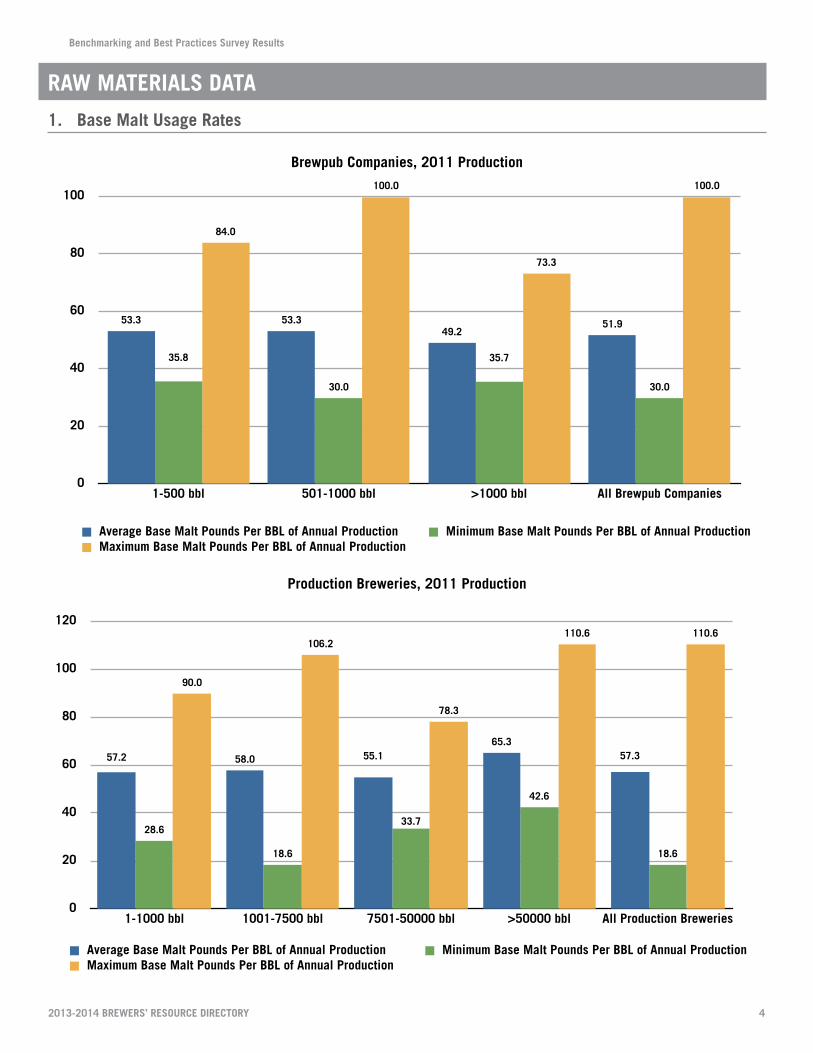
Raw MateRialS Data
1. Base Malt Usage Rates
Brewpub Companies, 2011 Production
0
20
40
60
80
100
1-500 bbl 501-1000 bbl >1000 bbl All Brewpub Companies
100.0
73.3
100.0
84.0
30.0
35.7
30.0
35.8
51.949.2
53.353.3
Average Base Malt Pounds Per BBL of Annual Production Minimum Base Malt Pounds Per BBL of Annual ProductionMaximum Base Malt Pounds Per BBL of Annual Production
Production Breweries, 2011 Production
0%
20%
40%
60%
80%
100%
Multiple Brewing Shifts Multiple Packaging Shifts
27%
63%
82%
100%
46%
100%
17%
69%
5%10%
1-1000 bbl 1001-7500 bbl 7501-50000 bbl >50000 bbl All Production Breweries
0
20
40
60
80
100
120
1-1000 bbl 1001-7500 bbl 7501-50000 bbl >50000 bbl All Production Breweries
110.6110.6
78.3
106.2
90.0
18.6
42.6
33.7
18.6
28.6
57.365.3
55.158.057.2
Average Base Malt Pounds Per BBL of Annual Production Minimum Base Malt Pounds Per BBL of Annual ProductionMaximum Base Malt Pounds Per BBL of Annual Production
Benchmarking and Best Practices Survey Results
52013-2014 Brewers’ resource Directory
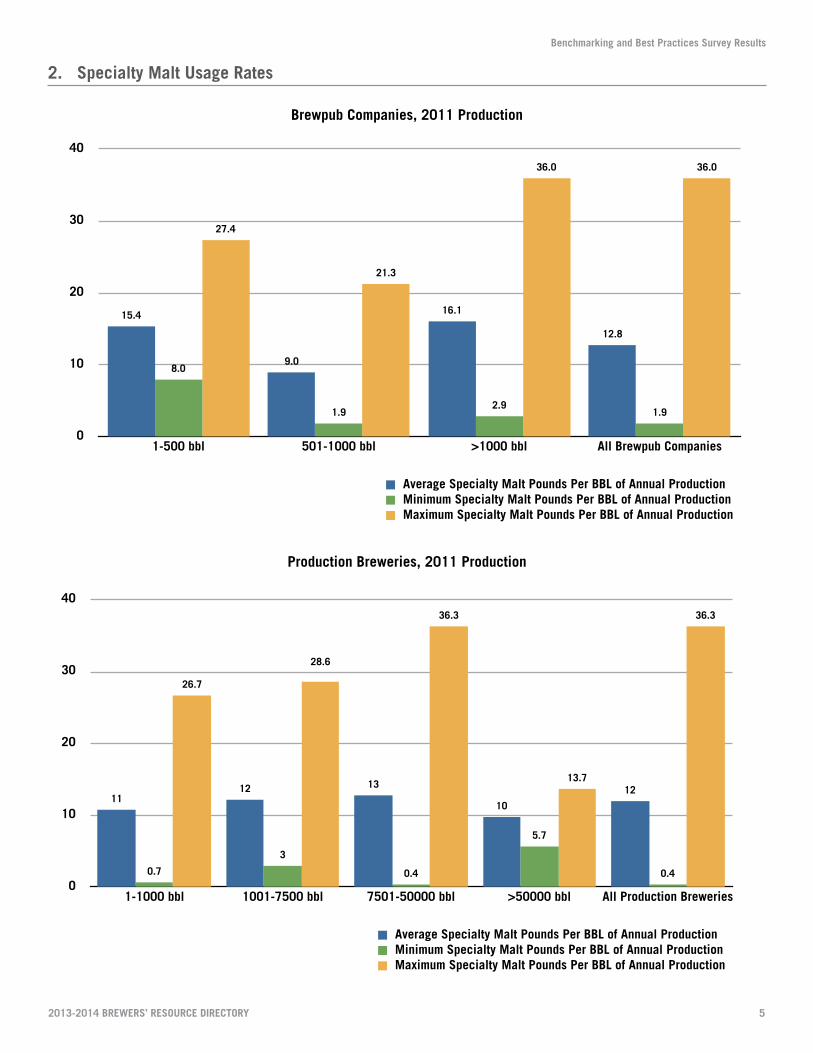
2. Specialty Malt Usage Rates
Brewpub Companies, 2011 Production
0
10
20
30
40
1-500 bbl 501-1000 bbl >1000 bbl All Brewpub Companies
36.036.0
21.3
27.4
1.92.9
1.9
8.0
12.8
16.1
9.0
15.4
Average Specialty Malt Pounds Per BBL of Annual ProductionMinimum Specialty Malt Pounds Per BBL of Annual ProductionMaximum Specialty Malt Pounds Per BBL of Annual Production
Production Breweries, 2011 Production
0%
20%
40%
60%
80%
100%
Multiple Brewing Shifts Multiple Packaging Shifts
27%
63%
82%
100%
46%
100%
17%
69%
5%10%
1-1000 bbl 1001-7500 bbl 7501-50000 bbl >50000 bbl All Production Breweries
0
10
20
30
40
1-1000 bbl 1001-7500 bbl 7501-50000 bbl >50000 bbl All Production Breweries
36.3
13.7
36.3
28.6
26.7
0.4
5.7
0.4
3
0.7
12
10
131211
Average Specialty Malt Pounds Per BBL of Annual ProductionMinimum Specialty Malt Pounds Per BBL of Annual ProductionMaximum Specialty Malt Pounds Per BBL of Annual Production
Benchmarking and Best Practices Survey Results
62013-2014 Brewers’ resource Directory
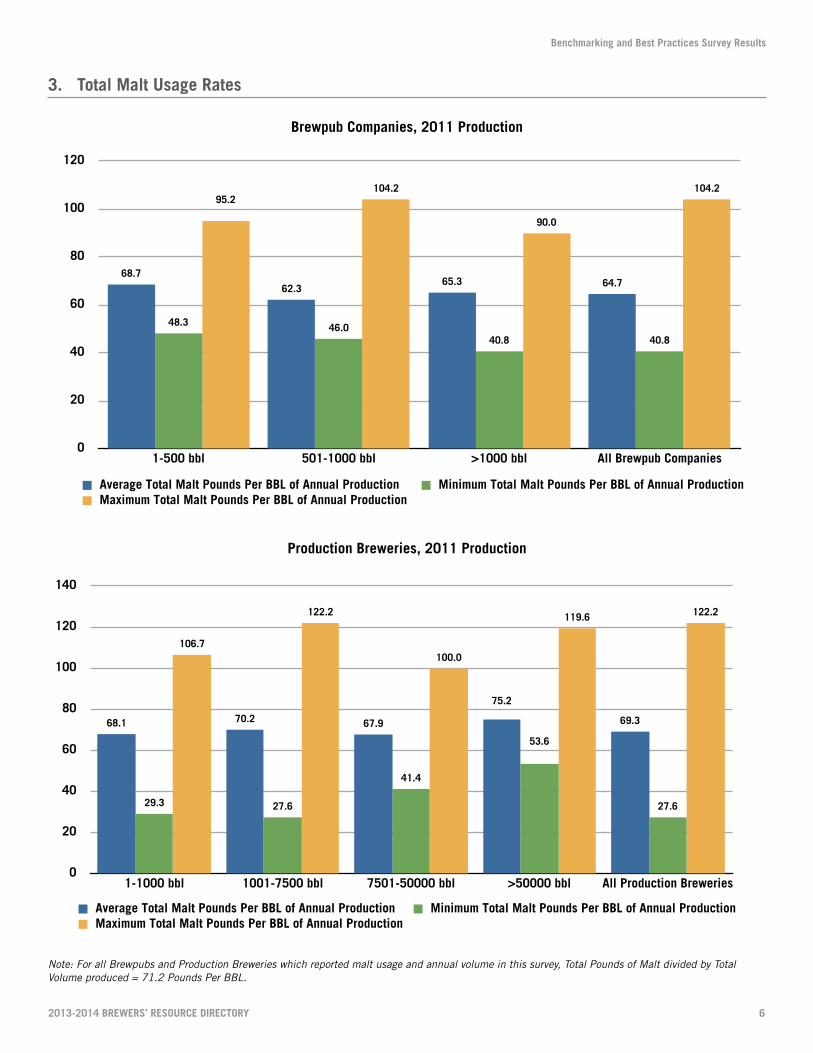
3. total Malt Usage Rates
Brewpub Companies, 2011 Production
0
20
40
60
80
100
120
1-500 bbl 501-1000 bbl >1000 bbl All Brewpub Companies
104.2
90.0
104.295.2
40.840.846.048.3
64.765.362.3
68.7
Average Total Malt Pounds Per BBL of Annual Production Minimum Total Malt Pounds Per BBL of Annual ProductionMaximum Total Malt Pounds Per BBL of Annual Production
Production Breweries, 2011 Production
0%
20%
40%
60%
80%
100%
Multiple Brewing Shifts Multiple Packaging Shifts
27%
63%
82%
100%
46%
100%
17%
69%
5%10%
1-1000 bbl 1001-7500 bbl 7501-50000 bbl >50000 bbl All Production Breweries
0
20
40
60
80
100
120
140
1-1000 bbl 1001-7500 bbl 7501-50000 bbl >50000 bbl All Production Breweries
122.2119.6
100.0
122.2
106.7
27.6
53.6
41.4
27.629.3
69.3
75.2
67.970.268.1
Average Total Malt Pounds Per BBL of Annual Production Minimum Total Malt Pounds Per BBL of Annual ProductionMaximum Total Malt Pounds Per BBL of Annual Production
Note: For all Brewpubs and Production Breweries which reported malt usage and annual volume in this survey, Total Pounds of Malt divided by Total Volume produced = 71.2 Pounds Per BBL.
Benchmarking and Best Practices Survey Results
72013-2014 Brewers’ resource Directory
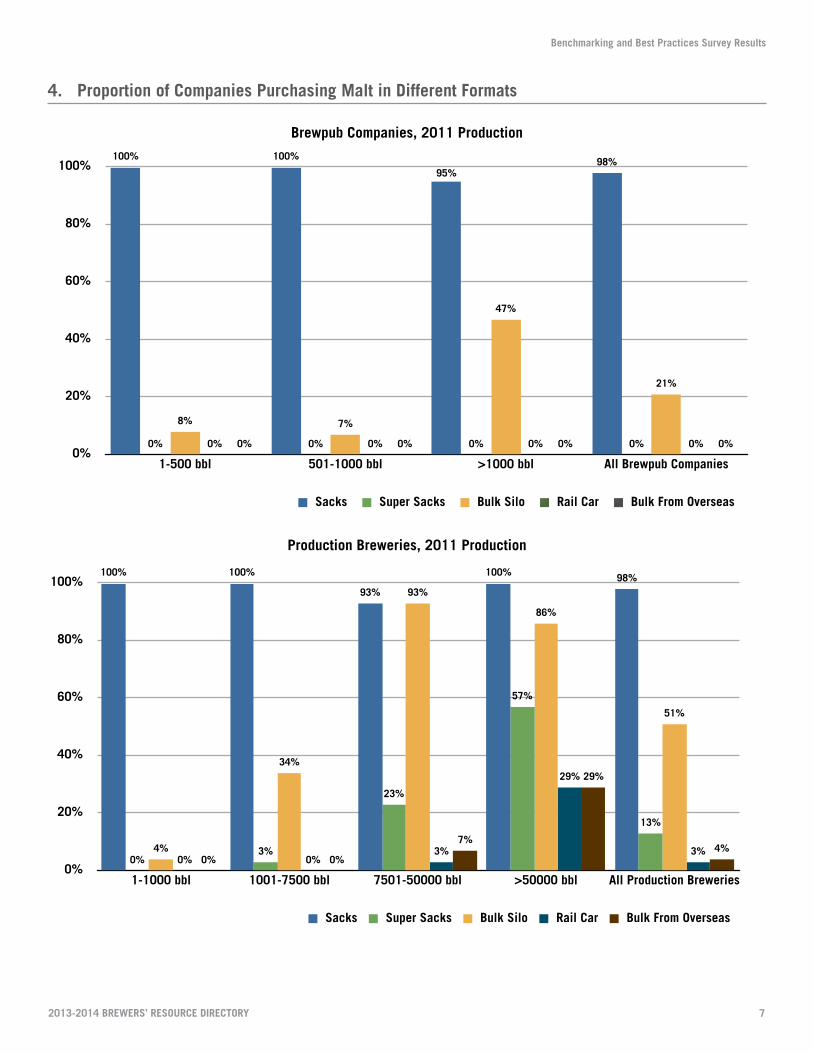
4. Proportion of Companies Purchasing Malt in Different Formats
Brewpub Companies, 2011 Production
0%
20%
40%
60%
80%
100%
1-500 bbl 501-1000 bbl >1000 bbl All Brewpub Companies
0%0%0%0% 0%0%0%0%
21%
47%
7%8%
0%0%0%0%
98%95%
100%100%
Sacks Super Sacks Bulk Silo Rail Car Bulk From Overseas
Production Breweries, 2011 Production
0%
20%
40%
60%
80%
100%
Multiple Brewing Shifts Multiple Packaging Shifts
27%
63%
82%
100%
46%
100%
17%
69%
5%10%
1-1000 bbl 1001-7500 bbl 7501-50000 bbl >50000 bbl All Production Breweries
0%
20%
40%
60%
80%
100%
1-1000 bbl 1001-7500 bbl 7501-50000 bbl >50000 bbl All Production Breweries
4%
29%
7%
0%0%3%
29%
3%0%0%
51%
86%
93%
34%
4%
13%
57%
23%
3%0%
98%100%
93%
100%100%
Sacks Super Sacks Bulk Silo Rail Car Bulk From Overseas
Benchmarking and Best Practices Survey Results
82013-2014 Brewers’ resource Directory
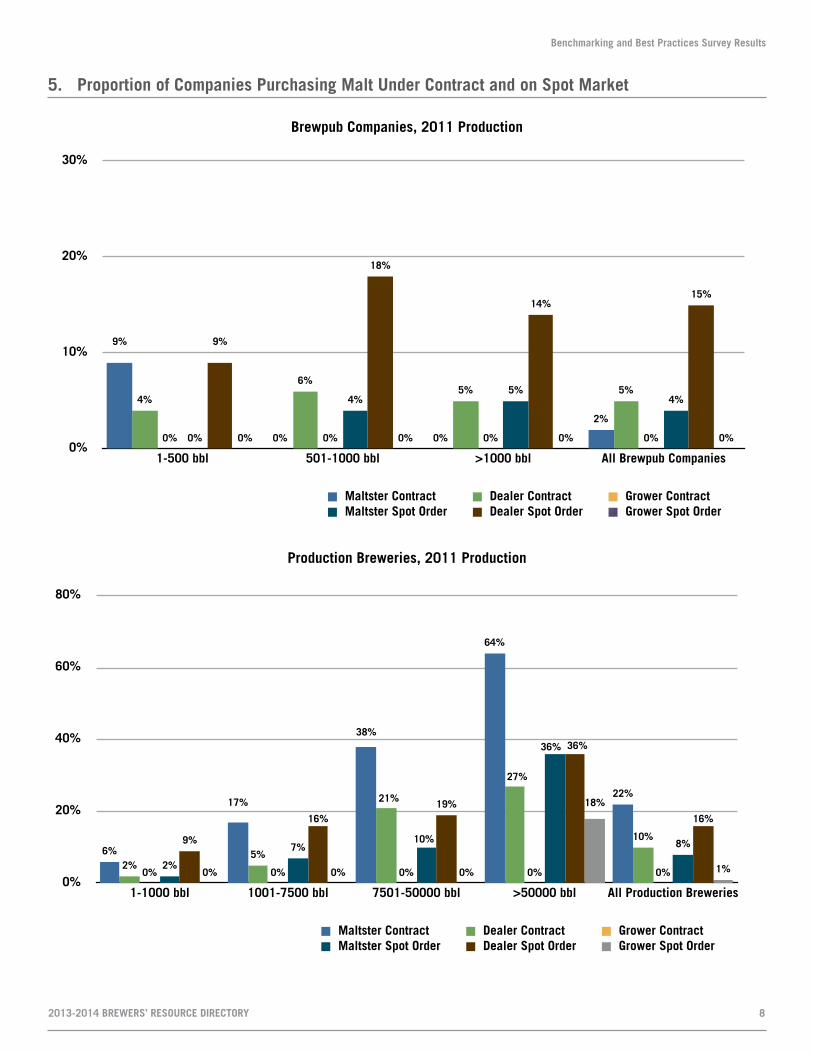
5. Proportion of Companies Purchasing Malt Under Contract and on Spot Market
Brewpub Companies, 2011 Production
0%
10%
20%
30%
1-500 bbl 501-1000 bbl >1000 bbl All Brewpub Companies
0%0%0%0%
15%14%
18%
9%
4%5%
4%
0% 0%0%0%0%
5%5%6%
4%
2%
0%0%
9%
Maltster Contract Dealer Contract Grower ContractMaltster Spot Order Dealer Spot Order Grower Spot Order
Production Breweries, 2011 Production
0%
20%
40%
60%
80%
100%
Multiple Brewing Shifts Multiple Packaging Shifts
27%
63%
82%
100%
46%
100%
17%
69%
5%10%
1-1000 bbl 1001-7500 bbl 7501-50000 bbl >50000 bbl All Production Breweries
0%
20%
40%
60%
80%
1-1000 bbl 1001-7500 bbl 7501-50000 bbl >50000 bbl All Production Breweries
1%
18%
0%0%0%
16%
36%
19%16%
9% 8%
36%
10%7%
2%0%0%0%0%0%
10%
27%
21%
5%2%
22%
64%
38%
17%
6%
Maltster Contract Dealer Contract Grower ContractMaltster Spot Order Dealer Spot Order Grower Spot Order
Benchmarking and Best Practices Survey Results
92013-2014 Brewers’ resource Directory
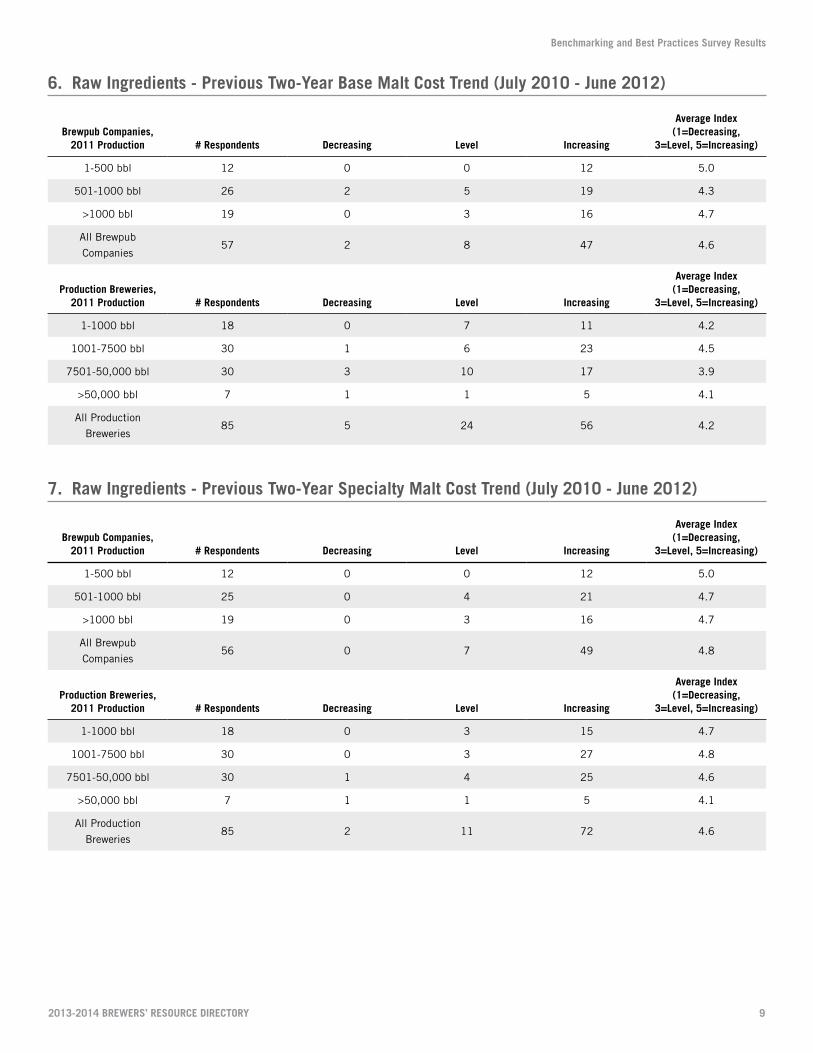
6. Raw ingredients - Previous two-Year Base Malt Cost trend (July 2010 - June 2012)
Brewpub Companies, 2011 Production # Respondents Decreasing level increasing
average index (1=Decreasing,
3=level, 5=increasing)
1-500 bbl 12 0 0 12 5.0
501-1000 bbl 26 2 5 19 4.3
>1000 bbl 19 0 3 16 4.7
All Brewpub
Companies57 2 8 47 4.6
Production Breweries, 2011 Production # Respondents Decreasing level increasing
average index (1=Decreasing,
3=level, 5=increasing)
1-1000 bbl 18 0 7 11 4.2
1001-7500 bbl 30 1 6 23 4.5
7501-50,000 bbl 30 3 10 17 3.9
>50,000 bbl 7 1 1 5 4.1
All Production
Breweries85 5 24 56 4.2
7. Raw ingredients - Previous two-Year Specialty Malt Cost trend (July 2010 - June 2012)
Brewpub Companies, 2011 Production # Respondents Decreasing level increasing
average index (1=Decreasing,
3=level, 5=increasing)
1-500 bbl 12 0 0 12 5.0
501-1000 bbl 25 0 4 21 4.7
>1000 bbl 19 0 3 16 4.7
All Brewpub
Companies56 0 7 49 4.8
Production Breweries, 2011 Production # Respondents Decreasing level increasing
average index (1=Decreasing,
3=level, 5=increasing)
1-1000 bbl 18 0 3 15 4.7
1001-7500 bbl 30 0 3 27 4.8
7501-50,000 bbl 30 1 4 25 4.6
>50,000 bbl 7 1 1 5 4.1
All Production
Breweries85 2 11 72 4.6
Benchmarking and Best Practices Survey Results
102013-2014 Brewers’ resource Directory
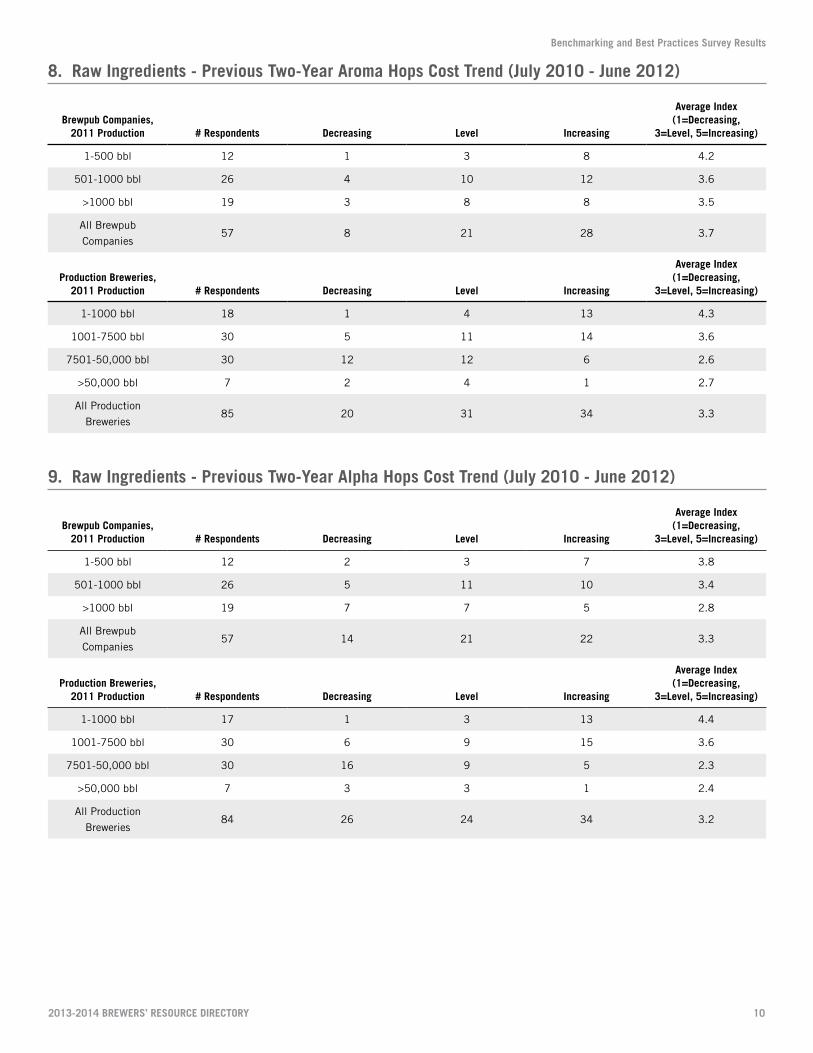
8. Raw ingredients - Previous two-Year aroma Hops Cost trend (July 2010 - June 2012)
Brewpub Companies, 2011 Production # Respondents Decreasing level increasing
average index (1=Decreasing,
3=level, 5=increasing)
1-500 bbl 12 1 3 8 4.2
501-1000 bbl 26 4 10 12 3.6
>1000 bbl 19 3 8 8 3.5
All Brewpub
Companies57 8 21 28 3.7
Production Breweries, 2011 Production # Respondents Decreasing level increasing
average index (1=Decreasing,
3=level, 5=increasing)
1-1000 bbl 18 1 4 13 4.3
1001-7500 bbl 30 5 11 14 3.6
7501-50,000 bbl 30 12 12 6 2.6
>50,000 bbl 7 2 4 1 2.7
All Production
Breweries85 20 31 34 3.3
9. Raw ingredients - Previous two-Year alpha Hops Cost trend (July 2010 - June 2012)
Brewpub Companies, 2011 Production # Respondents Decreasing level increasing
average index (1=Decreasing,
3=level, 5=increasing)
1-500 bbl 12 2 3 7 3.8
501-1000 bbl 26 5 11 10 3.4
>1000 bbl 19 7 7 5 2.8
All Brewpub
Companies57 14 21 22 3.3
Production Breweries, 2011 Production # Respondents Decreasing level increasing
average index (1=Decreasing,
3=level, 5=increasing)
1-1000 bbl 17 1 3 13 4.4
1001-7500 bbl 30 6 9 15 3.6
7501-50,000 bbl 30 16 9 5 2.3
>50,000 bbl 7 3 3 1 2.4
All Production
Breweries84 26 24 34 3.2
Benchmarking and Best Practices Survey Results
112013-2014 Brewers’ resource Directory
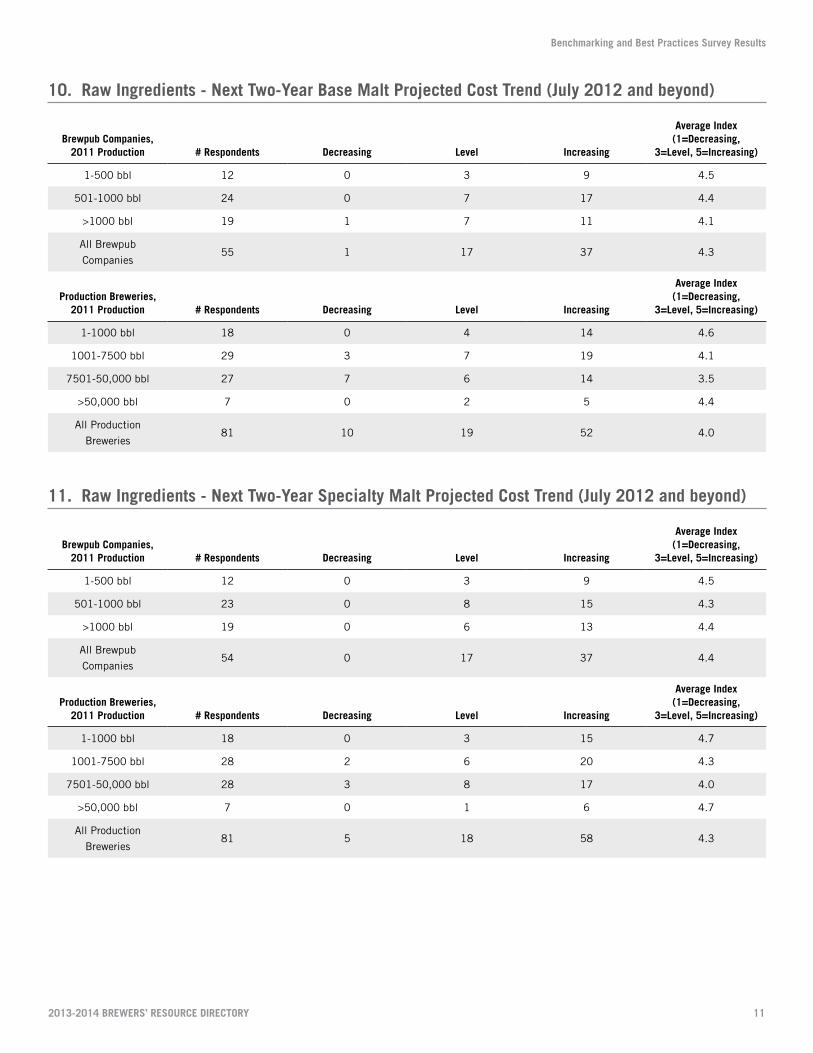
10. Raw ingredients - Next two-Year Base Malt Projected Cost trend (July 2012 and beyond)
Brewpub Companies, 2011 Production # Respondents Decreasing level increasing
average index (1=Decreasing,
3=level, 5=increasing)
1-500 bbl 12 0 3 9 4.5
501-1000 bbl 24 0 7 17 4.4
>1000 bbl 19 1 7 11 4.1
All Brewpub
Companies55 1 17 37 4.3
Production Breweries, 2011 Production # Respondents Decreasing level increasing
average index (1=Decreasing,
3=level, 5=increasing)
1-1000 bbl 18 0 4 14 4.6
1001-7500 bbl 29 3 7 19 4.1
7501-50,000 bbl 27 7 6 14 3.5
>50,000 bbl 7 0 2 5 4.4
All Production
Breweries81 10 19 52 4.0
11. Raw ingredients - Next two-Year Specialty Malt Projected Cost trend (July 2012 and beyond)
Brewpub Companies, 2011 Production # Respondents Decreasing level increasing
average index (1=Decreasing,
3=level, 5=increasing)
1-500 bbl 12 0 3 9 4.5
501-1000 bbl 23 0 8 15 4.3
>1000 bbl 19 0 6 13 4.4
All Brewpub
Companies54 0 17 37 4.4
Production Breweries, 2011 Production # Respondents Decreasing level increasing
average index (1=Decreasing,
3=level, 5=increasing)
1-1000 bbl 18 0 3 15 4.7
1001-7500 bbl 28 2 6 20 4.3
7501-50,000 bbl 28 3 8 17 4.0
>50,000 bbl 7 0 1 6 4.7
All Production
Breweries81 5 18 58 4.3
Benchmarking and Best Practices Survey Results
12
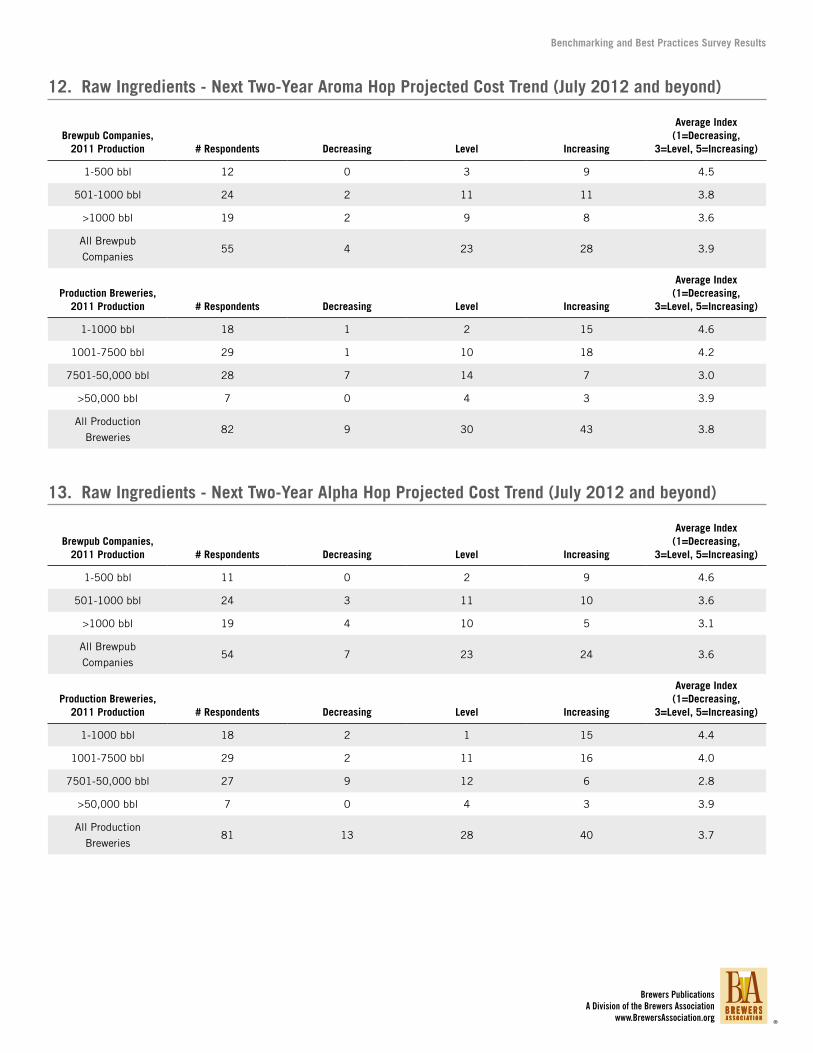
12. Raw ingredients - Next two-Year aroma Hop Projected Cost trend (July 2012 and beyond)
Brewpub Companies, 2011 Production # Respondents Decreasing level increasing
average index (1=Decreasing,
3=level, 5=increasing)
1-500 bbl 12 0 3 9 4.5
501-1000 bbl 24 2 11 11 3.8
>1000 bbl 19 2 9 8 3.6
All Brewpub
Companies55 4 23 28 3.9
Production Breweries, 2011 Production # Respondents Decreasing level increasing
average index (1=Decreasing,
3=level, 5=increasing)
1-1000 bbl 18 1 2 15 4.6
1001-7500 bbl 29 1 10 18 4.2
7501-50,000 bbl 28 7 14 7 3.0
>50,000 bbl 7 0 4 3 3.9
All Production
Breweries82 9 30 43 3.8
13. Raw ingredients - Next two-Year alpha Hop Projected Cost trend (July 2012 and beyond)
Brewpub Companies, 2011 Production # Respondents Decreasing level increasing
average index (1=Decreasing,
3=level, 5=increasing)
1-500 bbl 11 0 2 9 4.6
501-1000 bbl 24 3 11 10 3.6
>1000 bbl 19 4 10 5 3.1
All Brewpub
Companies54 7 23 24 3.6
Production Breweries, 2011 Production # Respondents Decreasing level increasing
average index (1=Decreasing,
3=level, 5=increasing)
1-1000 bbl 18 2 1 15 4.4
1001-7500 bbl 29 2 11 16 4.0
7501-50,000 bbl 27 9 12 6 2.8
>50,000 bbl 7 0 4 3 3.9
All Production
Breweries81 13 28 40 3.7
Brewers PublicationsA Division of the Brewers Association
www.BrewersAssociation.org ®