
Numerical Modelling of Mining Subsidence Upsidence and Valley Closure Using UDEC

Benchmark testing of numerical approachesfor modelling the influence of undercut depthon caving, fracture initiation and subsidenceangles associated with block cave mining
K.-S. Woo1,2*, E. Eberhardt2, D. Elmo3, D. Stead4 and P. K. Kaiser5
This paper reports the findings from a benchmark study testing several numerical methods, with a focus
on the influence of undercut depth on block caving-induced surface deformation. A comparison is drawn
between continuum v. discontinuum treatments of the modelled geology. Results were evaluated with
respect to different simulated levels of ground disturbance, from complete collapse to small-strain
subsidence. The results show that for a given extraction volume, the extent of ground collapse at surface
decreases as undercut depth increases. The presence of sub-vertical faults was seen to limit the extent
of the modelled caving zones. In contrast, the extent of small-strain surface subsidence was seen to
increase with increasing undercut depth. The faults in this case did not have the same limiting effect.
Overall, the findings emphasise the importance of balancing model simplification against the need to
incorporate more complex and computationally demanding representations of the rock mass structure.
Keywords: Block caving, Caving-induced subsidence, Numerical modelling, Continuum, Discontinuum, Brittle fracture, 2-D v. 3-D
This paper is part of a special issue on Block Caving
IntroductionComplexity in geology and brittle tectonics (jointing,faulting, etc.) make rock masses a challenging material torepresent mathematically in numerical models. First,numerical methods vary widely in their mathematicalformulations, such that a capability favourable for onetype of engineering application may be a disadvantage foranother. Second, a balance must be struck between theappropriate level of detail and the computing time thatwill be required to perform a large number of simulations;the scale of the problem being modelled may besubstantially larger than the geological features that canbe explicitly resolved by the model. Consequently, somenumerical methods (e.g. finite element, finite difference)provide computational efficiencies, especially in 3-D, bytreating the problem domain as a continuum. Othermethods allow the rock mass to be treated as adiscontinuum (e.g. distinct element, discrete element)where the presence of geological structures are explicitlymodelled together with their influence on the rock massresponse and failure kinematics. However, this added
complexity comes at the expense of more computation-ally demanding models.
Both approaches have been applied to the modelling of
block caving and caving-induced subsidence. Continuum
methods have been favoured as a means to accommodate
large 2-D and 3-D block caving models and to perform
sensitivity analyses where a large number of model runs
are required (Sainsbury, 2012). In other studies, disconti-
nuum methods have been favoured in recognition of
the important role discontinuities play with respect to in
situ fragmentation and failure kinematics during caving
(Albrecht et al., 2010). An additional consideration is the
importance of brittle fracturing between non-persistent
joints in the caving process (i.e., primary fragmentation).
This imposes additional computational challenges as it
requires a hybrid approach that integrates continuum-
based fracture mechanics and discontinuum-based con-
tact detection and interaction principles, such as those
available in the finite-/discrete-element (FDEM) approach
(Munjiza, 2004; Owen et al., 2004). Advantages include a
better description of the physical processes involved and a
more realistic representation of the heterogeneities and
anisotropy encountered in natural jointing (Vyazmensky
et al., 2010; Elmo and Stead, 2010); however, this is
attained at the expense of increased computational effort.
Detailed summaries of these numerical methods andtheir application to different geotechnical problems arediscussed in Stead et al. (2006) and Hudson and Feng(2010). In this study, benchmark testing of several differentnumerical techniques was carried out to investigate their
1AMC Consultants (Canada) Ltd, Vancouver, Canada2Geological Engineering – EOAS, University of British Columbia,Vancouver, Canada3Mining Engineering, University of British Columbia, Vancouver, Canada4Resource Geotechnics, Simon Fraser University, Burnaby, Canada5RTC-UMC, Centre for Excellence in Mining Innovation, Sudbury, Canada
*Corresponding author, email [email protected]; [email protected]
� 2014 Institute of Materials, Minerals and Mining and The AusIMMPublished by Maney on behalf of the Institute and The AusIMMReceived 26 August 2013; accepted 22 April 2014DOI 10.1179/1743286314Y.0000000063 Mining Technology 2014 VOL 123 NO 3128

capabilities and limitations with respect to modelling blockcaving subsidence for a range of undercut depths withadded consideration of the influence of structural geology.The comparison carried out here focuses on a conceptualproblem geometry involving a porphyry copper typedeposit, incorporating boundary faults (relative to the orebody and block being caved), several different lithologiesand varying rock mass properties. The undercut depthsmodelled vary from 500 to 2000 m below surface inincrements of 500 m using the 2-D continuum codePhase2, the 3-D continuum code FLAC3D, the 2-Ddiscontinuum code Universal Distinct Element Code(UDEC) and the 2-D hybrid FDEM brittle fracture codeELFEN. The modelling scenario selected was based onrecent trend towards larger block heights (.200 m), largerundercut footprints (.100 000 m2) and deeper undercuts(.600 m), compared to historical data (Fig. 1; Woo et al.,2013). For example, with respect to deep undercuts, theResolution project in Arizona, USA, is proposing miningdepths approaching 2000 m, a depth that will certainlychallenge the industry’s collective experience.
Benchmark study
Model scenario and numerical modelling codesusedFour different numerical modelling codes commonly usedin geotechnical practice were compared as part of thisbenchmark study: Phase2, FLAC3D, UDEC and ELFEN(Rocscience, 2009; Itasca Consulting Group, 2009, 2010;Rockfield, 2009, respectively). Each was applied to thesame conceptual scenario specified by the Centre forExcellence in Mining Innovation’s Rio Tinto Centre forUnderground Mine Construction (RTC-UMC) as part of alarger study on modelling approaches (Bullock et al., 2012).The scenario involves a deep block caving operation in ageologically complex 3-D setting, involving a porphyry-type deposit to be mined in three 500 m wide panels (Atowards C in Fig. 2). The ore body and surrounding hostrock incorporate several faulted lithologies, with the faultslocated beside the ends of the undercut. For 2-D modelling,section A–B in Fig. 2 was used.
Figure 3 shows the corresponding model geometryused for the 2-D continuum simulations using Phase2.Phase2 is a 2-D finite-element code with the ability toinclude small-strain joint elements. The external limits ofthe model were determined based on preliminary elasticmodelling, which suggested a 2-D model 10 500 m inlength and 4200 m in depth would be sufficient to coverthe full lateral extent of measurable surface subsidence.Phase2 models with and without joint elements werecompared to determine the influence of small-strain jointmovements on the modelled surface subsidence. Thejoint elements were introduced to the continuum meshusing a discrete fracture network (DFN) model com-prised of two orthogonal joint sets of variable spacingand persistence dipping at 0 and 90u (Fig. 3). Thisorientation was selected to minimise the degree ofasymmetry due to the joint sets and allow a more directcomparison between the different modelling methods.Mine data (Woo et al., 2013) and numerical modelling(Vyazmensky et al., 2010), both show that caving-induced subsidence incorporates significant asymmetryin the ground deformation profile due to the presence ofdipping geological structures.
The continuum modelling was extended to 3-D usingthe finite-difference code FLAC3D (Fig. 4). As a 3-Dcontinuum-based tool, FLAC3D does not easily allowthe introduction of faults and joints into the model andrequires each discrete feature to be manually specifiedthrough matching interfaces thereby entailing significantpre-processing preparation time. In this case, only thelarge bounding faults were inserted into the FLAC3Dmodel, with the added simplification of modelling theseas vertical instead of steeply dipping.
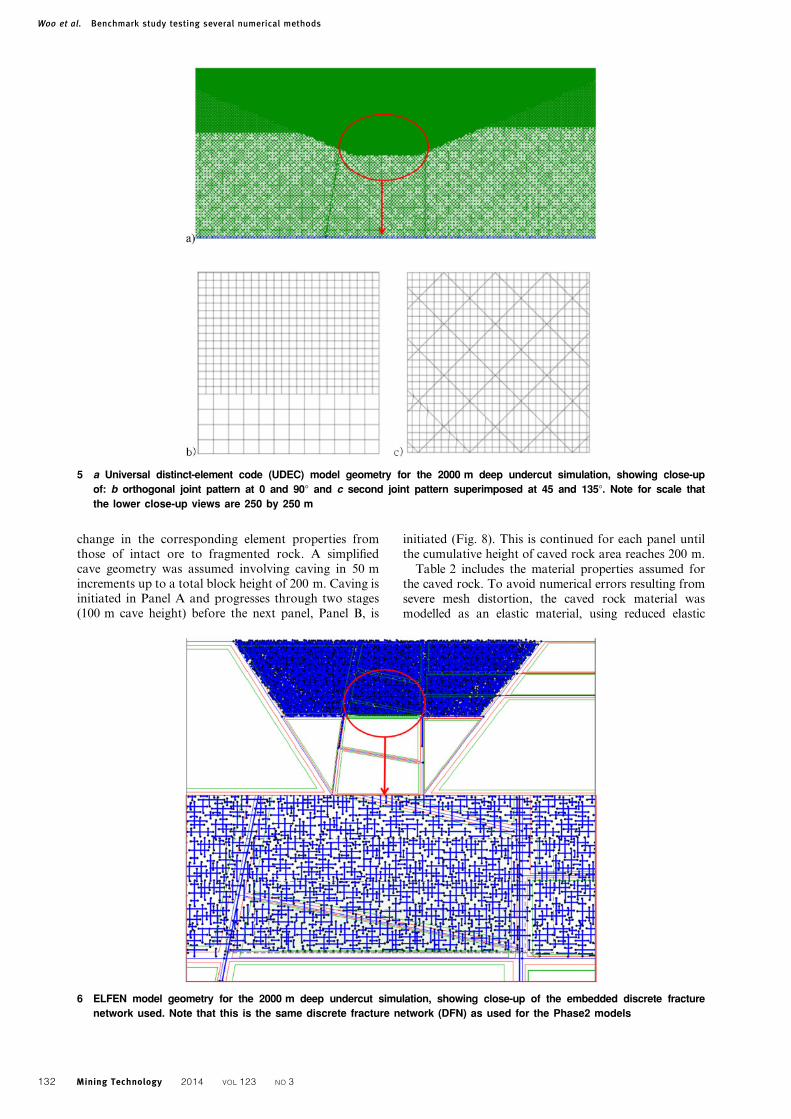
The discontinuum-based modelling was carried outusing the 2-D UDEC, which models the problemdomain as an assemblage of interacting deformableblocks bounded by joint contacts that are free to open,close or slip in response to excavation or caving.Figure 5 shows the different simple joint patterns used.These include the same 0 and 90u joint pattern used inPhase2 (Fig. 5b) and a second pattern superimposedwith joints at 45 and 135u (Fig. 5c) to increase thedegrees of freedom for joint slip and vertical subsidence.A joint spacing of 10 m was used in the area of interestabove the undercut and simulated cave (Fig. 5a).
1 Breakdown of block heights, undercut areas and under-
cut depths associated with historic and current block/
panel caving operations. After Woo et al. (2013)
Woo et al. Benchmark study testing several numerical methods
Mining Technology 2014 VOL 123 NO 3 129

Lastly, the hybrid modelling was carried out using the
FDEM brittle fracture code ELFEN. The same DFN used
for the Phase2 model was embedded into the continuum
problem domain in the 2-D ELFEN model (Fig. 6). The
model was developed to explicitly model cave propagationthrough brittle fracturing in response to ore extraction.
Rock mass properties and in situ stressDepth-dependent rock mass properties were used basedon the UCS, mi and GSI values reported in Table 1.These inputs were based on typical values specified by theRTC-UMC (Bullock et al., 2012). Hoek et al.’s (2002)empirical relationships based on the Hoek–Brown failure
2 Conceptual cave mining geometry used for benchmark study. After Bullock et al. (2012)
3 Phase2 model geometry for the 2000 m deep undercut simulation, showing the variable orientation, spacing and per-
sistence of joint elements introduced above the undercut. For scale, the model is 10 500 m in length and 4200 m in
depth
Woo et al. Benchmark study testing several numerical methods
130 Mining Technology 2014 VOL 123 NO 3

criterion were used to derive the rock mass scaledproperties. As not all codes have fully implemented aHoek–Brown constitutive model, the Hoek–Brownvalues were converted to Mohr–Coulomb by fitting anaverage linear Mohr–Coulomb relationship to the non-linear Hoek–Brown envelope over the appropriate rangeof confining stresses (Table 2). Tensile strength (Trm) wasestimated assuming a 25% tensile cutoff applied to thetheoretical Mohr–Coulomb value. The rock mass defor-mation modulus, Erm, was calculated using Hoek andDiederichs’ (2006) empirical relationship. A fractureenergy release (Gf) value of 43 J m22 was applied forbrittle fracturing in the ELFEN modelling.
Contact properties for the joint elements and discreteelements were assigned assuming a linear Mohr–Coulomb slip criterion. The north and south faults,the DFN joints and in the case of ELFEN any newfractures generated during the simulation of caving,were given the same values: a joint cohesion of zero anda joint friction angle of 30u. The mechanical contactforces that govern the interactions between discreteelements in UDEC and ELFEN can be loosely definedas the forces that are required to prevent blocks frominterpenetrating. A normal stiffness of 4 GPa m21 andshear stiffness of 0?4 GPa m21 were assumed. Thevalues reported in Table 2 were applied uniformly to
the Phase2, UDEC and ELFEN models. The rock massproperties were reduced by 75% for the FLAC3Dmodels to account for the larger mesh size.
The initial stress conditions were implemented asspecified for the Centre for Excellence in MiningInnovation (CEMI) RTC-UMC benchmarking exercise(Fig. 7; Bullock et al., 2012). The vertical stress isdefined as gravitational loading with a rock unit weightof 27 kN m23. The maximum horizontal stress (sHmax)is assumed to be 1?9 times the vertical stress and isaligned north–south. The minimum horizontal stress(sHmin), aligned east–west, is assumed to be 1?2 timesthe vertical stress.
Simulation of draw and cavingThe simulation of cave propagation is a key considera-tion given its direct relationship to the caving-induceddeformations being modelled. For the continuummethods, caving was implemented through an implicitapproach where the geometry of the cave is built into themodel (as opposed to explicitly modelling the cavingprocess). This is a key limitation of applying continuumtechniques to block caving problems. The implicitapproach employed in the Phase2 and FLAC3Dassumes a cave geometry at several different points intime in overall cave development and an incremental
4 FLAC3D model geometry: a 3-D perspective, with semi-transparency to show projection of the bounding faults through
the model (dark blue) and b north and south cross-section showing the fault interfaces in dark blue
Woo et al. Benchmark study testing several numerical methods
Mining Technology 2014 VOL 123 NO 3 131
change in the corresponding element properties fromthose of intact ore to fragmented rock. A simplifiedcave geometry was assumed involving caving in 50 mincrements up to a total block height of 200 m. Caving isinitiated in Panel A and progresses through two stages(100 m cave height) before the next panel, Panel B, is
initiated (Fig. 8). This is continued for each panel untilthe cumulative height of caved rock area reaches 200 m.
Table 2 includes the material properties assumed forthe caved rock. To avoid numerical errors resulting fromsevere mesh distortion, the caved rock material wasmodelled as an elastic material, using reduced elastic
5 a Universal distinct-element code (UDEC) model geometry for the 2000 m deep undercut simulation, showing close-up
of: b orthogonal joint pattern at 0 and 90u and c second joint pattern superimposed at 45 and 135u. Note for scale that
the lower close-up views are 250 by 250 m
6 ELFEN model geometry for the 2000 m deep undercut simulation, showing close-up of the embedded discrete fracture
network used. Note that this is the same discrete fracture network (DFN) as used for the Phase2 models
Woo et al. Benchmark study testing several numerical methods
132 Mining Technology 2014 VOL 123 NO 3
properties to account for the reduced deformationmodulus that would be expected for caved rock, as wellas allowances for the presence of a small air gap. Thisprocedure requires redefinition of the initial stresses withinthe caved material to those corresponding to the self-weight of the caved material and not the locked in tectonicstresses initially prescribed for the ore and host rocks.
Simulation of the propagating cave in UDEC wascarried out using the same implicit method and miningsequence. The key difference in this case was that thediscontinuum treatment of the problem domain pro-vided the added freedom for blocks to move along thejoint interfaces (i.e. shear), enabling large displacementsto develop in the model.
In ELFEN, modelling of the draw and caving processwas carried out explicitly following procedures devel-oped by Elmo et al. (2010). The caving algorithmremoves all meshed elements whose centroids arelocated within a specified region, in this case corre-sponding to the undercut/production level. An iterativeprocess is used such that the removal of elements isrepeated continuously at a given numerical time step inorder to return the specified draw rate (Fig. 9). No hangups at the extraction level were simulated; an ideal drawscenario was assumed in the model.
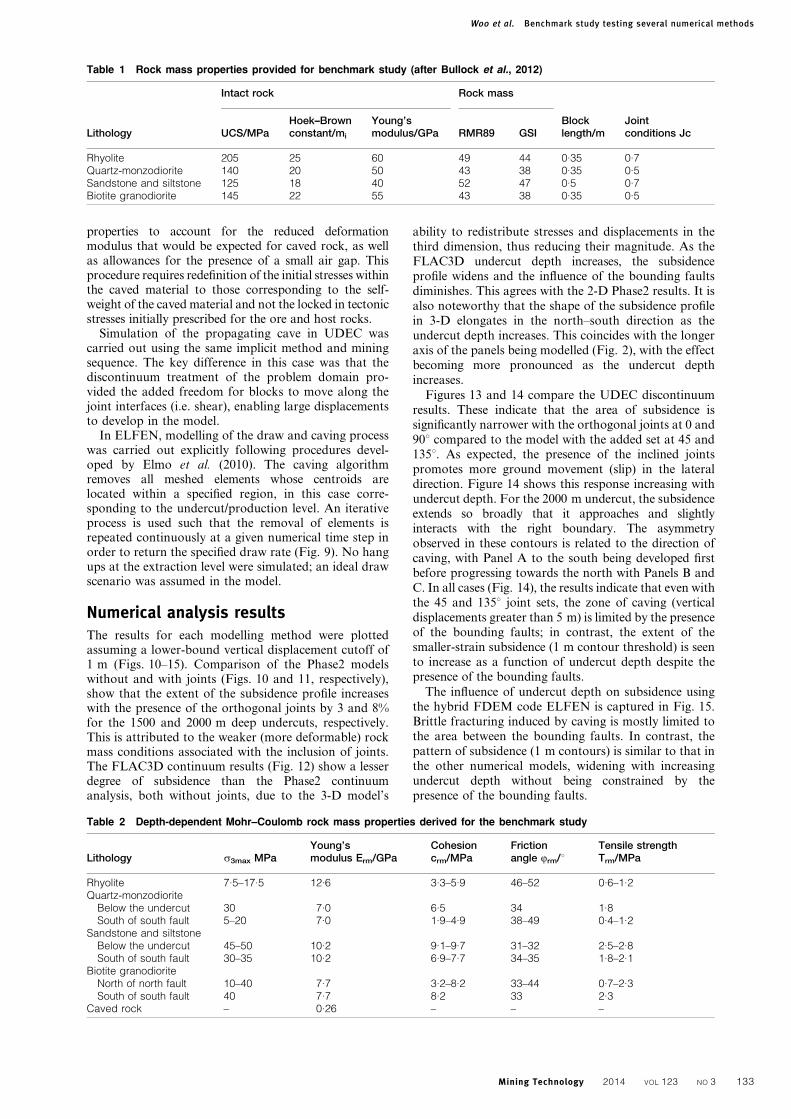
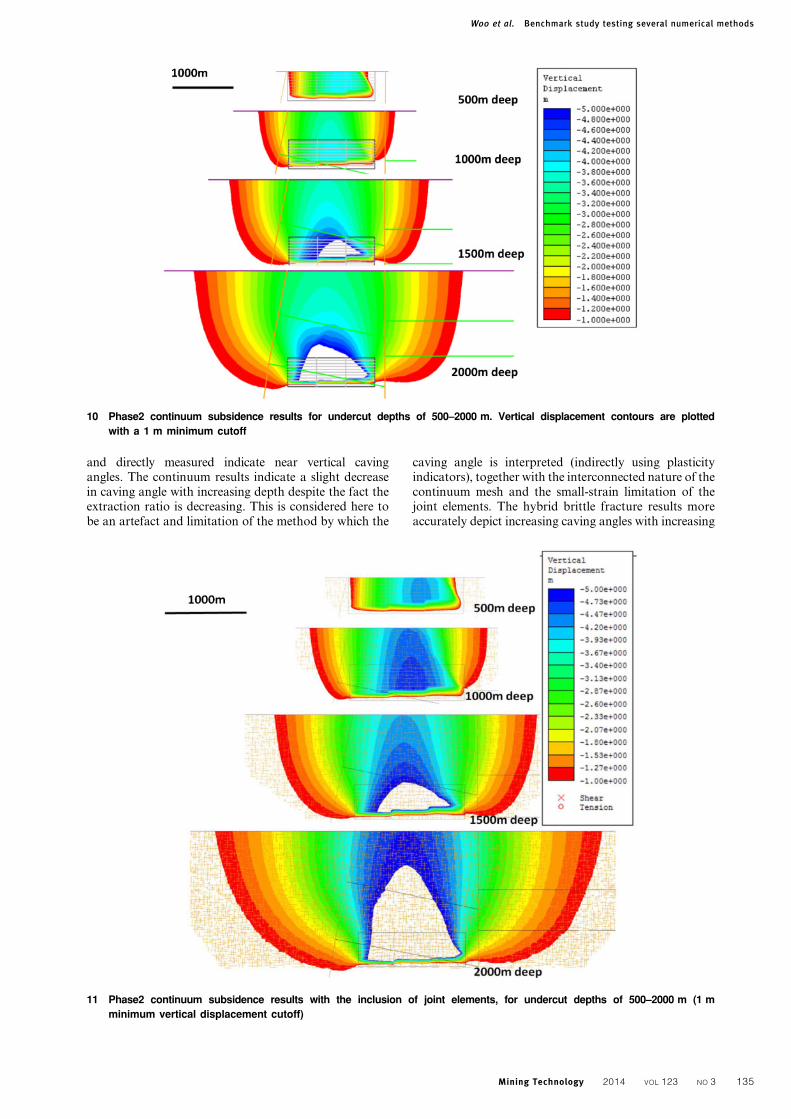
Numerical analysis resultsThe results for each modelling method were plottedassuming a lower-bound vertical displacement cutoff of1 m (Figs. 10–15). Comparison of the Phase2 modelswithout and with joints (Figs. 10 and 11, respectively),show that the extent of the subsidence profile increaseswith the presence of the orthogonal joints by 3 and 8%for the 1500 and 2000 m deep undercuts, respectively.This is attributed to the weaker (more deformable) rockmass conditions associated with the inclusion of joints.The FLAC3D continuum results (Fig. 12) show a lesserdegree of subsidence than the Phase2 continuumanalysis, both without joints, due to the 3-D model’s
ability to redistribute stresses and displacements in thethird dimension, thus reducing their magnitude. As theFLAC3D undercut depth increases, the subsidenceprofile widens and the influence of the bounding faultsdiminishes. This agrees with the 2-D Phase2 results. It isalso noteworthy that the shape of the subsidence profilein 3-D elongates in the north–south direction as theundercut depth increases. This coincides with the longeraxis of the panels being modelled (Fig. 2), with the effectbecoming more pronounced as the undercut depthincreases.
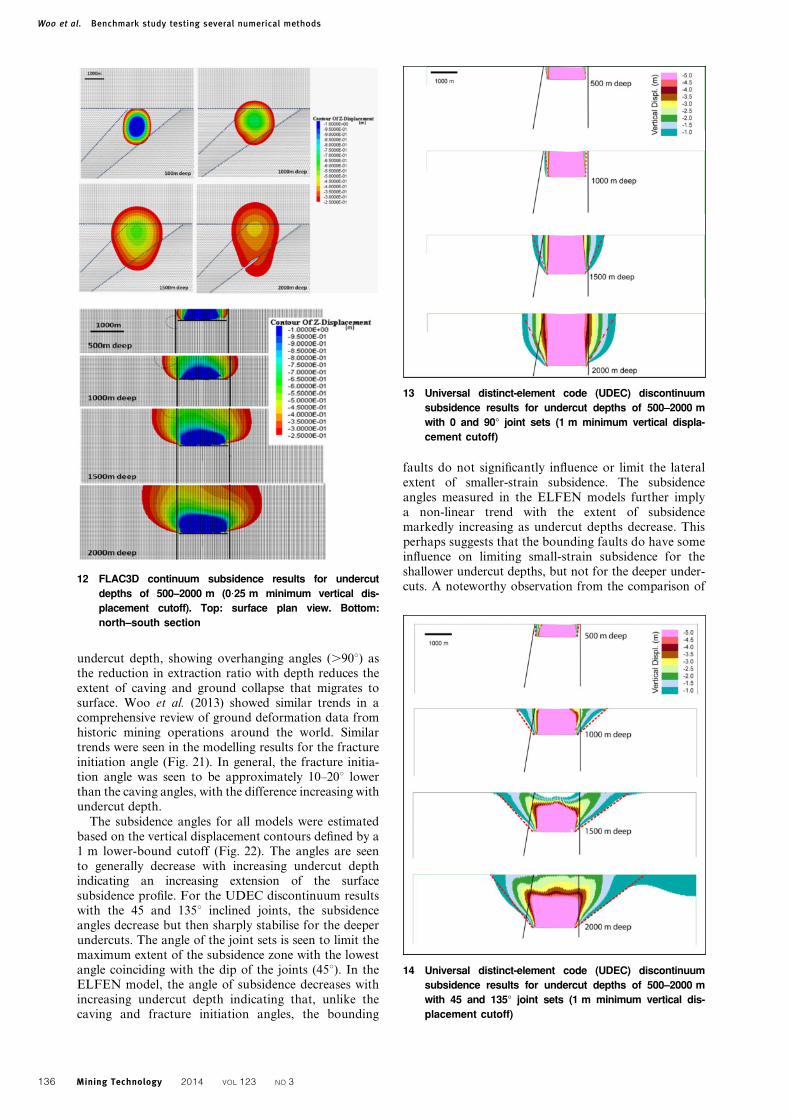
Figures 13 and 14 compare the UDEC discontinuumresults. These indicate that the area of subsidence issignificantly narrower with the orthogonal joints at 0 and90u compared to the model with the added set at 45 and135u. As expected, the presence of the inclined jointspromotes more ground movement (slip) in the lateraldirection. Figure 14 shows this response increasing withundercut depth. For the 2000 m undercut, the subsidenceextends so broadly that it approaches and slightlyinteracts with the right boundary. The asymmetryobserved in these contours is related to the direction ofcaving, with Panel A to the south being developed firstbefore progressing towards the north with Panels B andC. In all cases (Fig. 14), the results indicate that even withthe 45 and 135u joint sets, the zone of caving (verticaldisplacements greater than 5 m) is limited by the presenceof the bounding faults; in contrast, the extent of thesmaller-strain subsidence (1 m contour threshold) is seento increase as a function of undercut depth despite thepresence of the bounding faults.
The influence of undercut depth on subsidence usingthe hybrid FDEM code ELFEN is captured in Fig. 15.Brittle fracturing induced by caving is mostly limited tothe area between the bounding faults. In contrast, thepattern of subsidence (1 m contours) is similar to that inthe other numerical models, widening with increasingundercut depth without being constrained by thepresence of the bounding faults.
Table 1 Rock mass properties provided for benchmark study (after Bullock et al., 2012)
Lithology
Intact rock Rock mass
Blocklength/m
Jointconditions JcUCS/MPa
Hoek–Brownconstant/mi
Young’smodulus/GPa RMR89 GSI
Rhyolite 205 25 60 49 44 0.35 0.7Quartz-monzodiorite 140 20 50 43 38 0.35 0.5Sandstone and siltstone 125 18 40 52 47 0.5 0.7Biotite granodiorite 145 22 55 43 38 0.35 0.5
Table 2 Depth-dependent Mohr–Coulomb rock mass properties derived for the benchmark study
Lithology s3max MPaYoung’smodulus Erm/GPa
Cohesioncrm/MPa
Frictionangle Qrm/u
Tensile strengthTrm/MPa
Rhyolite 7.5–17.5 12.6 3.3–5.9 46–52 0.6–1.2Quartz-monzodiorite
Below the undercut 30 7.0 6.5 34 1.8South of south fault 5–20 7.0 1.9–4.9 38–49 0.4–1.2
Sandstone and siltstoneBelow the undercut 45–50 10.2 9.1–9.7 31–32 2.5–2.8South of south fault 30–35 10.2 6.9–7.7 34–35 1.8–2.1
Biotite granodioriteNorth of north fault 10–40 7.7 3.2–8.2 33–44 0.7–2.3South of south fault 40 7.7 8.2 33 2.3
Caved rock – 0.26 – – –
Woo et al. Benchmark study testing several numerical methods
Mining Technology 2014 VOL 123 NO 3 133

The key consideration in comparing the results forthe different undercut depths is that the ‘volume’ ofexcavated ore (or block height) in each model is thesame. This means a decreasing extraction ratio withincreasing undercut depth. In the case of the 500 mdeep undercut, 40% of the rock column above theundercut is extracted. For the 2000 m deep undercut,only 10% of the rock column is extracted.Consequently, the modelling results for the 500 mdeep undercut clearly show the importance of incorpor-ating a ‘realistic’ fracture network in the analysis.Comparison of the subsidence profiles clearly indicatesthat the subsidence zone increases as a function ofincreasing undercut depth. The zone of caving remainswithin the bounding faults and its extent actuallydecreases with increasing undercut depth (i.e. decreas-ing extraction ratio).
Discussion: caving, fracture initiationand subsidence anglesWoo et al. (2013) discuss the importance of macro- andmicro-surface deformations related to block caving.Using the definitions of van As et al. (2003), these can bequantified as angles measured from the outer boundaryof the undercut to the ground surface and the farthestextent of caving (complete ground collapse), fractureinitiation (opening of tension cracks and scarps) andsubsidence (small-strain ground deformations that canstill adversely impact strain-sensitive critical infrastruc-ture). These are depicted in Fig. 16.
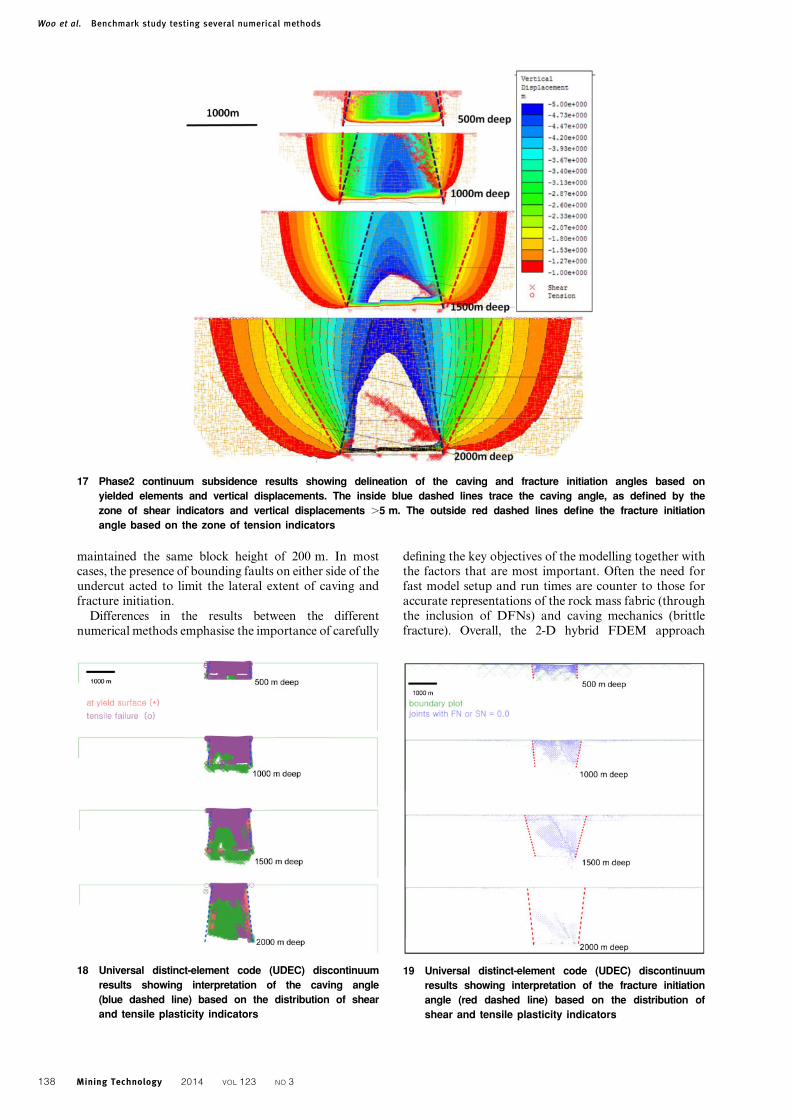
A key strength of the hybrid FDEM brittle fractureapproach (ELFEN) is that the model output (Fig. 15)
allows for direct delineation of the caving, fractureinitiation and subsidence angles. For the continuumresults (e.g. Phase2), the caving and fracture initiationangles were estimated based on the distribution of yieldedelements and vertical displacements (Fig. 17). Thefracture initiation angle was correlated to tensile yieldindicators. For the discontinuum results (e.g. UDEC), thecaving angles were similarly interpreted based on thedistribution of shear and tensile yield indicators (Fig. 18).However, the explicit representation of discontinuities inthe model allowed the fracture initiation angle to bedirectly measured based on the extent of joints on surfaceshowing significant opening or slip (Fig. 19). The UDECresults show a pattern of decreasing fracture initiationangles with undercut depth as fracturing/slip extends tothe bounding faults, until the undercut reaches 2000 mdepth where the reduced extraction ratio results in adiminished extent of fracturing on surface.
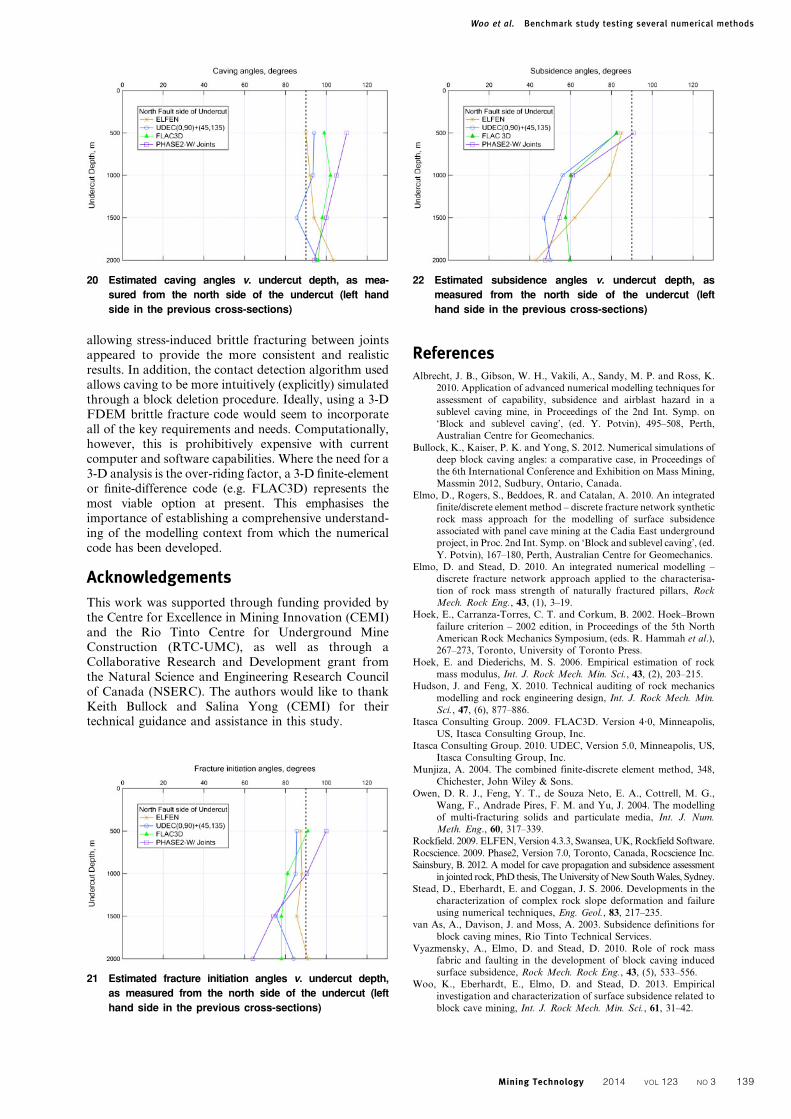
Figure 20 compares the caving angles derived from the2-D continuum (Phase2), 3-D continuum (FLAC3D),discontinuum (UDEC) and hybrid brittle fracture(ELFEN) models. In general, the caving angles indirectly
7 In situ stress conditions used for benchmark testing:
SHmax is north–south and Shmin is east–west. After
Bullock et al. (2012)
8 Undercut and draw sequence used for Phase2,
FLAC3D and universal distinct-element code (UDEC)
models
9 Block deletion method used to simulate draw for
ELFEN modelling
Woo et al. Benchmark study testing several numerical methods
134 Mining Technology 2014 VOL 123 NO 3
and directly measured indicate near vertical cavingangles. The continuum results indicate a slight decreasein caving angle with increasing depth despite the fact theextraction ratio is decreasing. This is considered here tobe an artefact and limitation of the method by which the
caving angle is interpreted (indirectly using plasticityindicators), together with the interconnected nature of thecontinuum mesh and the small-strain limitation of thejoint elements. The hybrid brittle fracture results moreaccurately depict increasing caving angles with increasing
10 Phase2 continuum subsidence results for undercut depths of 500–2000 m. Vertical displacement contours are plotted
with a 1 m minimum cutoff
11 Phase2 continuum subsidence results with the inclusion of joint elements, for undercut depths of 500–2000 m (1 m
minimum vertical displacement cutoff)
Woo et al. Benchmark study testing several numerical methods
Mining Technology 2014 VOL 123 NO 3 135
undercut depth, showing overhanging angles (.90u) asthe reduction in extraction ratio with depth reduces theextent of caving and ground collapse that migrates tosurface. Woo et al. (2013) showed similar trends in acomprehensive review of ground deformation data fromhistoric mining operations around the world. Similartrends were seen in the modelling results for the fractureinitiation angle (Fig. 21). In general, the fracture initia-tion angle was seen to be approximately 10–20u lowerthan the caving angles, with the difference increasing withundercut depth.
The subsidence angles for all models were estimatedbased on the vertical displacement contours defined by a1 m lower-bound cutoff (Fig. 22). The angles are seento generally decrease with increasing undercut depthindicating an increasing extension of the surfacesubsidence profile. For the UDEC discontinuum resultswith the 45 and 135u inclined joints, the subsidenceangles decrease but then sharply stabilise for the deeperundercuts. The angle of the joint sets is seen to limit themaximum extent of the subsidence zone with the lowestangle coinciding with the dip of the joints (45u). In theELFEN model, the angle of subsidence decreases withincreasing undercut depth indicating that, unlike thecaving and fracture initiation angles, the bounding
faults do not significantly influence or limit the lateralextent of smaller-strain subsidence. The subsidenceangles measured in the ELFEN models further implya non-linear trend with the extent of subsidencemarkedly increasing as undercut depths decrease. Thisperhaps suggests that the bounding faults do have someinfluence on limiting small-strain subsidence for theshallower undercut depths, but not for the deeper under-cuts. A noteworthy observation from the comparison of
12 FLAC3D continuum subsidence results for undercut
depths of 500–2000 m (0?25 m minimum vertical dis-
placement cutoff). Top: surface plan view. Bottom:
north–south section
13 Universal distinct-element code (UDEC) discontinuum
subsidence results for undercut depths of 500–2000 m
with 0 and 90u joint sets (1 m minimum vertical displa-
cement cutoff)
14 Universal distinct-element code (UDEC) discontinuum
subsidence results for undercut depths of 500–2000 m
with 45 and 135u joint sets (1 m minimum vertical dis-
placement cutoff)
Woo et al. Benchmark study testing several numerical methods
136 Mining Technology 2014 VOL 123 NO 3

subsidence patterns identified by UDEC (with inclinedjoint sets) and ELFEN is that although the subsidenceangles measured for the undercut depths of 500 and2000 m do not differ, the differences for the 1000 and1500 m deep undercuts are considerable. Movement ofindividual blocks on the inclined joints in response tocaving appears to be more active with the shallowerundercuts, having a more pronounced influence on thesurface subsidence profile.
In the ELFEN results, the influence of the brittlefracture network on the lateral extent of subsidencetends to be less significant for the shallower undercuts,but with greater undercut depths (and higher stresses),brittle fracture activity away from the immediate areaabove the undercut increases. The trend in subsidenceangles with increasing undercut depth for the ELFENmodel and the UDEC model with vertical joints issimilar. This suggests that the influence of large strainslip along joints in the UDEC models decreases with
increasing confining stresses at depth, as would beexpected based on a Coulomb slip law.
ConclusionsResults from this benchmark study involving continuum,discontinuum and hybrid brittle fracture numericalmodelling methods, showed a similar response withrespect to the extent of modelled caving and groundcollapse. Caving angles, except in the hybrid FDEMbrittle fracture modelling (ELFEN), were seen to decreasewith increasing undercut depth resulting in caving anglesgreater than 90u indicating an overhanging condition withrespect to the undercut footprint. Similarly, the extent ofmacro-deformation in the form of the zone of fractureinitiation was also seen to decrease with increasingundercut depth. These responses can be explained as theresult of decreasing extraction ratios with increasingundercut depth as the simulation of caving in the models
15 ELFEN brittle fracture subsidence results for undercut depths of 500–2000 m (1 m minimum vertical displacement cutoff)
16 Block caving-induced caving, fracture initiation and subsidence deformation zones as defined by van As et al. (2003)
Woo et al. Benchmark study testing several numerical methods
Mining Technology 2014 VOL 123 NO 3 137
maintained the same block height of 200 m. In mostcases, the presence of bounding faults on either side of theundercut acted to limit the lateral extent of caving andfracture initiation.
Differences in the results between the differentnumerical methods emphasise the importance of carefully
defining the key objectives of the modelling together withthe factors that are most important. Often the need forfast model setup and run times are counter to those foraccurate representations of the rock mass fabric (throughthe inclusion of DFNs) and caving mechanics (brittlefracture). Overall, the 2-D hybrid FDEM approach
17 Phase2 continuum subsidence results showing delineation of the caving and fracture initiation angles based on
yielded elements and vertical displacements. The inside blue dashed lines trace the caving angle, as defined by the
zone of shear indicators and vertical displacements .5 m. The outside red dashed lines define the fracture initiation
angle based on the zone of tension indicators
18 Universal distinct-element code (UDEC) discontinuum
results showing interpretation of the caving angle
(blue dashed line) based on the distribution of shear
and tensile plasticity indicators
19 Universal distinct-element code (UDEC) discontinuum
results showing interpretation of the fracture initiation
angle (red dashed line) based on the distribution of
shear and tensile plasticity indicators
Woo et al. Benchmark study testing several numerical methods
138 Mining Technology 2014 VOL 123 NO 3
allowing stress-induced brittle fracturing between jointsappeared to provide the more consistent and realisticresults. In addition, the contact detection algorithm usedallows caving to be more intuitively (explicitly) simulatedthrough a block deletion procedure. Ideally, using a 3-DFDEM brittle fracture code would seem to incorporateall of the key requirements and needs. Computationally,however, this is prohibitively expensive with currentcomputer and software capabilities. Where the need for a3-D analysis is the over-riding factor, a 3-D finite-elementor finite-difference code (e.g. FLAC3D) represents themost viable option at present. This emphasises theimportance of establishing a comprehensive understand-ing of the modelling context from which the numericalcode has been developed.
Acknowledgements
This work was supported through funding provided bythe Centre for Excellence in Mining Innovation (CEMI)and the Rio Tinto Centre for Underground MineConstruction (RTC-UMC), as well as through aCollaborative Research and Development grant fromthe Natural Science and Engineering Research Councilof Canada (NSERC). The authors would like to thankKeith Bullock and Salina Yong (CEMI) for theirtechnical guidance and assistance in this study.
ReferencesAlbrecht, J. B., Gibson, W. H., Vakili, A., Sandy, M. P. and Ross, K.
2010. Application of advanced numerical modelling techniques for
assessment of capability, subsidence and airblast hazard in a
sublevel caving mine, in Proceedings of the 2nd Int. Symp. on
‘Block and sublevel caving’, (ed. Y. Potvin), 495–508, Perth,
Australian Centre for Geomechanics.
Bullock, K., Kaiser, P. K. and Yong, S. 2012. Numerical simulations of
deep block caving angles: a comparative case, in Proceedings of
the 6th International Conference and Exhibition on Mass Mining,
Massmin 2012, Sudbury, Ontario, Canada.
Elmo, D., Rogers, S., Beddoes, R. and Catalan, A. 2010. An integrated
finite/discrete element method – discrete fracture network synthetic
rock mass approach for the modelling of surface subsidence
associated with panel cave mining at the Cadia East underground
project, in Proc. 2nd Int. Symp. on ‘Block and sublevel caving’, (ed.
Y. Potvin), 167–180, Perth, Australian Centre for Geomechanics.
Elmo, D. and Stead, D. 2010. An integrated numerical modelling –
discrete fracture network approach applied to the characterisa-
tion of rock mass strength of naturally fractured pillars, Rock
Mech. Rock Eng., 43, (1), 3–19.
Hoek, E., Carranza-Torres, C. T. and Corkum, B. 2002. Hoek–Brown
failure criterion – 2002 edition, in Proceedings of the 5th North
American Rock Mechanics Symposium, (eds. R. Hammah et al.),
267–273, Toronto, University of Toronto Press.
Hoek, E. and Diederichs, M. S. 2006. Empirical estimation of rock
mass modulus, Int. J. Rock Mech. Min. Sci., 43, (2), 203–215.
Hudson, J. and Feng, X. 2010. Technical auditing of rock mechanics
modelling and rock engineering design, Int. J. Rock Mech. Min.
Sci., 47, (6), 877–886.
Itasca Consulting Group. 2009. FLAC3D. Version 4?0, Minneapolis,
US, Itasca Consulting Group, Inc.
Itasca Consulting Group. 2010. UDEC, Version 5.0, Minneapolis, US,
Itasca Consulting Group, Inc.
Munjiza, A. 2004. The combined finite-discrete element method, 348,
Chichester, John Wiley & Sons.
Owen, D. R. J., Feng, Y. T., de Souza Neto, E. A., Cottrell, M. G.,
Wang, F., Andrade Pires, F. M. and Yu, J. 2004. The modelling
of multi-fracturing solids and particulate media, Int. J. Num.
Meth. Eng., 60, 317–339.
Rockfield. 2009. ELFEN, Version 4.3.3, Swansea, UK, Rockfield Software.
Rocscience. 2009. Phase2, Version 7.0, Toronto, Canada, Rocscience Inc.
Sainsbury, B. 2012. A model for cave propagation and subsidence assessment
in jointed rock, PhD thesis, The University of New South Wales, Sydney.
Stead, D., Eberhardt, E. and Coggan, J. S. 2006. Developments in the
characterization of complex rock slope deformation and failure
using numerical techniques, Eng. Geol., 83, 217–235.
van As, A., Davison, J. and Moss, A. 2003. Subsidence definitions for
block caving mines, Rio Tinto Technical Services.
Vyazmensky, A., Elmo, D. and Stead, D. 2010. Role of rock mass
fabric and faulting in the development of block caving induced
surface subsidence, Rock Mech. Rock Eng., 43, (5), 533–556.
Woo, K., Eberhardt, E., Elmo, D. and Stead, D. 2013. Empirical
investigation and characterization of surface subsidence related to
block cave mining, Int. J. Rock Mech. Min. Sci., 61, 31–42.
20 Estimated caving angles v. undercut depth, as mea-
sured from the north side of the undercut (left hand
side in the previous cross-sections)
21 Estimated fracture initiation angles v. undercut depth,
as measured from the north side of the undercut (left
hand side in the previous cross-sections)
22 Estimated subsidence angles v. undercut depth, as
measured from the north side of the undercut (left
hand side in the previous cross-sections)
Woo et al. Benchmark study testing several numerical methods
Mining Technology 2014 VOL 123 NO 3 139
![Elfen Lied vol 09 []](https://static.fdocuments.in/doc/165x107/55cc8c3abb61ebe0568b461d/elfen-lied-vol-09-wwwreina-animeblogspotcom.jpg)


![Elfen Lied vol 07 []](https://static.fdocuments.in/doc/165x107/55c78247bb61eb561b8b4580/elfen-lied-vol-07-wwwreina-animeblogspotcom.jpg)


