Field Journal Documentation Procedures Part One: The Site Description

BENCHMARK SITE DOCUMENTATION
03-AB (FALHER, ALBERTA)
SOIL QUALITY EVALUATION PROGRAM
Site Description Report
B.D. Walker and C. Wang
Agriculture and Agri-Food Canada Lethbridge Research Centre, Land Resource Unit
Edmonton, AB and Ottawa, ON
1998

Site No.: 03-AB Site manager: Bruce Walker (contact Dr. G.M. Coen after April 1, 1998) Address: Agriculture and Agri-Food Canada
Lethbridge Research Centre Land Resource Sciences Section Box 3000 Lethbridge, AB T1J 4B1
Telephone: 403-327-4561 Fax: 403-317-2187 Cooperator (owner): Paul Houde Address: Box 802
Falher, Alberta T0H 1M0
This publication may be cited as:
Walker, B.D. and Wang, C. 1998. Benchmark site documentation: 03-AB (Falher, Alberta). Agriculture and Agri-Food Canada, Research Branch, Edmonton, AB. 16 pp.

iii
CONTENTS
ACKNOWLEDGMENTS ...........................................................................................................................iv SOIL QUALITY BENCHMARK SITES – THE STUDY .............................................................. 1
INTRODUCTION ............................................................................................................................................. 1 OBJECTIVES ................................................................................................................................................... 1 SITE SELECTION CRITERIA ...................................................................................................................... 1
BENCHMARK SITE 03-AB (FALHER) ............................................................................................... 2 SITE LOCATION ............................................................................................................................................. 2 SAMPLING DESIGN AND METHODOLOGY ........................................................................................... 2
Field Sampling Design ........................................................................................................................................................... 2 Soil and Topographic Characterization .............................................................................................................................. 2 Sampling Activities ................................................................................................................................................................. 2 Field Measurements ............................................................................................................................................................... 3 Analytical (Laboratory) Methods ......................................................................................................................................... 4
AGRONOMICS ................................................................................................................................................ 6 Farm History ........................................................................................................................................................................... 6 Current Management Practices ............................................................................................................................................ 7
SOIL AND LANDSCAPE DESCRIPTION ................................................................................................... 8 Ecology and Climate .............................................................................................................................................................. 8 Terrain ...................................................................................................................................................................................... 9 Soil Patterns ........................................................................................................................................................................... 10
BENCHMARK SITE DATA ......................................................................................................................... 10 REFERENCES ............................................................................................................................................... 12 APPENDIX A: PEDON DESCRIPTIONS ........................................................................................ 15
PEDON 1: FALHER SERIES (FAL) ........................................................................................................... 15 PEDON 2: FALHER SERIES (FAL) ........................................................................................................... 17
LIST OF FIGURES Figure 1. Location of the 03-AB (Falher) Benchmark Site in the Peace River region of Alberta. ......................... 3 Figure 2. Falher BMS grid plan showing pedon locations, contours and areas subject to ponding. ....................... 5
LIST OF TABLES Table 1. Typical tillage, crop management and harvesting procedures. .................................................................. 8 Table 2. Selected temperature and precipitation normals (1961-90) for Peace River A, AB. ................................. 9 Table 3. Descriptive statistics for selected soil attributes of the Falher Benchmark Site. ..................................... 11 Table 4. Selected chemical and physical characteristics of Pedon 1. .................................................................... 16 Table 5. Selected chemical and physical characteristics of Pedon 2. .................................................................... 18

iv
ACKNOWLEDGMENTS
The Benchmark Site Study is indebted to the National Soil Conservation Program, Soil Quality Evaulation Program, for supplemental funding to establish the national benchmark site network. Agriculture and Agri-Food Canada’s’ former Centre for Land and Biological Resources Research is acknowledged for management and administration of this program, in particular D.F. Acton, D.R. Coote, G.M. Coen, E. Menchetti, and S. Angeltvedt. For essential assistance in locating an appropriate site and farm cooperator, the authors recognize Mr. Gary Coy, formerly of Alberta Agriculture, Food and Rural Development, Fairview, Alberta. The authors gratefully acknowledge the Houde family of the Falher area – Paul and Cecile – for their on-going cooperation and support; and thank them for putting up with the occasional inconveniences. Many persons from several organizations have contributed in some way to the project thus far. A by no means exhaustive list of contributors to the characterization and monitoring effort at the 06-AB site follows.
• For assistance with crop yield monitoring: Jerome Lickacz, John Brown, Jill DeMulder, Lloyd Davison, and Ed Kallal, Alberta Agriculture, Food and Rural Development, Agronomy Unit.
• For chemical and physical analyses of soil samples: − Alex Schwarzer and Joe Beres, Alberta Research Council, Soils Lab (managed by Salim Abboud); − Bernie Sheldrick (Ottawa Analytical Lab) and Wayne McKean (Alberta Land Resource Unit Soils
Lab), formerly CLBRR of Agriculture and Agri-Food Canada; − Dan Heaney and Shelley Eliuk, Alberta Agriculture, Food and Rural Development, Agricultural
Soils and Animal Nutrition Laboratory. • For invaluable field assistance: Steve Crudge, Nathan Grey, Douglas MacKay, Wayne McKean, Peter
Smith, and Matthew Walker. • For graphics and GIS support: Steve Crudge and Peter Smith, Agriculture and Agri-Food Canada,
Alberta Land Resource Unit. • For installation and programming of automated weather stations:
− Mark McGovern, Agriculture and Agri-Food Canada, ECORC (formerly CLBRR), Ottawa, ON; − Yvan Cardinal, Campbell Scientific Canada Corp., Edmonton, Alberta; − Peter Mills, Agriculture and Agri-Food Canada, Northern Agriculture Research Centre,
Beaverlodge, Alberta. • For review of the manuscript: J.A. (Tony) Brierley, Agriculture and Agri-Food Canada, Research
Branch, Land Resource Unit, Edmonton, Alberta.

1
SOIL QUALITY BENCHMARK SITES – THE STUDY
INTRODUCTION
Questions about trends in soil quality and means of measuring those trends, if detectable, arose in the late 80's in response to the sustainable agriculture issue (Mathur and Wang 1991). The popular opinion was that the value of agricultural soil resources has deteriorated, and may continue to be declining under conventional farming practices. The rate of decline is only speculative. Baseline data sets with which to make such evaluations aren't available for many regions. Information about problem soils tends to be plentiful; much less is known about the "medium to good quality" farmlands that dominate many agricultural regions.
In 1988 Agriculture and Agri-Food Canada's former Centre for Land and Biological Resources Research (CLBRR) started a pilot project in eastern Canada to establish benchmark sites for collecting baseline data to monitor trends in soil quality. This study was adopted nationally, in 1990, by the National Soil Conservation Program (NSCP) as part of the Soil Quality Evaluation Program (SQEP) managed by CLBRR. The study was labelled Soil Quality Benchmark Sites (SQUBS).
A network of 23 benchmark monitoring sites was established across Canada by late 1992. Various land, soil and air characteristics were to be monitored for at least 10 years. The Falher site, coded 03-AB, was established in September, 1991. It represents Dark Gray soils of the Peace Lowland Ecoregion. The landscape is representative of the level glaciolacustrine terrain common to the southeastern portion of the Peace River agricultural region.
OBJECTIVES
The benchmark site study was envisaged as a “case study” approach for monitoring the trends in soil quality change. Two basic assumptions underlie this approach. 1) Landscapes representative of major agro-ecosystems and managed under typical farm production systems could be characterized in detail to create baseline data sets with which to make soil quality assessments. 2) Monitoring selected soil variables within these landscapes (benchmark sites) for 10 or more years would facilitate the evaluation of trends in soil quality change. To complete the picture, it was anticipated that benchmark site information could be used to support expert systems
for making general statements on soil quality trends regionally and nationally.
To implement this vision, three national objectives for establishing benchmark sites were developed. In order of priority, these were:
1. to provide a baseline data set for assessment of change in soil quality and biological productivity of representative agro-ecosystems,
2. to provide a means of testing and validating predictive models of soil degradation and productivity, and
3. to provide a network of benchmark sites at which integrated research projects could be developed.
In keeping with the national objectives, several major agro-ecosystems and agricultural landscapes were identified by a group of federal-provincial agrologists from across Canada. One such grouping that they identified – Dark Gray soils of the Peace Lowland occurring on fine-textured glaciolacustrine materials with level or very gently undulating terrain – was likely to be found in the eastern Peace region of Alberta. Characterization of the nearly flat terrain, and the prospect of monitoring organic matter change, structural degradation, acidification, or perhaps wind or water erosion, were viewed as objectives for this benchmark site. Comparison with other Great Plains sites of similar terrain in the Gray and thick Black soil belts was also anticipated.
SITE SELECTION CRITERIA
Criteria were developed to guide the selection of benchmark sites, the main goal being to represent the dominant landscape within major agro-ecological regions. Based on the specific objectives above, the northern Alberta site was to:
1. represent Dark Gray soils of the Peace Lowland Ecoregion;
2. represent level glaciolacustrine terrain comprised of fine-textured, glaciolacustrine material;
3. represent a cereals-oilseed-forage crop rotation managed under conventional tillage;
4. be about 5-10 ha in size; and
5. show potential for change in soil organic matter, structure, or acidity.

2
The search for a site, based on the guidelines above, began in June 1991, throughout the south-central and southeastern portions of the Peace River region. Gary Coy, formerly of Alberta Agriculture, Food and Rural Development in Fairview, provided valuable guidance on the landscapes and farm operators throughout the area. The final selection was made shortly after a tour of the area. A site about 5.6 km (3.5 mi.) W of Falher, on land owned and managed by Paul Houde, was selected. Several factors affected the final decision.
1. The soils, terrain and farm management system were representative of an extensive area in the targeted region.
2. The uniform landscape could be easily sampled within an area of 5-10 ha.
3. The farm operator, Paul Houde, was fully cooperative and supportive.
BENCHMARK SITE 03-AB (FALHER)
SITE LOCATION
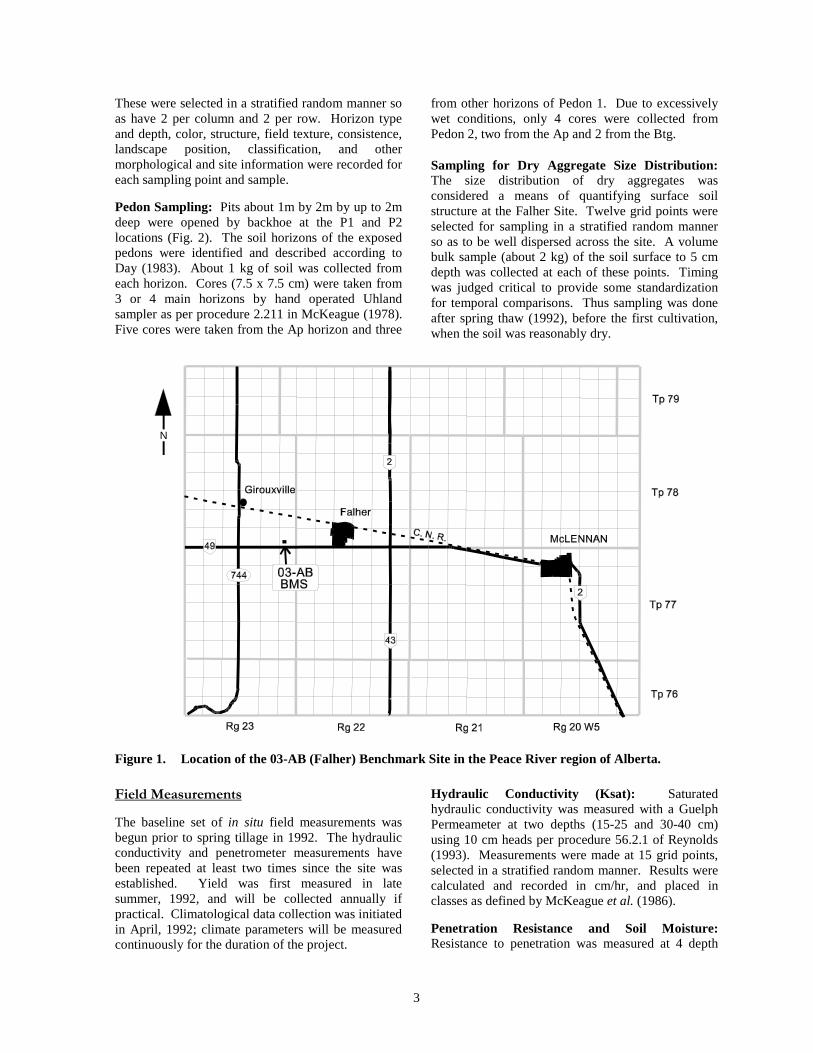
The Falher Benchmark Site resides in northwestern Alberta, about 450 km (280 mi.) northwest of Edmonton. It is located within Legal Survey Division (LSD) 6 and the SW quarter of Section 1, Township 78, Range 22, west of the 5th Meridian. The uncorrected coordinates for the NE corner of the site are 55°43'50" N latitude, 117°17'55" W longitude; UTM Zone 11, Easting 482798.26 m and Northing 6175940.10 m; elevation 574 m.a.s.l. From Falher townsite, the site can be reached by traveling 5.6 km (3.5 mi.) west along Highway No. 49 (Fig. 1).
SAMPLING DESIGN AND METHODOLOGY
Field Sampling Design
Terrain at the Falher site is level with no internal relief. It has a barely perceptible northeast-southwest gradient (0.4% slope). An area 275 x 275 m, totalling 7.6 ha (18.7 ac) in size, was selected to represent this landscape. A grid design with 100 sample points spaced 25 m apart (east-west and north-south) was setup within this area. The north-south “columns” of points were labelled A to J; the east-west “rows” of points were tagged 0 to 9 (Fig.2), much as in a spreadsheet layout. Thus each sampling (or grid) point is identified by the intersection of a column letter and a row number, i.e. grid point “F3”. Each grid point was described, during sampling activities, in terms of slope shape, soil taxonomy, and other pertinent landscape features.
Two soil profiles (pedons), representing the dominant soil of the study site, were excavated for detailed characterization, and sampled for physical and chemical analysis. Their locations are shown as P1 and P2 on Fig. 2. They are described in Appendix A.
Soil and Topographic Characterization
Topographic Data and Contour Map: A detailed contour map, with a 0.2 m interval, was created for the site (Fig. 2). A Nikon Total Station was used to measure X (easting), Y (northing) and Z (elevation) coordinates, in meters, for each grid point and other selected points at the site. The starting coordinates for this survey were estimated from 1:50,000 NTS maps. In the fall of 1995, additional topographic data from several “benchmarks” located within 1 km around the site was collected by Differential Global Positioning System (DGPS), allowing correction of the total station data.
Detailed Soil Map: During the sampling activities, the morphological features of the soils at all 100 grid points were examined, and they were classified according to the Canadian System of Soil Classification (ECSS 1987). Initially a soil map was not made since only one series, Falher (FAL), was overwhelmingly dominant. Several years later, after wet years in 1996 and 1997, some areas prone to ponding (Fig. 2) became visible where excess water affected the legume crop.
Sampling Activities
Three types of sampling activities were conducted to establish the baseline field and pedological characteristics of the Falher Benchmark Site. The first two activities were conducted in the fall of 1991, the fourth, for aggregates, in the spring of 1992. Sampling occurred on fall-cultivated stubble following a cereal crop.
Grid Point Sampling for Baseline Data: A bulk sample of the contemporary Ap horizon was taken at every sampling point. In addition, a sample at approximately 50-60 cm depth (usually a Btnj horizon) was collected at 20% of the sampling points.
3
These were selected in a stratified random manner so as have 2 per column and 2 per row. Horizon type and depth, color, structure, field texture, consistence, landscape position, classification, and other morphological and site information were recorded for each sampling point and sample.
Pedon Sampling: Pits about 1m by 2m by up to 2m deep were opened by backhoe at the P1 and P2 locations (Fig. 2). The soil horizons of the exposed pedons were identified and described according to Day (1983). About 1 kg of soil was collected from each horizon. Cores (7.5 x 7.5 cm) were taken from 3 or 4 main horizons by hand operated Uhland sampler as per procedure 2.211 in McKeague (1978). Five cores were taken from the Ap horizon and three
from other horizons of Pedon 1. Due to excessively wet conditions, only 4 cores were collected from Pedon 2, two from the Ap and 2 from the Btg.
Sampling for Dry Aggregate Size Distribution: The size distribution of dry aggregates was considered a means of quantifying surface soil structure at the Falher Site. Twelve grid points were selected for sampling in a stratified random manner so as to be well dispersed across the site. A volume bulk sample (about 2 kg) of the soil surface to 5 cm depth was collected at each of these points. Timing was judged critical to provide some standardization for temporal comparisons. Thus sampling was done after spring thaw (1992), before the first cultivation, when the soil was reasonably dry.
Figure 1. Location of the 03-AB (Falher) Benchmark Site in the Peace River region of Alberta.
Field Measurements
The baseline set of in situ field measurements was begun prior to spring tillage in 1992. The hydraulic conductivity and penetrometer measurements have been repeated at least two times since the site was established. Yield was first measured in late summer, 1992, and will be collected annually if practical. Climatological data collection was initiated in April, 1992; climate parameters will be measured continuously for the duration of the project.
Hydraulic Conductivity (Ksat): Saturated hydraulic conductivity was measured with a Guelph Permeameter at two depths (15-25 and 30-40 cm) using 10 cm heads per procedure 56.2.1 of Reynolds (1993). Measurements were made at 15 grid points, selected in a stratified random manner. Results were calculated and recorded in cm/hr, and placed in classes as defined by McKeague et al. (1986).
Penetration Resistance and Soil Moisture: Resistance to penetration was measured at 4 depth
N

4
ranges (0-10, 10-20, 20-30, and 30-40 cm) using the Centre-Cone Penetrometer, operated manually per the user's manual (Star Quality Samplers 1990). Reported results, in MPa, are the averages of five readings per depth per sampling point. Initially, in the fall of 1991, measurements were made at 30 grid points, selected in a stratified random manner to be well dispersed over the site. Measurements were repeated in the spring of 1992 at 21 grid points. Small samples, one from each depth at 20-30% of the selected points, were collected in moisture tins for gravimetric determination of soil moisture. Results from the 0-10 cm depth (Ap) were highly variable and changed with tillage; thus measurements at this depth were discontinued.
Crop Yield Sampling: Due to unusual and sometimes unfortunate circumstances, yield samples from only two crops have been taken since the site was established. For the first crop sampling in 1992, twenty grid points were selected in a stratified random manner so as to be well dispersed across the site. These same points were used for crop sampling in subsequent years. At the selected points, all above-ground crop material within a 1 m2 area was clipped at about 1-3 cm above the soil surface. The samples are collected in large porous bags and transported to a threshing facility operated by Alberta Agriculture, Food and Rural Development (AAFRD) near Edmonton. After air drying, the crop samples were threshed to separate grain and residue (straw). Weights of both, in kg ha-1, harvest index (grain weight as % of total dry matter weight) and residue-grain ratio were calculated and recorded.
Climate: A climate monitoring station, using the Campbell Scientific CR10 measurement and control module, was installed along the fenceline about 50 m east of BM1 in Figure 2. Sensors for measuring air temperature and relative humidity (inside a gill radiation shield), global solar radiation, and wind speed were attached to a galvanized-steel radio tower at about 2 m above the ground. Other measuring devices were installed to collect soil temperature at 20, 50 and 100 cm; total rainfall and 15-minute rainfall intensity; and snow depth. Measurements were initiated in late April, 1992. Minor programming changes were instituted in June, 1992. Since then the current set-up has operated smoothly except for occasional breakdowns of the UDG snow depth sensor and anemometer. Hourly, daily and monthly outputs are available for some parameters.
Analytical (Laboratory) Methods
Sample Handling and Preparation: The bulk samples for chemical and physical analyses were air-
dried and roller-ground to separate the fine earth fraction (<2mm) from coarse fragments as per procedure 1.2 (McKeague, 1978). Pedon and field samples, after preparation for detailed laboratory characterization, were split into two equal parts, one part for analysis and the other for future use. Core samples from the pedons were stored at low temperatures (about 4°C) until processing. Samples for aggregate analysis were very carefully collected and transported in pizza-style cardboard boxes to minimize aggregate breakage. After air drying, the samples were shipped to the Saskatchewan Land Resource Unit, Saskatoon, for rotary sieve analysis.
Soil Reaction (pH): pH in CaCl2 measured with a pH meter using a 1:2 soil to 0.01 M CaCl2 solution, per procedure 84-001 in Sheldrick (1984).
Total Carbon: LECO induction furnace, as per procedure 84-013 in Sheldrick (1984).
Organic Carbon: Calculated as the difference between total carbon and inorganic carbon determined in the CaCO3 procedure.
Total Nitrogen: Samples were digested using a semi-micro version of the Kjeldahl- Wilforth-Gunning method (AOAC 1955) using Se-K2SO4 (Keltabs) as the catalyst. Ammonium-N in the distillate was detected colorimetrically with a Kjeltec nitrogen analyzer.
CaCO3 Carbonate Equivalent: Carbonates were determined by the inorganic carbon manometric (calcimeter) method of Bascombe (1961), similar to procedure 84-008 of Sheldrick (1984), on samples with CaCl2 pH of 6.5 and greater.
Cation Exchange Capacity and Exchangeable Cations: Cation exchange capacity (CEC) and exchangeable cations (Ca, Mg, Na, K, and in a few cases Al) were measured by one of three methods, depending on the CaCl2 pH of the sample. Except as noted, extracted cations were determined by inductively-coupled, plasma spectrophotometry (ICPS); displaced ammonium by nitrogen analyzer.
• pH <5.5 — 2M NaCl method, per procedure 84-004 in Sheldrick (1984). Cation replacement is by Na, thus Na cation and CEC were not determined. Exchangeable Al and permanent charge CEC (the sum of Ca, Mg, K and Al) were determined on some samples, including detection by atomic absorption spectrophotometry.
• pH 5.5-6.4 — 1M, buffered (pH 7), NH4OAc steam distillation method (USDA Soil Conservation Service 1984).

5
• pH ≥6.5 (calcareous soils) — 1M, buffered (pH 7), NH4Cl steam distillation method (USDA Soil Conservation Service 1984).
Total exchange capacity – the sum of exchangeable Ca, Mg, K, and Na if measured – was also calculated and recorded in the benchmark data sets.
Figure 2. Falher BMS grid plan showing pedon locations, contours and areas subject to ponding.
A
BM2
B C D E F G H I J
BM1
0
1
2
3
4
5
6
7
8
9
SW SE275 m
P2
P1
25m
25
m2
5m
25m
x x x x x x x x x x
x x x x x x x x x x
# # # # # # # # #
x x x x x x x x x x
x x x x x x x x x x
x x x x x x x x x x
x x x x x x x x x x
x x x x x x x x x x
x x x x x x x x x x
x x x x x x x x x x
x
x x x x x x x x x x
½ mile fence line
Sampling point of gridSampling point of grid with subsoil sample (50-60 cm)
Sampled pedons
Contour line (20cm interval)
Legend
573.8
573.6
573.4
573.2
573.0
572.8
574.0
N
P1 P2

6
Available P: "Plant-available" or extractable phosphorus was measured by one of two methods, depending on the predominance of calcareous versus acidic, non-calcareous soils at a site.
• Mainly neutral to alkaline and calcareous samples — sodium bicarbonate (NaHCO3) extraction with P determined by using ammonium molybdate solution, per procedure 84-017 in Sheldrick (1984).
• Mainly acid to neutral samples — Bray method (0.03M HN4F + 0.025 M HCl), extractable P determined by using ammonium molybdate solution, per procedure 84-018 in Sheldrick (1984).
Available K: "Plant-available" or extractable potassium was measured by one of two methods, depending on calcareousness of the samples. Extracted K was determined by ICPS.
• Calcareous samples (pH 6.5 or greater) — 1M, buffered (pH 7), NH4OAc extraction, per procedure 84-005 in Sheldrick (1984).
• Non-calcareous samples - cold, 0.05M, H2SO4 extraction (Knudsen et al. 1982).
Total Elemental Analysis: Total amounts of selected elements (Al, Ca, Co, Cr, Cu, Fe, K, Li, Mg, Mn, Na, Ni, Pb and Zn) were determined using the perchloric acid digestion method (84-023 in Sheldrick 1984) on all pedon and 10% of field samples.
Electrical Conductivity and Soluble Salts: Subsets of the pedon and selected field samples were submitted to AAFRD's Soil and Animal Nutrition Testing Laboratory for EC and soluble salt analyses. Electrical conductivity (EC) and soluble salts (cations) were determined on saturation extracts (method 3.21 in McKeague 1978); EC by a conductivity bridge, cations by ICPS. Sodium adsorption ratios (SAR, ratio of soluble Na to Ca + Mg) were also calculated.
Particle Size Distribution Analysis: The fine earth fraction of all pedon and 10% of field samples was separated into particle size groups using a pipette or filter candle system, per procedure 84-026 in Sheldrick (1984). Samples were pretreated to remove soluble salts, carbonates, and organic matter as required. Clays were collected for mineralogical analysis; sands were fractionated by sieve analysis, per procedure 47.2.3.2 in Sheldrick and Wang (1993).
Mineralogical (XRD) Analysis: Minerals present in clay fractions, collected during the particle size analysis procedure, were identified by X-ray diffraction (XRD) analysis. Mineral identification was based on a composite of diffraction data from air-dry, glycerolated and thermally treated specimens of each clay sample. Mineral content was estimated from diffraction intensities using procedures like those described by Kodama et al. (1977). Semi-quantitative results were recorded.
Soil Moisture Retention: Undisturbed 7.5 cm diameter x 7.5 cm length cores were used for determining moisture retention at tensions equivalent to 0, 10, 30, 60 and 100 cm of water on a glass bead tension table; at 1/3 and 1 bar tensions (333 and 1000 cm of water) on an aluminum oxide tension table. Moisture retention at 4 and 15 bars were determined on ground samples with pressure plate extraction similar to procedure 53.4 by Topp et al. (1993).
Surface Area: Total surface area of all pedon samples and about 10% of field point samples was determined by the ethylene glycol monoethyl ether (EGME) method of Cihacek and Bremner (1979).
Bulk Density: Only one set of bulk density values was obtained during the baseline sampling at the Falher Site. Oven-dry bulk density values, uncorrected for coarse fragment content, were determined on the core samples from the pedons, per procedure 2.211 in McKeague (1978).
Dry Aggregate Size Distribution: Samples were air dried and shipped in pizza-style boxes, with minimum disturbance, to Agriculture and Agri-Food Canada’s Saskatchewan Land Resource Unit for rotary sieve analysis. Aggregate distribution was determined, per the procedure of White (1993), using a rotary sieve with screen openings of 53.53, 34.58, 17.51, 7.20, 2.58, 1.30, and 0.50 mm.
AGRONOMICS
Information on the agronomic history and current farming practices was obtained through an interview process using a standard questionnaire. The owner/operator, Paul Houde, was interviewed about the Falher Site. The following is a summary of the interview data.
Farm History
The land that contains the Falher Benchmark Site was purchased by Mr. Houde’s father in 1927. Paul

7
now rents it from his mother, and his recollection of the earliest farm history is sketchy.
The Early Years: It is not known when the land was cleared and broken for cropping. The probable crop rotation was two years of cereals followed by one or 2 years of legumes. Tillage was done primarily by plow. Fertilization was achieved mainly be growing alfalfa in the rotation; sometimes cattle manure was spread on the land. Harvesting was mainly by stationary threshing machine, which required removal of the crop material, bound in sheaves, to a threshing site.
Major Changes: Harvesting changed in 1951 with the introduction of a combine. At the same time, residue management began with the plow-down of straw. The cultivator was introduced into the tillage system in 1956 but did not entirely replace the plow. The cultivator was a better tool for incorporation of straw, leaving some surface residue. Use of chemical fertilizers (11-48-0) began about 1952, herbicides (MCPA and Tordon) not until 1962. Different types of fertilizers were used later on – 12-51 beginning in 1972, specialized blends in 1980, and anhydrous ammonia in 1986. Also beginning in 1956, the cereal cropping portion of the rotation often extended to three years. In 1970, canola was introduced into the crop rotation. In late 1995 and early 1996, Paul Houde sold most of the family’s farm holdings, including the piece with the benchmark site. But he continues to manage the land under a lease arrangement.
Cooperator Assessment: The interviewee noted that yields and crop quality have increased over the 40 years that he has been actively involved with the farm. He felt that yields were on par with most in the vicinity. He noted that the use of chemical fertilizers and pesticides had increased over the 40 years. Management of the farm had always included green manuring (legume crops used regularly, every 2-4 years, for a 1-3 year span) to build up soil organic matter. Ditching, mainly along the field borders, was begun in 1960 to help alleviate the impeded drainage of the clay soils.
Current Management Practices
Crop Rotation System: A flexible cereal-canola-cereal-legume rotation has been used since 1979. The cereal grain is usually wheat, sometimes barley. Most of the flexibility is in the duration of any one phase of the rotation. For example, the legume phase may be extended to two or three years depending on soil, weed, moisture and market conditions at the time of decision making. Peas can also be a part of the legume phase, as they were in 1995. When sampled and characterized in 1991-92, the site had been cultivated following harvest of the 1991 barley crop. The 1992 crop was wheat, the 1993 crop red clover, the 1994 crop canola (new glycophosphate-resistant variety), the 1995 crop peas, the 1996 crop Pursuit-smart canola, and the 1997 crop volunteer clover (fall 1996 and spring 1997 cultivation could not be done due to excessive wetness).
Equipment: At the time of the interview in 1992, power equipment used on the Paul Houde Farms included a large 4-wheel drive tractor (Massey Ferguson 4840) and two 2-wheel drive tractors (White 2270 and Case 1690). Equipment used for tillage and seeding included: a heavy-duty cultivator, a medium-duty cultivator, a heavy-duty disc, a seven-bottom plow, a home-built land-leveler with tines, and a double disc for seeding. A set of harrows or a packer could be attached behind the cultivators. A pull-type field sprayer was used to apply herbicides. Harvesting equipment included a 16.5-foot, self-propelled swather (International) and a self-propelled combine (Massey Ferguson 860). Three, 2- and 3-ton trucks were used for various purposes, mainly hauling grain, on the farm.
Management Procedures: Table 1 shows a “phase-by-phase” account of "typical" farm management activities based on the rotation in use at the time of the interview (1992). The rotation is divided into “phases” rather than “years” because each part, i.e. phase, can be arbitrarily sustained for more than one year. For the presentation, the cereal cropping was chosen as the first phase of the rotation. An annual diary of actual operational activities is being kept by the farm operator for the duration of the study.

8
Table 1. Typical tillage, crop management and harvesting procedures.
Phase Main Activity Time Frame Operational Procedures
1. Cereal: Spring cultivation Spring fertilizer Planting Spraying Cutting/harvesting Fall cultivation
Late April start Late April Early May Early May June Mid Aug. – Oct. Mid Sept. on
Pass with land-leveler, then cultivator with anhydrous ammonia applicator and packer
Anhydrous NH4 at 40-45 lbs./ac with last cultivation 15-35-00-7 at 100 lbs./ac with the seed Seeded with double disc drill Triumph Plus applied with pull-type sprayer Straight combine cereals when field conditions permit Most of the time disked then cultivated; plowed if dry
2. Canola: Spring cultivation Spring fertilizer Spraying Cutting/harvesting Fall cultivation
Late April start Late April Early May Mid June Mid Aug. – Mid
September Mid Sept. on
Pass with land-leveler, then cultivator with anhydrous ammonia applicator and packer
More nitrogen than for cereals (see 1. above) More sulfur than for cereals (see 1. above) Poast, Assure or Lontrel applied with sprayer Swathed with roller attachment to control swaths;
combined later (mid Sept.) when dry Most of the time disked then cultivated; plowed if dry
3. Cereal: Spring cultivation Spring fertilizer Planting Spraying Cutting/harvesting Fall cultivation
Late April start Late April Early May Early May June Mid Aug. – Oct. N/A
Pass with land-leveler, then cultivator with anhydrous ammonia applicator and packer
Anhydrous NH4 at 40-45 lbs./ac with last cultivation 15-35-00-7 at 100 lbs./ac with the seed Seeded with double disc drill; under-seeded to Alsike
or Red clover, sometimes alfalfa Different chemicals (re. 1. above) because of legumes Straight combine cereals when field conditions permit Legumes – no cultivation
4. Legume: Spring cultivation Spring fertilizer Planting Spraying Cutting/harvesting Fall cultivation
N/A N/A N/A N/A June & August Mid – late Aug. October
Legumes – no cultivation Legumes – usually no fertilization Legumes – under-seeded the previous year Legumes – no herbicides applied Alfalfa – contract two cuts to pelleting plant in Falher Alsike clover – swath and combine;
Red clover – straight combine Clover – usually plowed after just one year Alfalfa – normally plowed in the 3rd year, sometimes
early (spring) in the 4th year
SOIL AND LANDSCAPE DESCRIPTION
Ecology and Climate
The Falher Benchmark Site occurs in the Peace Lowland Ecoregion of the Boreal Plains Ecozone (Ecological Stratification Working Group 1995, Marshall et al. 1996). The broad Ecozone is strongly influenced by continental climatic conditions and has cold, snowy winters and moderately warm summers (Ecoregions Working Group 1989). Large yearly and daily temperature ranges plus maximum precipitation
in summer (June or July) attest to the continental conditions (Table 2). Temperature extremes also illustrate the continental variability: the extreme maximum temperature (Peace River A, 47 years of record) was 36.7ºC, the extreme minimum temperature was -49.4ºC (Environment Canada 1998).
The Peace Lowland Ecoregion is typified by very gently undulating or sloping lands associated with the Peace River and its associated tributaries. It tends to have warmer summers than surrounding areas (Ecological Stratification Working Group 1995). The mean annual temperature is about 0.5ºC (0.7ºC at

9
Peace River, Table 2). Mean summer temperature exceeds 13ºC, and the mean winter temperature is about -14ºC. Precipitation in this area averages just under 400 mm (Table 2) annually.
The Falher Benchmark Site is located in Soil Correlation Area (SCA) 18 (Alberta Soil Series Working Group 1993). Its agro-climate is classed as 2H, which signifies a slight temperature (i.e. heat or energy) limitation for the production of spring-seeded small grains (Agronomic Interpretations Working Group 1995). Selected climate indices or factors, computed from climate normals (Agronomic Interpretations Working Group 1995) and extrapolated for the general area of the 03-AB Benchmark Site, are:
• P-PE (May to Aug. precipitation minus potential evapotranspiration) – approximately -250.
• EGDD (Effective growing degree days >5 oC, adjusted for day and growing season length – very close to 1200.
Wind is a significant part of the regional climate, based on data from the AES climate station at Peace River A (Environment Canada 1998). Mean yearly wind speed is a very consistent 13 km/h, with slightly higher speeds (14-15 km/h) in spring (April through June). The most frequent direction is SW, except in March (N) and the summer season (W). Extreme hourly wind speeds are in the 50 to 65 km/h range
with a clear October maximum (72 km/h). Extreme gust speeds are in the 80-95 km/h range, with one record of 100 km/h (January).
Zonation of the Peace Lowland has long been somewhat contentious. In some earlier concepts, it was considered transitional between aspen parkland, lying farther south, and the boreal forest areas surrounding the ecoregion. The natural vegetative cover is dominated by a closed canopy of trembling aspen, with secondary quantities of balsam poplar and an understory of mixed herbs and tall shrubs (Ecological Stratification Working Group 1995). White spruce and balsam fir are the climax tree species, but are not well represented. Poorly drained sites are common, and usually covered with sedges, willow, some black spruce, and tamarack. Reportedly, some more open, parkland-like areas, associated with Black Chernozemic soils, existed prior to cultivation. The Dark Gray Chernozemic / Dark Gray Luvisol – Gray Luvisol soil group is characteristic of the area (Alberta Land Resource Unit 1995). Some of these soils have solonetzic-like features, and most show some evidence of restricted drainage.
About half of the region is cultivated (Ecological Stratification Working Group 1995). In fact, there is virtually no uncultivated land in the vicinity of the Falher Benchmark Site. Cereal grains, oilseeds, and a variety of forage crops are most common. Field peas are also gaining favor.
Table 2. Selected temperature and precipitation normals (1961-90) for Peace River A, AB (56°14'N 117°26'W, 571 m ASL) (Environment Canada 1998).
Month/
Year
Daily Mean Temp. (°C)
Daily Max. Temp. (°C)
Daily Min. Temp. (°C)
Total Precip. (mm)
Rainfall
(mm)
Snowfall
(cm)
Extreme Daily Rainfall1
(mm)
Jan. Feb. Mar. Apr. May June July Aug. Sep. Oct. Nov. Dec. Year
-17.5 -13.3
-7.2 3.0 9.9
14.1 15.9 14.6
9.2 3.4
-8.5 -15.2
0.7
-12.2 -7.6 -1.1 9.1
16.8 20.7 22.4 21.2 15.4
8.9 -3.8
-10.1 6.0
-22.9 -19.1 -13.3
-3.3 3.0 7.4 9.4 8.0 3.0
-2.2 -13.3 -20.4
-5.0
22.6 19.3 15.1 15.8 31.5 63.4 61.7 50.9 40.4 24.1 23.0 19.9
387.6
0.5 0.4 0.3 7.6
28.3 63.4 61.7 50.8 38.2 14.1
3.5 0.7
269.4
26.4 23.2 17.9
9.4 3.3 0.0 0.0 0.2 2.5
10.8 23.9 23.4
140.7
5.3 2.3 7.6
13.2 48.0 43.7 43.4 45.2 28.4 17.6 10.2
5.4 N/A
1 Highest recorded rainfall over the period of record (1944 to 1990).

10
Terrain
The Falher Benchmark Site is located on the Falher Plain, one of many plains that comprise the Northern Alberta Lowlands region (Pettapiece 1986). The Falher Plain physiographic district is characterized by a level landform comprised of relatively thick, clayey, glaciolacustrine material. According to Green (1972), the boundaries of three different bedrock formations meet in the vicinity of the 03-AB Benchmark Site. All are Upper Cretaceous in age, and of marine origin. The Kaskapau Formation, which consists primarily of dark gray silty shale, extends northward (Green 1972). The Puskwaskau Formation, consisting mainly of dark gray fossiliferous shale, lies to the south. The Bad Heart Formation, composed chiefly of fine-grained quartzose sandstone, forms a thin band along the boundary that separates the other two formations.
The nearly level topography at the Falher Benchmark Site has very subtle relief, sloping indiscernibly towards the southwest from the northeast corner. The site diagram (Fig. 2) shows this terrain in plan view. The overall slope gradient is only about 0.4%. The lowest lying areas, in the southwest part of the site, were visible only after some excessively wet years in 1996 and 1997. Water tended to pond in these two localities (Fig. 2), affecting the 1997 legume crop.
The glaciolacustrine material is probably several hundred feet thick in the vicinity of Falher (Odynsky and Newton 1950). Only the top 2m of this material was examined in the two pedon sampling pits, with the parent material comprising only the lower 80cm or so of this depth. Its texture is consistently heavy clay (HC), commonly having no sand, and about 15% silt and 80% clay. Varves, comprised of thin, light and dark bands, are a feature of the parent material. Slickensides (smoothed surfaces along planes of weakness resulting from the movement of one mass of soil against another) occur in the parent material, but are largest and most abundant just above it. These features, and the widespread cracking from the surface when the soils are dry, indicate the predominance of swelling clays.
The glaciolacustrine parent material (occurring below 1m) is weakly saline (4-5 dS m-1) and non- to weakly calcareous (about 1% CaCO3 equivalent). Carbonate content of the horizons immediately above the C tends to be slightly higher (1-2% CaCO3 equivalent). Soluble salt content in these same lower B and BC horizons is low (E.C. 0.5-1 dS m-1). Perhaps the low, and possibly decreasing carbonate content with depth, indicates that the carbonates are the product of soil formation.
Soil Patterns
A soil map of the 03-AB Benchmark Site was not made since only one series, Falher (FAL), was overwhelmingly dominant. However, after wet years in 1996 and 1997, some areas prone to ponding became visible where excess water affected the legume crop. These localities are shown in Figure 2. But there were no discernible differences between the soils in the ponded localities and their “drier” neighbors. All showed some evidence of impeded drainage in their upper B horizons, and some also in the parent material (below 1m).
Descriptions of two pedons, both belonging to the Falher (FAL) series, a Gleyed Solonetzic Dark Gray Chernozemic soil (ECSS 1987) developed on very fine textured glaciolacustrine sediments, are given in Appendix A. After a recent review of the taxonomy of clay soils (Brierley et al. 1996), the pedons have been re-classified as Gleyed Vertic Dark Gray Chernozems (Solonetzic variant).
The FAL series is termed “Gleyed” because it commonly has a zone of weak to prominent mottling associated with the upper B horizon, immediately below the Ap. The mottled colors reflect varying degrees of intermittent saturation, likely caused by impeded drainage of the horizons below. The mottling tends to be restricted to the upper B horizon, not extending into deeper B horizons. Thus FAL was not considered to be a Gleysolic soil. Besides minor differences in some deeper horizons, the only potentially significant distinction in the FAL soils was the degree of gleying in the upper B horizon. But the difference was not sufficient to change their taxonomy, and was unpredictable to map.
A small number of Gleyed Dark Gray Luvisol (Solonetzic variant) profiles were also found. These few profiles plus some similar ones along the fenceline and early concepts of the Falher series (Odynsky and Newton 1950) insinuate that the dominant native soils may have been Gleyed Dark Gray Luvisols. Cultivation over several decades has likely combined the humus-rich Ahe or Ah horizon, along with any surface litter, and the underlying Ae horizon, obliterating the latter in most cases.
BENCHMARK SITE DATA
Copious amounts of baseline and reference data have been collected on the benchmark sites. This has been followed up with repeat sampling, on about a five-year frequency, to look for potential changes in soil quality. In addition, on-going measurements on

11
yield, climate, and some in situ field properties are being made.
Most of this data has been compiled and entered into a rudimentary relational database. With a host of data types on a variety of measured entities, the main goal was to attain efficient data storage that would support reasonably simple manipulation and retrieval. The Benchmark Site Database achieved this goal by using many small tables (files) developed in dBase IV. Each file contains similar types of data on similar kinds of soil and landscape entities. The files can be linked to perform analyses across data types. As in the table below, data on a particular site can be extracted from the database and analyzed according to soil or map unit types, terrain entities, horizons or
depth ranges, dates, years, crop types, and so on. Requests for data from the 03-AB Site (Falher) and the other western sites should be channeled through Dr. G.M. Coen at the Lethbridge Research Centre.
Analysis of the Falher Benchmark Site data set is simpler than for most sites because only one soil type predominates and the terrain is level. Table 3 lists some descriptive statistics for selected soil properties. The large number of replications (n) can provide some reliable results, for example, the pH of the Ap horizon. Alternately, two anomalous but explainable results for Ksat at the 15-25 cm depth substantially reduced the statistical normality of this data set. In addition, data like penetration resistance can be more meaningful when compared to moisture content.
Table 3. Descriptive statistics for selected soil attributes of the Falher Benchmark Site.
Variable n Mean Std. Dev. Range Median Mode Ap horizon: all topsoil samples from all 100 grid points and the two pedons Thickness (cm) 102 20 2 15 - 25 20 20 pH (CaCl2) 102 5.3 0.1 4.9 - 5.5 5.3 5.3 Organic C (%) 102 3.17 0.32 2.16 - 4.27 3.12 3.16 Total N (%) 102 0.33 0.12 0.21 - 1.10 0.30 0.29 Total Exch. Cap. (cmol kg-1) 102 22.4 1.6 19.7 - 27.5 22.1 21.5 Available K (ug g soil-1) 102 273 42 203 - 414 264 235 Sand (%) 12 7 1 5 - 8 7 7 Silt (%) 12 37 3 33 - 34 36 36 Clay (%) 12 56 3 49 - 60 57 57 Upper B horizon (Btgj, Btg): sampled from about 40-60 cm depth at selected grid points pH (CaCl2) 5 6.0 0.2 5.8 - 6.2 5.9 5.9 Organic C (%) 5 0.98 0.10 0.90 - 1.16 0.95 N/A Total N (%) 5 0.10 0.03 0.08 - 0.15 0.09 0.08 Total Exch. Cap. (cmol kg-1) 5 33.1 1.1 31.7 - 34.3 33.3 N/A Available K (ug g soil-1) 5 210 18 184 - 230 213 N/A Lower B horizon (Btnj): sampled from about 50-70 cm depth at selected grid points pH (CaCl2) 12 6.7 0.2 6.5 - 7.0 6.8 6.5 Organic C (%) 12 1.31 0.15 0.97 - 1.53 1.33 1.31 Total N (%) 12 0.11 0.07 0.07 - 0.33 0.10 0.10 CaCO3 Equivalent (%) 12 0.23 0.14 0.04 - 0.44 0.20 0.16 Total Exch. Cap. (cmol kg-1) 12 37.4 1.8 34.9 - 40.7 37.4 N/A Available K (ug g soil-1) 12 209 18 174 - 234 207 197 Selected in situ field measurements: measured at standard depths at selected grid points Ksat (cm h-1): 15-25 cm depth 30 1.08 2.50 0.00 - 12.23 0.25 0.01 30-40 cm depth 30 0.04 0.14 0.00 - 0.78 0.01 0.00 Resistance (MPa): 10-20 cm 70 0.8 0.4 0.1 - 2.7 0.7 0.7 20-30 cm 70 1.1 0.4 0.6 - 2.4 1.0 1.0 30-40 cm 70 1.6 0.6 0.5 - 3.2 1.5 1.1

12
REFERENCES
Agronomic Interpretations Working Group. 1995. Land suitability rating system for agricultural crops: 1. Spring-seeded small grains. W.W. Pettapiece (ed.). Agriculture and Agri-Food Canada, Centre for Land and Biological Resources Research, Ottawa, ON. Tech. Bull. 1995-6E, 90 pp. + maps.
Alberta Land Resource Unit. 1995. Soil group map of Alberta. Agriculture and Agri-Food Canada and Alberta Agriculture, Food and Rural Development, Edmonton, AB. Map.
Alberta Soil Series Working Group. 1993. Alberta soil names: Generation 2. User's handbook. L.J. Knapik and J.A. Brierley (eds.). Alberta Research Council, Publications, Edmonton, AB. 142 pp. + map.
AOAC (Association of Official Agricultural Chemists). 1955. Official methods of analysis. Eighth ed. Washington, D.C.
Bascombe, C.L. 1961. Calcimeter for routine use on soil samples. Chem. Ind., Part II: 1826-1827.
Brierley, J.A., Mermut, A.R. and Stonehouse, H.B. 1996. A new Order in the Canadian System of Classification: Vertisolic soils. Agriculture and Agri-Food Canada, Research Branch, Edmonton, AB. CLBRR Publ. No. 96-11. 76 pp.
Cihacek, L.J. and Bremner, J.M. 1979. A simplified ethylene glycol monoethyl ether procedure for assessment of surface area. Soil Sc. Soc. Am. J. 43:821-822.
Day, J.H. (ed). 1983. The Canada Soil Information System (CanSIS). Manual for describing soils in the field. Expert Committee on Soil Survey. 1982 revised ed. Agric. Can., Research Br., L.R.R.I. Contribution No. 82-52. 97 pp. + appendices.
Ecological Stratification Working Group. 1995. A national ecological framework for Canada. Agriculture and Agri-Food Canada, Centre for Land and Biological Resources Research and Environment Canada, State of the Environment Directorate, Ottawa, ON. 125 pp. + map.
Ecoregions Working Group. 1989. Ecoclimatic regions of Canada, first approximation. Ecoregions Working Group of the Canada Committee on Ecological Land Classification.
Env. Can., Canadian Wildlife Service, Ottawa, ON. Ecological Land Classification Series, No. 23, 119 pp and map.
ECSS (Agriculture Canada Expert Committee on Soil Survey). 1987. The Canadian system of soil classification. 2nd ed. Agric. Can. Publ. 1646. 164 pp.
Environment Canada, Atmospheric Environment Services. Canadian Climate Normals 1961-1990 [Online]. (1998, February 12). Available HTTP: http://www.cmc.doe.ca/climate/normals/ALTAP005.HTM. [April 1, 1998].
Green, R. 1972. Geological map of Alberta. Research Council of Alberta, Map 35.
Knudsen, D., Peterson, G.A. and Pratt, P.F. 1982. Lithium, sodium, and potassium. Pages 225-246 in A.L. Page (ed.) Methods of soil analysis part 2 chemical and microbiological properties, 2nd edition. American Society of Agronomy. Madison, Wisconsin.
Kodama, H., Scott, G.C. and Miles, N.M. 1977. X-ray quantitative analysis of minerals in soils. Research Branch, Agriculture Canada, Ottawa, ON.
Marshall, I.B., Smith, C.A. and Selby, C.J. 1996. A national framework for monitoring and reporting on environmental sustainability in Canada. Environmental Monitoring and Assessment 39: 25-38.
Mathur, S.P. and Wang, C. (eds). 1991. Soil quality in the Canadian context. Research Branch, Agric. Can., LRRC Contrib. No. 89-12, 62 pp.
McKeague, J.A. (ed.) 1978. Manual on soil sampling and methods of analysis, 2nd edition. Can. Soil Sci. Soc.
McKeague, J.A., Wang, C. and Coen, G.M. 1986. Describing and interpreting the macrostructure of mineral soils - a preliminary report. Tech. Bull. 1986-2E, Research Branch, Agric. Can., Ottawa. 47 pp.
Odynsky and Newton. 1950. Soil survey of the Rycroft and Watino sheets. Alberta Soil Survey Report No. 15. University of Alberta, Edmonton, AB, Bull. No. 53. 84 pp. + maps.

13
Pettapiece, W.W. 1986. Physiographic subdivisions of Alberta. Agric. Can., Research Br., L.R.R.C. Map.
Reynolds, W.D. 1993. Saturated hydraulic conductivity: field measurement. Pages 599-613 in M.R. Carter (ed.). Soil sampling and methods of analysis. Lewis Publishers, Boca Raton, Florida.
Sheldrick, B.H. 1984. Analytical methods manual. LRRI Contrib. No. 84-30, Research Br., Agric. Can., Ottawa.
Sheldrick, B.H. and Wang, C. 1993. Particle-size distribution. Pages 499-511 in M.R. Carter (ed.). Soil sampling and methods of analysis. Lewis Publishers, Boca Raton, Florida.
Star Quality Samplers. 1990. Centre Cone Pene-trometer. Use and interpretation information. Edmonton, AB. 7 pp.
Topp, G.C., Galganov, Y.T., Ball, B.C., and Carter, M.R. 1993. Soil water desorption curves. Pages 569-579 in M.R. Carter (ed.). Soil sampling and methods of analysis. Lewis Publishers, Boca Raton, Florida.
USDA (United States Department of Agriculture) Soil Conservation Service. 1984. Procedures for collecting soil samples and methods of analysis for soil survey. Soil Survey Investigations Rpt. No. 1, 68 pp.
White, W.M. 1993. Dry aggregate distribution. Pages 659-662 in M.R. Carter (ed.). Soil sampling and methods of analysis. Lewis Publishers, Boca Raton, Florida.

14

15
APPENDIX A: PEDON DESCRIPTIONS Two pedons representing the prevailing soil series (Falher, FAL) were described and sampled in detail when the site was established. Locations of the two pedons are shown in Fig. 2. Descriptions and selected analytical data follow. Other available data for some or all horizons include cation exchange capacity, exchangeable cations (Na, Ca, Mg, K), available P and K, electrical conductivity and soluble salts, mineralogical analysis, and soil moisture retention and bulk density from core samples.
PEDON 1: FALHER SERIES (FAL)
ID and Location: 03-AB, Pedon 1 (P1, Figure 2); LSD6-SW1-78-22-W5 Described by: B.D. Walker; October 9, 1991 Classification Gleyed Dark Gray Chernozem (ECSS 1987), Solonetzic variant;
Gleyed Vertic Dark Gray Chernozem (Brierley et al. 1996), Solonetzic variant Parent material: Very fine textured (clayey), weakly calcareous, weakly saline, glaciolacustrine material Landscape: Level; sloping slightly (0.4% towards the southwest) Drainage: Imperfectly drained Land use: Cropland; flexible cereal-canola-cereal-legume rotation
Horizon
Depth (cm)
Description
Ap 0-22 Very dark gray (10YR 3/1 m), dark gray (10YR 4/1 d); silty clay; weak to moderate, very fine to coarse, subangular blocky; friable, hard; plentiful, micro & very fine roots; many, micro and very fine pores; abrupt, wavy boundary; 20-25 cm thick; acid.
Btg 22-56 Very dark gray (5Y 3/1 m); heavy clay; many, fine, prominent, dark yellowish brown (10YR 4/4) mottles; moderate to strong, medium & coarse, blocky and weak, fine, blocky; firm; continuous, thin clay films in all voids/channels and ped faces; plentiful, micro & very fine, random roots; common, micro and very fine pores; clear, wavy boundary; 30-37 cm thick; neutral.
Btnj 56-68 Very dark gray (2.5Y 3/1 m); heavy clay; moderate to strong, medium & coarse, subangular blocky and weak, fine blocky; very firm; continuous, thin clay films in all voids/channels and ped faces; plentiful, micro & very fine, random roots; common, micro to very fine pores; clear, wavy boundary; 10-20 cm thick; neutral.
BCk 68-74 Very dark gray (2.5Y 3/1 m); heavy clay; moderate to strong, medium & coarse, subangular blocky and weak, fine blocky; very firm; continuous, thin clay films in all voids/channels and ped faces; plentiful, micro to very fine, random roots; common, micro & very fine pores; weakly calcareous; abrupt, wavy boundary; 5-9 cm thick; neutral.
BCkss 74-131 Very dark gray (2.5Y 3/1 m); heavy clay; few, fine, distinct, dark brown (10YR 3/3) mottles; moderate to strong, medium & coarse, subangular blocky and weak, fine blocky; firm; many, thin, clay films in all voids/channels and ped faces; few, micro to very fine, random roots; common, micro & very fine pores; weakly calcareous; common, coarse, friable, pale brown (10YR 6/3), random streaks and bands of secondary carbonate; slickensides common; gradual, wavy boundary; 52-60 cm thick; alkaline.
Cksgj 131-165 Very dark grayish brown (2.5Y 3/2 m); heavy clay; many, medium, distinct, dark brown (10YR 3/3) mottles; weak to moderate, fine, medium & coarse, subangular blocky and very weak, fine platy (varved); firm; many, very thin, clay films in all voids/channels and ped faces; few, micro & very fine, random roots; few, micro to very fine pores; weakly calcareous; gradual, wavy boundary; 25-35 cm thick; alkaline.
Ckgs 165-200 Olive gray (5Y 4/2 m); heavy clay (varved); many, coarse, prominent, dark yellowish brown (10YR 4/4) mottles; weak, coarse, subangular blocky and very weak, fine to medium pseudo platy; firm; many, very thin, clay films in many voids/channels and on some ped faces; few, micro & very fine, random roots; few, micro to very fine pores; weakly calcareous; alkaline.
16
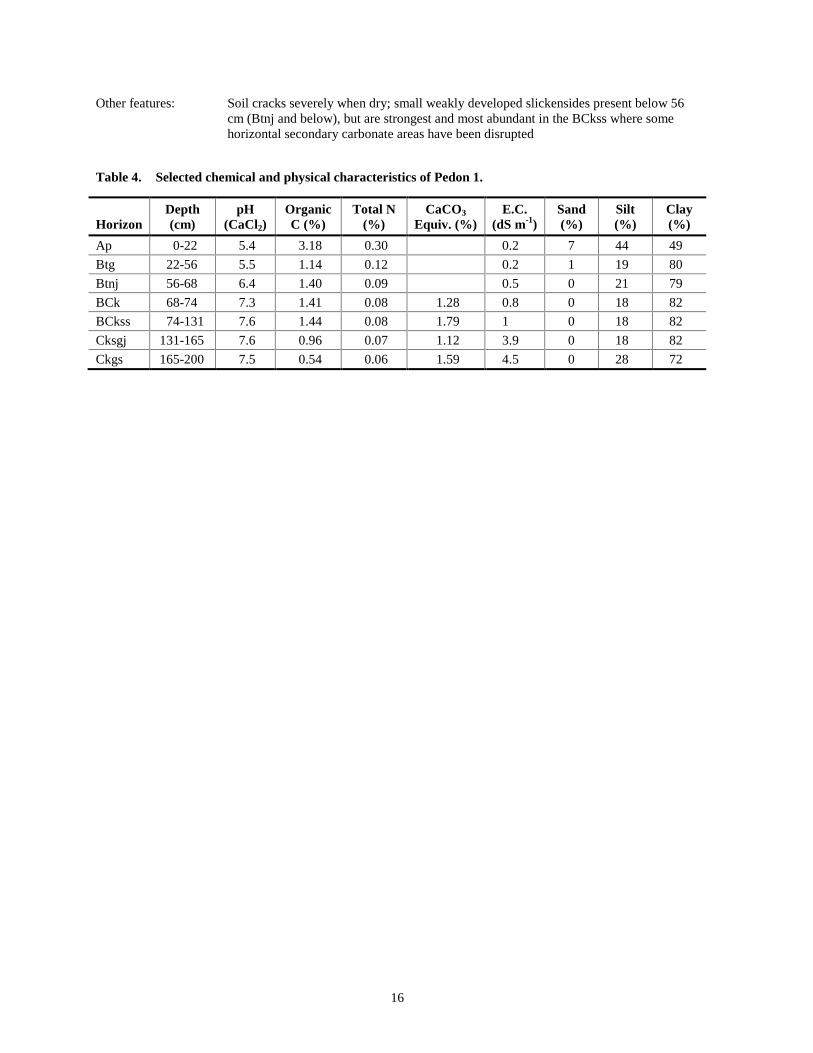
Other features: Soil cracks severely when dry; small weakly developed slickensides present below 56 cm (Btnj and below), but are strongest and most abundant in the BCkss where some horizontal secondary carbonate areas have been disrupted
Table 4. Selected chemical and physical characteristics of Pedon 1.
Horizon
Depth (cm)
pH (CaCl2)
Organic C (%)
Total N (%)
CaCO3 Equiv. (%)
E.C. (dS m-1)
Sand (%)
Silt (%)
Clay (%)
Ap 0-22 5.4 3.18 0.30 0.2 7 44 49 Btg 22-56 5.5 1.14 0.12 0.2 1 19 80 Btnj 56-68 6.4 1.40 0.09 0.5 0 21 79 BCk 68-74 7.3 1.41 0.08 1.28 0.8 0 18 82 BCkss 74-131 7.6 1.44 0.08 1.79 1 0 18 82 Cksgj 131-165 7.6 0.96 0.07 1.12 3.9 0 18 82 Ckgs 165-200 7.5 0.54 0.06 1.59 4.5 0 28 72

17
PEDON 2: FALHER SERIES (FAL)
ID and Location: 03-AB, Pedon 1 (P1, Figure 2); LSD6-SW1-78-22-W5 Described by: B.D. Walker; October 9, 1991 Classification: Gleyed Dark Gray Chernozem (ECSS 1987), Solonetzic variant;
Gleyed Vertic Dark Gray Chernozem (Brierley et al. 1996), Solonetzic variant Parent material: Very fine textured (clayey), weakly calcareous, weakly saline, glaciolacustrine material Landscape: Level; sloping slightly (0.4% towards the southwest) Drainage: Imperfectly drained Land use: Cropland; flexible cereal-canola-cereal-legume rotation
Horizon
Depth (cm)
Description
Ap 0-23 Very dark gray to black (10YR 2.5/1 m), dark gray (10YR 4/1 d); clay; weak to moderate, very fine to coarse, subangular blocky; friable, hard; plentiful, micro & very fine roots; many, micro & very fine pores; abrupt, smooth boundary; 21-26 cm thick; acid.
AB 23-27 Dark olive gray (5Y 3/2 m); clay; many, medium, prominent, dark yellowish brown (10YR 3/4) mottles; massive breaking to very weak, coarse blocky; firm; common, very thin, clay films on some ped faces; few, micro & very fine, random roots; common, micro & very fine pores; clear, broken boundary; 0-7 cm thick; neutral.
Btg 27-57 Very dark gray (2.5Y 3/1 m); heavy clay; many, fine, prominent, dark yellowish brown (10YR 3/4) mottles; moderate, medium & coarse, subangular blocky and weak, very fine & fine blocky; very firm; continuous, thin clay films in all voids/channels and ped faces; plentiful, micro to very fine, random roots; common, micro & very fine pores; clear, wavy boundary; 28-34 cm thick; neutral.
Btnj 57-71 Very dark gray to black (5Y 2.5/1 m); heavy clay; moderate to strong, fine & medium blocky; very firm; continuous, thin clay films in all voids/channels and ped faces; plentiful, micro & very fine, random roots; common, micro & very fine pores; clear, wavy boundary; 12-17 cm thick; neutral.
BC 71-75 Very dark gray to black (5Y 2.5/1 m); heavy clay; moderate to strong, fine & medium blocky; very firm; continuous, thin clay films in all voids/channels and ped faces; plentiful, micro & very fine, random roots; common, micro & very fine pores; clear, wavy boundary; 12-17 cm thick; neutral.
BCkss 75-120 Very dark gray to black (5Y 2.5/1 m); heavy clay; weak to moderate, fine & medium blocky; firm; common, very thin, clay films in many voids/channels and on some ped faces; plentiful, micro & very fine, random roots; common, micro & very fine pores; weakly calcareous; many, coarse, friable, light brownish gray (2.5Y 6/1), vertical & horizontal streaks and bands of secondary carbonate; slickensides common; gradual, wavy boundary; 40-49 cm thick; alkaline.
Csk 120-170 Very dark gray (5Y 3/1 m) and light olive brown (2.Y 5/3 m); heavy clay (varved); weak, fine to coarse, subangular blocky and very weak, fine to medium pseudo platy; friable; common, very thin, clay films in many voids/channels and on some ped faces; few, micro & very fine, random roots; few, micro & very fine pores; alkaline.
Other features: Soil cracks severely when dry; slickensides definitely most abundant in the BCkss horizon where they occupy about 10% of the exposed pit face

18
Table 5. Selected chemical and physical characteristics of Pedon 2.
Horizon
Depth (cm)
pH (CaCl2)
Organic C (%)
Total N (%)
CaCO3 Equiv. (%)
E.C. (dS m-1)
Sand (%)
Silt (%)
Clay (%)
Ap 0-23 5.2 3.88 0.37 0.4 7 36 57 AB 23-27 5.5 1.02 0.1 0.3 4 37 59 Btg 27-57 5.8 1.01 0.09 0.4 1 21 78 Btnj 57-71 6.8 1.40 0.09 0.00 1.0 0 21 79 BC 71-75 7.4 1.40 0.08 0.64 1.3 0 17 83 BCkss 75-120 7.6 1.53 0.08 1.87 1.4 0 18 82 Csk 120-170 7.5 1.19 0.07 0.76 4.5 0 13 87


![Site Safety Documentation[1]](https://static.fdocuments.in/doc/165x107/577d1ee51a28ab4e1e8f7b82/site-safety-documentation1.jpg)