
Benchmark Report 2017 - Blackbaud€¦ · vertical measurements in the benchmark tables throughout...
57
Benchmark Report 2017
Transcript of Benchmark Report 2017 - Blackbaud€¦ · vertical measurements in the benchmark tables throughout...

Benchmark Report 2017

2 800.443.9441 [email protected] www.blackbaud.com December 2017
OverviewWe’re happy to bring you the Blackbaud Luminate OnlineTM Benchmark Report for the
11th straight year. We do this work to help detect and surface trends within nonprofit
fundraising and engagement programs. These email list (housefile), engagement, and
fundraising benchmarks can help you evaluate the health of your program and discover
potential areas for growth.
We include insight into performance metrics from over 700 nonprofits to help
organizations gauge how they’re performing relative to their peers.
Ultimately the best benchmarks are your own. We hope this information inspires you
to benchmark your own year-over-year performance and use this information to grow
support for your mission.
About this StudyThis report includes aggregate data from July 1, 2016–June 30, 2017, from 707 mature
Blackbaud Luminate Online customers—all with at least 3 years of consecutive usage
data. Collectively over this one-year period, these organizations raised over $1.7 billion
dollars, handled almost 25 million transactions, and sent over 6.4 billion emails.
This large data sample comes directly from our Blackbaud Luminate Online cloud-based
platform, giving us a unique view of the nonprofit industry’s online engagement.
We base each year-over-year measurement on a consistent set of clients in each metric
to ensure that we’re comparing apples-to-apples. Metrics found in this report cannot
be compared with the same metrics found in prior reports as the specific organizations
included will differ. Although we include some commentary with the statistics, we prefer to
primarily cover “what is” rather than “why.” We try to spotlight the trends and where things
are moving.
Contents2 Overview
4 Key Findings
5 Vertical Highlights
17 Giving
27 Email Housefile
36 Email Performance
49 Advocacy
54 Conclusion

Organization ClassificationWe use self-classified National Taxonomy of Exempt Entity (NTEE) verticals
as our categorization guideline. Canadian organizations have been
included directly in the mix with their U.S. counterparts. Organizations
that raise 90% of their reported funds through peer-to-peer events using
Blackbaud TeamRaiser® have been excluded from this study. The vertical
categories are as follows:
• Animal Welfare
• Arts and Culture
• Disaster and International Aid
• Environment and Wildlife
• Faith-Based
• Food Banks
• Health Services and Research
• Hospital Foundations and Hospitals
• Human and Social Services
• Public Affairs
• Public Broadcasting Stations
Medians and QuartilesAll values in this report are expressed as medians. We use medians
instead of averages to provide a more accurate view of the benchmarks.
This method helps de-emphasize outliers. Medians represent the middle
value between the largest and smallest in a set of numbers, so they are
less likely to be influenced by extremely high or low results for
some organizations.
For some results, we also show quartiles. A quartile is the data point
halfway between the bottom and median or median and top. They’re not
averages; they’re the metrics that fall on the dividing line between quarters
of the list.
Quartile Chart Legend
$0K$60K
$120K
$180K
$240K
$300K
$360K
$420K
$480K
$540K
$204,163
LOWER QUARTILE
MEDIAN VALUE
16.3%
YOY % CHANGE
HIGHER QUARTILE
Important note: On tables and charts where you see an industry median,
this number represents an aggregate median of all organizations in
the study for that metric. We never report on the median of the vertical
medians. If you see an industry median, it’s the median of all the hundreds
of organizations that we report on for that statistic, not the median of the
vertical medians.
3 800.443.9441 [email protected] www.blackbaud.com December 2017

4 800.443.9441 [email protected] www.blackbaud.com December 2017
Key Findings
� Expanding relationships with existing supporters was the name of the
game this year as we saw a 20.4% growth in sustainer revenue.
� Viewing online revenue as one great big pie, we saw a larger slice of the
pie—8.4% more—coming from sustainer gifts in 2017.
� Organizations received 61.5% of their revenue from established
donors this past year, with repeat giving up slightly (1.3%) from the prior
year.
� It was a year for energetic email activity. While email lists grew by 10.2%
this year, you hit send a lot, increasing the number of emails
sent by 15.4%.
� The short-term gain was more gifts. Organizations grew online
revenue by 10.2%.
� Nonprofits inspired 15% of their email lists to donate (up 2% from
2016). Some verticals got even more financial backing from their lists, with
42% of Health Services and Research supporters donating, and Food
Banks and Public Broadcasting both securing gifts from 27% of their lists.
� Did people get tired of hearing from you? Some might say yes, as open
and click rates went down, often by double digits, depending on the
type of email sent.
� Happily, conversion rates on donation emails stayed absolutely
unchanged at .04%. When people opened an email and clicked a link,
they were more inclined to donate this year.
� The value of your email list went up last year; each usable email on
your list was worth $13.24 in annual revenue. This stat can help justify
investments in organically growing your list and programs to nurture and
grow relationships with existing supporters.

Vertical Highlights
5 800.443.9441 [email protected] www.blackbaud.com December 2017
How to Use this InformationIn the Vertical Trends section, we look mainly at the year-over-year (YOY)
movement in important benchmarks. We line up performance of this vertical
(a group of similar nonprofits) next to results for the overall nonprofit industry.
• “Directional” information (YOY percent change) often proves more
useful to organizations than the absolute numbers. While one organization
might grow online fundraising from $100,000 to $120,000 and another from
$1,000,000 to $1,200,000, the gain for both represents 20%.
• Giving Trends calls out growth in a few key financial metrics for this vertical
compared to nonprofits as a whole.
• We selected the stats for Email Engagement Trends to highlight possible
relationships between email list growth, changes in number of emails sent,
and the response of supporters to these emails (in terms of opens, clicks,
and conversions).
Additional Vertical Benchmarks represent the actual figures (not a percent
change). We included some we thought were most useful. You can see more
vertical measurements in the benchmark tables throughout the rest of this report.
• Revenue per Usable Email shows the value of each valid email address in
your list. This stat can help justify investments in organically growing your list
and programs to nurture and grow relationships with existing supporters.
• Percent of Housefile that Donates measures the proportion of people on
your email list who donated in the last year. It’s one gauge of how engaged
your email list is.
• Similarly, Sustainer Revenue as a Percent of Total measures what
proportion of your total revenue comes from monthly sustainer gifts. This is
a nice steady revenue stream.
Vertical Highlights

Animal WelfareOrganizations in the Animal Welfare vertical generally focus on the
protection and well-being of companion animals. National issues drove
some urgency on advocacy and fundraising efforts after the 2016
elections, which may have contributed to strong online fundraising
growth in fiscal year (FY) 2017.
Giving Trends:
• Total online revenue grew by 12.4% in 2017, slightly higher than
the 10.2% median growth for all nonprofits.
• Almost 20% of the people on Animal Welfare email lists donated
last year, well above the industry median of 14.9%.
• Repeat and sustained giving tend to be very strong in this vertical.
Organizations received 22.5% of their total fundraising revenue
from sustainer gifts (compared to 11.6% for the industry as a
whole).
• Sustainer revenue grew by 16.3% in FY 2017.
Email Engagement Trends
• Revenue per email address was below the median ($10.81
vs. $13.24). However, we saw more of a focus in this vertical
on building a strong, loyal supporter base that gives more
often, if smaller, gifts. This was reflected in the strong sustainer
performance.
• Email lists grew at 10.5%, right on par with the industry.
• Animal welfare organizations sent 16.8% more emails and saw
falling open and click rates; however, email conversion rates
remained unchanged. This seems to indicate that people are less
likely to read your emails, unless they’re inclined to take action.
Total Online Revenue % Change
Revenue
Sustainers
Revenue per Usable Email
Industry Median
Percent of Housefile that Donates
Industry Median
Sustainer Revenue % Change
Sustainer Revenue as a % of Total
Industry Median
Email Housefile % Change
Number of Emails Sent % Change
Donation Email Open Rate % Change
Donation Email Click Rate % Change
Donation Email Conversion Rate % Change
12.4%
$10.81
$13.24
19.9%
14.9%
22.5%
16.3%
11.6%
10.5%
16.8%
-4.6%
-17.7%
0%
6 800.443.9441 [email protected] www.blackbaud.com December 2017

Arts and CultureIn this vertical, we find foundations that support museums, libraries,
parks and gardens, centers for the arts, historical preservation
societies, and similar organizations. Larger arts and cultural
organizations have a broader, often national fundraising footprint.
Smaller organizations draw on the local or regional community for
their support.
To fully understand performance in this sector, review the large charts
later in this report that show performance by organizations at the
25th and 75th quartiles. We saw a wide spread in the performance of
organizations in this sector.
Giving Trends:
• Sustainer giving boomed, with 26.5% growth this past year.
• While “give monthly” hasn’t been a traditional call to action for this
sector, it’s gaining traction. Sustainer donations represented
9.5% of annual fundraising revenue for arts and cultural
organizations compared to 11.6% of revenue for the industry.
• Online fundraising grew at a modest yet healthy rate of 6.9%
compared with the industry median of 10.2%.
Email Engagement Trends
• Email messaging programs seem to be on point. Even though
more donation emails were sent last year, we saw very healthy
(and growing) open and click rates, and conversion rates
stayed steady.
• Email lists grew at a rate of 9.2%, slightly slower than the industry
average of 10.2%.
• We also saw healthy growth in the percentage of the email list
that donate, with 2.2% growth over last year’s rates.
Total Online Revenue % Change
Revenue
Arts
Sustainers
Sustainer Revenue % Change
Sustainer Revenue as a % of Total
Industry Median
Email Housefile % Change
Number of Donation Emails Sent % Change
Donation Email Open Rate % Change
Donation Email Click Rate % Change
6.9%
26.5%
9.5%
11.6%
9.2%
5.1%
3%
1.3%
7 800.443.9441 [email protected] www.blackbaud.com December 2017

Disaster and International AidThis vertical, comprised of organizations that provide domestic
and international humanitarian relief and development assistance,
can run hot and cold. Some years the intensity and/or frequency of
natural disasters and humanitarian crises puts these organizations on
the national and international stage and creates dramatic spikes in
fundraising activity. By contrast, years without quite as many urgent
calls to action can make year-over-year growth seem less robust, but
that’s just by comparison to the go-go-go years. The timing of this
study and the data show that it was a quieter year.
Giving Trends:
• Total online revenue grew by 8%.
• Organizations in this vertical have built robust sustainer programs
with almost 20% of total fundraising coming from monthly gifts.
• This group has a high value email list with each usable email
address worth $22.66 (vs. the median of $13.24).
Email Engagement Trends
• Email lists grew at a moderate rate of 8.6%.
• A very strong 20.1% of the housefile donated (a 1.8% increase
over 2016), well ahead of the industry median of 14.9%.
• This group sent 18% more emails this year. Interestingly, while
open and click rates declined sharply, conversion rates for
donation emails stayed rock steady at 0.04%.
Total Online Revenue % Change
Revenue
Sustainers
Revenue per Usable Email
Industry Median
Percent of Housefile that Donates
Industry Median
Sustainer Revenue as a % of Total
Industry Median
Number of Emails Sent % Change
Donation Email Open Rate % Change
Donation Email Click Rate % Change
Donation Email Conversion Rate % Change
8%
$22.66
$13.24
20.1%
14.9%
19.9%
11.6%
18%
-10.9%
-20.7%
0%
8 800.443.9441 [email protected] www.blackbaud.com December 2017

Environment and WildlifeEnvironmental and wildlife organizations range from global to local with
missions to preserve and protect natural places, parks and reserves,
and wildlife. This year was one of high action for this vertical following
the 2016 elections as organizations ramped up swiftly to address
issues like legislative rollbacks and deregulation.
Giving Trends:
• Online giving shot up 21% in this vertical this year. We saw the
number of gifts from new donors grow 13.3% (twice the industry
rate of 6.7%). The number of repeat donations grew at 24.1%
(twice the industry growth rate of 11.7%).
• Sustainer revenue grew at a jaw-dropping 42%, which was
more than double the industry rate of growth—and the sharpest
increase of any vertical.
• Revenue per usable email address was a low $5.49; this may
reflect a preference in this vertical to encourage sustainers to join
at any level, even $5/month, creating a relationship that can be
cultivated toward greater lifetime value.
Email Engagement Trends
• Housefiles grew by 12.3%, a good bit faster than the industry rate
of 10.2%.
• The number of emails sent grew by 14.1%, while open, click, and
conversion rates dropped for all email types.
• The combination of dropping email conversion rates together with
steep increases in fundraising suggests that to fully understand
fundraising in this sector, we’d need to look at other factors like
social media, crowdfundraising, websites, and news coverage
that are beyond the scope of this study.
Total Online Revenue % Change
Number of First-Time Gifts % Change
Number of Repeat Gifts % Change
Revenue
Sustainers
Revenue per Usable Email
Industry Median
Sustainer Revenue % Change
Email Housefile % Change
Number of Emails Sent % Change
Donation Email Open Rate % Change
Donation Email Click Rate % Change
Donation Email Conversion Rate % Change
21.1%
13.3%
24.1%
$5.49
$13.24
42%
12.3%
14.1%
-3.7%
-5.7%
-8.9%
9 800.443.9441 [email protected] www.blackbaud.com December 2017

Faith-BasedWithin the faith-based vertical, we include organizations with missions
arising out of their faith and religious identity. Most fall within a
spectrum of social benefit organizations and communities of faith.
Giving Trends:
• Faith-based organizations received a robust $32.72 in revenue for
each usable email, the highest return of any vertical.
• Sustainer revenue represented 25% of online fundraising revenue
for this vertical. Many faith communities have a strong tradition
of giving a portion of ones’ income to the church and/or for the
common good, which aligns well with the concept of
monthly giving.
• Online giving grew by a modest 5.9%, just over half the industry
growth rate of 10.2%.
Email Engagement Trends
• Email lists grew by 11.2%, just above the industry growth rate
of 10.2%.
• While organizations in this vertical sent only slightly more emails
than in 2016 (a 1.32% increase), we saw double-digit drops
in email engagement rates, measured by open, click, and
conversion rates.
Total Online Revenue % Change
Revenue
Sustainers
Revenue per Usable Email
Industry Median
Sustainer Revenue as a % of Total
Industry Median
Email Housefile % Change
Number of Emails Sent % Change
Donation Email Open Rate % Change
Donation Email Click Rate % Change
Donation Email Conversion Rate % Change
5.9%
$31.72
$13.24
25.1%
11.6%
11.2%
1.3%
-11.5%
-19.2%
-31.7%
10 800.443.9441 [email protected] www.blackbaud.com December 2017

Food BanksThis vertical is comprised of food banks and food distribution centers
throughout the United States and Canada. Supporters can develop
close relationships with food banks as volunteers and advocates
in addition to financial contributions. With federal FY 2018 budget
proposals calling for deep cuts to food assistance, outreach strategies
for this vertical have shifted to focus on advocacy as well
as fundraising.
Giving Trends:
• Food banks had strong sustainer programs in FY 2017. They
received 16.7% of online revenue from monthly donations (the
industry median is 11.6%).
• Sustainer revenue grew by a healthy 20% in FY 2017.
• Online fundraising revenue grew by 8.36%.
Email Engagement Trends
• Email lists grew by 15.58%, compared to an industry growth rate
of 10.2%.
• Email lists turned in strong performances with 27.86% supporters
donating in 2017.
• The annual revenue received for each usable email address was
$31.46, the second highest amount for any vertical.
• This vertical sent 30.8% more emails in 2017—double the rate of
increase for the industry. Email engagement rates, measured in
opens, clicks, and conversions, dropped sharply.
Total Online Revenue % Change
Revenue
Sustainers
Revenue per Usable Email
Percent of Housefile that Donates
Sustainer Revenue % Change
Sustainer Revenue as a % of Total
Email Housefile % Change
Number of Emails Sent % Change
Donation Email Open Rate % Change
Donation Email Click Rate % Change
Donation Email Conversion Rate % Change
8.4%
$31.46
27.9%
20.1%
16.7%
15.6%
30.8%
-7.6%
-19.1%
-14.3%
11 800.443.9441 [email protected] www.blackbaud.com December 2017

Health Services and ResearchThis vertical includes organizations dedicated to medical research,
patient care and assistance, and political advocacy for a broad
spectrum of diseases and disorders. It’s the largest group of nonprofits
within this study.
Giving Trends:
• While we exclude organizations that raise 90% or more of their
revenue through peer-to-peer fundraising, it’s still a big part of
fundraising for most of these organizations. Revenue for many
types of traditional peer-to-peer events declined last year (see the
2016 Blackbaud Peer-to-Peer Fundraising Study) as independent
fundraising increases in popularity. This effect could have
impacted the 0.6% decrease in online fundraising revenue we
saw for this vertical.
• Sustainer revenue grew by 12.1% in FY 2017.
• Only 2.1% of total annual fundraising came from monthly gifts,
compared to the industry average of 11.6%.
Email Engagement Trends
• A gigantic 41.7% of people on these email lists donated in 2017.
That’s almost three times the industry average of 14.9%.
• The annual revenue received for each usable email address was
$16.06, compared to an industry average of $13.24.
• Email lists grew by 9.46% in 2017, and the number of emails sent
increased by 16.24%.
• While email open and click rates dropped sharply, donation email
conversion rates remained unchanged.
Revenue
Sustainers
Revenue per Usable Email
Percent of Housefile that Donates
Sustainer Revenue % Change
Sustainer Revenue as a % of Total
Email Housefile % Change
Donation Email Open Rate % Change
Donation Email Click Rate % Change
Donation Email Conversion Rate % Change
$16.06
41.7%
12.1%
2.1%
9.5%
-2.8%
-10.5%
0%
12 800.443.9441 [email protected] www.blackbaud.com December 2017

Hospital Foundations and HospitalsWithin the hospital foundations and hospitals vertical, we find
organizations that range from children’s hospitals and general medical
centers to specialized cancer centers in the United States and Canada.
Changes in the healthcare landscape such as reduced payments for
services, higher deductibles and default rates, and an aging population
have created a need to raise more donated funds to offset declining
revenues on the clinical side. Long focused on “hunting” for very
large gifts, this vertical has shifted its approach relatively recently to
fundraising strategies inclusive of individual and sustainer giving.
Giving Trends:
• This vertical had a very good fundraising year, with 14% growth
in online transaction revenue.
• Hospitals saw a 32.4% increase in sustainer revenue, the
strongest of any vertical.
• With only 3.95% of total fundraising revenue coming from
sustainer gifts, this vertical has plenty of potential to expand
in this area.
• Hospitals have a very active donor base, with 22.4% of all
constituents donating last year. That’s 5.4% growth!
Email Engagement Trends
• Email lists grew by 14.8%, a good bit faster than the industry rate
of 10.2%.
• Hospitals saw annual revenue of $24.59 for every usable email
address in their housefile. That’s the highest rate of return
of all verticals.
Total Online Revenue % Change
Revenue
Sustainers
Revenue per Usable Email
Industry Median % Change
Percent of Housefile that Donates % Change
Industry Median % Change
Sustainer Revenue % Change
Sustainer Revenue as a % of Total
Industry Median % Change
Industry Median % Change
Email Housefile % Change
Percent of Housefile that Donates
14.1%
10.2%
5.4%
1.9%
22.4%
32.4%
20.4%
4%
14.8%
10.2%
$24.59
13 800.443.9441 [email protected] www.blackbaud.com December 2017

Human and Social ServicesIn the human and social services vertical, we find social benefit
organizations for children, youth, families, the elderly, and disabled.
Also included are home-building programs, homeless shelters, and
community centers.
Giving Trends:
• Online transaction revenue grew by 7.4%, a good growth rate
that is consistent with performance in this vertical for the past
several years.
• Sustainer revenue performance is a highlight for this vertical.
Sustainer revenue grew by 17.2%, a rather exciting increase. Past
reports have shown that organizations in this vertical tended to
have relatively small sustainer programs. We like to see growth in
this steady, reliable revenue stream.
• Sustainer revenue as a percentage of total fundraising increased
by a vigorous 11.2% (compared to the industry growth
rate of 8.4%).
Email Engagement Trends
• Email lists grew by 10.5%, and organizations sent 12.8% more
emails than the prior year.
• Email engagement rates, measured in opens and clicks, declined
at a rate consistent with the industry.
• While donation email conversion rates declined by 16.7%, 11% of
all supporters donated last year, an increase of 1.9%
over FY 2016.
Total Online Revenue % Change
Revenue
Sustainers
Percent of Housefile that Donates
Sustainer Revenue % Change
Sustainer Revenue as a % of Total
Email Housefile % Change
Number of Emails Sent % Change
Donation Email Open Rate % Change
Donation Email Click Rate % Change
Donation Email Conversion Rate % Change
7.4%
11.1%
17.2%
6.9%
10.5%
12.8%
-4.8%
-16.1%
-16.7%
14 800.443.9441 [email protected] www.blackbaud.com December 2017

Public AffairsIn the public affairs vertical, we find a wide variety of organizations with
the chief aim of impacting laws, regulations, and social norms within
their mission area.
It’s been a busy year for public affairs organizations with the United
States elections in 2016. Organizations with missions involving
legislative and policy change or current events experienced rocketing
growth, while organizations less impacted by this activity showed
more modest growth. To fully understand performance in this sector,
review the large charts later in this report that show performance by
organizations at the 25th and 75th quartile.
Giving Trends:
• Online revenue grew 21.2%, double the industry rate of growth.
• Revenue from first-time donors grew by over 30%, while revenue
from established donors grew by 18.45%—both figures well
beyond the median for all nonprofits.
• While the percentage of the email list that donates grew by
3% this past year, at 3.9% it’s still relatively low. Public policy
supporters often volunteer and advocate; the value of their
contribution is not strictly monetary.
Email Engagement Trends
• Email lists grew at a relatively modest 8.3% compared to the
industry average of 10.2%.
• Supporters responded to calls to action they saw as relevant
and urgent. While organizations sent an average of 20% more
emails, unlike most verticals, we didn’t see a dramatic falloff in
engagement. Open, click, and conversion rates for donation
emails either increased or stayed steady.
• Revenue per usable email address grew by a huge 11.6%!
Total Online Revenue % Change
Revenue
Sustainers
Revenue per Usable Email % Change
Percent of Housefile that Donates
Sustainer Revenue % Change
Email Housefile % Change
Number of Emails Sent % Change
Donation Email Open Rate % Change
Donation Email Click Rate % Change
Donation Email Conversion Rate % Change
Revenue from First-Time Donors % Change
Revenue from Repeat Donors % Change
21.2%
30.7%
18.5%
11.6%
3.9%
26.8%
8.3%
19.8%
2.7%
0%
0%
15 800.443.9441 [email protected] www.blackbaud.com December 2017

Public Broadcasting StationsThis vertical is comprised of publicly supported television and radio
stations in the United States. Most public broadcasting stations have
a strong tradition of “membership” development, and as a result,
many have industry-leading sustainer programs. There is an art to
growing a strong base of recurring revenue; clearly, we might study
techniques used by these public broadcasting stations for managing
and expanding relationships with sustaining donors.
Giving Trends:
• Online giving grew by 18.1%, well ahead of the industry average
of 10.2% growth.
• Sustainer revenue was up by 32% over the prior year.
• Public broadcasting stations received 46% of their online revenue
from sustainer gifts (compared to an industry average of 11.6%).
Email Engagement Trends
• A huge 27.2% of the email list donated in 2017, and each email
address was worth $24.00 annually. The industry average is
$13.24. These are some valuable email lists!
• Email list size grew by a modest 9% over the prior year.
• Number of emails sent grew by 28%. With housefile growth at
only 9%, this means supporters received a lot more emails.
• Email engagement saw declines, with donation email click rates
going down 18.3% and conversions down 26.4%.
Total Online Revenue % Change
Revenue
Sustainers
Revenue per Usable Email
Percent of Housefile that Donates
Sustainer Revenue % Change
Email Housefile % Change
# of Emails Sent % Change
Donation Email Open Rate % Change
Donation Email Click Rate % Change
Donation Email Conversion Rate % Change
Sustainer Revenue as a % of Total
18.1%
$24.00
27.3%
31.8%
46.1%
9.1%
27.6%
-3.8%
-18.3%
-26.4%
16 800.443.9441 [email protected] www.blackbaud.com December 2017

18 800.443.9441 [email protected] www.blackbaud.com December 2017
Online Fundraising RevenueMix by Gift Type
GivingWe saw online fundraising rise by a healthy 10.2% last year. The big headline is that sustainer
giving grew by more than 20% over the prior year. While one-time gifts and annual gifts are
still important sources of revenue, we love to see this growth in sustainer programs. It means
you’re doing a great job nurturing relationships to build a steady, predictable base of support
for your mission.
The trend toward double-digit growth in sustainer revenue mirrors growth in the for-profit
sector of the subscription economy (think businesses like Netflix® and Spotify®). People
are becoming more inclined to “subscribe” to services (and causes) they prefer. According
to Zuora’s The Subscription Economy Index (2nd Edition, June 2017), “Subscription
businesses grew revenues about 8 times faster than S&P 500 company revenues
(15.2% vs. 2.0%) and about 5 times faster than U.S. retail sales (15.2% vs. 3.4%)
from January 1, 2012, to March 30, 2017.”
You’re 100% on trend if you’re encouraging people to become sustainers. This lets them
support your cause in a way that’s consistent and easy for them. And sustainer programs
provide steady, reliable revenue for your organization. With new technology available that
helps you track giving and update credit cards automatically when gifts fail, these programs
are easier than ever to maintain over the long haul.
In these pie charts, we look at the type of gifts that make up the overall online giving mix.
Each online gift is either first time or repeat, and each gift is also either sustainer or non-
sustainer. First-time transactions are from new constituents, while repeat gifts are from
established constituents. Sustainer transactions are from recurring (monthly) gifts that might
be from new or established (repeat) donors.
The percent change metrics refer to how the balance has shifted over the last year.
First-Time vs. Repeat Transactions
Repeat Gifts
-2% YOY
1.3% YOY61%
First-Time Gifts 39%
Sustainer vs. Non-Sustainer
Sustainer 11%
Non-Sustainer 89%-0.6% YOY
8.4% YOY
19 800.443.9441 [email protected] www.blackbaud.com December 2017
Online Fundraising Revenue Growth by Transaction Type(Total Online Transaction Revenue Year-Over-Year Change)
Total Fundraising
First-Time Donations
Repeat Donations
Sustainer Donations
10.2%
0.0%2.0%
4.0%6.0%
8.0%
10.0
%
12.0
%
14.0
%
16.0
%
18.0
%
20.0%
11.7%
6.7%
20.4%

Fundraising Revenue by Vertical(Total Online Transaction Revenue)
$0K$250K
$500K
$750K
$1,000K
$1,250K
$1,500K
$1,750K
$2,000K
$2,250K
$2,500K
$2,750K
$3,000K
$3,250K
$3,500K
$3,750K
$4,000K
$4,250K
$4,500K
$4,750K
$5,000K
Animal Welfare
Arts and Culture
Association and Membership
Disaster and International Aid
Environment and Wildlife
Faith-Based
Food Banks
Health Services and Research
Higher Education
Hospital Foundations and Hospitals
Human and Social Services
Public Affairs
Public Broadcasting Stations
Industry Median
$689,688
$992,343
$349,205
$1,637,099
$630,494
$1,168,005
$1,054,042
$670,728
$1,068,456
$786,472
$265,292
$478,579
$1,605,203
$676,025
12.4%
6.9%
16.2%
8.0%
21.1%
5.9%
8.4%
-0.6%
1.2%
14.1%
7.4%
21.2%
18.1%
10.2%
20 800.443.9441 [email protected] www.blackbaud.com December 2017

Fundraising Revenue by Housefile Size(Total Online Transaction Revenue)
$0K
$2,000K
$4,000K
$6,000K
$8,000K
$10,000K
$12,000K
$14,000K
$16,000K
$18,000K
$20,000K
$22,000K
1–2,499
2,500–9,999
10,000–24,999
25,000–74,999
75,000–124,999
125,000–199,999
200,000–349,999
350,000–499,999
500,000–749,999
750,000–999,999
1,000,000+
$88,429
$160,550
$291,089
$680,720
$818,029
$1,356,521
$1,387,544
$5,568,522
$2,399,227
$3,673,872
$7,865,864
13.1%
5.7%
6.8%
11.3%
8.5%
9.1%
10.1%
19.0%
17.7%
14.2%
11.9%
21 800.443.9441 [email protected] www.blackbaud.com December 2017

22 800.443.9441 [email protected] www.blackbaud.com December 2017
Average Transaction(Online Transaction Revenue/Count of Online Transactions)
Total Fundraising
First-Time Donations
Repeat Donations
Sustainer Donations
$0 $10 $20$30
$40$50
$60$70 $80
$90$10
0$12
0$14
0
$94.44
$104.89
$94.70
$33.73 0.8%
1.6%
0.6%
-0.5%

Average Transaction by Vertical and Transaction Type(Online Transaction Revenue/Count of Online Transactions)
23 800.443.9441 [email protected] www.blackbaud.com December 2017
Median Transaction First-Time Donations Repeat Donations Sustainer Donations
Animal Welfare $64.23 $74.52 $61.38 $28.19
Arts and Culture $90.54 $95.49 $84.46 $25.82
Association and Membership $115.38 $104.00 $123.46 $49.78
Disaster and International Aid $102.22 $152.23 $93.80 $38.02
Environment and Wildlife $71.40 $81.18 $59.84 $21.44
Faith-Based $102.23 $134.73 $95.83 $54.04
Food Banks $108.59 $119.94 $107.20 $43.17
Health Services and Research $91.47 $82.30 $96.69 $33.85
Higher Education $215.05 $201.39 $192.01 $58.98
Hospital Foundations and Hospitals $130.78 $130.39 $143.98 $35.63
Human and Social Services $151.34 $143.06 $154.86 $40.68
Public Affairs $84.84 $109.67 $80.35 $28.98
Public Broadcasting Stations $27.33 $67.83 $22.95 $13.23
Industry Median $94.44 $104.89 $94.70 $33.73

24 800.443.9441 [email protected] www.blackbaud.com December 2017
6.71%
0K20K
40K60K
80K
100K
120K
140K
150K
160K
180K
200K220K
240K260K
280K
300K
2.6%
Low %Change
$11,738 $75,532 $295,824
Median %Change
High %Change
20.4% 46.1%
Sustainer Revenue: Year-Over-Year Change(Total Online Revenue from Transactions that Are Recurring)

25 800.443.9441 [email protected] www.blackbaud.com December 2017
$0K$60K
$120K
$180K
$240K
$300K
$360K
$420K
$480K
$540K
$600K
$660K
$720K
$780K
$840K
$900K
$960K
$1,020K
$1,080K
$1,140K
$1,200K
16.3%
26.5%
33.4%
15.3%
42.0%
11.7%
20.1%
12.1%
3.4%
32.4%
17.2%
26.8%
31.8%
20.4%
$124,163
$23,120
$20,360
$244,270
$83,541
$209,379
$160,342
$21,701
$126,040
$26,225
$18,719
$61,060
$552,852
$75,532
Animal Welfare
Arts and Culture
Association and Membership
Disaster and International Aid
Environment and Wildlife
Faith-Based
Food Banks
Health Services and Research
Higher Education
Hospital Foundations and Hospitals
Human and Social Services
Public Affairs
Public Broadcasting Stations
Industry Median
Sustainer Revenue by Vertical (Total Online Revenue from Transactions that Are Recurring)

26 800.443.9441 [email protected] www.blackbaud.com December 2017
$0K$10
0K$200K
$300K
$400K
$500K
$600K
$700K
$800K
$900K
$1,000K
$1,100K
$1,200K
$1,300K
$1,400K
$1,500K
$1,600K
$1,700K
$1,800K
$1,900K
$2,000K
$2,100K
1–2,499
2,500–9,999
10,000–24,999
25,000–74,999
75,000–124,999
125,000–199,999
200,000–349,999
350,000–499,999
500,000–749,999
750,000–999,999
1,000,000+
Sustainer Revenue by House�le Size (Total Online Revenue from Transactions that Are Recurring)
29.7%
14.3%
20.3%
20.4%
14.0%
26.8%
31.2%
21.0%
31.3%
21.9%
$9,659
$20,630
$74,230
$79,191
$165,251
$208,364
$324,080
$202,863
$674,292
$502,286
Sustainer Revenue by Housefile Size (Total Online Revenue from Transactions that Are Recurring)

28 800.443.9441 [email protected] www.blackbaud.com December 2017
Constituents with Email Addresses: Year-Over-Year Change (Size of Housefile Based on Number of Constituents with Email Addresses as of Fiscal Year-End)
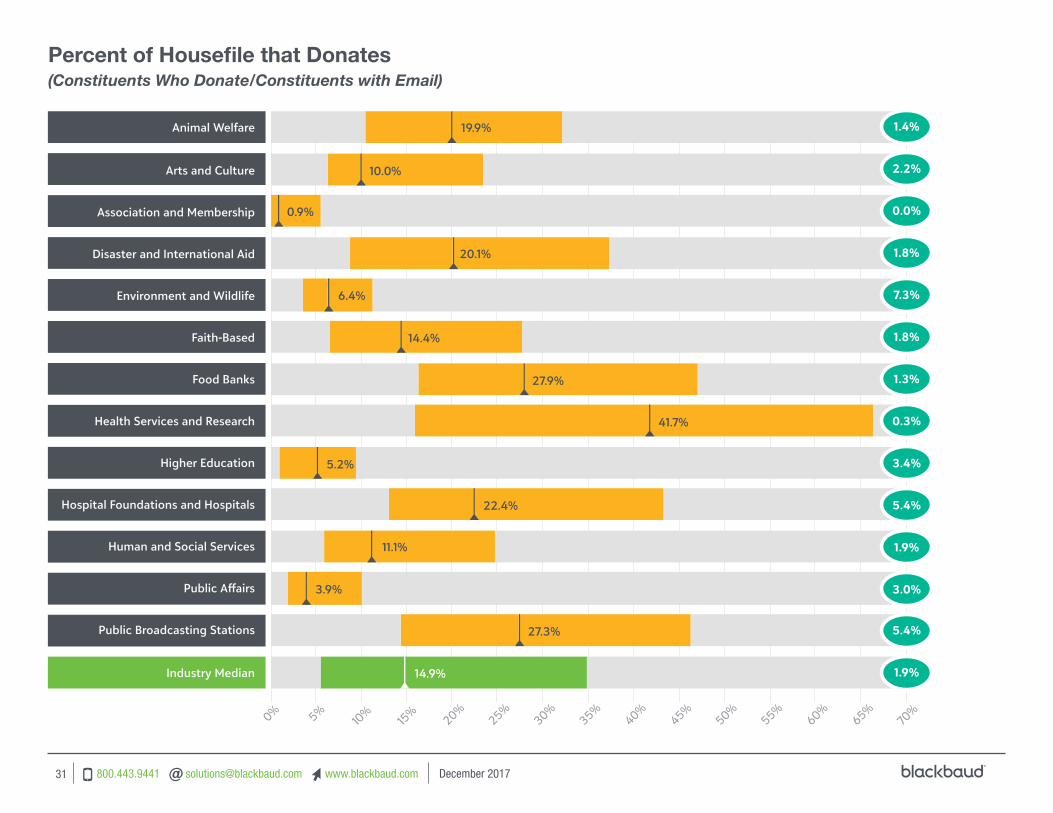
Email HousefileThis year we saw a 10.21% increase in housefile size. The number of email addresses generally impacts your ability to
communicate, cultivate, and engage with your constituents. File size often correlates to fundraising success; however, it’s
not the sole factor. Good stewardship ensures that more people within the housefile donate. In FY 2017, we saw 14.94%
of supporters donate, which is a 1.91% increase over the prior year. We also saw the mix of funding support shift by
8.41% toward more sustainer giving, which means organizations were doing a great job of messaging the importance of
committing to stable monthly funding of the mission.
$0K$20K
$40K$60K
$80K
$100K
$120K
$140K
$160K
$180K
$200K
$220K
$240K
$260K
$280K
Low %Change
25,364
4.7%
Median %Change
10.2%
70,220
High %Change
19.2%
258,654

Animal Welfare
Arts and Culture
Association and Membership
Disaster and International Aid
Environment and Wildlife
Faith-Based
Food Banks
Health Services and Research
Higher Education
Hospital Foundations and Hospitals
Human and Social Services
Public Affairs
Public Broadcasting Stations
Industry Median
0K10
0K200K
300K400K
500K600K
700K
800K900K
1,000K
1,100K
1,200K
1,300K
1,400K
1,500K
1,600K
102,644
86,168
174,333
72,373
61,956
89,642
182,239
51,121
30,440
145,648
87,674
70,220
135,932
65,529
9.2%
5.8%
8.6%
12.3%
11.2%
15.6%
9.5%
7.3%
14.8%
10.5%
8.3%
9.1%
10.2%
10.5%
29 800.443.9441 [email protected] www.blackbaud.com December 2017
Constituents with Email Addresses by Vertical(Number of Constituents with Email Addresses as of Fiscal Year-End)

0% 2% 4% 6% 8%10
%12
%14
%16
%
10.1%
2.9%
10.5%
9.4%
10%
14.4%
11.3%
10.1%
5.9%
13.7%
11.4%
1–2,499
2,500–9,999
10,000–24,999
25,000–74,999
75,000–124,999
125,000–199,999
200,000–349,999
350,000–499,999
500,000–749,999
750,000–999,999
1,000,000+
30 800.443.9441 [email protected] www.blackbaud.com December 2017
Housefile Growth by Housefile Size(Number of Constituents with Email Addresses by Email List Size)
Animal Welfare
Arts and Culture
Association and Membership
Disaster and International Aid
Environment and Wildlife
Faith-Based
Food Banks
Health Services and Research
Higher Education
Hospital Foundations and Hospitals
Human and Social Services
Public Affairs
Public Broadcasting Stations
Industry Median
0% 5%10
%15
%20%
25%30%
35%40%
45%50%
55%60%
65%70
%
19.9%
14.9%
10.0%
0.9%
20.1%
6.4%
14.4%
27.9%
41.7%
5.2%
22.4%
11.1%
3.9%
27.3%
1.4%
2.2%
0.0%
1.8%
7.3%
1.8%
1.3%
0.3%
3.4%
5.4%
1.9%
3.0%
5.4%
1.9%
31 800.443.9441 [email protected] www.blackbaud.com December 2017
Percent of Housefile that Donates(Constituents Who Donate/Constituents with Email)
0% 5%10
%15
%20%
25%30%
35%40%
45%50%
55%
8.6%
21.8%
18.0%
17.5%
17.3%
13.2%
7.7%
7.2%
7.1%
6.3%
6.4%
0.0%
1.5%
2.9%
2.2%
2.9%
1.2%
1.1%
0.1%
1.4%
0.8%
0.6%
1–2,499
2,500–9,999
10,000–24,999
25,000–74,999
75,000–124,999
125,000–199,999
200,000–349,999
350,000–499,999
500,000–749,999
750,000–999,999
1,000,000+
32 800.443.9441 [email protected] www.blackbaud.com December 2017
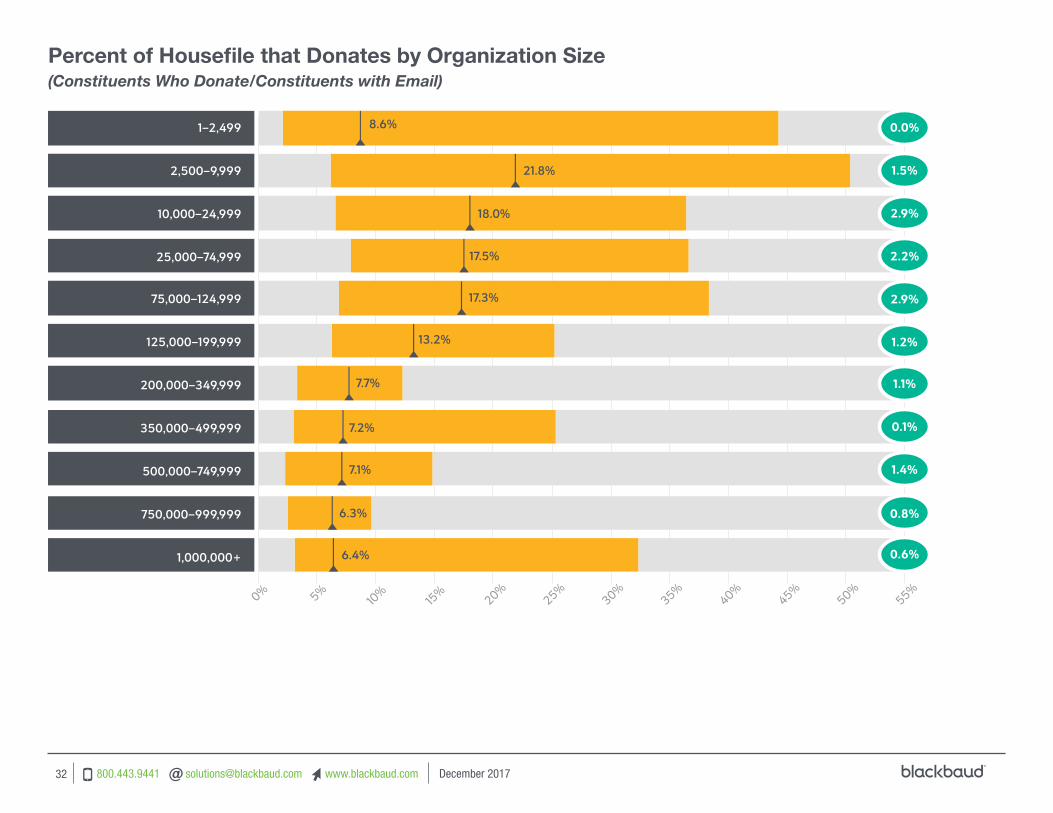
Percent of Housefile that Donates by Organization Size(Constituents Who Donate/Constituents with Email)

33 800.443.9441 [email protected] www.blackbaud.com December 2017
$0 $2 $4 $6 $8$10 $12 $14 $16 $18 $20
$22$24
$26$28
$30
Low %Change
-16.9%
$5.06
Median %Change
-1.9%
$13.24
High %Change
13%
$28.15
Revenue Per Usable Email: Year-Over-Year Change(Total Online Revenue/Constituents with Usable Email Address)

Animal Welfare
Arts and Culture
Association and Membership
Disaster and International Aid
Environment and Wildlife
Faith-Based
Food Banks
Health Services and Research
Higher Education
Hospital Foundations and Hospitals
Human and Social Services
Public Affairs
Public Broadcasting Stations
Industry Median
$0 $5$10 $15 $20
$25$30
$35$40
$45$50
$55$60
$65$70 $75
$10.81
$8.94
$2.94
$22.66
$5.49
$31.72
$31.46
$16.06
$9.37
$24.59
$12.47
$4.16
$24.00
$13.24
0.4%
1.5%
8.2%
-0.1%
11.4%
-9.3%
-4.9%
-8.3%
-13.2%
-6.4%
-10.5%
11.6%
-5.0%
-1.9%
34 800.443.9441 [email protected] www.blackbaud.com December 2017
Revenue Per Usable Email Address by Vertical (Total Online Revenue/Constituents with Usable Email Address)

$0$10 $20
$30$40
$50$60
$70 $80$90
$100
$110 $120
$130
$140
$9.05
-12.1%
-7.1%
-1.9%
-1.6%
-5.1%
-1.7%
-5.2%
5.5%
-1.2%
3.8%
$9.00
$13.85
$6.07
$3.93
$58.25
$22.38
$17.42
$18.27
$4.20
0.8%$2.86
1–2,499
2,500–9,999
10,000–24,999
25,000–74,999
75,000–124,999
125,000–199,999
200,000–349,999
350,000–499,999
500,000–749,999
750,000–999,999
1,000,000+
35 800.443.9441 [email protected] www.blackbaud.com December 2017
Revenue Per Usable Email Address by Housefile Size(Total Online Revenue/Constituents with Usable Email Address)

37 800.443.9441 [email protected] www.blackbaud.com December 2017
Email PerformanceThis year we saw big increases in the number of emails sent, along with many email-related stats. More people read and
opened emails, and more people clicked and donated. Yay? Unfortunately, the news is not all good. Because while the
volume of clicks and opens increased along with the number of emails, the rate of engagement (measured in click and open
rates) took a steep dive in many cases.
In part, this reflects the email universe we live in, where we all get too many emails from too many sources and we tune
them out. It may also speak to a deeper issue of increasing quantity without paying enough attention to differentiated
messaging and selective targeting. Without digging deep into the messaging segmentation strategy and content of
individual organizations, we can only show a correlation—that click and open rates tend to fall off when the number of
emails sent increases. One thing is for sure: if you increase the frequency you email supporters, you better make sure the
messages are timely, relevant, and personal.
Email conversion rates stayed at the same levels as in 2016. And online giving increased in all but one vertical. Factors not
measured within this report, like news cycles, website and blog updates, and nonprofits’ social media activity, could also
impact conversion and donation rates. It appears that when people open and click on an email, they’re much more inclined
to donate than in the past.
We invite you to review the email performance benchmarks from this last year and draw your own conclusions.
(Note that “email campaign type” (donation, enewsletter, advocacy, and other) is self-classified by organizations as they set
up email messages.)

38 800.443.9441 [email protected] www.blackbaud.com December 2017
Total Emails Sent(Total Number of Emails Delivered to Recipients)
0K500K
1,000K
1,500K
2,000K
2,500K
3,000K
3,500K
4,000K
4,500K
5,000K
5,500K
6,000K
6,500K
7,000K
7,500K
8,000K
Low %Change
-9.7%
380K
Median %Change
15.4%
1,658K
High %Change
40.1%
7,786K

Animal Welfare
Arts and Culture
Association and Membership
Disaster and International Aid
Environment and Wildlife
Faith-Based
Food Banks
Health Services and Research
Higher Education
Hospital Foundations and Hospitals
Human and Social Services
Public Affairs
Public Broadcasting Stations
Industry Median
-4%
-2% 0% 2% 4% 7% 9%
11% 13%
15%
17% 19%
21% 24%26%
28%30%
32%
16.8%
13.1%
-3.5%
18.0%
14.1%
1.3%
30.8%
16.2%
15.4%
17.8%
12.8%
19.8%
27.6%
15.4%
39 800.443.9441 [email protected] www.blackbaud.com December 2017
Total Emails Sent: Median Percent Change by Vertical (Total Number of Emails Delivered to Recipients, Year-Over-Year Change, Median)

-14%
-12%
-10% -8
%-6
%-4
%-2
% 0% 2% 4% 6% 8%10
%12
%14
%16
%18
%20%
22%24%
9.0%
6.5%
19.3%
22.4%
13.4%
11.2%
17.3%
17.0%
17.4%
15.2%
-13.5%1–2,499
2,500–9,999
10,000–24,999
25,000–74,999
75,000–124,999
125,000–199,999
200,000–349,999
350,000–499,999
500,000–749,999
750,000–999,999
1,000,000+
40 800.443.9441 [email protected] www.blackbaud.com December 2017
Total Emails Sent: Median Percent Change by Vertical by Housefile Size (Total Number of Emails Delivered to Recipients, Year-Over-Year Change, Median)

Fundraising Email Engagement Rates: Year-Over-Year Change(Based on Emails Delivered Where Email Campaign Type=“Fundraising Appeal”)
41 800.443.9441 [email protected] www.blackbaud.com December 2017
Total Emails Sent% Change
Open Rate% Change
Click Rate% Change
Conversion Rate% Change
Animal Welfare 17.8% -4.6% -17.7% 0.00%
Arts and Culture 5.1% 3.0% 1.3% 0.0%
Association and Membership -0.7% -9.2% -15.9% 0.0%
Disaster and International Aid 16.7% -10.9% -20.7% 0.0%
Environment and Wildlife 12.9% -3.7% -5.7% -8.9%
Faith-Based 15.7% -11.5% -19.2% -31.7%
Food Banks 31.8% -7.6% -19.1% -14.3%
Health Services and Research -1.6% -2.8% -10.5% 0.0%
Higher Education 14.5% -1.9% -14.5% 0.0%
Hospital Foundations and Hospitals 9.6% -10.0% -18.5% -15.2%
Human and Social Services 10.9% -4.8% -16.1% -16.7%
Public Affairs 2.1% 2.7% 0.0% 0.0%
Public Broadcasting Stations 49.6% -3.8% -18.3% -26.4%
Industry Median 12.5% -3.8% -15.5% 0.0%

Fundraising Email Engagement Rates by Vertical
42 800.443.9441 [email protected] www.blackbaud.com December 2017
Open Rate Click Rate Conversion Rate
Animal Welfare 13.0% 0.57% 0.04%
Arts and Culture 19.8% 0.63% 0.04%
Association and Membership 19.2% 0.49% 0.02%
Disaster and International Aid 11.8% 0.45% 0.04%
Environment and Wildlife 14.0% 0.47% 0.04%
Faith-Based 13.0% 0.60% 0.03%
Food Banks 14.5% 0.58% 0.08%
Health Services and Research 13.8% 0.49% 0.02%
Higher Education 20.4% 0.56% 0.01%
Hospital Foundations and Hospitals 21.4% 0.63% 0.06%
Human and Social Services 14.9% 0.65% 0.04%
Public Affairs 14.2% 0.53% 0.03%
Public Broadcasting Stations 16.7% 0.58% 0.05%
Industry Median 14.8% 0.55% 0.04%

Email Newsletter Engagement Rates: Year-Over-Year Change(Based on Emails Delivered Where Email Campaign Type=“Newsletter”)
43 800.443.9441 [email protected] www.blackbaud.com December 2017
Total Emails Sent% Change
Open Rate% Change
Click Rate% Change
Animal Welfare 7.3% -3.6% -20.2%
Arts and Culture 16.8% -0.1% -8.2%
Association and Membership 0.1% 4.4% -11.8%
Disaster and International Aid 3.6% -4.0% -9.8%
Environment and Wildlife 10.6% -0.2% -6.4%
Faith-Based 11.9% -6.1% -16.2%
Food Banks 1.0% -3.8% -20.6%
Health Services and Research 9.7% -4.4% -19.6%
Higher Education -3.0% 3.4% -6.3%
Hospital Foundations and Hospitals -7.5% -3.0% -14.5%
Human and Social Services 1.0% -2.4% -17.7%
Public Affairs 4.9% 0.1% -13.5%
Public Broadcasting Stations 18.9% -4.1% -12.6%
Industry Median 7.1% -2.8% -14.8%

Email Newsletter Engagement Rates by Vertical
44 800.443.9441 [email protected] www.blackbaud.com December 2017
Open Rate Click Rate
Animal Welfare 15.55% 1.30%
Arts and Culture 20.41% 1.68%
Association and Membership 22.40% 2.11%
Disaster and International Aid 13.93% 0.64%
Environment and Wildlife 15.47% 1.54%
Faith-Based 15.23% 1.44%
Food Banks 13.72% 0.93%
Health Services and Research 14.34% 1.14%
Higher Education 23.48% 2.00%
Hospital Foundations and Hospitals 22.07% 1.61%
Human and Social Services 13.36% 0.95%
Public Affairs 15.44% 1.58%
Public Broadcasting Stations 17.35% 1.03%
Industry Median 15.62% 1.25%

Email Newsletter Engagement Rates by Housefile Size
45 800.443.9441 [email protected] www.blackbaud.com December 2017
Open Rate Click Rate
2,500–9,999 21.35% 2.01%
10,000–24,999 16.99% 1.38%
25,000–74,999 15.91% 1.20%
75,000–124,999 13.21% 1.50%
125,000–199,999 16.31% 1.17%
200,000–349,999 12.99% 0.80%
350,000–499,999 10.58% 0.91%
500,000–749,999 14.27% 0.92%
750,000–999,999 12.96% 0.80%
1,000,000+ 11.80% 1.01%

“Other” Email Engagement Rates: Year-Over-Year Change(Based on Emails Delivered Where Email Campaign Type Not “Advocacy Appeal” or “Fundraising Appeal” or “Newsletter”)
46 800.443.9441 [email protected] www.blackbaud.com December 2017
Total Emails Sent% Change
Open Rate% Change
Click Rate% Change
Animal Welfare 15.7% -5.5% -21.9%
Arts and Culture 14.8% -2.9% -19.0%
Association and Membership -3.9% -3.4% -20.9%
Disaster and International Aid 18.6% -5.0% -4.0%
Environment and Wildlife 9.0% -0.2% -13.5%
Faith-Based 3.2% -1.3% -10.0%
Food Banks 9.1% -10.1% -26.6%
Health Services and Research 7.9% -5.8% -16.4%
Higher Education 1.4% -2.5% -13.9%
Hospital Foundations and Hospitals 34.4% -7.7% -21.5%
Human and Social Services 4.4% -2.6% -19.1%
Public Affairs 39.8% -9.6% -18.5%
Public Broadcasting Stations -30.3% -4.6% -9.8%
Industry Median 13.6% -5.2% -17.7%

“Other” Email Engagement Rates by Vertical(Based on Emails Delivered Where Email Campaign Type Not “Advocacy Appeal” or “Fundraising Appeal” or “Newsletter”)
47 800.443.9441 [email protected] www.blackbaud.com December 2017
Open Rate Click Rate
Animal Welfare 14.95% 0.90%
Arts and Culture 20.73% 1.78%
Association and Membership 17.05% 1.03%
Disaster and International Aid 14.10% 0.84%
Environment and Wildlife 16.54% 1.00%
Faith-Based 17.69% 0.80%
Food Banks 14.12% 0.93%
Health Services and Research 13.50% 0.93%
Higher Education 22.92% 1.35%
Hospital Foundations and Hospitals 19.66% 1.14%
Human and Social Services 16.37% 1.05%
Public Affairs 14.80% 1.06%
Public Broadcasting Stations 16.71% 0.85%
Industry Median 16.12% 1.01%

“Other” Email Engagement Rates by Housefile Size(Based on Emails Delivered Where Email Campaign Type Not “Advocacy Appeal” or “Fundraising Appeal” or “Newsletter”)
48 800.443.9441 [email protected] www.blackbaud.com December 2017
Open Rate Click Rate
2,500–9,999 23.57% 1.78%
10,000–24,999 19.62% 1.21%
25,000–74,999 17.19% 1.08%
75,000–124,999 15.33% 0.93%
125,000–199,999 16.99% 0.95%
200,000–349,999 14.46% 0.82%
350,000–499,999 12.00% 0.54%
500,000–749,999 10.90% 0.63%
750,000–999,999 12.16% 0.50%
1,000,000+ 12.78% 0.77%

Animal Welfare
Association and Membership
Disaster and International Aid
Environment and Wildlife
Faith-Based
Food Banks
Health Services and Research
Human and Social Services
Public Affairs
Industry Median
0K 5K10
K15
K20K
25K30K
35K40K
45K50K
55K60K
65K70
K75
K80K
85K
4.2%
3.4%
5.6%
9.4%
3.5%
0.0%
28.1%
3.2%
3.3%
4.5%
65,879
25,704
34,667
82,688
7,445
1,465
1,172
26,379
14,579
327
50 800.443.9441 [email protected] www.blackbaud.com December 2017
Number of Constituents Who Advocate by Vertical (Constituents Who Advocate as of Fiscal Year-End)
AdvocacyIt was a busy year for advocacy organizations with the United States elections in 2016. We saw some nonprofits whose missions involve legislative and policy change or current events experience rocketing growth. To fully understand performance in this sector, review the large charts earlier in this report that show performance by organizations at the 25th and 75th quartile.

2,500–9,999
10,000–24,999
25,000–74,999
75,000–124,999
125,000–199,999
200,000–349,999
350,000–499,999
500,000–749,999
750,000–999,999
1,000,000+
0K25K
50K75
K10
0K12
5K15
0K175
K200K
225K250K
275K
300K325K
350K375
K400K
425K
1,764
2,001
3,932
8,456
17,836
50,638
67,592
207,275
230,556
421,660
0.0%
0.0%
4.0%
4.4%
10.5%
10.8%
2.4%
7.3%
13.6%
9.5%
51 800.443.9441 [email protected] www.blackbaud.com December 2017
Number of Constituents Who Advocate by Housefile Size (Constituents Who Advocate as of Fiscal Year-End)

Chart 29Percent of All Constituents Who Advocate Vertical
Animal Welfare
Association and Membership
Disaster and International Aid
Environment and Wildlife
Faith-Based
Food Banks
Health Services and Research
Human and Social Services
Public Affairs
Industry Median
0% 2% 4% 6% 8%10
%12
%14
%16
%18
%20%
4.2%
3.4%
5.6%
9.4%
3.5%
0.0%
4.4%
3.2%
3.3%
4.5%
14.2%
1.2%
7.1%
6.0%
13.9%
19.2%
14.6%
5.5%
4.9%
6.6%
52 800.443.9441 [email protected] www.blackbaud.com December 2017
Percent of All Constituents Who Advocate by Vertical (Constituents Who Advocate/Constituents with Email)
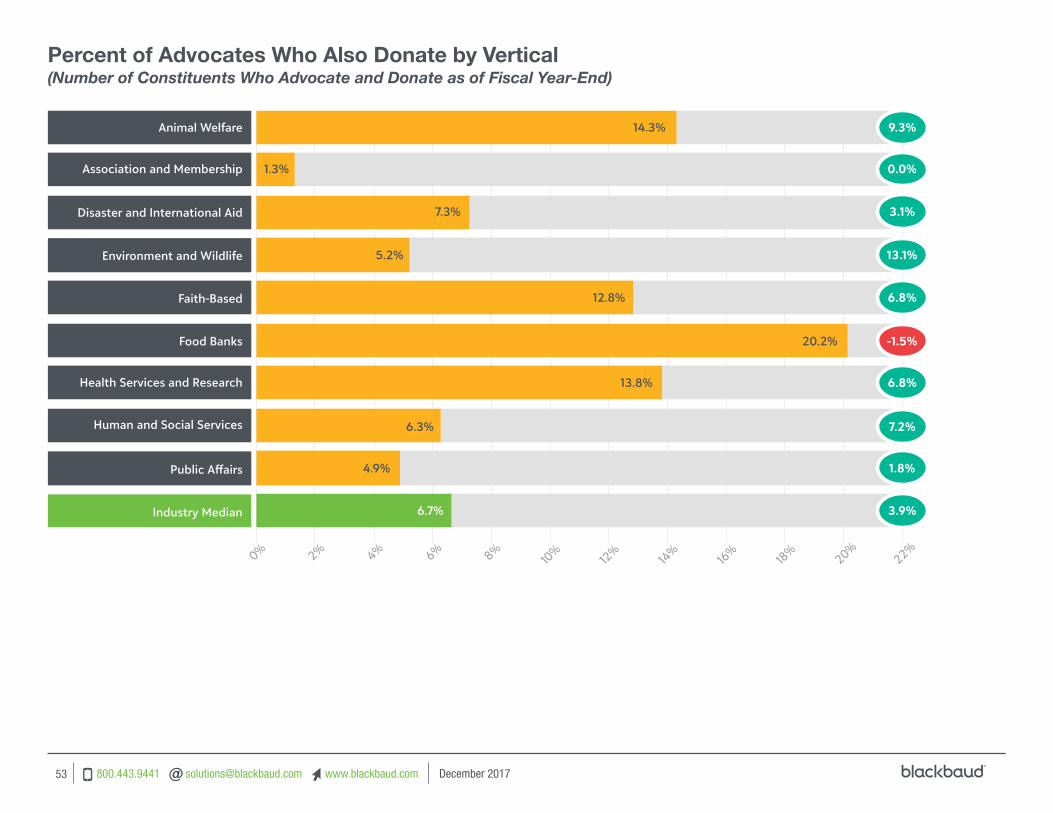
Chart 30Percent of Advocates Who Donate Vertical
Animal Welfare
Association and Membership
Disaster and International Aid
Environment and Wildlife
Faith-Based
Food Banks
Health Services and Research
Human and Social Services
Public Affairs
Industry Median
0% 2% 4% 6% 8%10
%12
%14
%16
%18
%20%
22%
9.3%
0.0%
3.1%
13.1%
6.8%
-1.5%
6.8%
7.2%
1.8%
3.9%
14.3%
1.3%
7.3%
5.2%
12.8%
20.2%
13.8%
6.3%
4.9%
6.7%
53 800.443.9441 [email protected] www.blackbaud.com December 2017
Percent of Advocates Who Also Donate by Vertical (Number of Constituents Who Advocate and Donate as of Fiscal Year-End)

Conclusion It’s a busy, crowded world out there with lots of other organizations jostling
for the attention of your supporters in their email inboxes and online. We
hope this report can help by arming you with the information you need to
benchmark your performance and guide your fundraising strategies this year
and beyond.
Methodology Study ParticipantsAs in prior years, to be included in the reported data, organizations must have
used the Blackbaud Luminate® platform consistently for a minimum of three
years through June 2017. Data from other Blackbaud online fundraising tools
was not included in this analysis.
Using the housefile and transaction data from 707 nonprofit organizations
using the Blackbaud Luminate OnlineTM platform allows us to avoid two major
sources of research bias common in many studies.
The first, called referral bias, occurs when groups that volunteer to participate
in a study often perform differently than non-volunteers. The second, called
measurement bias, occurs when comparing organizations’ results from
different sources and measuring them in different ways. This is commonly
seen when different organizations selectively include or exclude various
sources of online fundraising data, such as ecommerce, ticket sales, event
registration fees, and donation form giving when defining their online revenue.
Making valid comparisons is difficult when the data is volunteered or when
sources are self-selected or normalized to look better.
As much as we would have liked to include every Blackbaud customer in
this year’s study, our objective is to provide nonprofits with the best and
most accurate insight into how the industry fared in fiscal year 2016–2017.
As such, we excluded organizations that did not have at least 36 months of
data on the Blackbaud Luminate Online platform, as organizations migrating
to a new platform tend to perform differently than those with an established
program. Because of this exclusion, the number and composition of
organizations in our study will always vary slightly depending on when they
join Blackbaud and when they deploy additional solutions.
Some Useful Definitions
Email Housefile: The full list of supporters with email addresses
Usable Email: A valid email address that accepts messages
Total Fundraising: Every online financial transaction
First-Time Donations: Donations flagged as a person’s first online
transaction with the respective organization
Sustainer Donations: Monthly recurring transactions
Repeat Donations: Donations not flagged as a person’s first online
transaction with the respective organization
In this year’s report, we prepared a summary of metrics by the
following views:
NTEE Assigned Vertical (with some consolidation): Shows how
organizations with similar missions compare to one another
Organization Size–Valid Email Address Bands: Allows us to see if growth
or contraction is being led by large or small organizations based on the size
of the email file
55 800.443.9441 [email protected] www.blackbaud.com December 2017
Industry VerticalsOrganizations with at least 36 complete months of data on the Blackbaud
Luminate platform were combined into groups that we believed to be
similar based on a common organizational mission or vertical within
the nonprofit sector. We grouped organizations by their self-selected
NTEE verticals. In the case of Canadian organizations, we classified by
the closest vertical fit. We used this methodology to create cohorts of
organizations that are believed to perform similarly. Verticals that did
not have at least 10 similar organizations with a common mission were
excluded from this study.
We did not include all verticals in all metrics. A vertical would be excluded
if a very small sample size of customers in that vertical met the criteria.
For example, advocacy is a metric that is not as relevant for a public
broadcasting station as it might be for an environmental organization. As a
result, none of the advocacy-related metrics in this study include results for
public broadcasting stations or hospitals.
Study Universe
This study observes mature Blackbaud Luminate OnlineTM users who
showed consistent activity for a full three years (July 2013 through
June 2016). We apply this three-year rule for each type of activity within
Blackbaud Luminate Online. For example, to be included, fundraising
organizations must have had at least three full years of monthly fundraising
revenue to represent mature fundraisers on the Blackbaud Luminate
Online product.
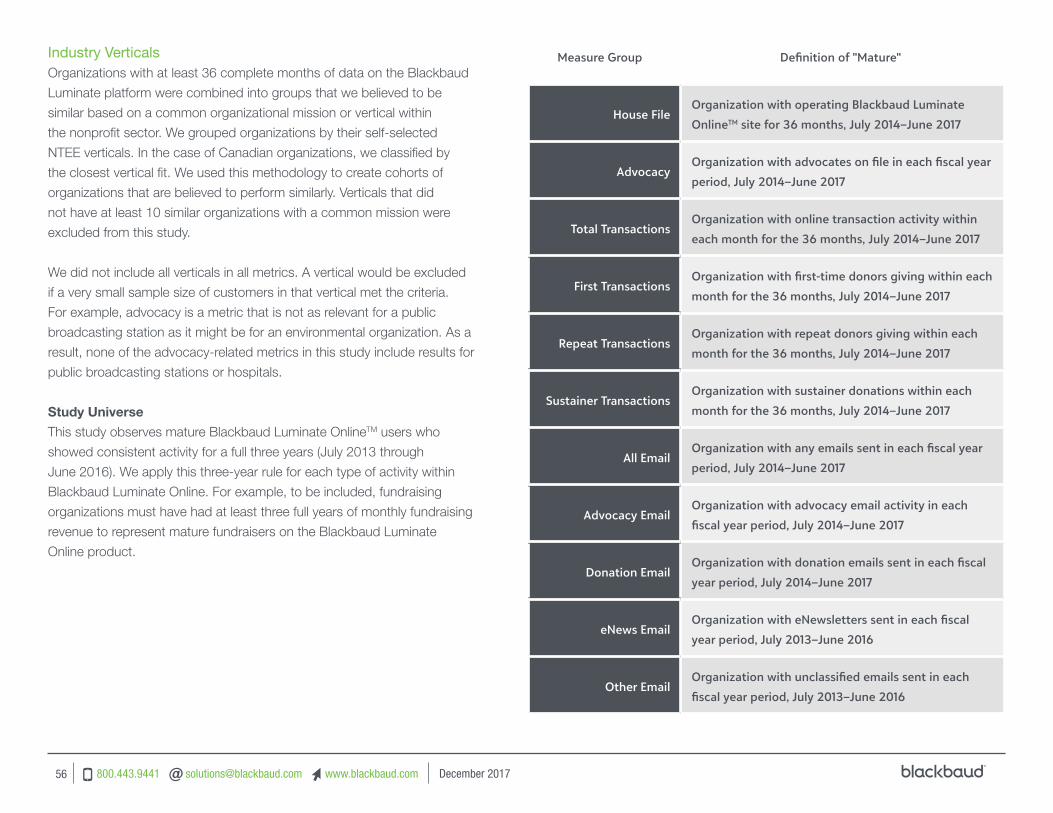
56 800.443.9441 [email protected] www.blackbaud.com December 2017
Measure Group Definition of "Mature"
House File Organization with operating Blackbaud Luminate
OnlineTM site for 36 months, July 2014–June 2017
Advocacy Organization with advocates on file in each fiscal year
period, July 2014–June 2017
Total Transactions Organization with online transaction activity within
each month for the 36 months, July 2014–June 2017
First Transactions Organization with first-time donors giving within each
month for the 36 months, July 2014–June 2017
Repeat Transactions Organization with repeat donors giving within each
month for the 36 months, July 2014–June 2017
Sustainer Transactions Organization with sustainer donations within each
month for the 36 months, July 2014–June 2017
All Email Organization with any emails sent in each fiscal year
period, July 2014–June 2017
Advocacy Email Organization with advocacy email activity in each
fiscal year period, July 2014–June 2017
Donation Email Organization with donation emails sent in each fiscal
year period, July 2014–June 2017
eNews Email Organization with eNewsletters sent in each fiscal
year period, July 2013–June 2016
Other Email Organization with unclassified emails sent in each
fiscal year period, July 2013–June 2016

57 800.443.9441 [email protected] www.blackbaud.com December 2017
Authors Kathryn Hall, Senior Product Marketing Manager
Bryan Snyder, Senior Data Analyst
ContributorsJulia Lenz, Senior Product Marketing Manager
Sophia Latto, Web Designer, Advisory
Rachel Simon, Director, Vertical Marketing
About Blackbaud Blackbaud (NASDAQ: BLKB) is the world’s leading cloud software
company powering social good. Serving the entire social good
community—nonprofits, foundations, corporations, education institutions,
and individual change agents—Blackbaud connects and empowers
organizations to increase their impact through software, services,
expertise, and data intelligence. The Blackbaud portfolio is tailored to
the unique needs of vertical markets, with solutions for fundraising and
CRM, marketing, advocacy, peer-to-peer fundraising, corporate social
responsibility, school management, ticketing, grantmaking, financial
management, payment processing, and analytics. Serving the industry
for more than three decades, Blackbaud is headquartered in Charleston,
South Carolina and has operations in the United States, Australia, Canada,
Ireland, and the United Kingdom.
For more information, visit www.blackbaud.com.
Where to Go from HereTalk data with us! Our team of experts can work with you to create your own
personalized benchmark review that provides a more in-depth analysis of
your program’s performance. Talk to your customer success manager, or
email us at [email protected].