BellSouth: A Competitive Force
81
BellSouth: A Competitive Force Analyst Briefing New York, NY November 10, 2003
Transcript of BellSouth: A Competitive Force
BellSouth: A Competitive ForceAnalyst Briefing
New York, NYNovember 10, 2003
Safe Harbor
In addition to historical information, this briefing may contain forward-looking statements regarding events and financial trends. Factors that could affect future results and could cause actual results to differ materially from those expressed or implied in the forward-looking statements include: (i) a change in economic conditions in domestic or international markets where we operate or have material investments which would affect demand for our services; (ii) currency devaluations and continued economic weakness in certain international markets in which we operate or have material investments; (iii) the intensity of competitive activity and its resulting impact on pricing strategies and new product offerings; (iv) higher than anticipated cash requirements for investments, new business initiatives and acquisitions; (v) unfavorable regulatory actions and (vi) those factors contained in the Company’s periodic reports filed with the SEC. The forward-looking information in this presentation is given as of this date only, and BellSouth assumes no duty to update this information.
This presentation may also contain certain non-GAAP financial measures. The most directly comparable GAAP financial measures, and a full reconciliation of non-GAAP to GAAP financial information, are provided on the Company's investor relations website, www.bellsouth.com/investor.
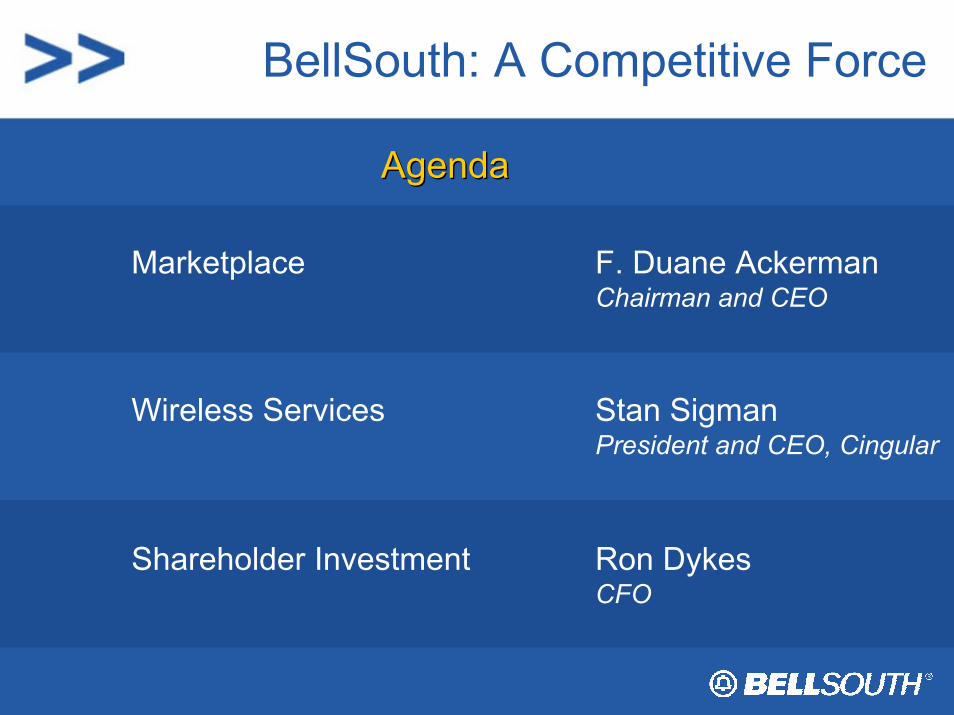
BellSouth: A Competitive Force
AgendaAgenda
Ron DykesCFO
Shareholder Investment
Stan SigmanPresident and CEO, Cingular
Wireless Services
F. Duane AckermanChairman and CEO
Marketplace
BellSouth: A Competitive ForceIn the Marketplace
F. Duane Ackerman, Chairman and CEO
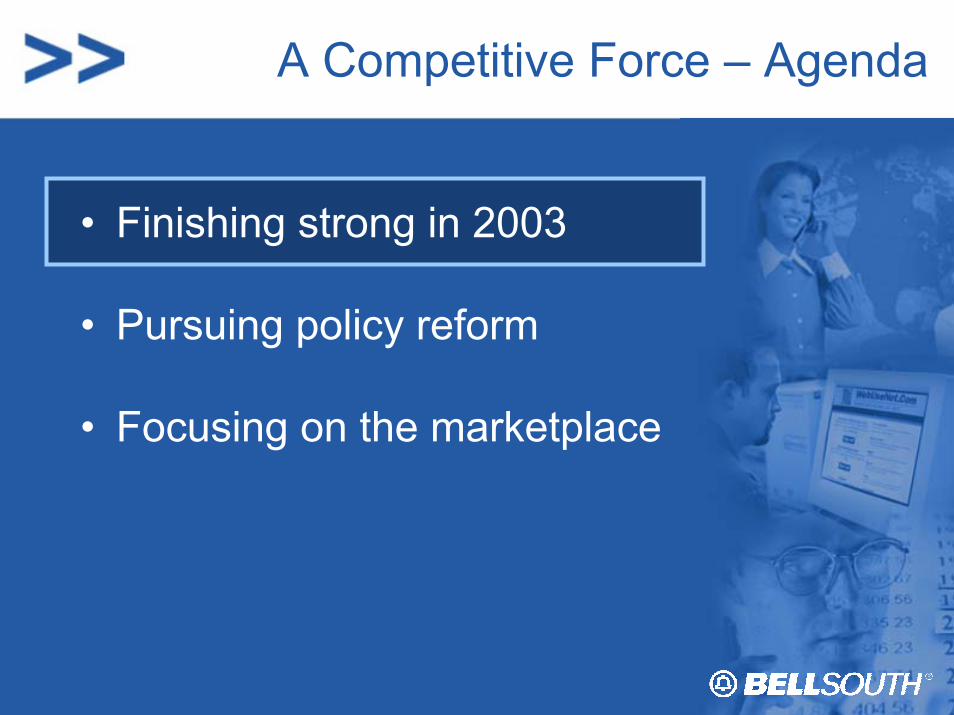
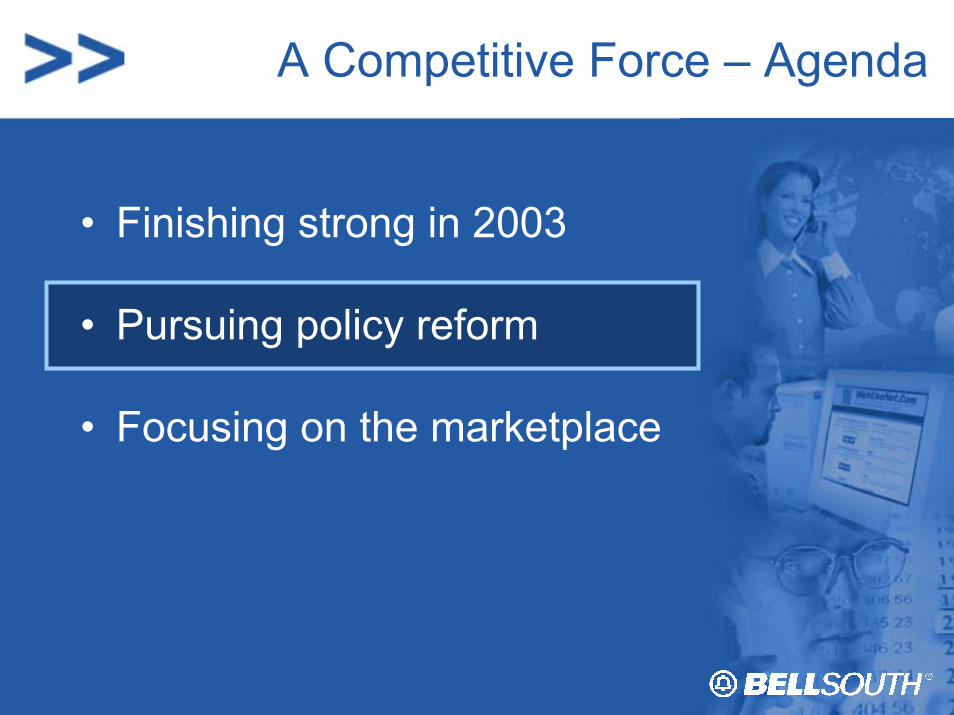
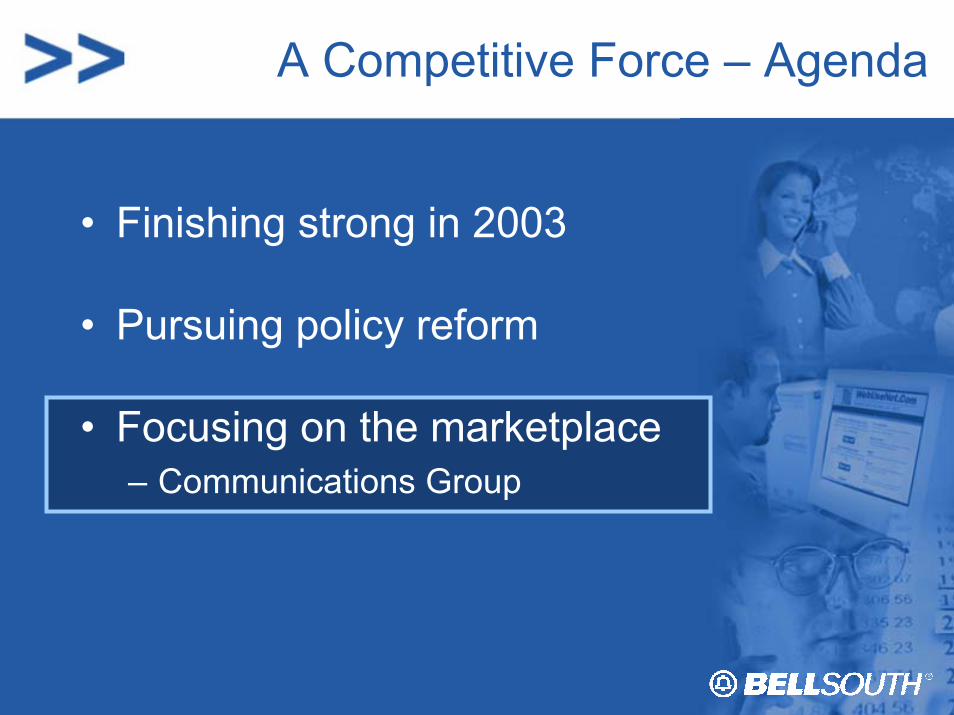
A Competitive Force – Agenda
• Finishing strong in 2003
• Pursuing policy reform
• Focusing on the marketplace
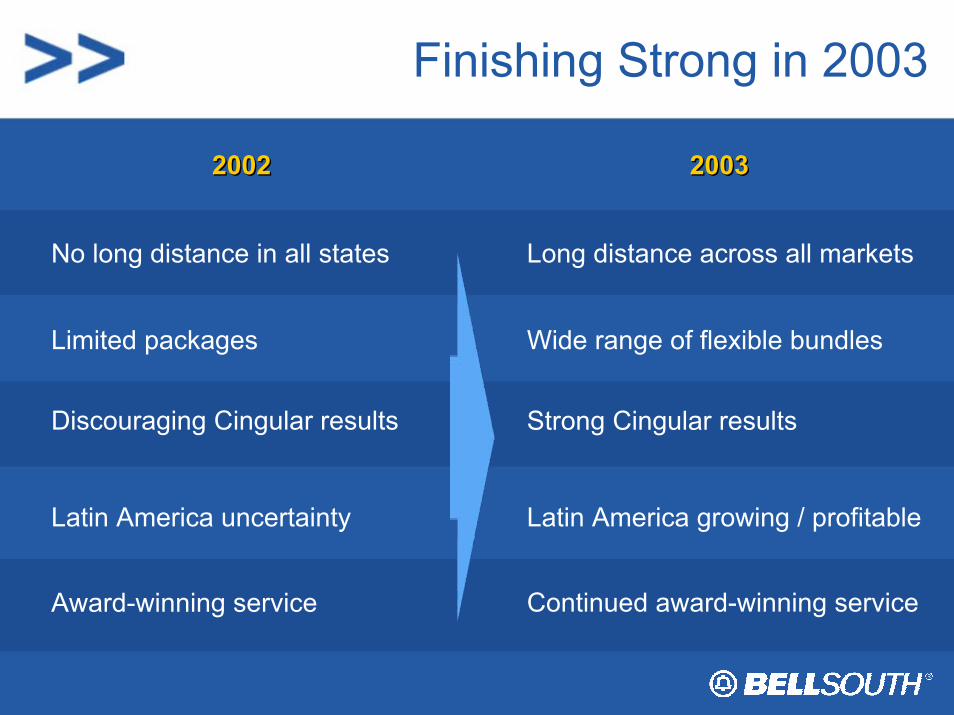
Finishing Strong in 2003
20022002
Discouraging Cingular results
No long distance in all states
Limited packages
Latin America uncertainty
Award-winning service
20032003
Strong Cingular results
Long distance across all markets
Wide range of flexible bundles
Latin America growing / profitable
Continued award-winning service
A Competitive Force – Agenda
• Finishing strong in 2003
• Pursuing policy reform
• Focusing on the marketplace
Pursuing Policy Reform
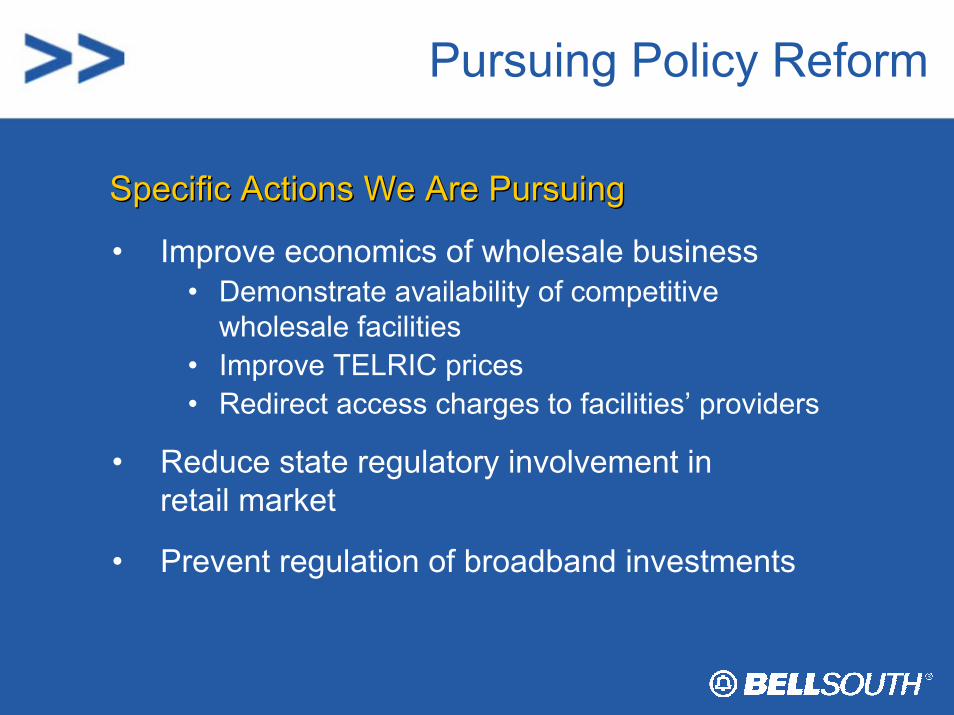
Specific Actions We Are PursuingSpecific Actions We Are Pursuing
• Improve economics of wholesale business• Demonstrate availability of competitive
wholesale facilities• Improve TELRIC prices• Redirect access charges to facilities’ providers
• Reduce state regulatory involvement in retail market
• Prevent regulation of broadband investments
A Competitive Force – Agenda
• Finishing strong in 2003
• Pursuing policy reform
• Focusing on the marketplace– Communications Group
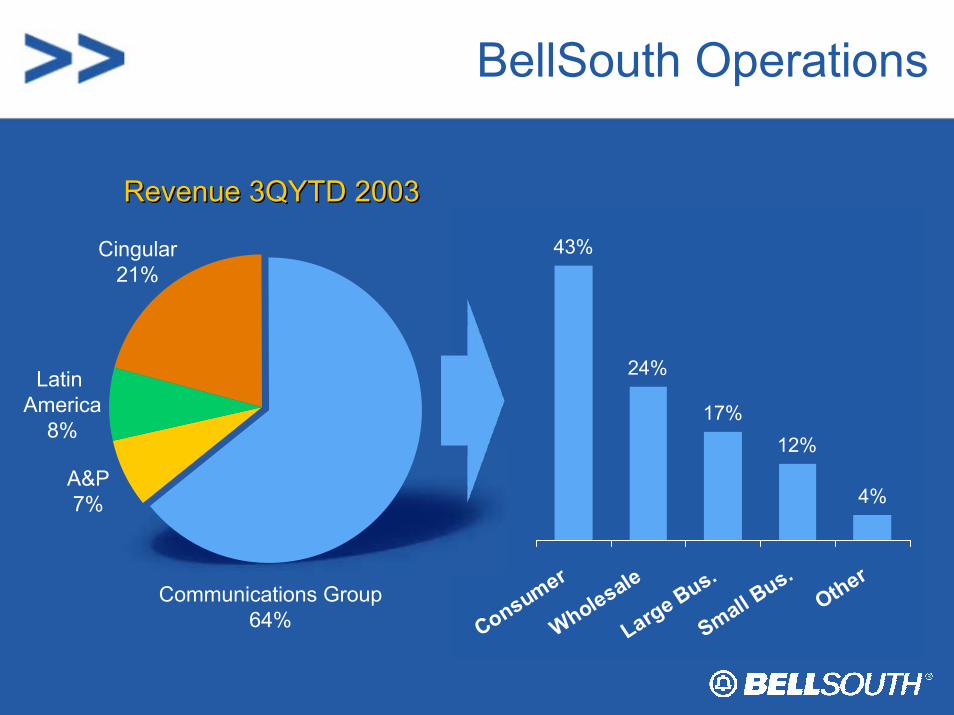
BellSouth Operations
43%
24%
17%12%
4%
Consumer
Wholesale
Large Bus.
Small Bus.
OtherCommunications Group
64%
Cingular21%
Latin America
8%
A&P 7%
Revenue 3QYTD 2003Revenue 3QYTD 2003
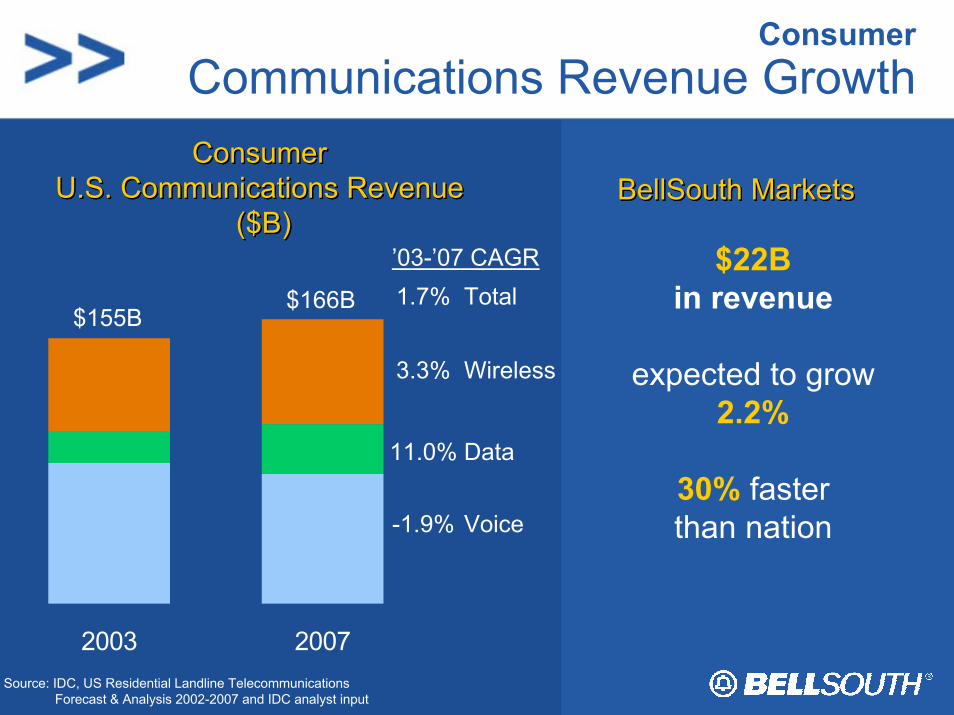
ConsumerCommunications Revenue Growth
Source: IDC, US Residential Landline Telecommunications Forecast & Analysis 2002-2007 and IDC analyst input
Consumer U.S. Communications Revenue
($B)
Consumer Consumer U.S. Communications RevenueU.S. Communications Revenue
($B)($B)’03-’07 CAGR
Wireless
2003 2007
$155B$166B
3.3%
-1.9% Voice
1.7% Total
11.0% Data
$22Bin revenue
expected to grow2.2%
30% faster than nation
BellSouth MarketsBellSouth MarketsBellSouth Markets
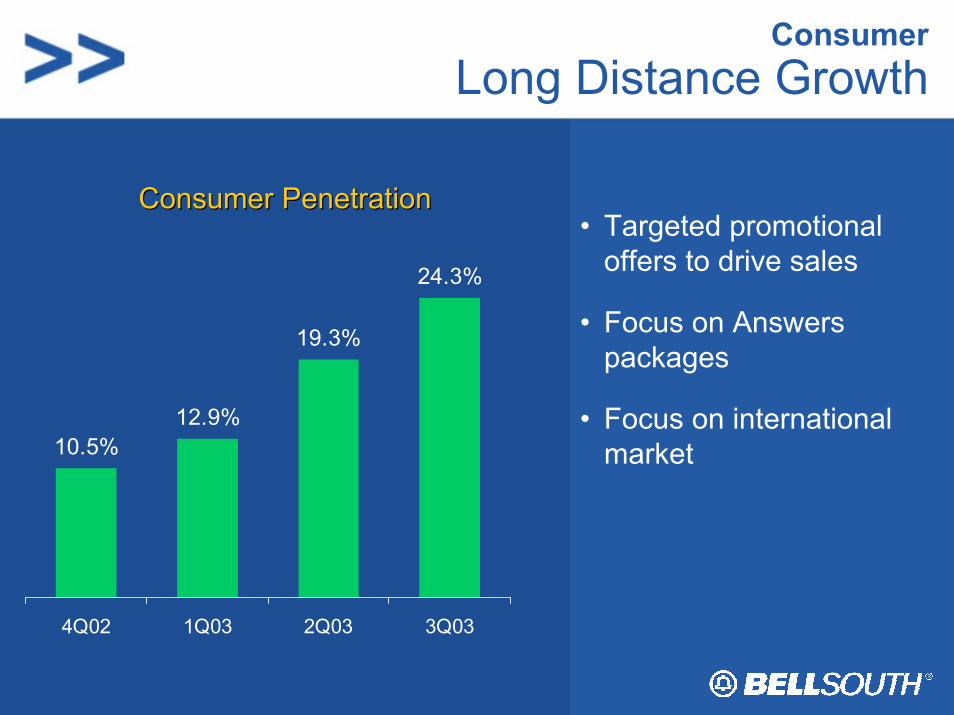
ConsumerLong Distance Growth
• Targeted promotional offers to drive sales
• Focus on Answers packages
• Focus on international market10.5%
12.9%
19.3%
24.3%
4Q02 1Q03 2Q03 3Q03
Consumer PenetrationConsumer Penetration
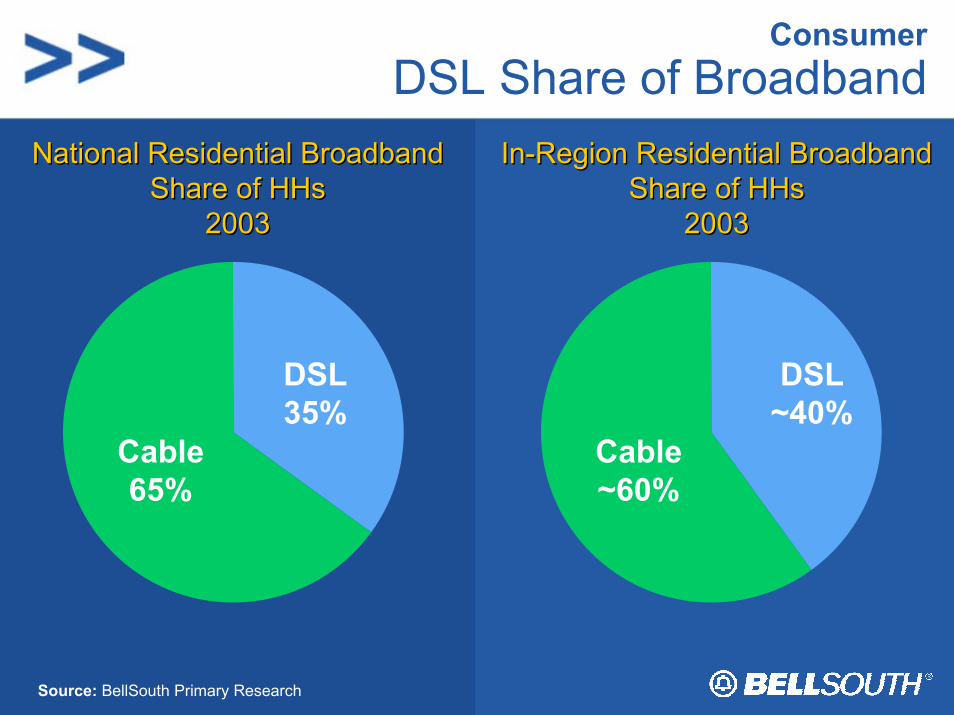
ConsumerDSL Share of Broadband
Source: BellSouth Primary Research
National Residential Broadband Share of HHs
2003
National Residential Broadband Share of HHs
2003
Cable65%
DSL35%
In-Region Residential Broadband Share of HHs
2003
In-Region Residential Broadband Share of HHs
2003
Cable~60%
DSL~40%
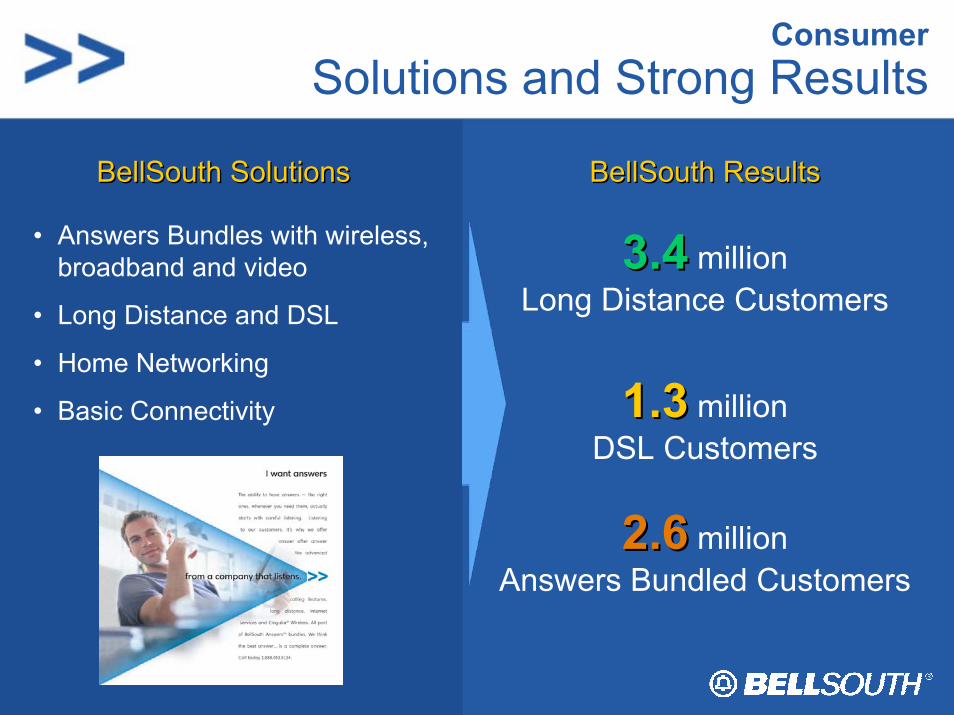
ConsumerSolutions and Strong Results
• Answers Bundles with wireless, broadband and video
• Long Distance and DSL
• Home Networking
• Basic Connectivity
BellSouth SolutionsBellSouth Solutions
2.62.6 millionAnswers Bundled Customers
BellSouth ResultsBellSouth Results
3.43.4 millionLong Distance Customers
1.31.3 millionDSL Customers
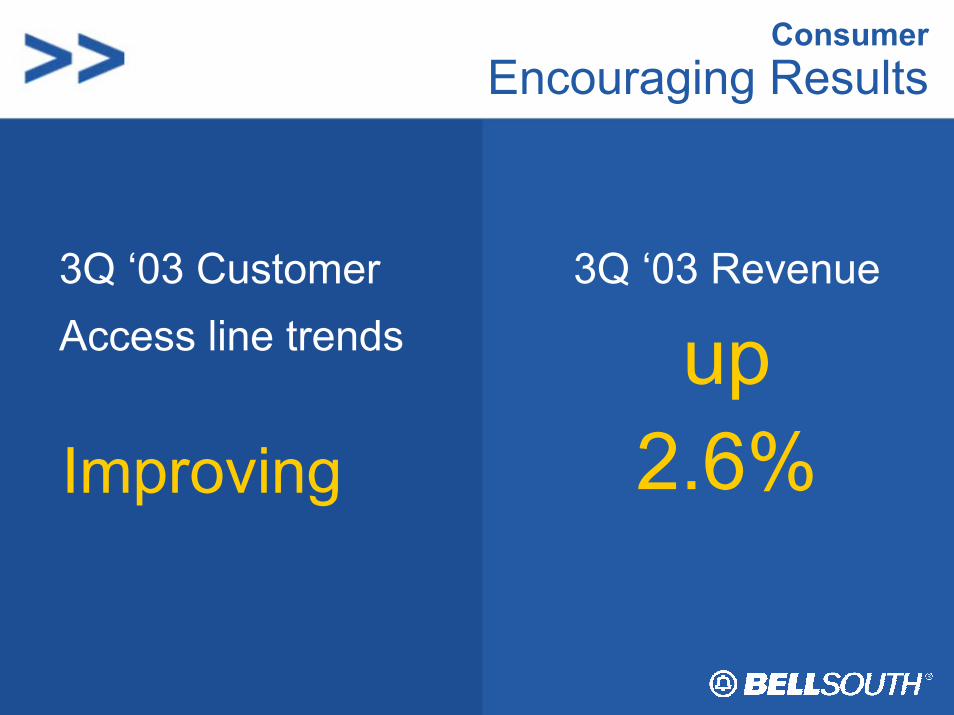
Consumer Encouraging Results
3Q ‘03 CustomerAccess line trends
Improving
3Q ‘03 Revenue
up2.6%
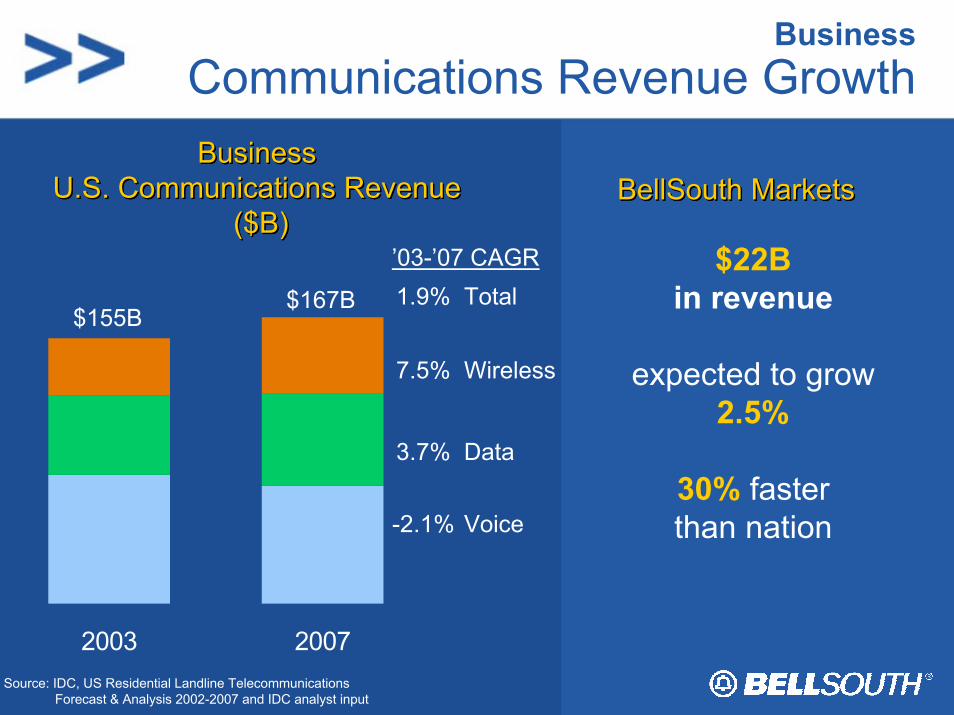
BusinessCommunications Revenue GrowthBusiness
U.S. Communications Revenue($B)
BusinessBusinessU.S. Communications RevenueU.S. Communications Revenue
($B)($B)
2003 2007Source: IDC, US Residential Landline Telecommunications
Forecast & Analysis 2002-2007 and IDC analyst input
’03-’07 CAGR
Wireless
$155B$167B
7.5%
-2.1% Voice
1.9% Total
3.7% Data
$22Bin revenue
expected to grow2.5%
30% faster than nation
BellSouth MarketsBellSouth MarketsBellSouth Markets
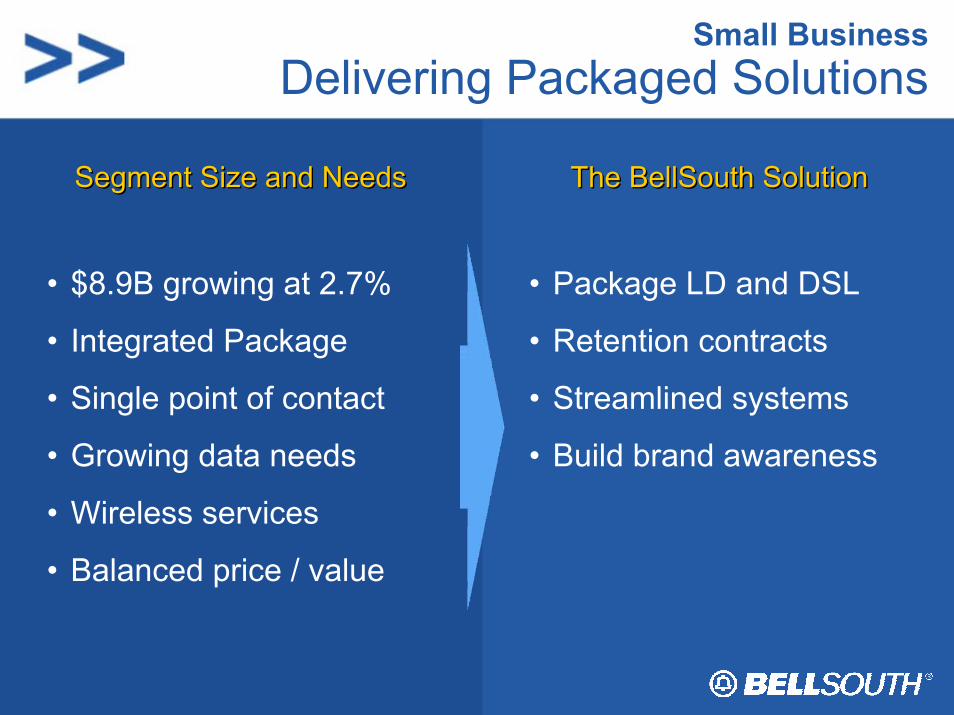
Small BusinessDelivering Packaged Solutions
• $8.9B growing at 2.7%
• Integrated Package
• Single point of contact
• Growing data needs
• Wireless services
• Balanced price / value
• Package LD and DSL
• Retention contracts
• Streamlined systems
• Build brand awareness
Segment Size and NeedsSegment Size and Needs The BellSouth SolutionThe BellSouth Solution
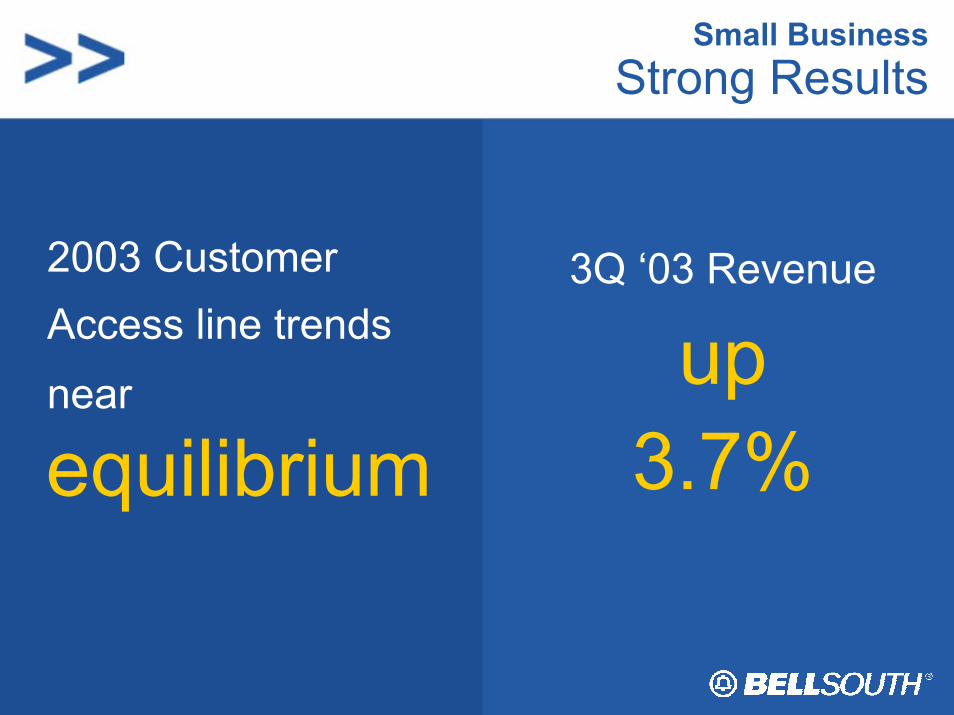
Small BusinessStrong Results
2003 CustomerAccess line trendsnear
equilibrium
3Q ‘03 Revenue
up3.7%
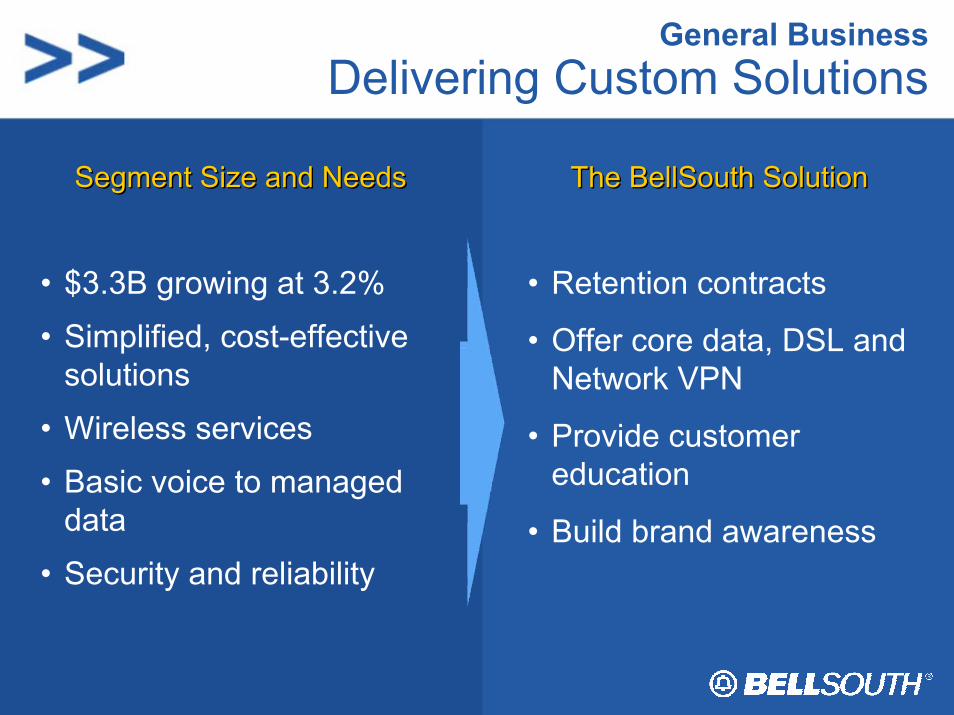
General BusinessDelivering Custom Solutions
Segment Size and NeedsSegment Size and Needs The BellSouth SolutionThe BellSouth Solution
• $3.3B growing at 3.2%
• Simplified, cost-effective solutions
• Wireless services
• Basic voice to managed data
• Security and reliability
• Retention contracts
• Offer core data, DSL and Network VPN
• Provide customer education
• Build brand awareness
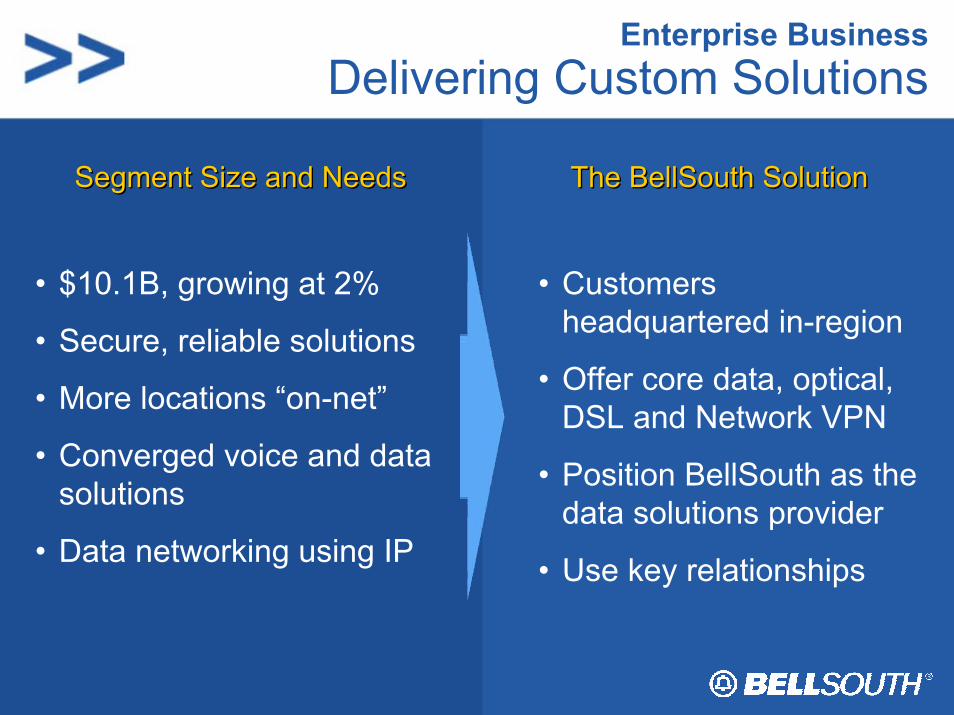
Enterprise BusinessDelivering Custom Solutions
• $10.1B, growing at 2%
• Secure, reliable solutions
• More locations “on-net”
• Converged voice and data solutions
• Data networking using IP
• Customers headquartered in-region
• Offer core data, optical, DSL and Network VPN
• Position BellSouth as the data solutions provider
• Use key relationships
Segment Size and NeedsSegment Size and Needs The BellSouth SolutionThe BellSouth Solution
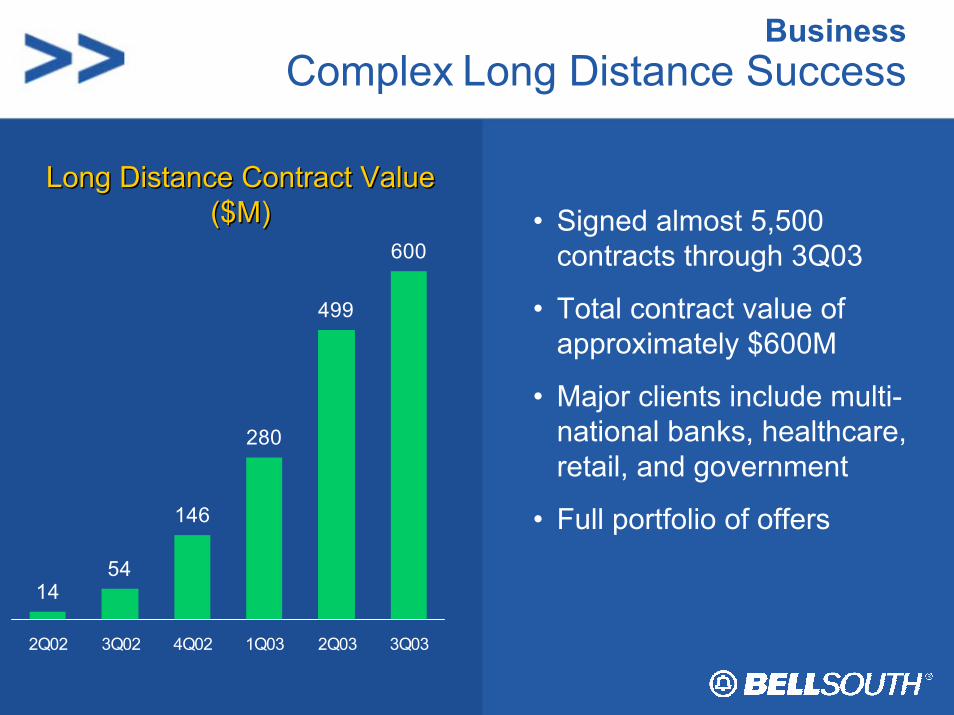
BusinessComplex Long Distance Success
1454
146
280
499
600
2Q02 3Q02 4Q02 1Q03 2Q03 3Q03
Long Distance Contract Value($M)
Long Distance Contract Value($M) • Signed almost 5,500
contracts through 3Q03
• Total contract value of approximately $600M
• Major clients include multi-national banks, healthcare, retail, and government
• Full portfolio of offers
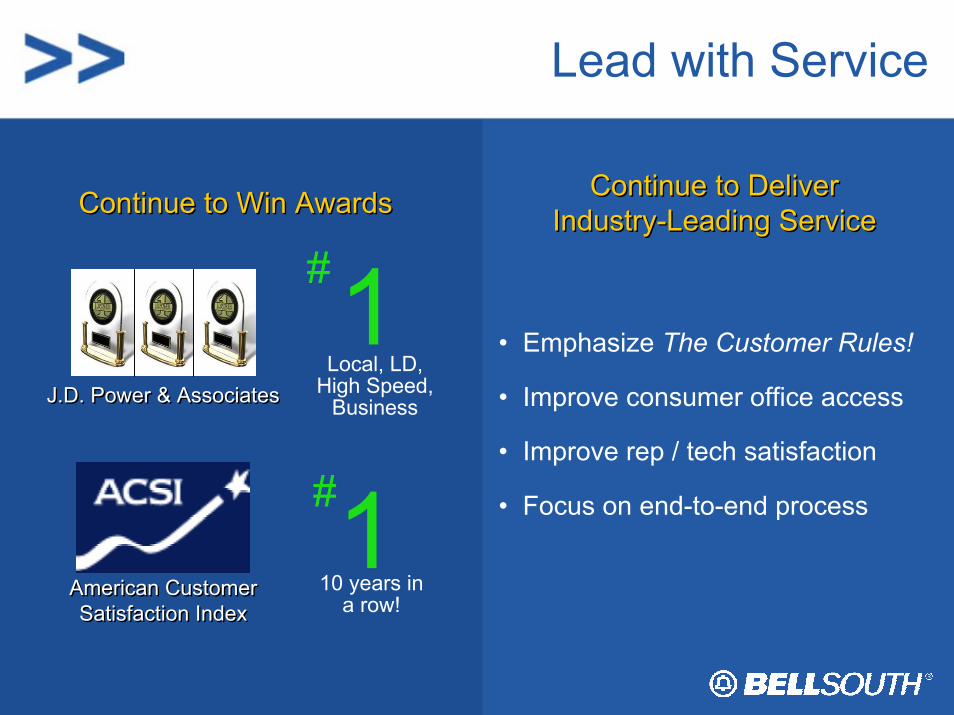
Lead with Service
Continue to Win AwardsContinue to Win Awards
#110 years in
a row!American Customer Satisfaction Index
American Customer Satisfaction Index
J.D. Power & AssociatesJ.D. Power & Associates
#1Local, LD,
High Speed, Business
• Emphasize The Customer Rules!
• Improve consumer office access
• Improve rep / tech satisfaction
• Focus on end-to-end process
Continue to Deliver Industry-Leading Service
Continue to Deliver Industry-Leading Service
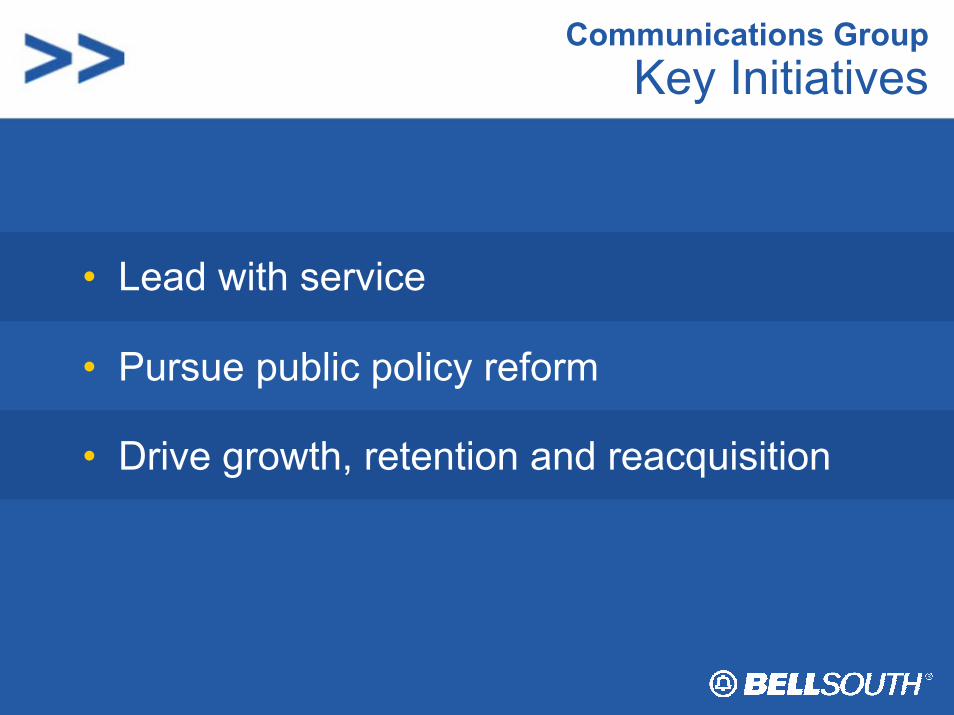
Communications GroupKey Initiatives
• Lead with service
• Pursue public policy reform
• Drive growth, retention and reacquisition
A Competitive Force – Agenda
• Finishing strong in 2003
• Pursuing policy reform
• Focusing on the marketplace– Cingular
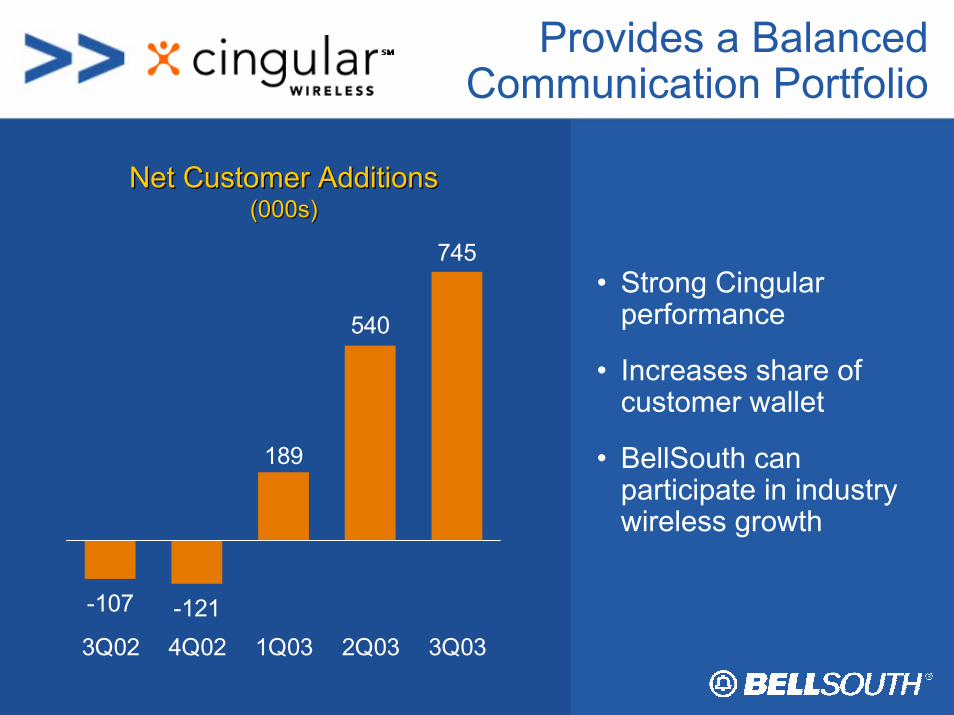
Provides a BalancedCommunication Portfolio
• Strong Cingularperformance
• Increases share of customer wallet
• BellSouth can participate in industry wireless growth
-107 -121
189
540
745
3Q02 4Q02 1Q03 2Q03 3Q03
Net Customer AdditionsNet Customer Additions(000s)(000s)
A Competitive Force – Agenda
• Finishing strong in 2003
• Pursuing policy reform
• Focusing on the marketplace– Latin America
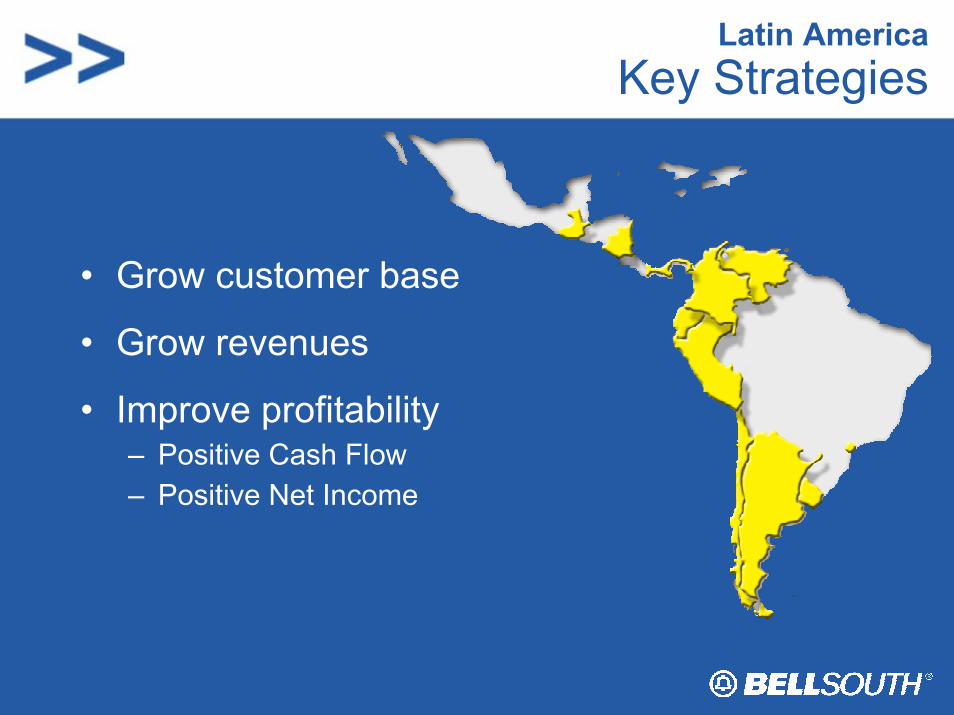
Latin AmericaKey Strategies
• Grow customer base
• Grow revenues
• Improve profitability– Positive Cash Flow– Positive Net Income
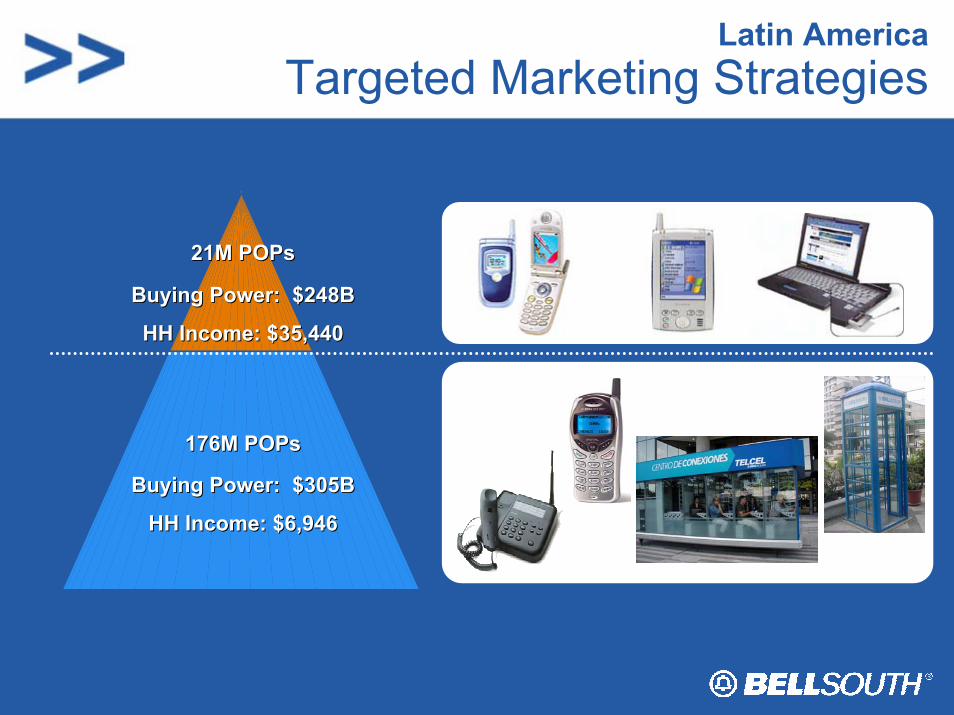
Latin AmericaTargeted Marketing Strategies
Buying Power: $248BBuying Power: $248B
HH Income: $35,440HH Income: $35,440
176M 176M POPsPOPs
21M 21M POPsPOPs
Buying Power: $305BBuying Power: $305B
HH Income: $6,946HH Income: $6,946
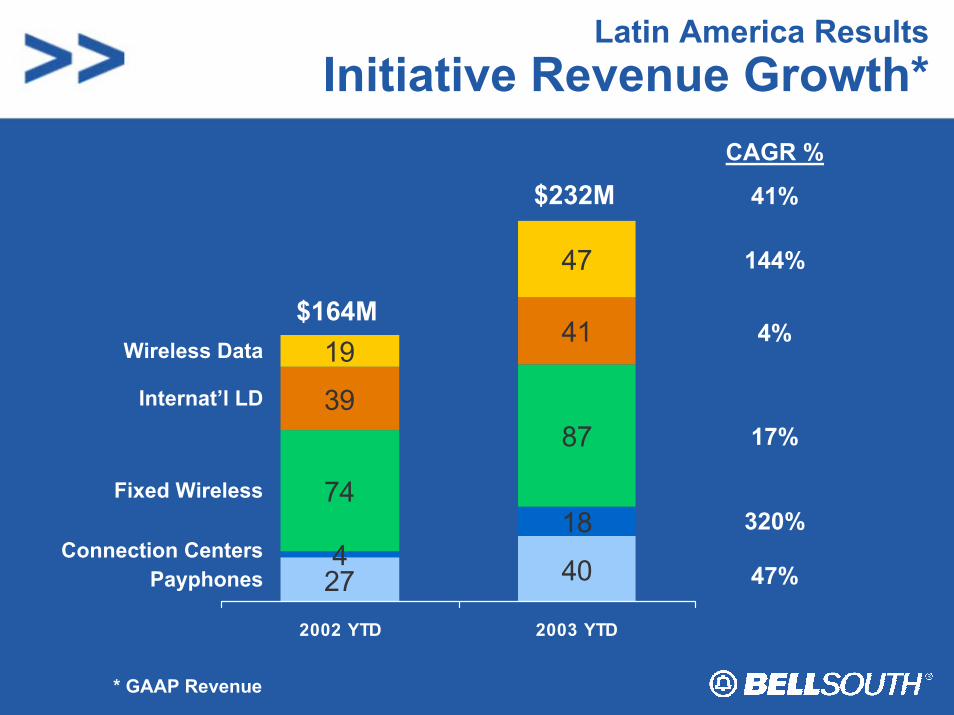
Latin America ResultsInitiative Revenue Growth*
CAGR %
41%
144%
4%
17%
320%
47%27 40418
74
8739
4119
47
2002 YTD 2003 YTD
PayphonesConnection Centers
Fixed Wireless
Internat’l LD
Wireless Data
$164M
$232M
* GAAP Revenue
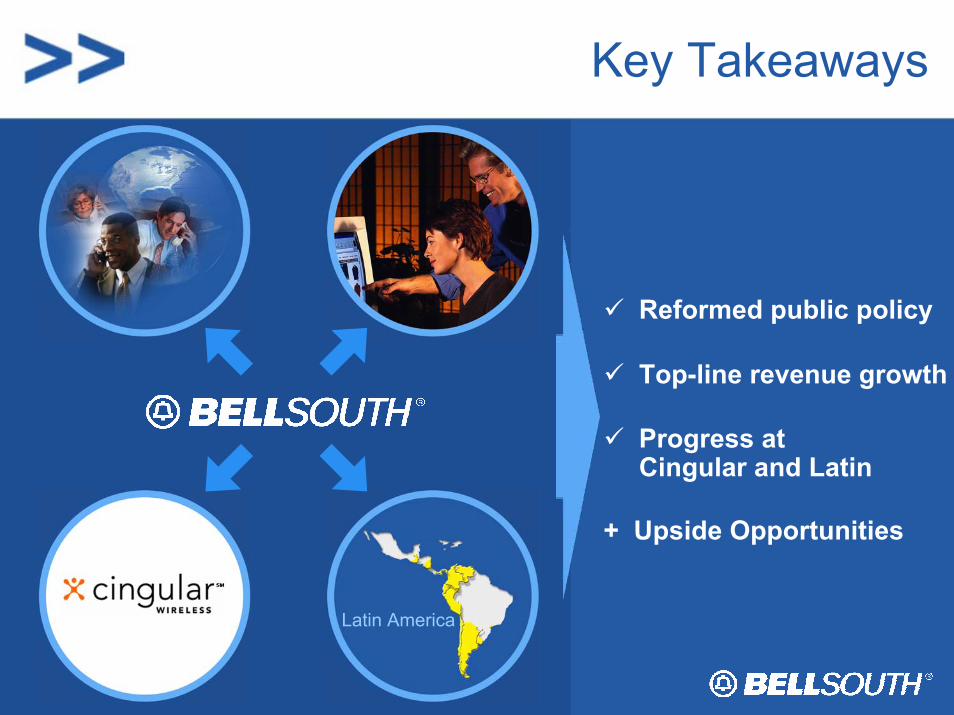
Key Takeaways
Reformed public policy
+ Upside Opportunities
Top-line revenue growth
Progress at Cingular and Latin
Latin America
Cingular Wireless: A Competitive Force
Stan Sigman, President and CEO
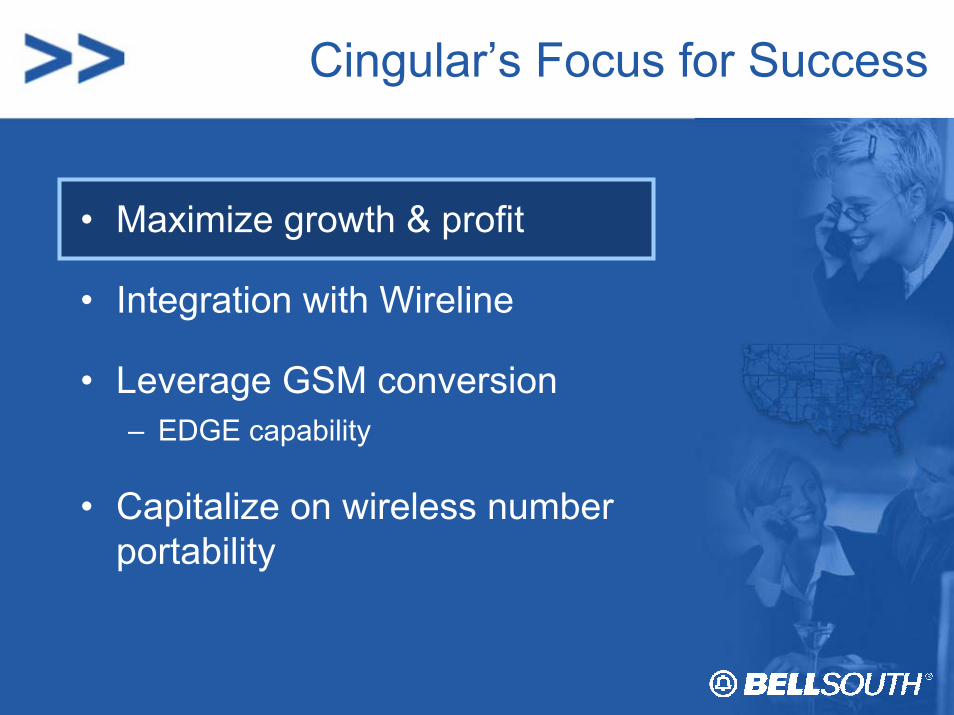
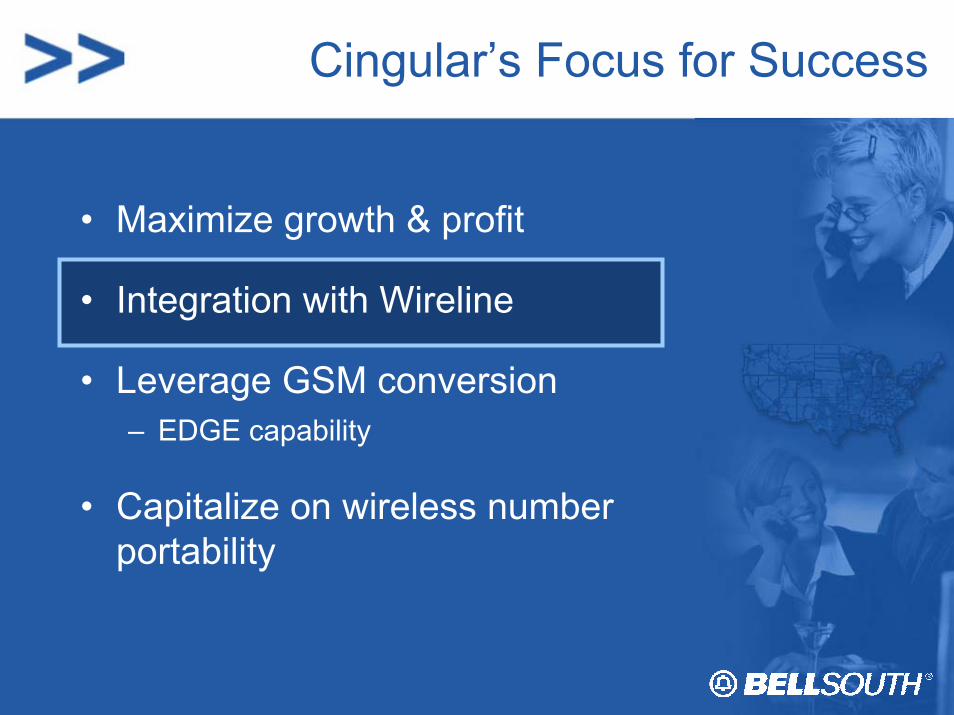
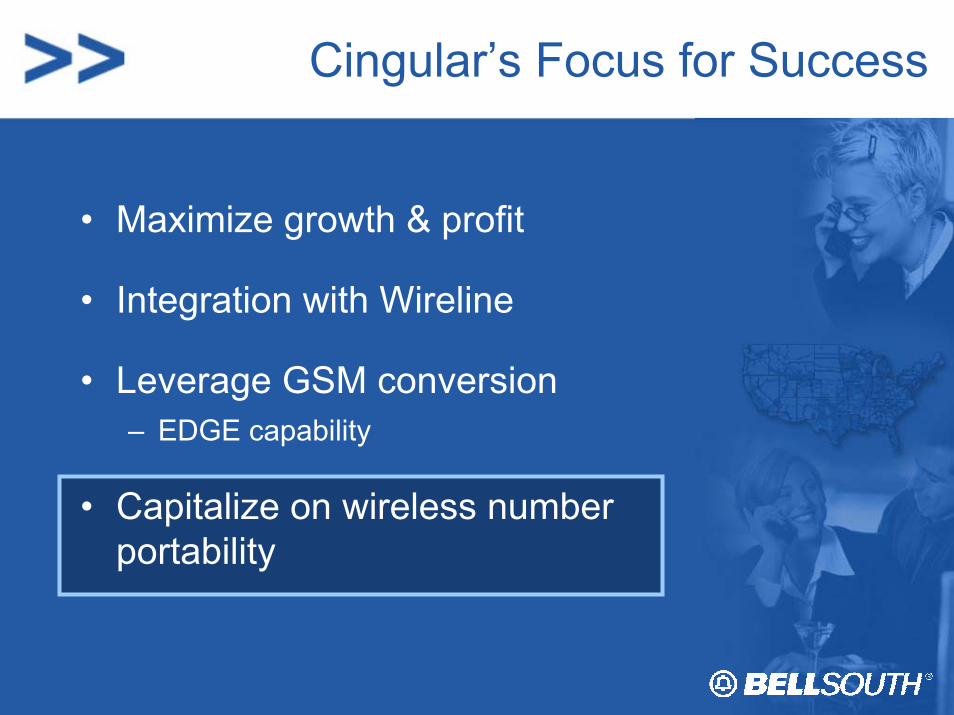
Cingular’s Focus for Success
• Maximize growth & profit
• Integration with Wireline
• Leverage GSM conversion– EDGE capability
• Capitalize on wireless number portability
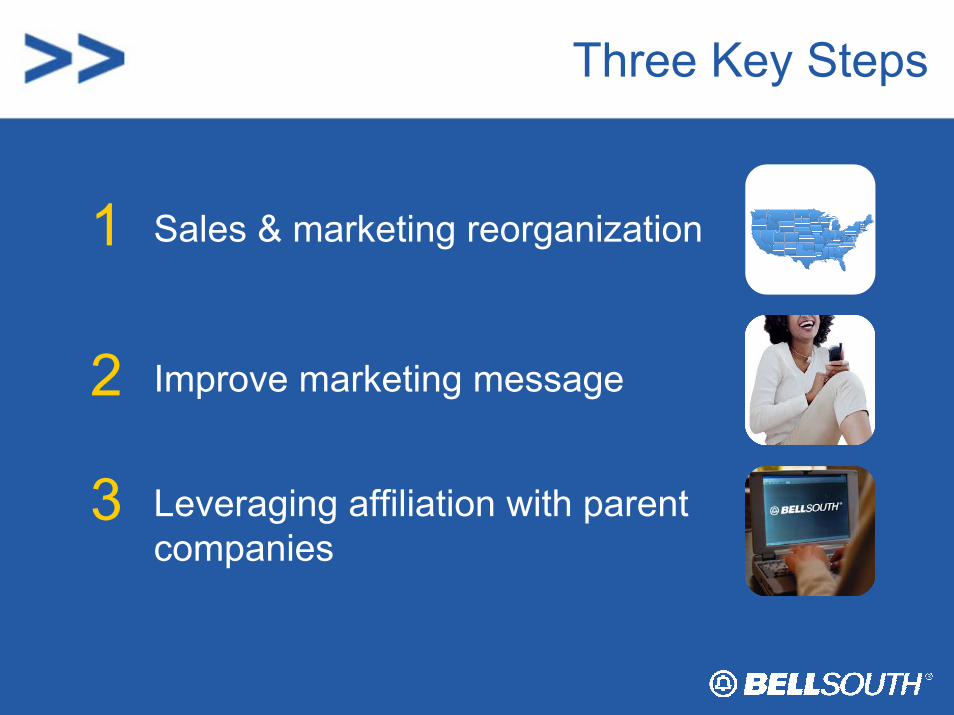
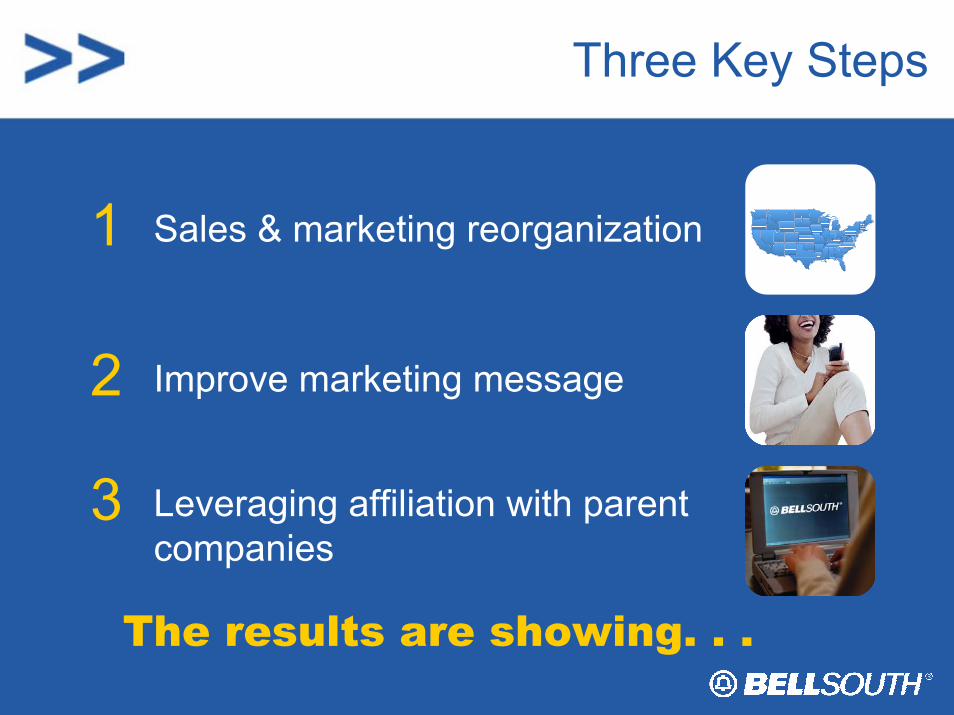
Three Key Steps
1 Sales & marketing reorganization
2 Improve marketing message
3 Leveraging affiliation with parent companies
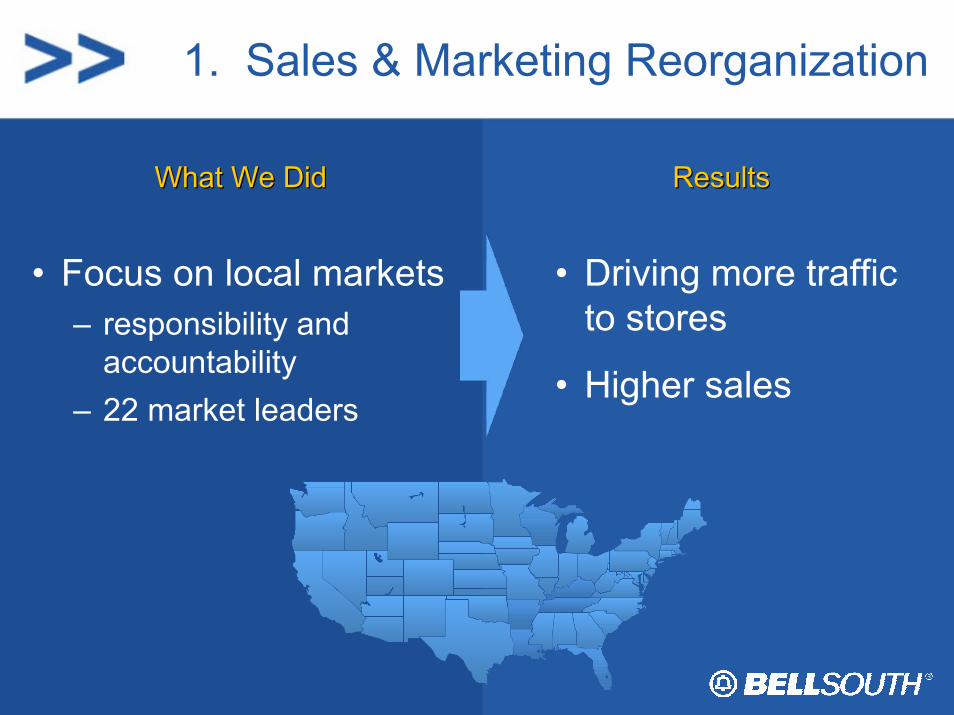
1. Sales & Marketing Reorganization
ResultsResultsWhat We DidWhat We Did
• Focus on local markets– responsibility and
accountability– 22 market leaders
• Driving more traffic to stores
• Higher sales
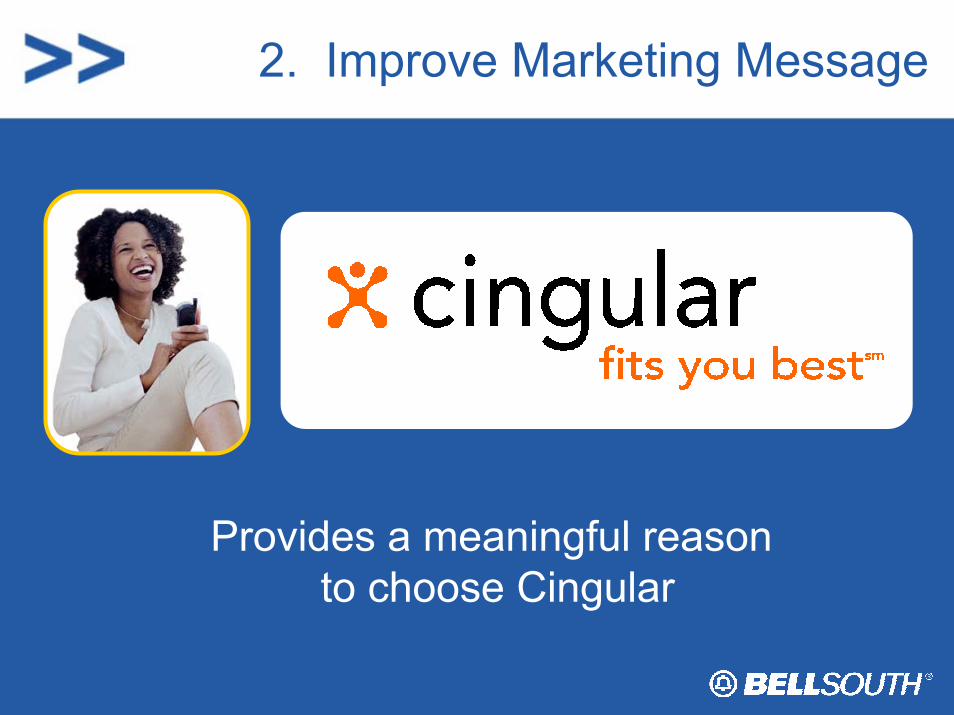
2. Improve Marketing Message
Provides a meaningful reasonto choose Cingular
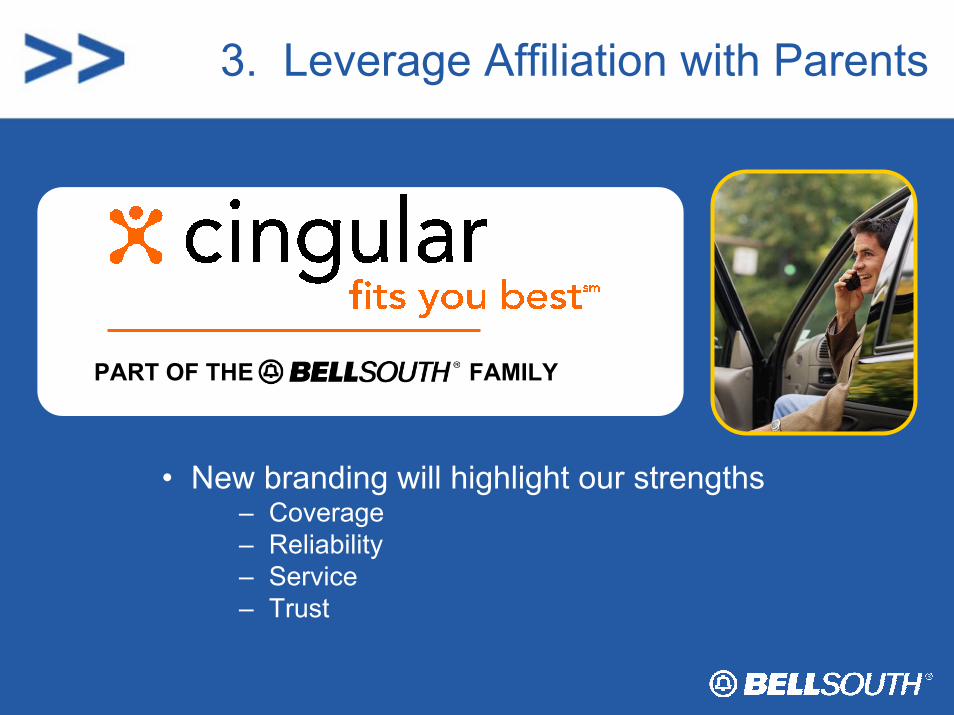
3. Leverage Affiliation with Parents
PART OF THE FAMILY
• New branding will highlight our strengths– Coverage– Reliability– Service– Trust
Three Key Steps
1 Sales & marketing reorganization
2 Improve marketing message
3 Leveraging affiliation with parent companies
The results are showing. . .
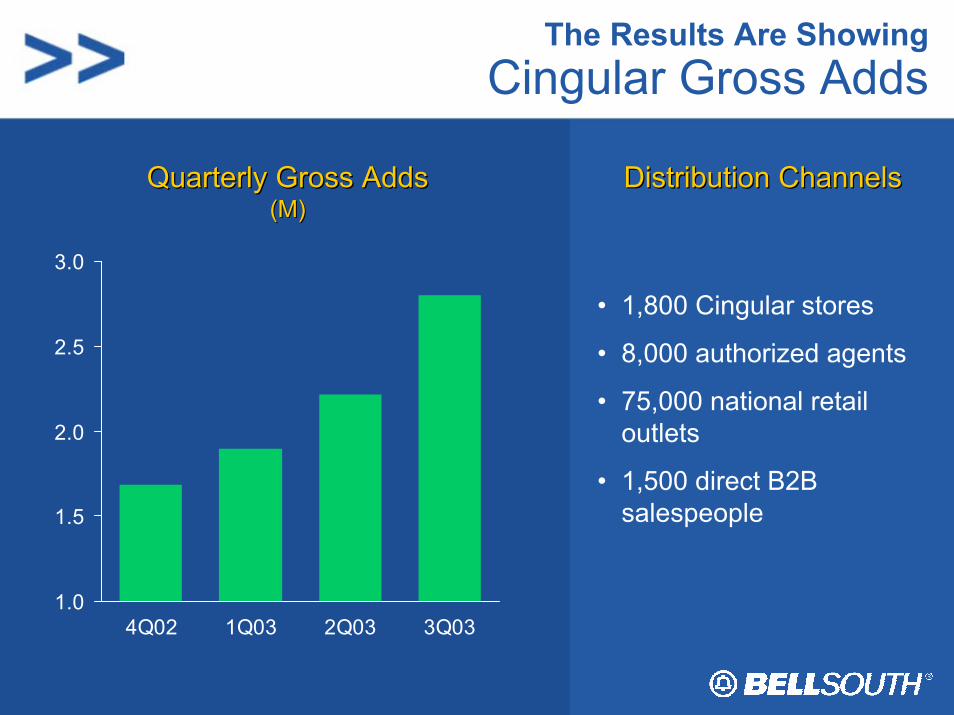
The Results Are ShowingCingular Gross Adds
1.0
1.5
2.0
2.5
3.0
4Q02 1Q03 2Q03 3Q03
• 1,800 Cingular stores
• 8,000 authorized agents
• 75,000 national retail outlets
• 1,500 direct B2B salespeople
Quarterly Gross AddsQuarterly Gross Adds(M)(M)
Distribution ChannelsDistribution Channels
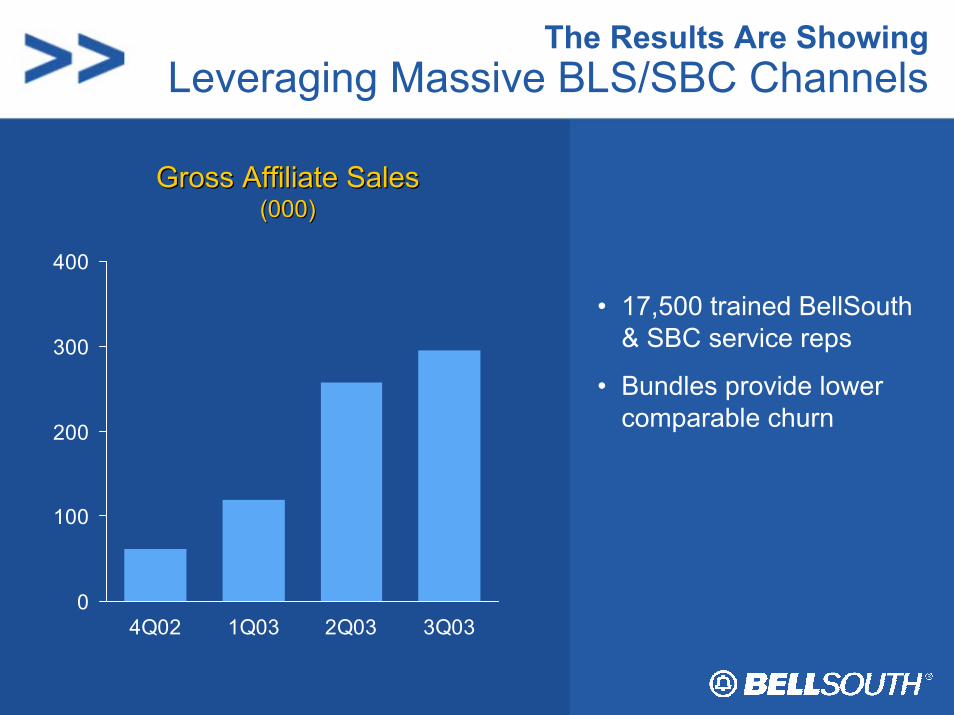
The Results Are ShowingLeveraging Massive BLS/SBC Channels
0
100
200
300
400
4Q02 1Q03 2Q03 3Q03
Gross Affiliate SalesGross Affiliate Sales(000)(000)
• 17,500 trained BellSouth & SBC service reps
• Bundles provide lower comparable churn
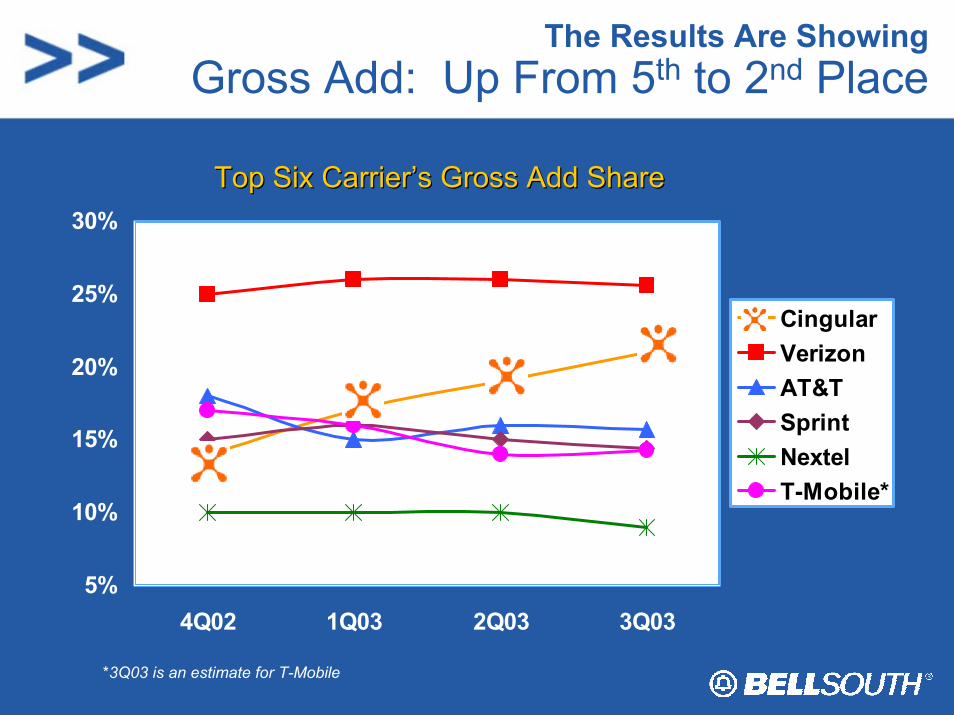
The Results Are ShowingGross Add: Up From 5th to 2nd Place
Top Six Carrier’s Gross Add ShareTop Six Carrier’s Gross Add Share
5%
10%
15%
20%
25%
30%
4Q02 1Q03 2Q03 3Q03
CingularVerizonAT&TSprintNextelT-Mobile*
*3Q03 is an estimate for T-Mobile
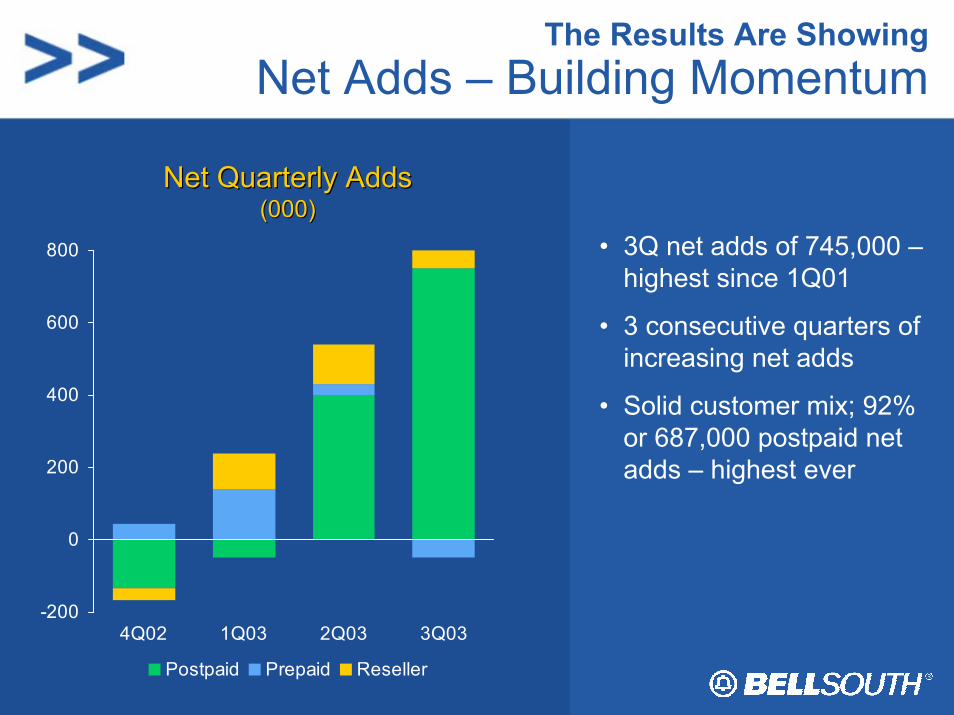
The Results Are ShowingNet Adds – Building Momentum
-200
0
200
400
600
800
4Q02 1Q03 2Q03 3Q03
Postpaid Prepaid Reseller
• 3Q net adds of 745,000 –highest since 1Q01
• 3 consecutive quarters of increasing net adds
• Solid customer mix; 92% or 687,000 postpaid net adds – highest ever
Net Quarterly AddsNet Quarterly Adds(000)(000)
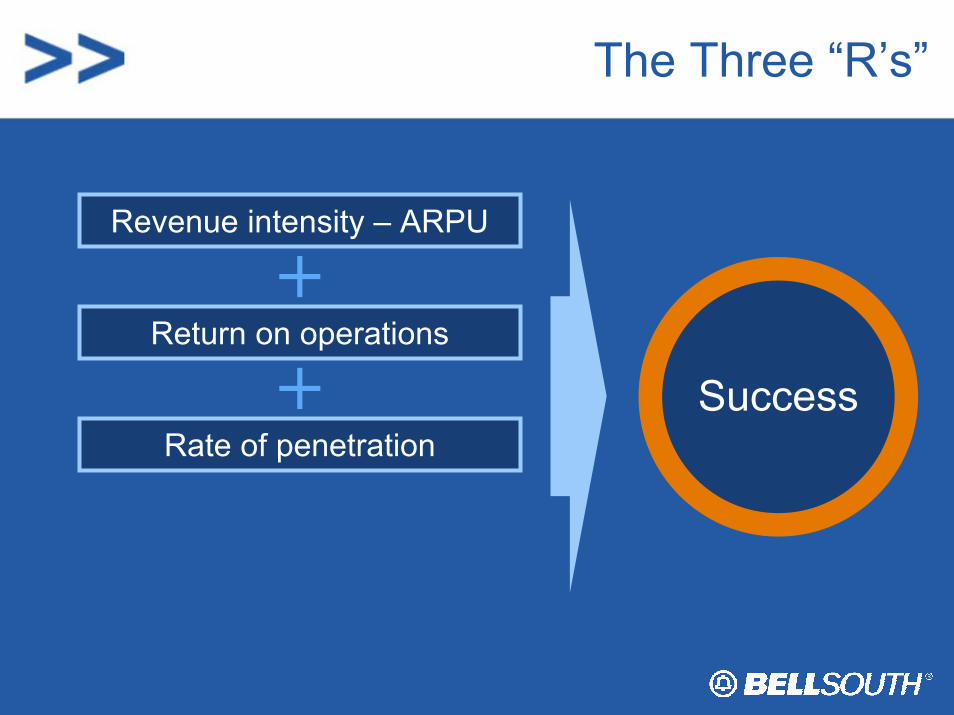
The Three “R’s”
Revenue intensity – ARPU
SuccessReturn on operations
Rate of penetration
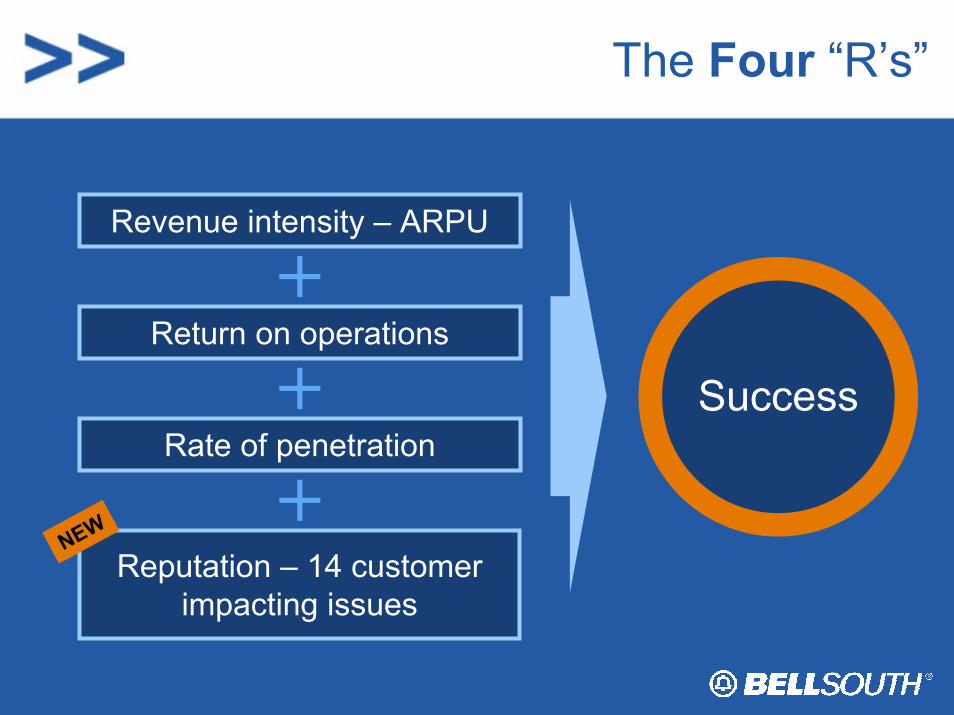
The Four “R’s”
Revenue intensity – ARPU
SuccessReturn on operations
Rate of penetration
Reputation – 14 customerimpacting issues
NEW
Cingular’s Focus for Success
• Maximize growth & profit
• Integration with Wireline
• Leverage GSM conversion– EDGE capability
• Capitalize on wireless number portability
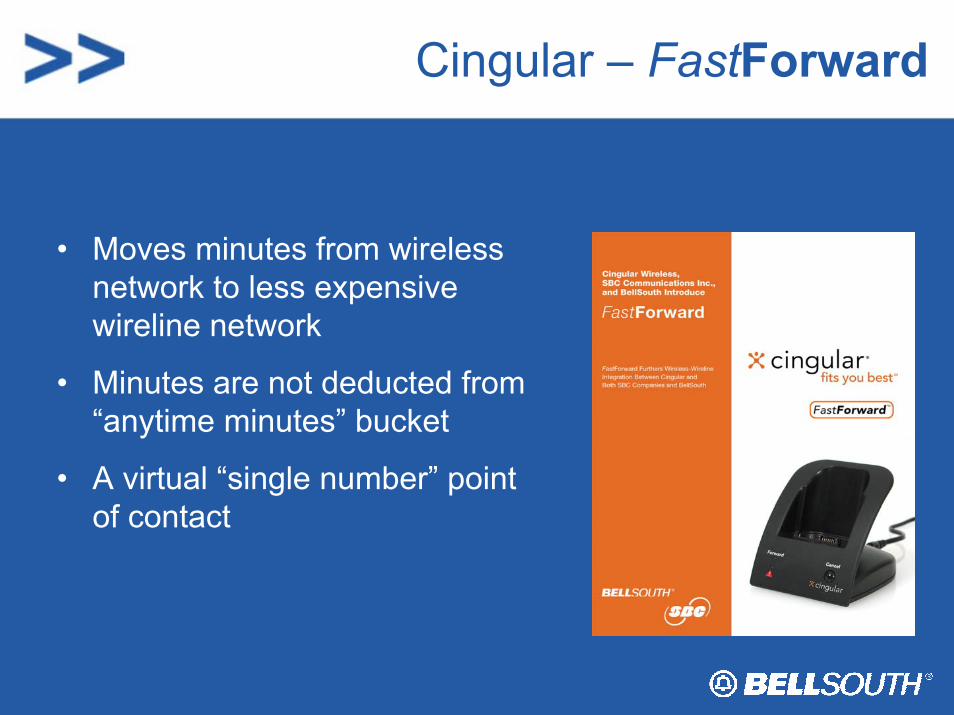
Cingular – FastForward
• Moves minutes from wireless network to less expensive wireline network
• Minutes are not deducted from “anytime minutes” bucket
• A virtual “single number” point of contact
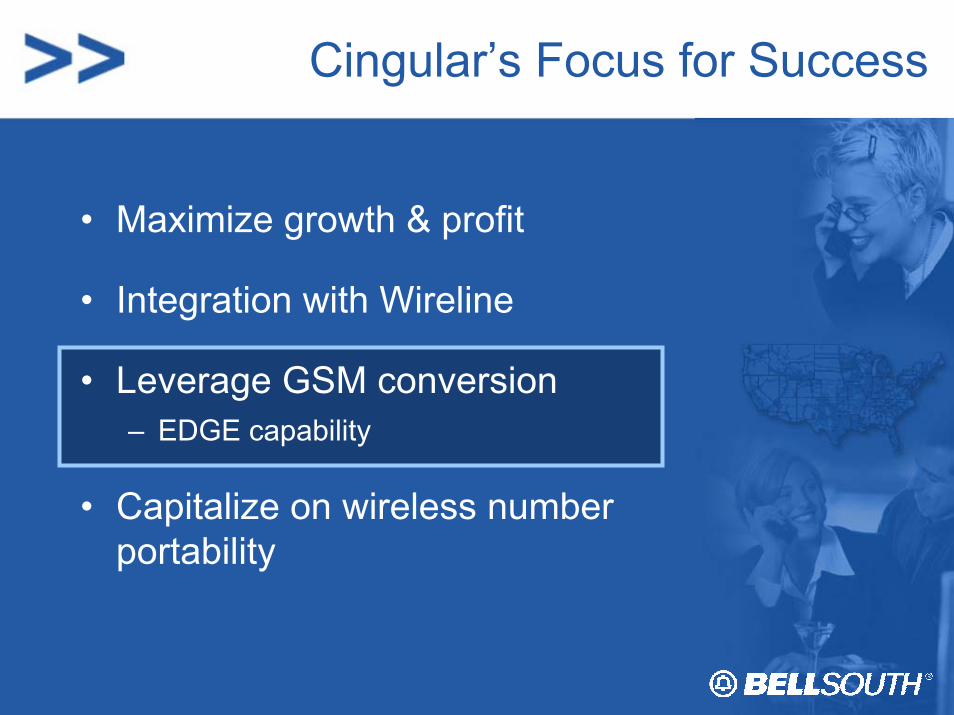
Cingular’s Focus for Success
• Maximize growth & profit
• Integration with Wireline
• Leverage GSM conversion– EDGE capability
• Capitalize on wireless number portability
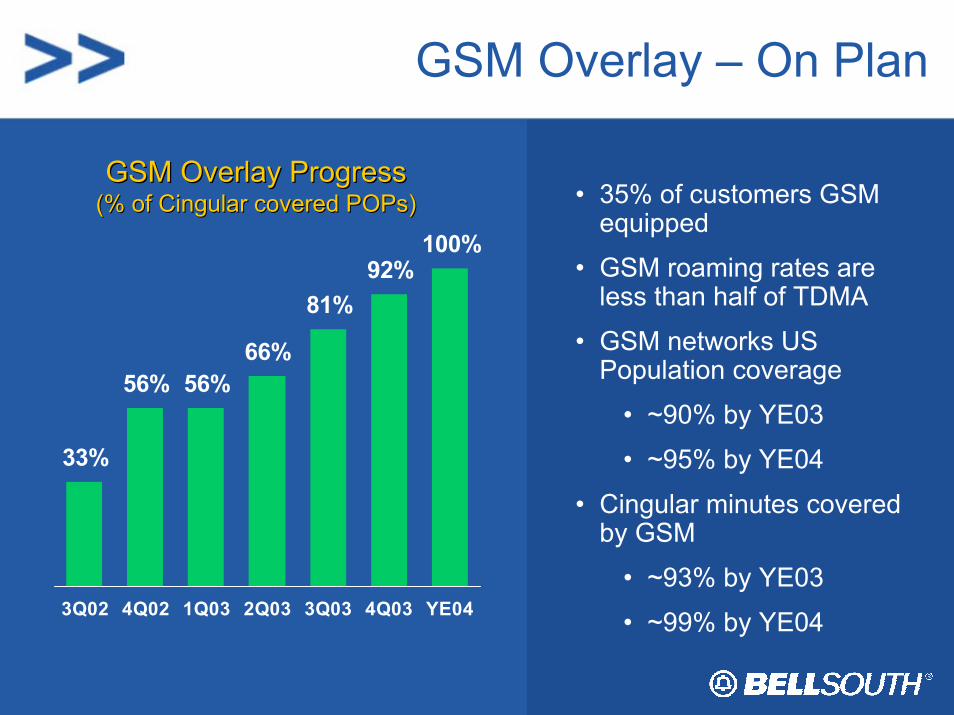
GSM Overlay – On Plan
• 35% of customers GSM equipped
• GSM roaming rates are less than half of TDMA
• GSM networks US Population coverage
• ~90% by YE03
• ~95% by YE04
• Cingular minutes covered by GSM
• ~93% by YE03
• ~99% by YE04
33%
56% 56%66%
81%92%
100%
3Q02 4Q02 1Q03 2Q03 3Q03 4Q03 YE04
GSM Overlay ProgressGSM Overlay Progress(% of (% of CingularCingular covered covered POPsPOPs))
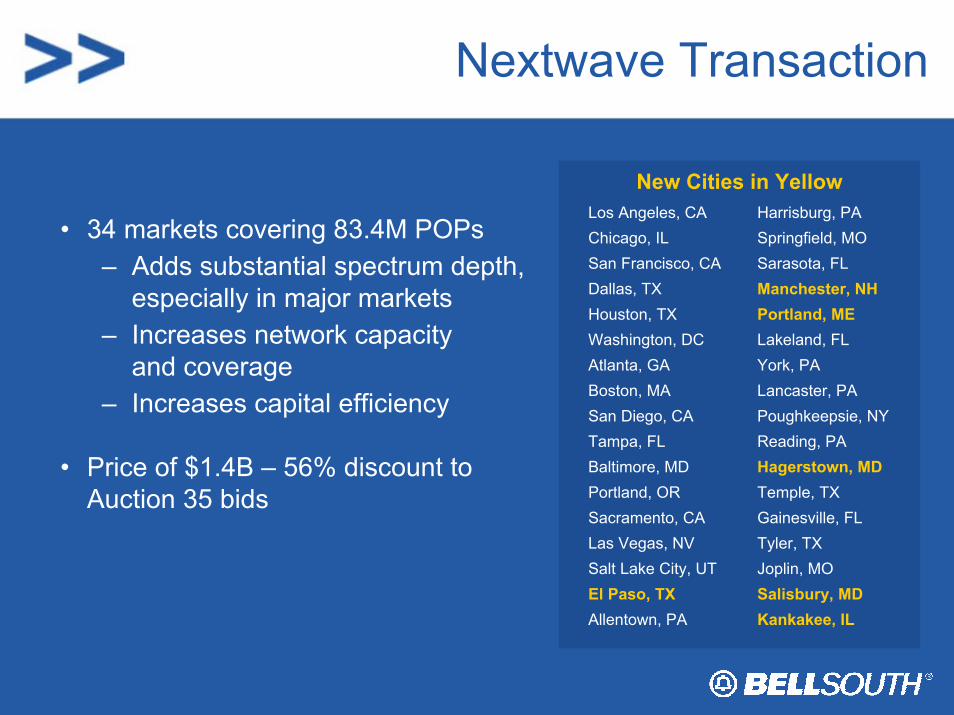
Nextwave Transaction
Kankakee, ILAllentown, PASalisbury, MDEl Paso, TXJoplin, MOSalt Lake City, UTTyler, TXLas Vegas, NVGainesville, FLSacramento, CATemple, TXPortland, ORHagerstown, MDBaltimore, MDReading, PATampa, FLPoughkeepsie, NYSan Diego, CALancaster, PABoston, MAYork, PAAtlanta, GALakeland, FLWashington, DCPortland, MEHouston, TXManchester, NHDallas, TXSarasota, FLSan Francisco, CASpringfield, MOChicago, ILHarrisburg, PALos Angeles, CA
New Cities in Yellow
• 34 markets covering 83.4M POPs – Adds substantial spectrum depth,
especially in major markets– Increases network capacity
and coverage– Increases capital efficiency
• Price of $1.4B – 56% discount to Auction 35 bids
Cingular’s Focus for Success
• Maximize growth & profit
• Integration with Wireline
• Leverage GSM conversion– EDGE capability
• Capitalize on wireless number portability
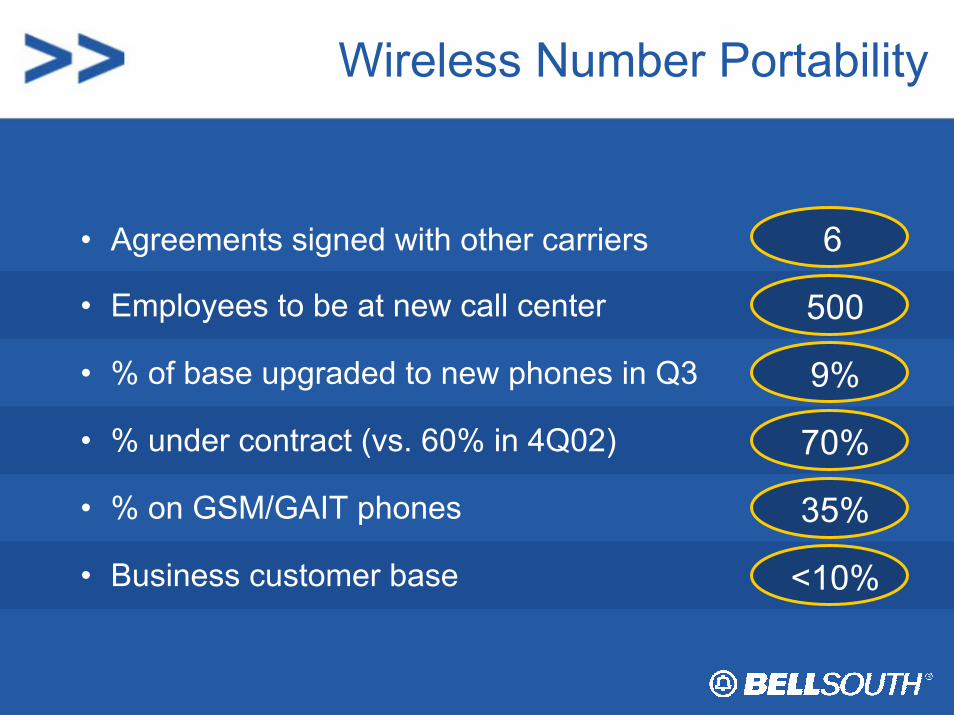
Wireless Number Portability
6• Agreements signed with other carriers
• Employees to be at new call center 500
• % under contract (vs. 60% in 4Q02) 70%
9%• % of base upgraded to new phones in Q3
• Business customer base <10%
35%• % on GSM/GAIT phones
In SummaryMoving Forward – Rapidly
Continue to grow the business and bottom line
Grow and enhance the GSM network
More integration with BellSouth and SBC
Progress towards best in class results
“All footprints point forward.”
Cingular Wireless: A Competitive Force
Stan Sigman, President and CEO
BellSouth: A Competitive ForceAnalyst Briefing
New York, NYNovember 10, 2003
Meeting Break Will resume shortly
BellSouth: A Competitive ForceRon Dykes, CFO
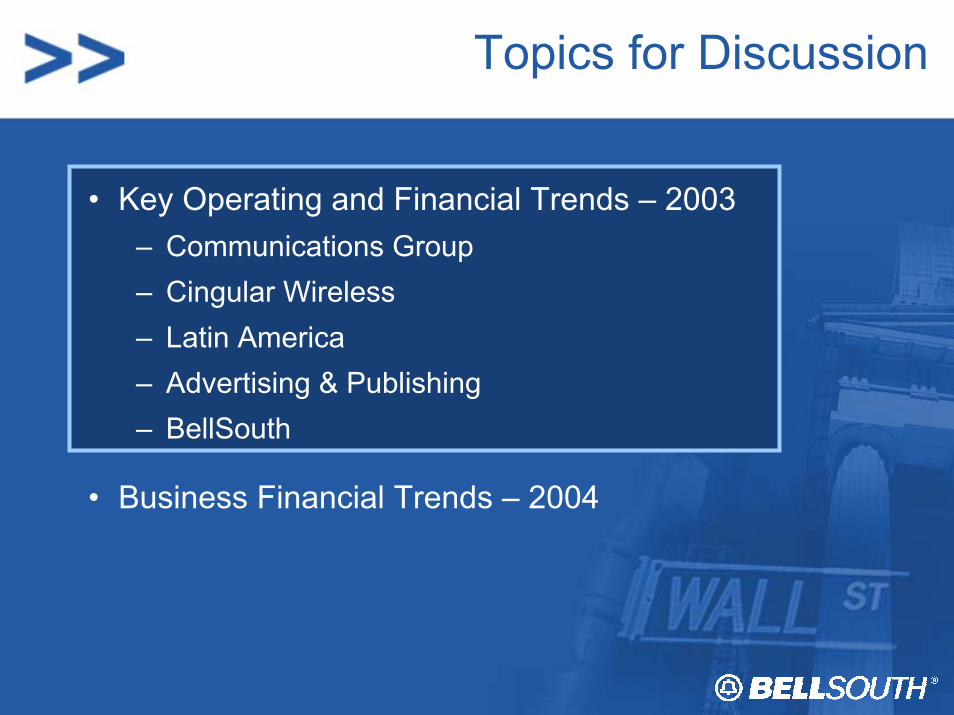
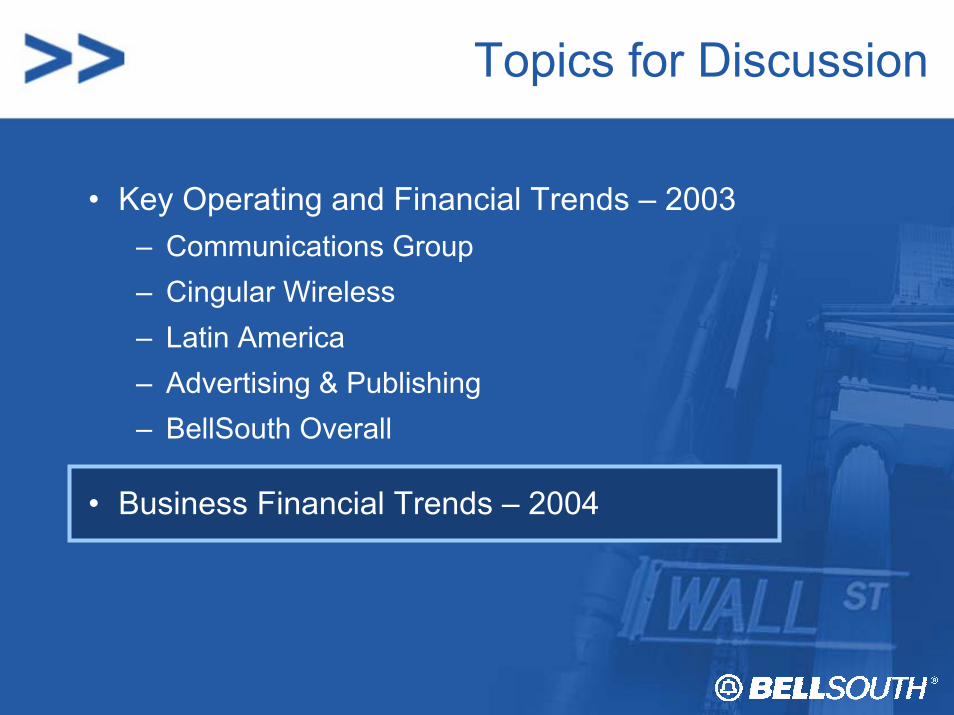
Topics for Discussion
• Key Operating and Financial Trends – 2003– Communications Group– Cingular Wireless– Latin America– Advertising & Publishing– BellSouth
• Business Financial Trends – 2004
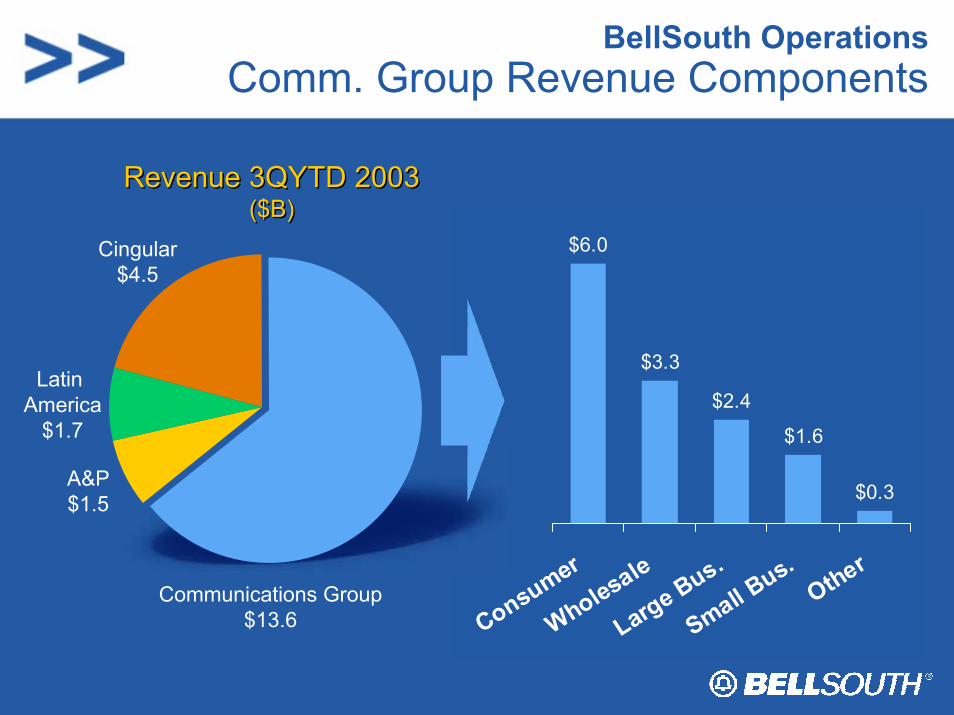
BellSouth OperationsComm. Group Revenue Components
$6.0
$3.3
$2.4
$1.6
$0.3
Consumer
Wholesale
Large Bus.
Small Bus.
OtherCommunications Group
$13.6
Cingular$4.5
Latin America
$1.7
A&P $1.5
Revenue 3QYTD 2003($B)
Revenue 3QYTD 2003($B)
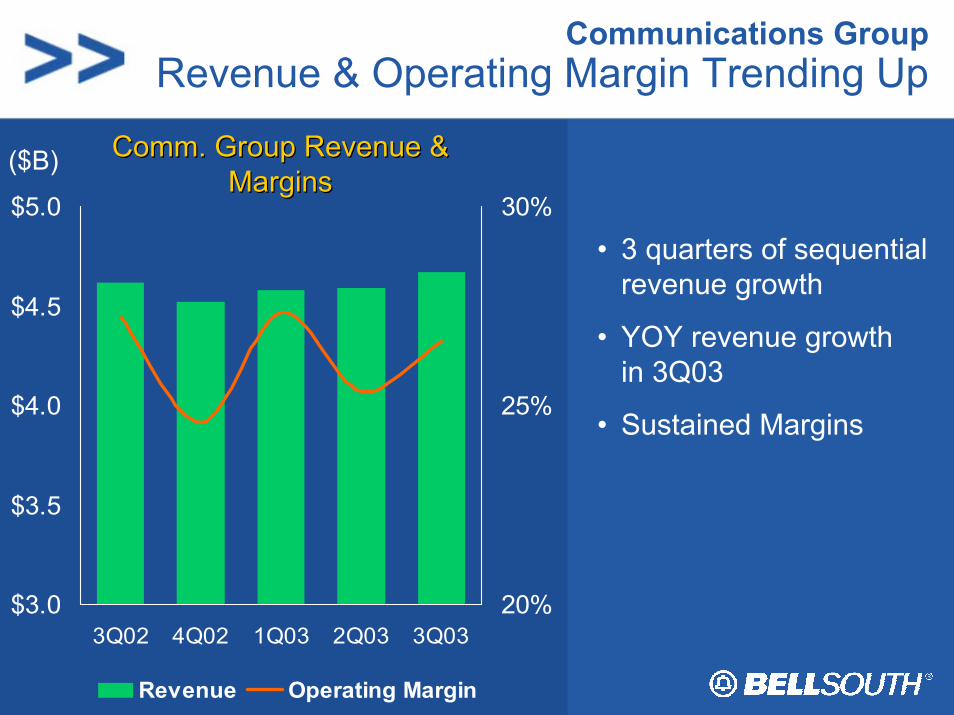
Communications GroupRevenue & Operating Margin Trending Up
Comm. Group Revenue & Comm. Group Revenue & MarginsMargins
• 3 quarters of sequential revenue growth
• YOY revenue growth in 3Q03
• Sustained Margins
$3.0
$3.5
$4.0
$4.5
$5.0
3Q02 4Q02 1Q03 2Q03 3Q0320%
25%
30%
Revenue Operating Margin
($B)
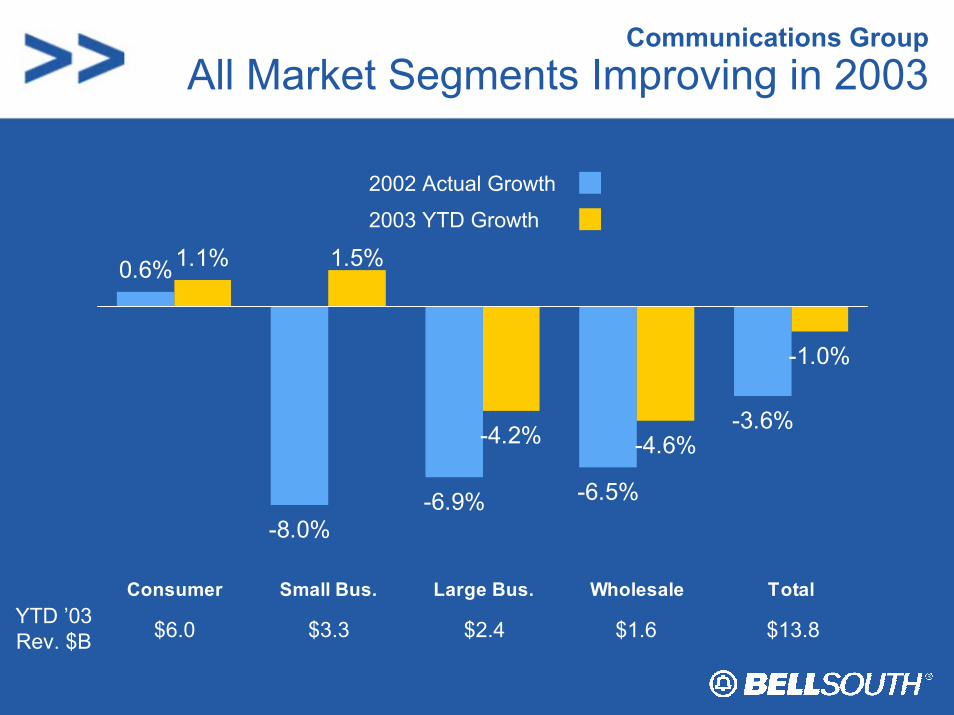
Communications GroupAll Market Segments Improving in 2003
0.6%
-8.0%-6.9% -6.5%
-3.6%
1.1% 1.5%
-4.2% -4.6%
-1.0%
Consumer Small Bus. Large Bus. Wholesale TotalYTD ’03Rev. $B $6.0 $3.3 $2.4 $1.6 $13.8
2002 Actual Growth
2003 YTD Growth
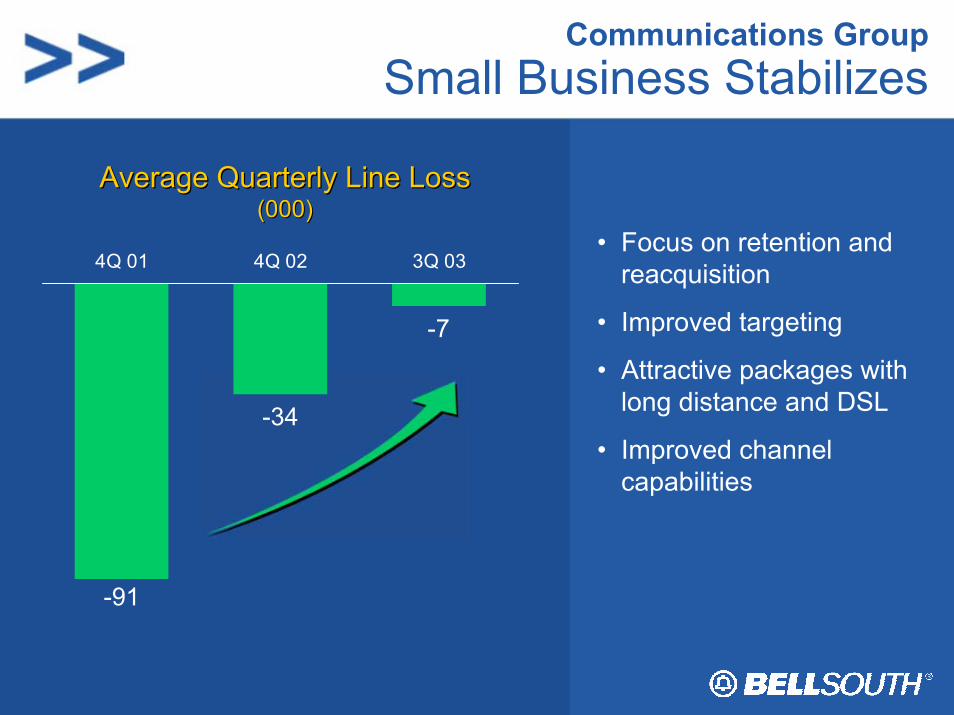
Communications GroupSmall Business Stabilizes
-91
-7
-34
4Q 01 4Q 02 3Q 03• Focus on retention and
reacquisition
• Improved targeting
• Attractive packages with long distance and DSL
• Improved channel capabilities
Average Quarterly Line LossAverage Quarterly Line Loss(000)(000)
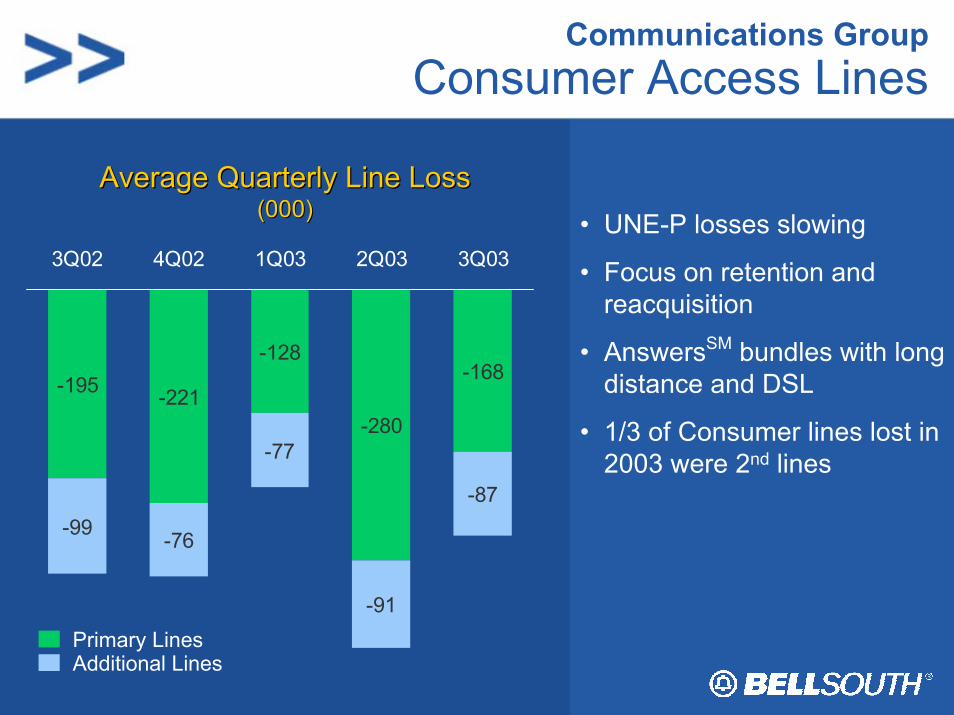
Communications GroupConsumer Access Lines
• UNE-P losses slowing
• Focus on retention and reacquisition
• AnswersSM bundles with long distance and DSL
• 1/3 of Consumer lines lost in 2003 were 2nd lines
-195 -221
-128
-280
-168
-99 -76
-77
-91
-87
3Q02 4Q02 1Q03 2Q03 3Q03
Average Quarterly Line LossAverage Quarterly Line Loss(000)(000)
Primary Lines Additional Lines
Communications GroupWholesale Transport Volumes Stabilizing
• DS1 and DS3 circuits drive ~ 60% of wholesale data revenues
• 3Q03 DS1 units grew 0.8% sequentially
• 3Q03 DS3 units stabilized
Wholesale units in serviceWholesale units in service
5
6
7
8
3Q02 4Q02 1Q03 2Q03 3Q03
250
275
300
3Q02 4Q02 1Q03 2Q03 3Q03
(000)(000)
DS1
DS3
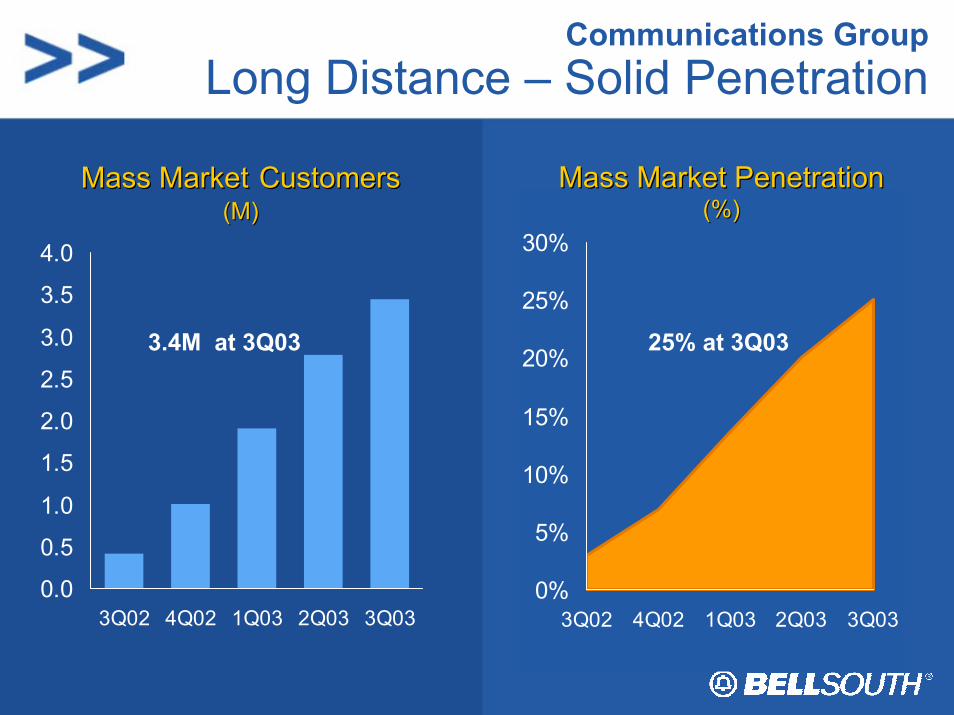
Communications GroupLong Distance – Solid Penetration
0.0
0.5
1.0
1.5
2.0
2.5
3.0
3.5
4.0
3Q02 4Q02 1Q03 2Q03 3Q03
Mass MarketMass Market CustomersCustomers(M)(M)
3.4M at 3Q03
0%
5%
10%
15%
20%
25%
30%
3Q02 4Q02 1Q03 2Q03 3Q03
Mass Market PenetrationMass Market Penetration(%)(%)
25% at 3Q03
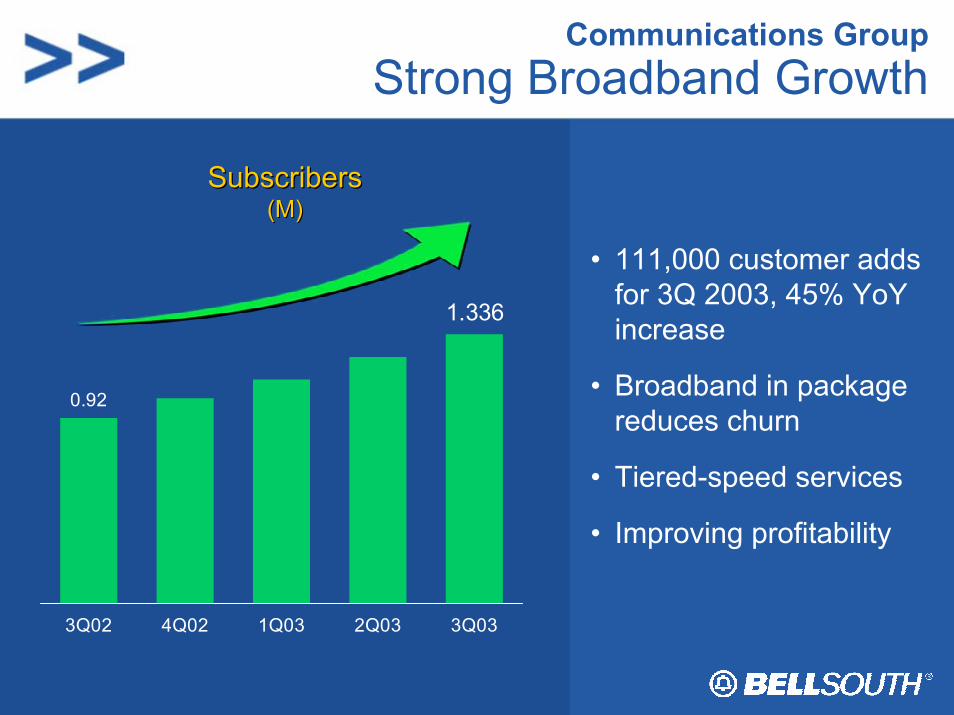
Communications GroupStrong Broadband Growth
• 111,000 customer adds for 3Q 2003, 45% YoYincrease
• Broadband in package reduces churn
• Tiered-speed services
• Improving profitability
0.92
1.336
3Q02 4Q02 1Q03 2Q03 3Q03
SubscribersSubscribers(M)(M)
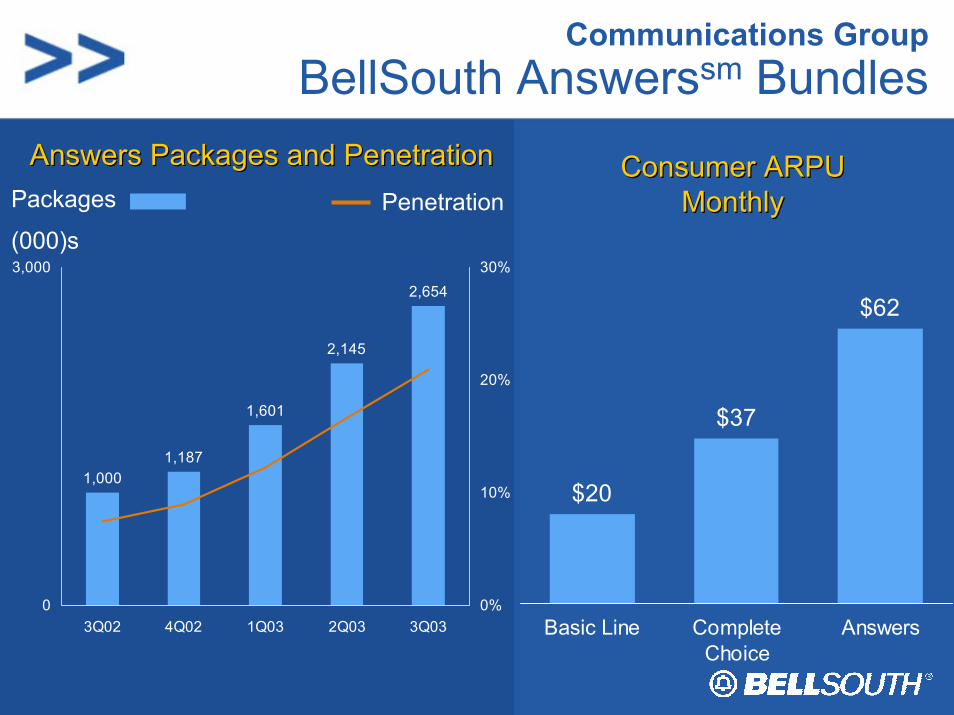
Communications GroupBellSouth Answerssm Bundles
Answers Packages and PenetrationAnswers Packages and Penetration
1,0001,187
1,601
2,145
2,654
0
3,000
3Q02 4Q02 1Q03 2Q03 3Q030%
10%
20%
30%
Packages
(000)sPenetration
$20
$37
$62
Basic Line CompleteChoice
Answers
Consumer ARPUConsumer ARPUMonthlyMonthly
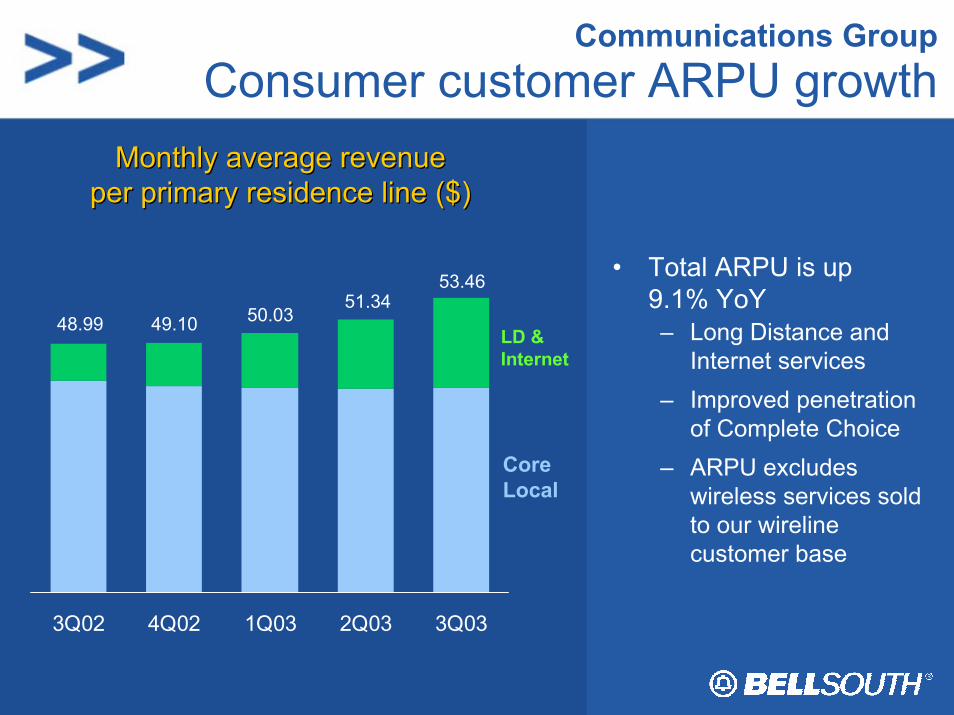
Communications GroupConsumer customer ARPU growth
3Q02 4Q02 1Q03 2Q03 3Q03
Monthly average revenueMonthly average revenueper primary residence line ($)per primary residence line ($)
• Total ARPU is up 9.1% YoY– Long Distance and
Internet services– Improved penetration
of Complete Choice– ARPU excludes
wireless services sold to our wirelinecustomer base
Core Local
LD & Internet
48.99 49.10 50.0351.34
53.46
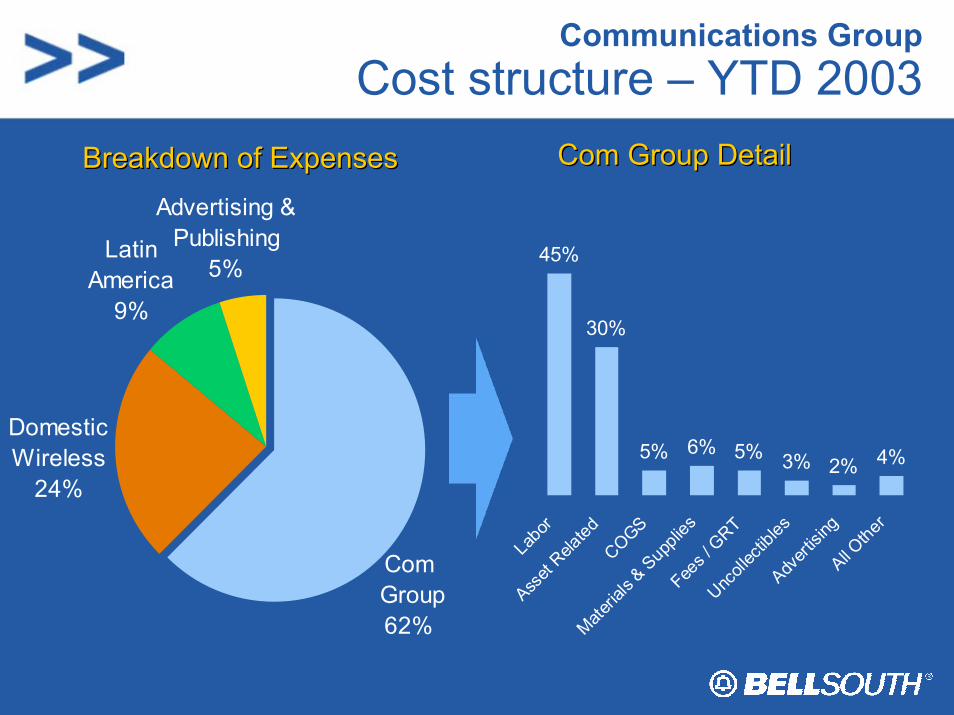
Communications GroupCost structure – YTD 2003
Com Group DetailCom Group DetailBreakdown of ExpensesBreakdown of Expenses
Domestic Wireless
24%
Latin America
9%
Advertising & Publishing
5%
Com Group62%
45%
30%
6% 5% 3% 2% 4%5%La
bor
Asset
Related
COGS
Materia
ls & S
uppli
esFee
s / G
RTUnc
ollec
tibles
Advert
ising
All Othe
r
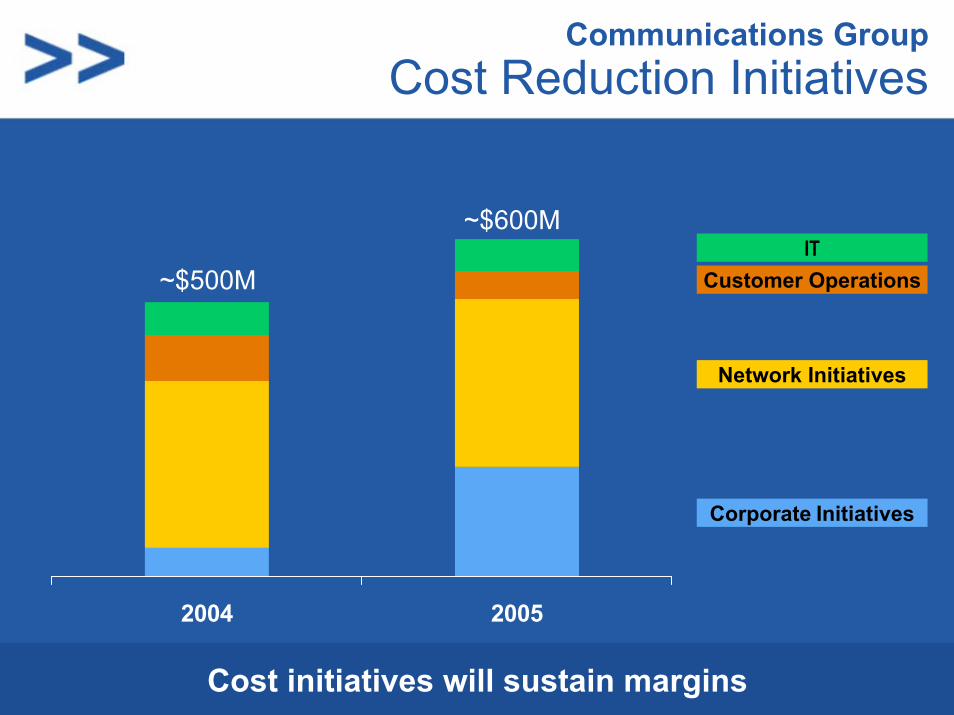
Communications GroupCost Reduction Initiatives
2004 2005
~$600M
~$500M
Corporate Initiatives
Network Initiatives
Customer OperationsIT
Cost initiatives will sustain margins
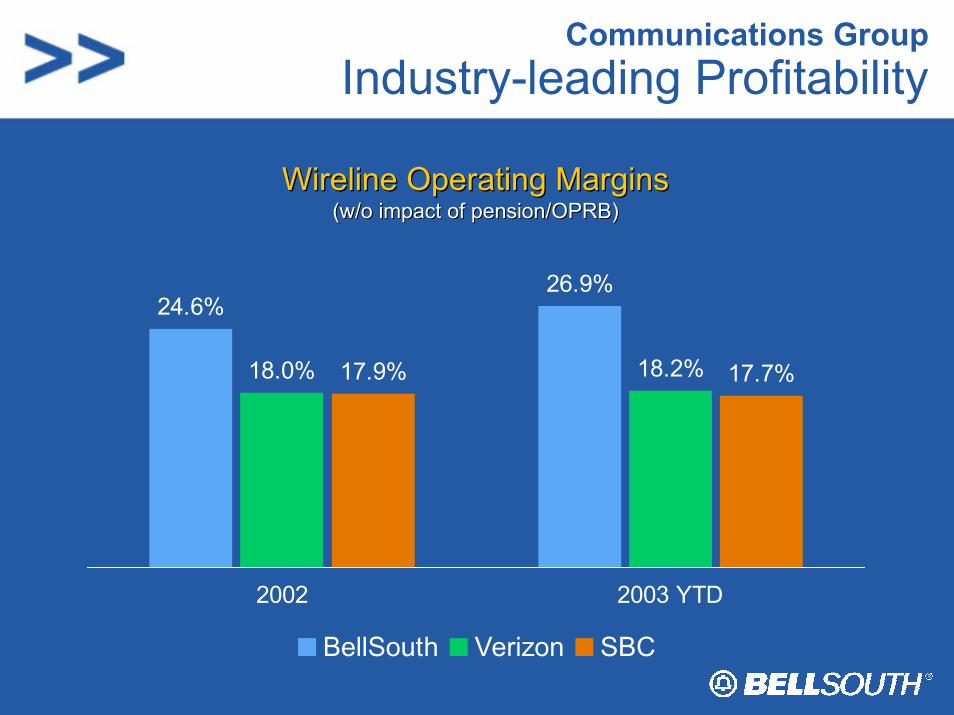
Communications GroupIndustry-leading Profitability
24.6%26.9%
18.0% 18.2%17.9% 17.7%
2002 2003 YTD
BellSouth Verizon SBC
WirelineWireline Operating MarginsOperating Margins(w/o impact of pension/OPRB)(w/o impact of pension/OPRB)
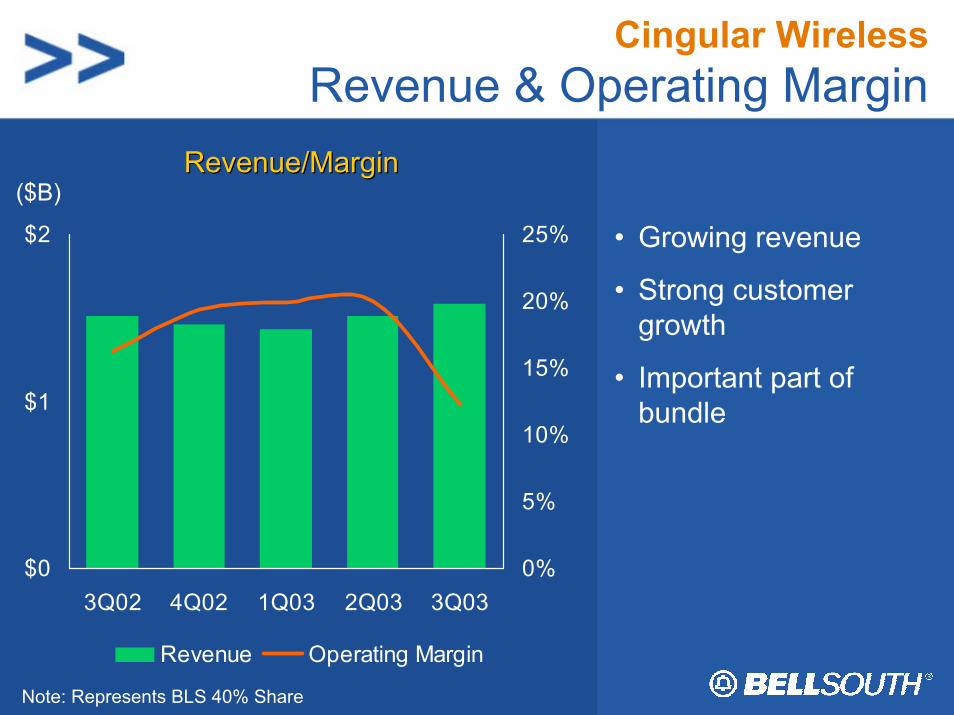
Cingular WirelessRevenue & Operating Margin
$0
$1
$2
3Q02 4Q02 1Q03 2Q03 3Q030%
5%
10%
15%
20%
25%
Revenue Operating Margin
Note: Represents BLS 40% Share
• Growing revenue
• Strong customer growth
• Important part of bundle
Revenue/MarginRevenue/Margin($B)
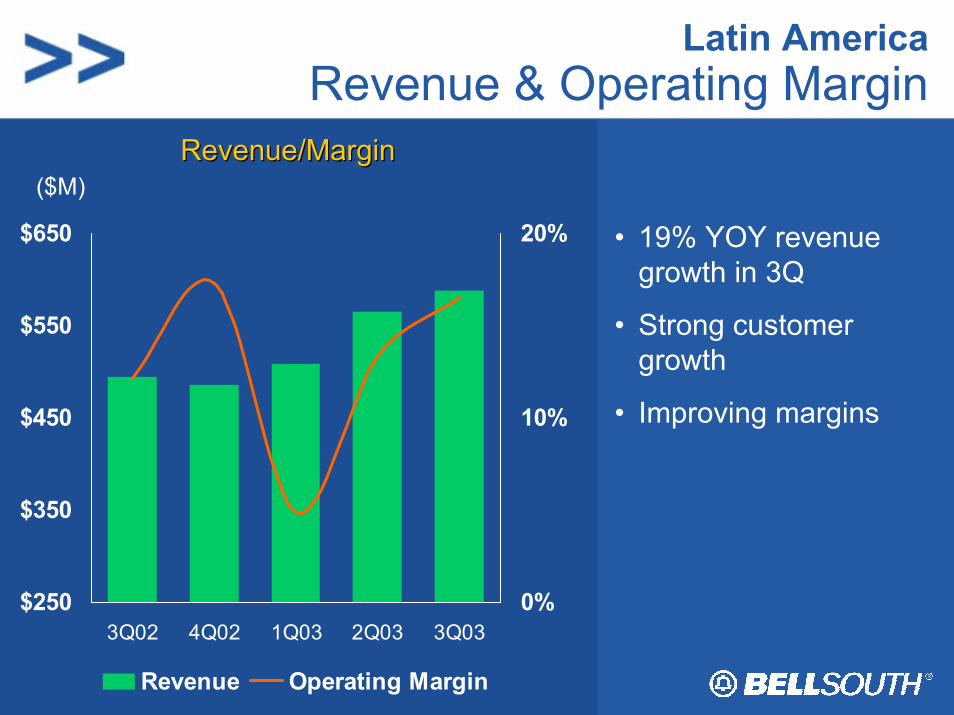
Latin America Revenue & Operating Margin
$250
$350
$450
$550
$650
3Q02 4Q02 1Q03 2Q03 3Q030%
10%
20%
Revenue Operating Margin
• 19% YOY revenue growth in 3Q
• Strong customer growth
• Improving margins
Revenue/MarginRevenue/Margin($M)
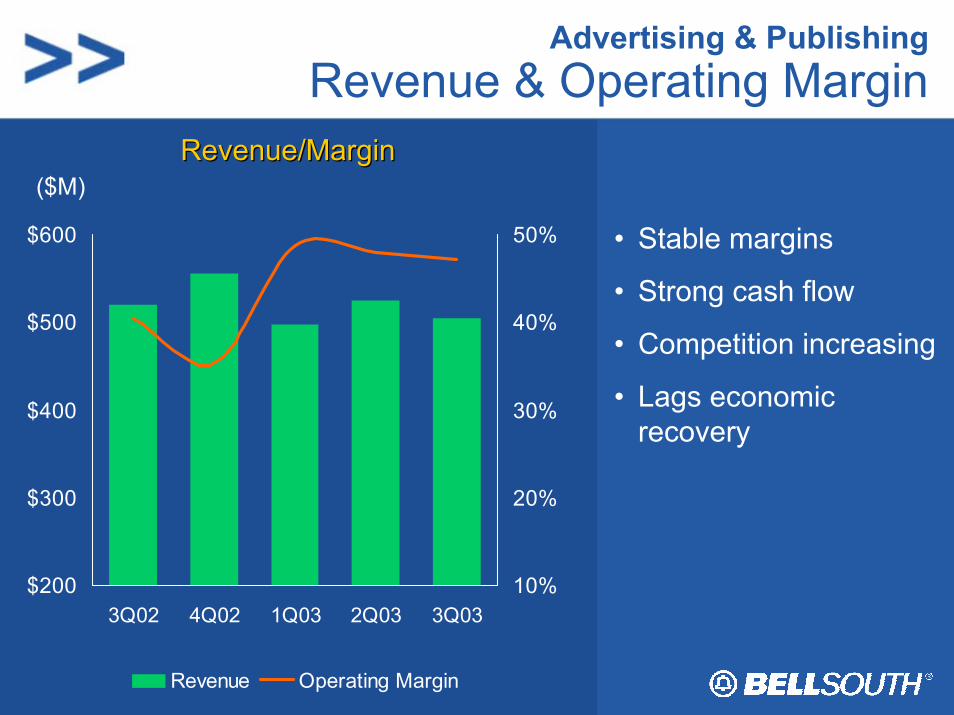
Advertising & PublishingRevenue & Operating Margin
$200
$300
$400
$500
$600
3Q02 4Q02 1Q03 2Q03 3Q0310%
20%
30%
40%
50%
Revenue Operating Margin
• Stable margins
• Strong cash flow
• Competition increasing
• Lags economic recovery
Revenue/MarginRevenue/Margin($M)
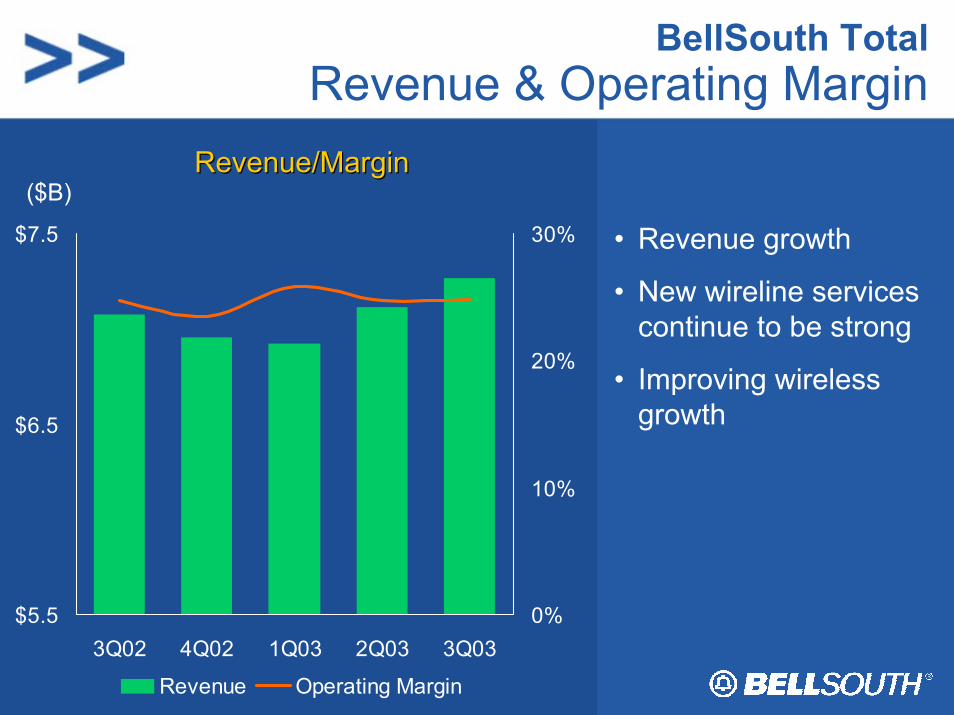
BellSouth TotalRevenue & Operating Margin
$5.5
$6.5
$7.5
3Q02 4Q02 1Q03 2Q03 3Q030%
10%
20%
30%
Revenue Operating Margin
• Revenue growth
• New wireline services continue to be strong
• Improving wireless growth
Revenue/MarginRevenue/Margin($B)
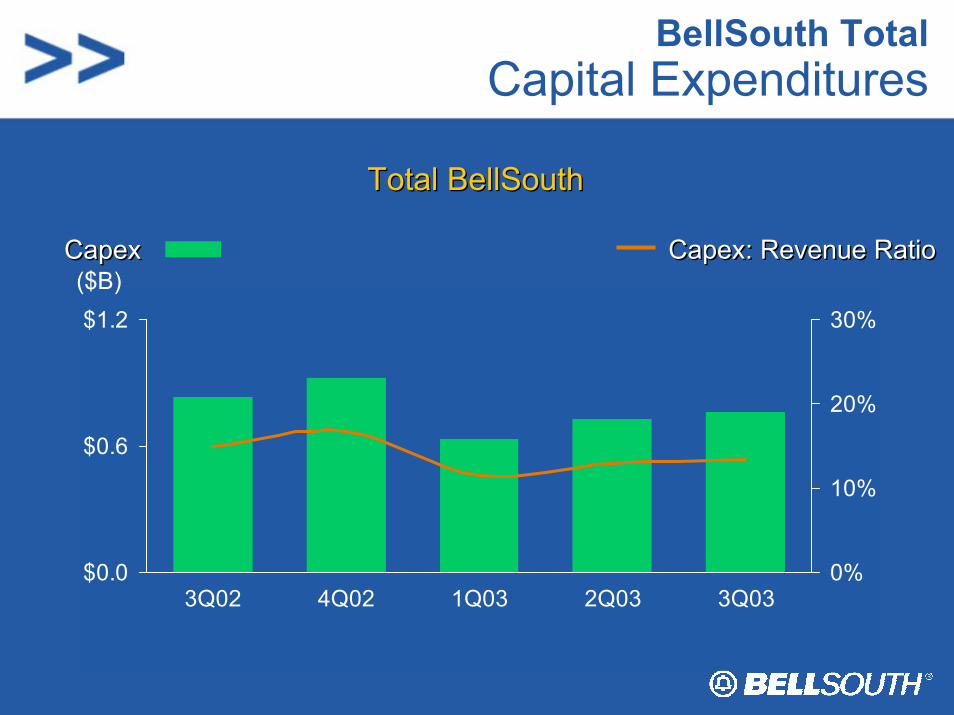
BellSouth TotalCapital Expenditures
Total BellSouthTotal BellSouth
CapexCapex Capex: Revenue RatioCapex: Revenue Ratio
$0.0
$0.6
$1.2
3Q02 4Q02 1Q03 2Q03 3Q030%
10%
20%
30%
($B)
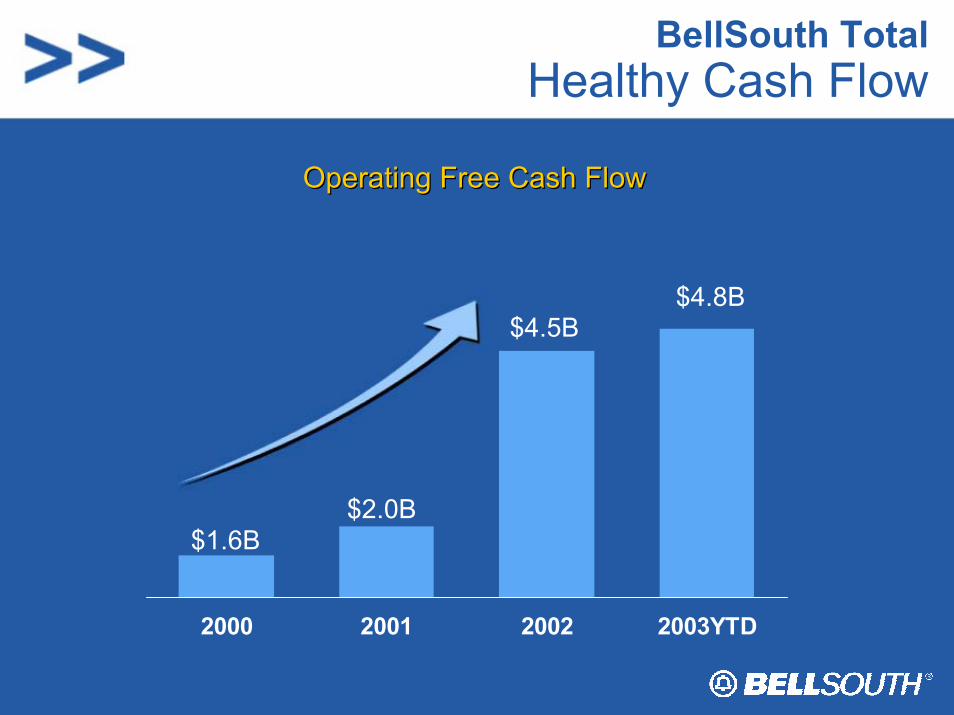
BellSouth TotalHealthy Cash Flow
Operating Free Cash FlowOperating Free Cash Flow
2000 2001 2002 2003YTD
$4.5B
$2.0B$1.6B
$4.8B
Topics for Discussion
• Key Operating and Financial Trends – 2003– Communications Group– Cingular Wireless– Latin America– Advertising & Publishing– BellSouth Overall
• Business Financial Trends – 2004
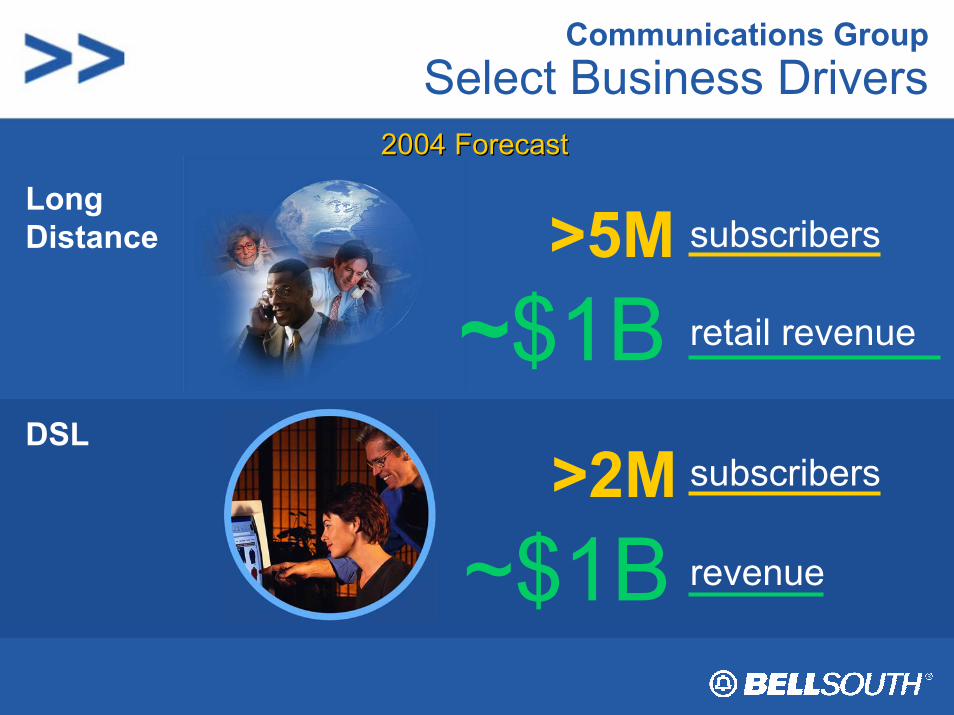
Communications GroupSelect Business Drivers
>5M subscribers
2004 Forecast2004 Forecast
~$1B retail revenue
Long Distance
DSL>2M subscribers
~$1B revenue
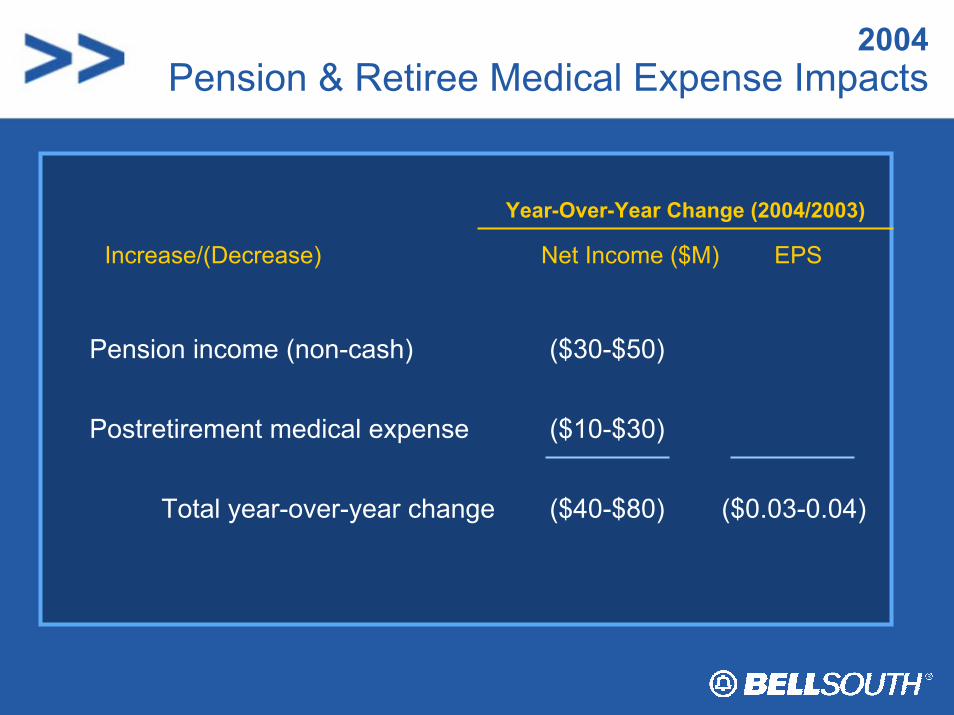
2004Pension & Retiree Medical Expense Impacts
Pension income (non-cash)
Postretirement medical expense
Total year-over-year change
Increase/(Decrease) Net Income ($M) EPS
Year-Over-Year Change (2004/2003)
($30-$50)
($10-$30)
($40-$80) ($0.03-0.04)
Business Trends:BellSouth 2004
• Total revenue (normalized)– flat to low single digit positive growth
• Capital investment– approximately 13% to 15% CAPEX to revenue ratio
• Operating free cash flow– $4 billion range
BellSouth – Demonstrating Leadership
Performance improving– strong margins
Cingular growth
Latin America growing and profitable
Strong cash flow

BellSouth: A Competitive ForceRon Dykes, CFO

BellSouth: A Competitive ForceAnalyst Briefing
New York, NYNovember 10, 2003