Belize: Selected Issues and Statistical Appendix · · 2006-10-20Belize: Selected Issues and...
85
© 2006 International Monetary Fund October 2006 IMF Country Report No. 06/370 Belize: Selected Issues and Statistical Appendix This Selected Issues paper and Statistical Appendix for Belize was prepared by a staff team of the International Monetary Fund as background documentation for the periodic consultation with the member country. It is based on the information available at the time it was completed on October 6, 2006. The views expressed in this document are those of the staff team and do not necessarily reflect the views of the government of Belize or the Executive Board of the IMF. The policy of publication of staff reports and other documents by the IMF allows for the deletion of market-sensitive information. To assist the IMF in evaluating the publication policy, reader comments are invited and may be sent by e-mail to [email protected] . Copies of this report are available to the public from International Monetary Fund ● Publication Services 700 19th Street, N.W. ● Washington, D.C. 20431 Telephone: (202) 623 7430 ● Telefax: (202) 623 7201 E-mail: [email protected] ● Internet: http://www.imf.org Price: $18.00 a copy International Monetary Fund Washington, D.C.
Transcript of Belize: Selected Issues and Statistical Appendix · · 2006-10-20Belize: Selected Issues and...

© 2006 International Monetary Fund October 2006 IMF Country Report No. 06/370
Belize: Selected Issues and Statistical Appendix
This Selected Issues paper and Statistical Appendix for Belize was prepared by a staff team of the International Monetary Fund as background documentation for the periodic consultation with the member country. It is based on the information available at the time it was completed on October 6, 2006. The views expressed in this document are those of the staff team and do not necessarily reflect the views of the government of Belize or the Executive Board of the IMF. The policy of publication of staff reports and other documents by the IMF allows for the deletion of market-sensitive information.
To assist the IMF in evaluating the publication policy, reader comments are invited and may be sent by e-mail to [email protected].
Copies of this report are available to the public from
International Monetary Fund ● Publication Services 700 19th Street, N.W. ● Washington, D.C. 20431
Telephone: (202) 623 7430 ● Telefax: (202) 623 7201 E-mail: [email protected]● Internet: http://www.imf.org
Price: $18.00 a copy
International Monetary Fund Washington, D.C.

INTERNATIONAL MONETARY FUND
BELIZE
Selected Issues and Statistical Appendix
Prepared by Andreas Bauer (Head), S. Pelin Berkmen, Gamal El-Masry (all WHD), Ruben Atoyan (PDR), and Yingbin Xiao (ICM)
Approved by Western Hemisphere Department
October 6, 2006
Contents Page Overview.......................................................................................................................................... 3 I. The Impact of EU Trade Preference Erosion on Belize .......................................................... 5 A. Belize’s Sugar and Banana Industries.............................................................................. 5 B. Reforms to the EU Trade Regime .................................................................................... 7 C. The Value of EU Trade Preferences for Belize................................................................ 9 D. The Expected Economic Impact of EU Preference Erosion .......................................... 10 E. Adaptation Strategies ..................................................................................................... 14 F. Conclusions .................................................................................................................... 16 II. Strengthening Public Debt Management in Belize................................................................ 19 A Current Debt Management Practices.......................................................................... 19 B. Roadmap to Strengthen Debt Management .............................................................20 C. Conclusions..............................................................................................................24 III. Assessment of Banking Sector Soundness ............................................................................ 25 A The Structure of the Banking System......................................................................... 25 B. Assessment Based on Financial Soundness Indicators............................................28 C. Sensitivity Tests .......................................................................................................32 D. Conclusions..............................................................................................................37 IV. Implementation of the OFC Assessment Recommendations................................................. 40 A. Implementation Status................................................................................................... 40 B. Assessment.................................................................................................................... 41 V. Exchange Rate and Competitiveness..................................................................................... 48

2
A. Is Competitiveness A Problem? .................................................................................... 48 B. Indicator-Based Analysis .............................................................................................. 49 C. Equilibrium Real Exchange Rate Analysis ................................................................... 51 D. Current Account Flows ................................................................................................. 54 E. Conclusions................................................................................................................... 56
Statistical Appendix Tables 1. Basic Data ..................................................................................................................60 2. Sectoral Origin of Real Gross Domestic product ......................................................61 3. National Accounts at Current Prices..........................................................................62 4. Savings and Investment .............................................................................................63 5. Agriculture, Forestry, Fish, and Industrial Production ..............................................64 6. Indices of Industrial Products ....................................................................................65 7. Consumer Price Index................................................................................................66 8. Price Structure of Petroleum Products.......................................................................67 9. Operations of the Social Security Board....................................................................68 10. Central Government Revenue....................................................................................69 11. Treasury Securities by Holder ...................................................................................70 12. Accounts of the Development Financial Corporation ...............................................71 13. Interest Rates..............................................................................................................72 14. Sectoral Distribution of Credit to the Private Sector .................................................73 15. Commercial Banks’ Liquidity Position .....................................................................74 16. Principal Domestic Exports .......................................................................................75 17. Domestic Exports by Standard ..................................................................................76 18. Retained Imports by Standard International Trade Classification Category .............77 19. Imports by Economic End-Use..................................................................................78 20. Sugar Exports by Destination ....................................................................................79 21. Visitor Arrivals ..........................................................................................................80 22. Direction of Trade......................................................................................................81 23. Public and Publicly Guaranteed Debt ........................................................................82 24. Indices of Effective Exchange Rate...........................................................................83

3
OVERVIEW
1. The 2006 Article IV Consultation with Belize focused on the development of a policy framework to overcome the near-term macroeconomic challenges and accomplish a return to fiscal and external sustainability and strong economic growth. In the context of this work, the mission team prepared five analytical chapters on selected economic issues, which provided background information for the development of the staff’s macroeconomic projections and its policy advice. 2. The first of these analytical chapters assesses the impact of EU trade preference erosion for bananas and sugar. As a producer of both commodities, Belize is potentially one of the most exposed countries in the Caribbean region to the reforms in the EU trade regime. We assess the macroeconomic implications of the expected decline in trade preferences using partial equilibrium and vector auto-regression estimates. The results point to significant negative effects on the trade balance, economic growth and, to a lesser extent, the fiscal balance. While adaptation measures that are being implemented for the sugar and banana industry are likely to mitigate this negative impact, and the country will in the longer run benefit from a more efficient allocation of its resources, a moderately negative net impact on the economy is nonetheless likely to dominate in the coming years. The staff’s medium-term scenarios for the 2006 Article IV consultation therefore incorporate lower annual GDP growth of ¼ percent through 2010, as well as moderate declines in export receipts for both bananas and sugar. 3. The second chapter analyzes the current state of public debt management in Belize and discusses how it could be improved. Strengthening public debt management is important because weak debt management practices in the past were in part responsible for Belize’s adverse public debt dynamics. Our analysis finds that debt management functions in Belize are significantly underdeveloped and that its institutional underpinnings are weak. To address these problems, we suggest a sequenced approach to enhance public debt management, which would involve the establishment of a dedicated debt management office, the implementation of a formal investor relations program and a gradual strengthening of the institutional framework and the existing debt management functions, with the ultimate goal to establish a full-fledged asset-liability management framework. Because of the limited domestic resources, capacity building will necessarily take time and require financial and technical assistance from the IMF and other donor sources. 4. The soundness of Belize’s banking system is the focus of the third analytical chapter. Until recently, banks had mostly operated in an environment characterized by strong growth, price stability, and ample liquidity. However, the slowdown of the economy over the past two years and the rise in market uncertainty have meant that banks are now confronting a much more adverse environment. Their capacity to endure under these conditions will be key for a successful completion of the ongoing macroeconomic adjustment

4
process and a subsequent return to sustained strong growth. Our analysis offers some comfort in this regard. The banking system seems generally sound and possesses a capital cushion that provides a buffer against exposures to market, liquidity and credit risk. The aggregate balance sheet of the banking sector also exhibits a long position in foreign currency, low exposure to the government, and maturity mismatches that are commensurate with normal banking activity. However, loan-loss provisions are low by international standards, and we therefore propose a tightening of provisioning requirements and the establishment of clear guidelines for the valuation of loan collateral. 5. The fourth chapter briefly reviews progress toward implementing the recommendations of the 2003 Offshore Financial Center (OFC) Assessment.1 The results suggest that Belize has implemented many of the recommendations, but progress has been uneven. In particular, although banking supervision has been strengthened, progress in the area of insurance supervision has proven more elusive, notwithstanding its critical importance for financial sector soundness given Belize’s significant exposure to natural disasters. Important additional steps are therefore needed to bring financial sector regulation and supervision fully up to the recommended standards, including by significantly increasing resources for insurance supervision, strengthening the independence and legal protection of bank supervisors, tightening regulations regarding large exposures and related lending practices, and establishing corporate governance rules for banks. 6. The last chapter addresses the issue of Belize’s exchange rate and external competitiveness. In 2000-2002, Belize’s current account deficit soared to more than 20 percent of GDP in response to strongly expansionary monetary and fiscal policies. Despite the more recent tightening of policies, the current account deficit has remained large, raising questions about the economy’s underlying competitiveness and the consistency of the current exchange rate to macroeconomic fundamentals. To investigate this question, previous staff studies2 are extended by analyzing a series of alternative real effective exchange rate (REER) measures and estimating an equilibrium exchange rate model. The results, however, do not suggest a deterioration of competitiveness or that the REER is misaligned relative to its fundamental determinants. These results indicate, nonetheless, that the expansionary policies of the past still weigh heavily on the current account through large interest payments on accumulated public debt, and underscore the importance of an early adoption of sound macroeconomic and other debt-reducing structural policies in order to safeguard the current exchange rate peg.
1 See IMF Country Report 04/373
2 See IMF Country Report 05/353

5
I. THE IMPACT OF EU TRADE PREFERENCE EROSION ON BELIZE1
1. The banana and sugar industries of Caribbean ACP countries have long benefited from preferential trade arrangements with the European Union (EU). Preferential access to the protected EU market has afforded producers significantly higher export prices and thus provided them with implicit income transfers. Ongoing reforms in the EU trade regimes for bananas and sugar will erode these implicit income transfers, and could thus have important economic and social effects in the affected economies.
2. As a producer of both sugar and bananas, Belize is potentially one of the most exposed countries in the Caribbean to EU trade preference erosion. To assess Belize’s vulnerability we estimate the impact of the expected decline in trade preferences on key macroeconomic variables such as economic growth, the current account balance, and the overall central government balance. We also provide information about the structure of Belize’s sugar and banana industries and describe the strategies that are being put in place for adapting to the erosion of trade preferences.
A. Belize’s Sugar and Banana Industries
3. Both the sugar and banana industries contribute significantly to value added in Belize and—aside from tourism—have been the country’s primary sources of foreign exchange earnings. Production costs and productivity in both sectors compare favorably with those in other Caribbean sugar- and banana-exporting countries, partly because of the industries’ private ownership structure.
The sugar sector
4. The production of sugar contributed on average about 3 percent to Belize’s GDP in 2000–05, while sugar exports represented abound 5 percent of total exports of goods and services. The sugar sector produces up to 1.2 million tons of cane, which yield 115,000–125,000 tons of sugar. Employment in the sector includes 6,200 independent farmers and 5,400 workers in the milling operations (about 12 percent of the total labor force).
5. The EU is the single most important export market for Belize’s sugar, absorbing about 40 percent of total production (Table 1). The vast majority of these exports enter the EU under the preferences of the ACP-EU Sugar Protocol, which grants Belize a tariff-free quota allocation of 42,000 tons. The United States and the domestic markets each absorb about 10 percent of the sugar production, while the remainder is predominantly exported into
1 Prepared by Ruben Atoyan (PDR).

6
CARICOM, where prices are at a slight premium over the world market, because of quota and duty-free market access.
2003 2004 2005 2003 2004 2005
(In tons) (In percent)Total production 104,433 116,515 100,328 100 100 100
Domestic market 10,571 11,609 11,113 10 10 11International market 71,630 104,906 89,215 69 90 89
EU Sugar Protocol 42,081 47,305 37,645 40 41 38EU Special Preference 4,275 660 2,214 4 1 2United States 10,888 10,917 11,014 10 9 11CARICOM 14,306 45,904 38,242 14 39 38Canada 80 120 100 0 0 0Other 22,232 0 0 21 0 0
Source: Belize Sugar Industry Limited.
Table 1. Destinations of Sugar Production
6. Belize is among the lowest cost sugar producers within CARICOM (Figure 1). Unlike most other sugar-producing countries in the Caribbean, the sugar industry in Belize is privately owned and does not depend significantly on government support and financing.2 The Government of Belize mainly plays a regulator role within the industry under the provisions of the Sugar Industry Act (2001).
The Banana sector
7. The banana industry contributed on average about 3 percent to Belize’s GDP in 2000-2005, and accounted for 5 percent of goods and services export receipts. The banana industry is the primary employer in the southern part of Belize, with direct
2 However, the industry has had access in the past to some limited financing at below-market rates from the Social Security Board and the Development Financing Corporation.
7
employment of nearly 2,000 persons (2 percent of Belize’s total labor force).3 Banana production is entirely in private hands, with the government providing some financial and other support to producers.4
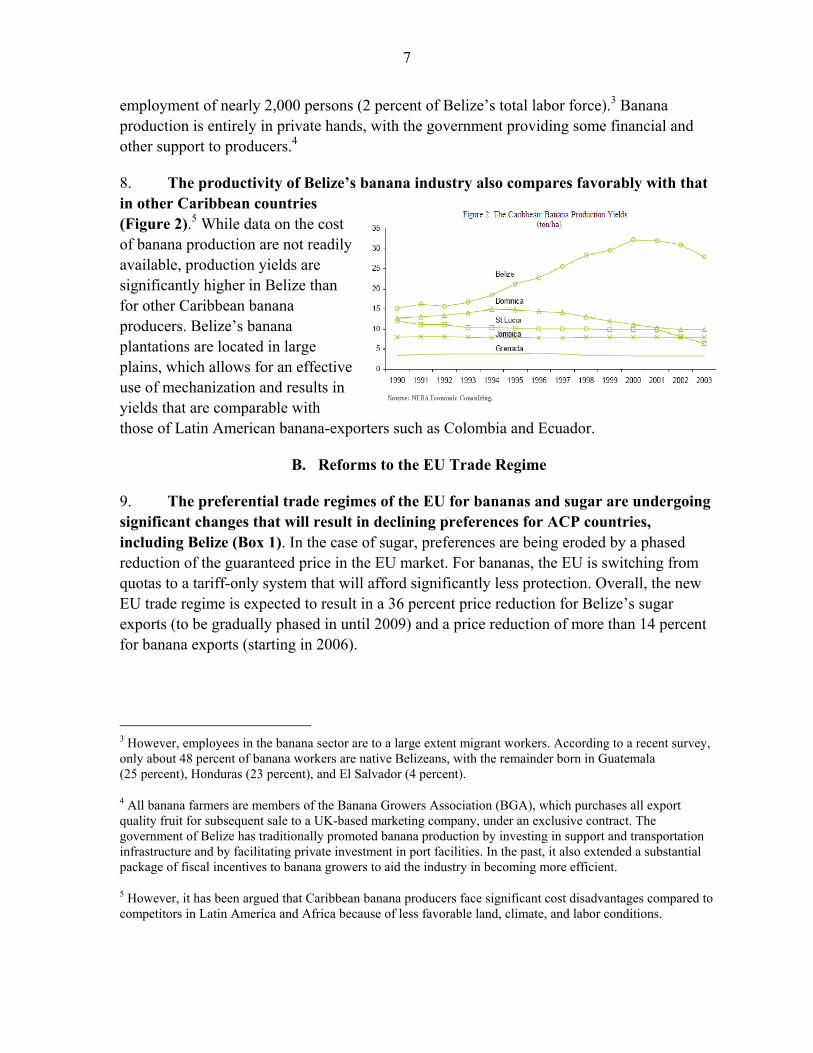
8. The productivity of Belize’s banana industry also compares favorably with that in other Caribbean countries (Figure 2).5 While data on the cost of banana production are not readily available, production yields are significantly higher in Belize than for other Caribbean banana producers. Belize’s banana plantations are located in large plains, which allows for an effective use of mechanization and results in yields that are comparable with those of Latin American banana-exporters such as Colombia and Ecuador.
B. Reforms to the EU Trade Regime
9. The preferential trade regimes of the EU for bananas and sugar are undergoing significant changes that will result in declining preferences for ACP countries, including Belize (Box 1). In the case of sugar, preferences are being eroded by a phased reduction of the guaranteed price in the EU market. For bananas, the EU is switching from quotas to a tariff-only system that will afford significantly less protection. Overall, the new EU trade regime is expected to result in a 36 percent price reduction for Belize’s sugar exports (to be gradually phased in until 2009) and a price reduction of more than 14 percent for banana exports (starting in 2006).
3 However, employees in the banana sector are to a large extent migrant workers. According to a recent survey, only about 48 percent of banana workers are native Belizeans, with the remainder born in Guatemala (25 percent), Honduras (23 percent), and El Salvador (4 percent).
4 All banana farmers are members of the Banana Growers Association (BGA), which purchases all export quality fruit for subsequent sale to a UK-based marketing company, under an exclusive contract. The government of Belize has traditionally promoted banana production by investing in support and transportation infrastructure and by facilitating private investment in port facilities. In the past, it also extended a substantial package of fiscal incentives to banana growers to aid the industry in becoming more efficient.
5 However, it has been argued that Caribbean banana producers face significant cost disadvantages compared to competitors in Latin America and Africa because of less favorable land, climate, and labor conditions.

8
Box 1. The EU Trade Preference Regime for Sugar and Bananas
Trade preferences for sugar have been granted by the EU to ACP countries (including Belize) in parallel with the Lomé Convention and the successor Cotonou Agreement. The EU maintained internal sugar prices at three to four times the world price through production quotas, import tariffs, and export subsidies. Under the EU Sugar Protocol ACP countries export 1.3 million tons of sugar duty-free at EU internal prices, with limited additional access (at preferential tariff rates) under a special preferential sugar (SPS) quota. The preferences are given by way of individual country quotas at prices similar to those received by domestic producers. In November 2005, EU agriculture ministers agreed to a four-year, 36 percent phased price reduction—from €523 per ton to €335 per ton in 2009 for raw sugar imported from ACP countries, based on cuts of 5 percent in 2006, 13 percent in 2008, and 22 percent in 2009. SPS quotas would be eliminated. Sugar imports under the Everything But Arms (EBA) initiative will expand until 2009, when they will cease to be restricted.
The EU banana regime operated on the basis of an annual ACP banana quota for duty-free export to the EU, and an annual quota for bananas from Latin America subject to a tariff. Following WTO rulings that the EU’s banana import regime discriminates against Latin American exporters, the EU pledged to switch to a tariff-only system and requested a WTO waiver authorizing tariff preferences for ACP countries under the Cotonou Agreement. Under this compromise, the EU agreed that the waiver would apply only if the new tariff is set at a level that maintains total market access for all WTO member suppliers. Beginning January 1, 2006, the EU moved to a tariff-only regime (no quotas or licenses) with an MFN tariff of €176 per ton for Latin American bananas, and a duty-free quota of 775000 tons for ACP countries. The conversion of quotas into tariffs will afford some protection to ACP banana-exporting countries, but the Caribbean banana exporters are likely to face stronger competition from more efficient African and Latin American producers. The EU Commission is developing assistance plans to support the adjustment of ACP countries to the reformed trade regime. Assistance from the European Commission to Caribbean banana-exporting countries is being provided through: (i) the Special Framework of Assistance (1999–2008), which was designed to boost the productivity of producers, encourage diversification (away from agriculture), and provide social protection; and (ii) export revenue stabilization schemes, such as STABEX. The EU committed €343 million for adjustment assistance to Caribbean ACP countries, with an allocation to Belize of nearly €22 million. However, the disbursement of assistance has been uneven, with a substantial portion of committed amounts still remaining undisbursed (Table 2). An assistance program for sugar-producing ACP countries is under development. After an initial allocation of €40 million for 2006, of which €2.7 million was earmarked for Belize, there will be a Sugar Action Plan for which the EC has proposed a resource envelope of €190 million a year over 2007−13 for all eighteen ACP countries (the final allocation level will depend on the outcome of discussions on the EU budget). Allocations for individual countries will be the result of country-specific discussions in the context of Economic Partnership Agreements.
Table 2. EU Banana Support Program for Belize
Support Ammount Ammount PercentageProgram Committted Disbursed Disbursed
(In € million) (In percent)Total ammount 21.8 6.9 31.7
SFA 1999 3.1 2.9 92.5SFA 2000 3.1 2.6 84.1SFA 2001 3.45 1.4 41.5SFA 2002 3.5 0.0 0.0SFA 2003 3.2 0.0 0.0SFA 2004 2.93 0.0 0.0SFA 2005 2.49 0.0 0.0
Source: Government of Belize.

9
C. The Value of EU Trade Preferences for Belize
10. The additional export revenue that producers derive from having preferential access to the EU market represents an implicit income transfer. The amount of this transfers, per ton of bananas or sugar, can be calculated using a price-gap methodology. The price gap is the difference between the EU market prices for sugar and bananas and the best price that could be obtained in the world market. Expressing relevant market prices in free-on-board (f.o.b.) terms and scaling the price gap by the actual export volume provides a measure of the implicit transfer.6
11. Preferential access to the EU market has afforded substantial income transfers to Belizean sugar and banana producers in the past, although these have been declining in recent years (Table 3). The implicit assistance peaked in the late-1990s, and averaged around 3½ percent of GDP (6 percent of exports of goods and services) over the past 10 years. Annual income transfers from trade in bananas have declined from a peak of around US$15 million to about US$5.5 million in recent years. Implicit transfers delivered through sugar exports have remained fairly stable in absolute terms at around US$20 million, but have fallen relative to exports and GDP.
Table 3. Belize: The Implicit Value of EU Banana Preferences, 1996–2005 1/
1996 1997 1998 1999 2000 2001 2002 2003 2004 2005
(in millions of U.S. dollars)Implicit income transfer 21.4 17.7 31.7 37.2 32.0 20.1 21.9 25.8 28.4 24.8
Of which : bananas 2.3 1.1 11.6 14.4 16.4 8.0 5.4 6.3 5.9 5.0Of which : sugar 19.1 16.6 20.1 22.8 15.6 12.1 16.5 19.6 22.5 19.8
Implicit income transfer 6.9 5.3 9.7 9.0 7.3 4.7 4.7 5.3 5.6 4.4Of which : bananas 0.7 0.3 3.5 3.5 3.7 1.9 1.2 1.3 1.2 0.9Of which : sugar 6.2 5.0 6.2 5.5 3.6 2.8 3.5 4.0 4.4 3.5
Implicit income transfer 3.4 2.7 4.6 5.1 3.9 2.3 2.4 2.6 2.8 2.4Of which : bananas 0.4 0.2 1.7 2.0 2.0 0.9 0.6 0.6 0.6 0.5Of which : sugar 3.0 2.5 2.9 3.1 1.9 1.4 1.8 2.0 2.2 1.9
Memorandum items:Average banana unit values for EU exports, US$/ton 437 443 483 506 449 423 441 436 441 508Free world market unit value (fob), US$/ton 2/ 280 310 286 266 242 260 266 263 251 261EU export unit values as a percentage of free market prices 156 143 169 190 185 163 166 166 176 195EU intervention price, raw sugar, EUR/ton 524 524 524 524 524 524 524 524 524 524Free market price, USD/ton 264 251 197 138 178 181 138 153 166 222EU intervention price as a percentage of free market price 199 208 266 379 294 289 381 343 315 236
Sources: Country authorities, WEO, U.S. Department of Agriculture, EU, and Fund staff estimates.
1/ Calculation based on fob unit values.2/ Based on Ecuador bananas exported to the United States.
(in percent of total export of goods and services)
(in percent of GDP)
6 This methodology assumes that the entire rent from the trade preference accrues to the exporting country (which tends to overestimate the implicit transfer) and that the world prices are not affected by the preferences (which tends to underestimate the implicit transfer).

10
D. The Expected Economic Impact of the EU Preference Erosion
12. The erosion of preferences caused by the reforms to the EU banana and sugar trade regimes will result in declining income transfers for Belize. We assess the macroeconomic implications of this expected decline in transfers, using partial equilibrium and vector auto-regression estimates.
Partial equilibrium estimates
13. The impact of preference erosion on the trade balance, output growth, and the overall fiscal balance can be estimated on the basis of a simple partial equilibrium model (Box 2). The model is based on a national accounting framework and calibrated using assumptions about the evolution of commodity prices and exchange rates, export supply and import demand elasticities, and consumption multipliers. The impact of the erosion of trade preferences is obtained by contrasting a baseline scenario for trade, output and fiscal outcomes under the assumption of unchanged preferences with an alternative scenario that incorporates the effect of the erosion of EU preferences. Banana and sugar production levels of 2005 are used as the baseline for the projections.
14. The partial equilibrium estimates show that the decline in EU preferences will have significant implications for Belize’s economy (Table 4). The decline in sugar preferences is projected to depress annual export revenue by about US$8 million (0.7 percent of 2005 GDP) by 2010, while for bananas the projected decline in export revenue is about US$7.5 million (0.7 percent of 2005 GDP). 7 However, the negative impact on the overall trade balance is expected to be less pronounced (about 0.4 percent of 2005 GDP), as lower exports will be partially offset by a decline in imports due to slower economic growth. Over the medium term, the erosion of EU preferences could lower nominal GDP by around 3 percent of its 2005 level, while the overall fiscal balance would deteriorate somewhat with the cumulative impact being about ½ percent of 2005 GDP.8
7 The projections for bananas are based on the assumption of a MFN tariff of €176 per ton from 2006 onward. The projections also assume, implicitly, that transport will remain available at affordable costs. However, below a certain export volume, freight costs may become prohibitive, and this would result in a far sharper contraction of banana exports.
8 The erosion of EU preferences is expected to have a particularly strong negative impact on rural communities in Belize, where farm income is likely to decline significantly. Against this background, there could be an additional fiscal burden to the extent that the authorities may be forced to increase transfers to the affected farmers, however this aspect is not modeled in this exercise.
11
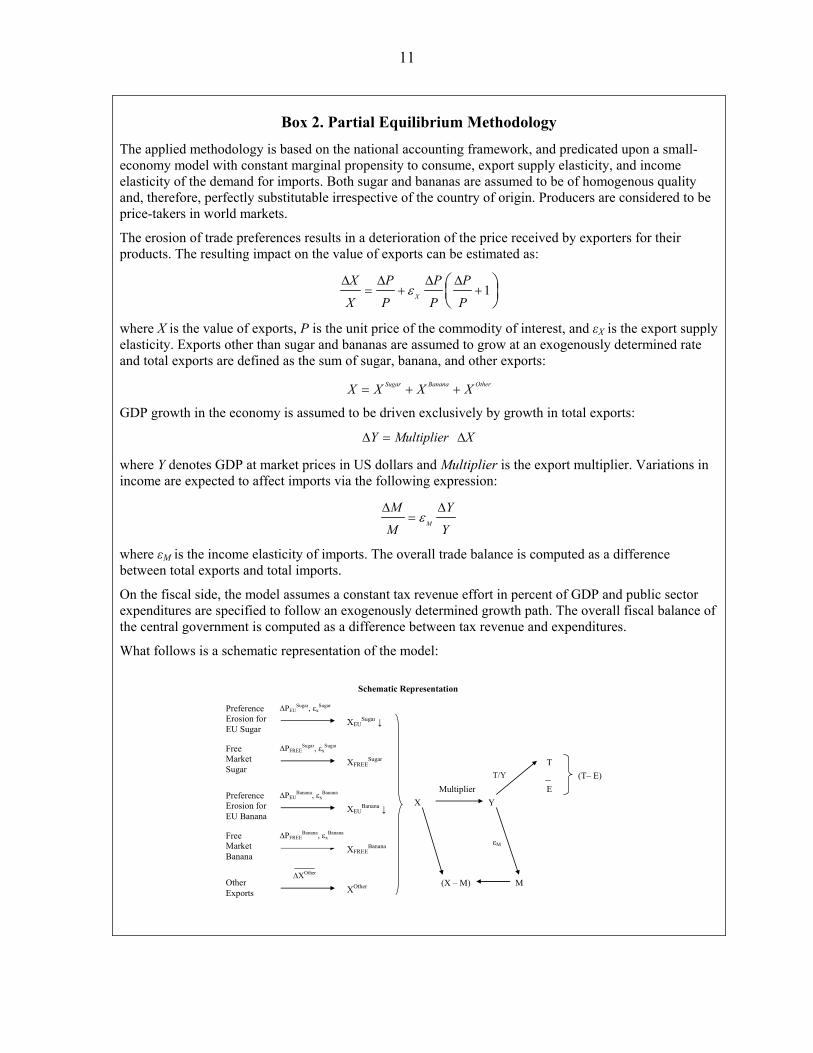
Box 2. Partial Equilibrium Methodology
The applied methodology is based on the national accounting framework, and predicated upon a small-economy model with constant marginal propensity to consume, export supply elasticity, and income elasticity of the demand for imports. Both sugar and bananas are assumed to be of homogenous quality and, therefore, perfectly substitutable irrespective of the country of origin. Producers are considered to be price-takers in world markets.
The erosion of trade preferences results in a deterioration of the price received by exporters for their products. The resulting impact on the value of exports can be estimated as:
1X
X P P P
X P P Pε
∆ ∆ ∆ ∆= + +⎛ ⎞
⎜ ⎟⎝ ⎠
where X is the value of exports, P is the unit price of the commodity of interest, and εX is the export supply elasticity. Exports other than sugar and bananas are assumed to grow at an exogenously determined rate and total exports are defined as the sum of sugar, banana, and other exports:
Sugar Banana OtherX X X X= + +
GDP growth in the economy is assumed to be driven exclusively by growth in total exports:
Y Multiplier X∆ = ∆
where Y denotes GDP at market prices in US dollars and Multiplier is the export multiplier. Variations in income are expected to affect imports via the following expression:
M
M Y
M Yε
∆ ∆=
where εM is the income elasticity of imports. The overall trade balance is computed as a difference between total exports and total imports.
On the fiscal side, the model assumes a constant tax revenue effort in percent of GDP and public sector expenditures are specified to follow an exogenously determined growth path. The overall fiscal balance of the central government is computed as a difference between tax revenue and expenditures.
What follows is a schematic representation of the model:
Multiplier ∆PEU
Banana, εxBanana
∆PFREESugar, εx
Sugar
∆PEUSugar, εx
Sugar
εM
T/Y
Preference Erosion for EU Sugar
XEUSugar ↓
Free Market Sugar
XFREESugar
Preference Erosion for EU Banana
XEUBanana ↓
Free Market Banana
∆PFREEBanana, εx
Banana
XFREEBanana
X Y
Other Exports
∆XOther
XOther
T(T– E)
M
E
(X – M)
Schematic Representation

12
2005 2006 2007 2008 2009 2010
Impact of preference erosion in sugarLoss in GDP at market prices, US$ million 0.0 1.0 2.2 3.5 9.6 15.9
loss in percent of GDP in 2005 0.0 0.1 0.2 0.3 0.9 1.5Loss in total exports, US$ million 0.0 0.5 1.1 1.8 4.8 7.9
loss in percent of GDP in 2005 0.0 0.0 0.1 0.2 0.4 0.7Loss in total imports, US$ million 0.0 0.4 0.8 1.3 3.6 5.9
loss in percent of GDP in 2005 0.0 0.0 0.1 0.1 0.3 0.6Impact on overall fiscal balance, percent of GDP 0.0 0.0 -0.1 -0.1 -0.2 -0.4
Impact of preference erosion in bananasLoss in GDP at market prices, US$ million 0.0 14.9 15.0 15.1 15.2 15.3
loss in percent of GDP in 2005 0.0 1.4 1.4 1.4 1.4 1.4Loss in total exports, US$ million 0.0 7.5 7.5 7.6 7.6 7.6
loss in percent of GDP in 2005 0.0 0.7 0.7 0.7 0.7 0.7Loss in total imports, US$ million 0.0 5.8 5.8 5.8 5.8 5.8
loss in percent of GDP in 2005 0.0 0.5 0.5 0.5 0.5 0.5Impact on overall fiscal balance, percent of GDP 0.0 -0.4 -0.4 -0.4 -0.5 -0.5
Impact of preference erosion in sugar and bananasLoss in GDP at market prices, US$ million 0.0 16.0 17.2 18.7 24.8 31.2
loss in percent of GDP in 2005 0.0 1.5 1.6 1.7 2.3 2.9Loss in total exports, US$ million 0.0 8.0 8.6 9.3 12.4 15.6
loss in percent of GDP in 2005 0.0 0.7 0.8 0.9 1.2 1.5Loss in total imports, US$ million 0.0 6.2 6.6 7.0 9.2 11.4
loss in percent of GDP in 2005 0.0 0.6 0.6 0.7 0.9 1.1Change in trade balance, US$ million 0.0 -1.8 -2.0 -2.3 -3.2 -4.2Impact on overall fiscal balance, percent of GDP 0.0 -0.4 -0.4 -0.4 -0.5 -0.6
Source: Fund staff estimates.
1/ Estimates are obtained assuming banana-export supply elasticity of 1.5, sugar-export supply elasticity of 0, export multiplier of 2, and income elasticity of imports of 0.7.
Table 4. Summary of Impact of Preference Erosion 1/
15. The estimated impact is quite robust to changes in assumptions. Sensitivity analysis shows that the model returns significant export and output losses under a variety of values for the export multiplier and supply elasticities (Table 5).
Vector auto-regression estimates
16. To investigate the plausibility of our partial equilibrium estimates, we contrast them with the results from a VAR-type reduced form model. Under the latter approach, preference erosion can be modeled as a shock to the implicit transfer that is delivered through trade at preferential terms. 9 The advantage of this
9 The ordering of variables in the VAR is as follows: implicit income transfer as a ratio to GDP, exports of goods and services as a ratio to GDP, growth rate in GDP denominated in current US dollars, and tax revenues
(continued…)
Table 5. Belize: Sensitivity Analysis 1/Loss in Loss in Loss inoutput total exports tax revenues
(In percent of GDP in 2005)Impact of preference erosion for sugar, 2010
Sugar-export supply elasticity 2/0.0 1.5 0.7 0.41.0 2.3 1.2 0.61.5 2.6 1.3 0.6
Export multiplier 3/1.0 0.7 0.7 0.22.0 1.5 0.7 0.42.5 1.9 0.7 0.5
Impact of preference erosion for bananas, 2006Banana-export supply elasticity 2/
0.0 0.7 0.3 0.21.5 1.4 0.7 0.42.0 1.6 0.8 0.4
Export multiplier 3/1.0 0.7 0.7 0.22.0 1.4 0.7 0.42.5 1.7 0.7 0.4
Source: Fund staff estimates.
1/ Results discussed in the text were generated with parameter values highlighted in bold.2/ Assuming export multiplier of 2 and income elasticity of imports of 0.7.3/ Assuming banana-export supply elasticity of 1.5, sugar-export supply elasticity of 0,
and income elasticity of imports of 0.7.
13
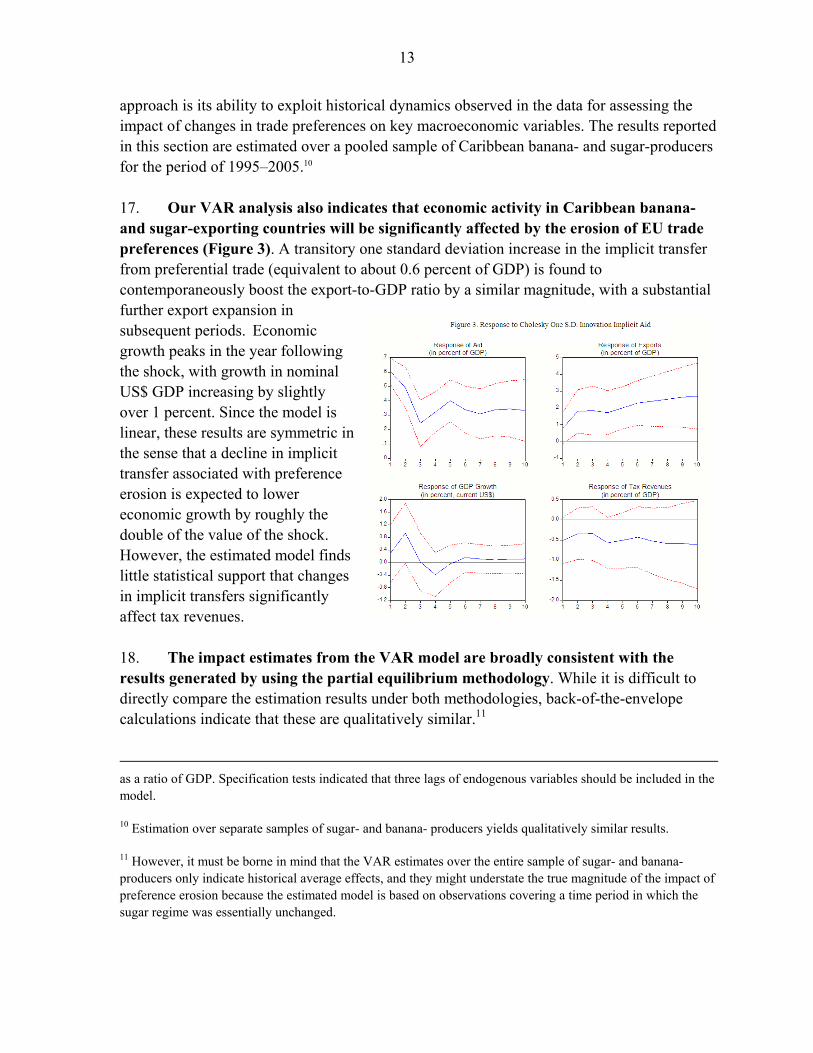
approach is its ability to exploit historical dynamics observed in the data for assessing the impact of changes in trade preferences on key macroeconomic variables. The results reported in this section are estimated over a pooled sample of Caribbean banana- and sugar-producers for the period of 1995–2005.10 17. Our VAR analysis also indicates that economic activity in Caribbean banana- and sugar-exporting countries will be significantly affected by the erosion of EU trade preferences (Figure 3). A transitory one standard deviation increase in the implicit transfer from preferential trade (equivalent to about 0.6 percent of GDP) is found to contemporaneously boost the export-to-GDP ratio by a similar magnitude, with a substantial further export expansion in subsequent periods. Economic growth peaks in the year following the shock, with growth in nominal US$ GDP increasing by slightly over 1 percent. Since the model is linear, these results are symmetric in the sense that a decline in implicit transfer associated with preference erosion is expected to lower economic growth by roughly the double of the value of the shock. However, the estimated model finds little statistical support that changes in implicit transfers significantly affect tax revenues. 18. The impact estimates from the VAR model are broadly consistent with the results generated by using the partial equilibrium methodology. While it is difficult to directly compare the estimation results under both methodologies, back-of-the-envelope calculations indicate that these are qualitatively similar.11
as a ratio of GDP. Specification tests indicated that three lags of endogenous variables should be included in the model.
10 Estimation over separate samples of sugar- and banana- producers yields qualitatively similar results.
11 However, it must be borne in mind that the VAR estimates over the entire sample of sugar- and banana-producers only indicate historical average effects, and they might understate the true magnitude of the impact of preference erosion because the estimated model is based on observations covering a time period in which the sugar regime was essentially unchanged.

14
E. Adaptation Strategies
19. Despite the erosion of EU preferences, both Belize’s sugar and banana industries are expected to remain economically viable in the future, conditional on the successful implementation of adaptation strategies. Indeed, the partial equilibrium and the VAR-type estimates of the impact of preference erosion that were presented in the preceding section do not account for any fundamental structural responses by the sugar and banana industries to the lower prices. However, both industries are in the process of implementing adaptation strategies, which seek to raise the productivity and ensure the continued profitability of banana and sugar production in Belize.
Bananas
20. The adaptation strategy that has been developed for the banana sector focuses on sustainable development in the traditional banana-growing areas of Belize. It aims at maintaining and improving the living standards of the farmers and their workers by improving industry efficiency and competitiveness through the following projects:
• Upgrade of drainage and irrigation systems and a rehabilitation of farms using tissue culture technology to increase yields;
• Pavement of highways in the banana belt and enhancement of storage facilities at the Big Creek Port to improve the quality of the banana exports;
• Enhanced disease management and monitoring to protect farm production from Black Sigatoka disease;
• Development of an appropriate and comprehensive marketing strategy leading to the establishment of a direct marketing presence for Belize in the European market;
• Development and implementation of a Rural Development Program for all banana industry workers and nearby communities to enhance workers’ ability to attain greater marketability of their skills and self-reliance;
• Enhanced environmental monitoring program to increase yields; and
• Increase the value added through better utilization of “reject” bananas.
21. Because of its socio-economic importance, the government of Belize views the survival of the country’s banana industry as a priority. The authorities intend to continue the promotion of the banana industry, mainly by developing transportation systems and infrastructure investments. As mentioned earlier, the EU has been providing financial support for the adaptation of the banana industry, although disbursements have been slow (see Box 1).

15
Sugar
22. The key stakeholders of the sugar industry in Belize, including cane farmers, sugar manufacturer and the government, have taken the strategic decision to preserve sugar production for the long term. In an environment of declining preferential access to EU markets, increased competitiveness is to be achieved through reforms to generate cost efficiencies and greater productivity.
23. The sugar adaptation strategy includes actions to raise the industry’s value added and improve operations on the field, at the factory level, and in export operations. Specific actions include:
• Field: Increased cane supply through effective deregulation of the cane production system and improved field productivity and agricultural practices; improved cane quality through reduced cut-to-mill time, improved harvesting methods and field-to-factory transportation systems, and the implementation of core sampling; organization of farmers to allow for effective financial and technical resources pooling; and introduction of a new cane payment system encouraging farmers to produce high quality cane.
• Factory: Improved product quality and increased capacity to produce packaged direct consumption sugar; and reduction of overall unit costs of production through improved field and factory costs and technical efficiencies and economies of scale.
• Export operations: Exploration of options to change the current costly and inefficient mode of transporting sugar from the factory to the ship, including opportunities that may exist in connection with developments at the Belize City Port.12
• Value Added: Construction and operation of a 25 MW cogeneration facility at the Tower Hill sugar plant to supply power and sell some 13.5 MW in excess generation to the national grid as of mid-2008; and pursuit of plans for alcohol/ethanol production to add value to molasses, which is currently mostly exported.
24. In addition to these measures, Belize also seeks to secure additional access to the EU market to mitigate the macroeconomic impact of preference erosion. To this end, Belize has requested an increase of its market allocation from the current level of 42,000 tons to 100,000 tons.
12 The current system of transporting sugar by tugs and barges is too slow and severely constrains ship loading time (about 21 day per ship), resulting in higher freight costs. Possible options include dredging Belize City port to allow usage of the facilities by large ships and creating an offshore storage and loading facilities.

16
25. The success of the sugar adaptation strategy will depend critically on the availability of affordable financing (Table 6). The Belizean authorities have estimated that the total cost of the adaptation strategy is around US$140 million, of which domestic financing is expected to cover some US$62 million (about 44 percent). The authorities also hope for substantial support from the EU for the strategy. To ensure that the restructuring plans are effectively implemented, it will be important that funding can be mobilized in a front-loaded manner.
26. While adjustment burden will necessarily fall on the private sector, the Government of Belize can take a pro-active role in the adaptation process. Aside from facilitating reforms, government actions could focus on (i) assisting in securing sufficient access to the EU sugar market, (ii) supporting the pooling of resources on the side of cane farmers and the sugar manufacturer, and (iii) possibly facilitating access to financial resources to bridge an anticipated delay in the EU financial assistance.
F. Conclusions
27. The erosion of EU trade preferences for bananas and sugar will have immediate negative implications for Belize’s economy. While point estimates of the macroeconomic impact depend to some extent on the applied methodology and assumed model parameters, we find a significant negative effect on the trade balance, economic growth, and the overall fiscal balance. For instance, over the medium term, the erosion of EU preferences is estimated to lower nominal GDP by around 3 percent.
28. Adaptation measures by the sugar and banana industries and a more efficient reallocation of resources could limit the expected negative macroeconomic impact from the removal of trade preferences. Both the sugar and banana industries are likely to remain economically viable due to relatively favorable cost structures, and both industries are embarking on measures that are intended to raise their productivity and profitability. These measures would raise value added and thus provide some counterweight to the expected decline in prices in the EU market. However, it will be important that private sector and donor resources are mobilized to fund these adaptation measures, to avoid that the government of Belize’s efforts to place the fiscal and balance of payments positions on a sustainable basis are undermined. In the long run, the dismantling of preferential schemes
Table 6. Expected Costs of Belize Adaptation Strategy for Sugar, 2006–15
(In US$ million) (In percent)Total cost 140.0 100.0
Field productivity improvements 49.7 35.5Factory 11.2 8.0Transportation system upgrades 4.2 3.0Value added 74.9 53.5
External sources 78.4 56.0Of which : EU 55.1 39.3
Internal sources 61.6 44.0Belize Sugar Industry 58.5 42.0Sugar Industry Welfare Fund 1/ 3.0 2.1Government of Belize 0.1 0.1
Source: Belize Country Adaptation Strategy for the Sugar Industry.1/ Joint venture of sugar cane farmers and BSI.
17
should be beneficial to Belize’s economy as the removal of a price distortion will allow for an allocation of resources that is more in line with the country’s comparative advantage.13
29. However, even if the planned adaptation measures are successful, a moderate negative net impact on the economy is likely to dominate in coming years. The staff’s medium-term scenarios for the 2006 Article IV consultation are therefore predicated upon lower annual GDP growth of about ¼ percentage point per year through 2010, as well as moderate declines in export receipts for both sugar and bananas.
13 See Hoekman and Ozden (2005) and Topp (2001) for more discussion of the long-term benefits of the dismantling of trade preferences.

18
References
Hoekman, B. and Ozden, C., 2005, “Trade Preferences and Differential Treatment of Developing Countries: A Selective Survey” World Bank Policy Research Working Paper No. 3566.
Topp, V., 2001, “Trade Preferences: Are they Helpful in Advancing Economic Development
in Poor Countries?” ABARE.

19
II. STRENGTHENING PUBLIC DEBT MANAGEMENT IN BELIZE1
1. Recent sovereign debt crises have highlighted the importance of sound public debt management policies and practices. Such policies and practices ensure that a country’s public debt remains sustainable, and that financing needs and payment obligations are met at a minimal cost over a medium- to long-term horizon, without taking excessive or unnecessary risk.2
2. Weaknesses in debt management practices have contributed to Belize’s adverse public debt dynamics. Large fiscal imbalances forced the authorities to borrow aggressively from capital markets. The need-based borrowing without sufficient consideration of repayment capacity, cost, and risk led the authorities to take on substantial unfavorably-structured debt. This chapter analyzes the current state of debt management practices in Belize (Section A) and suggests avenues for improvement (Section B).
A. Current Debt Management Practices
3. Debt management functions in Belize are significantly underdeveloped. Currently, the Ministry of Finance (MoF) and the Central Bank of Belize (CBB) share some limited debt management functions. Specifically, the MoF handles debt origination and debt-servicing, while the CBB deals with record-keeping and settlement. There is no well-defined financing plan and decisions on debt issuance are typically taken as needs arise. There are no dedicated personnel and no formal analyses of the costs and risks that are inherent in the government’s debt structure.
4. The institutional framework for debt management is relatively weak, and the authorities have only started to strengthen transparency policies. The Treasury Bill Act of Belize specifies a rigid ceiling for domestic borrowing through the issuance of treasury bills and notes. The Central Bank of Belize Act also imposes limits on central bank credit to the central government. However, there is no clear limit on external borrowing except that loans in excess of BZ$10 million require parliamentary approval. In terms of information sharing and dissemination, the authorities have recently made information available on the central bank’s website on fiscal developments and other announcements related to the possible restructuring of the external public debt to commercial creditors. However, there is no formal investor relations program. The authorities have also begun to participate in the
1 Prepared by Yingbin Xiao (MCM).
2 See IMF, World Bank: Guidelines for Public Debt Management, http://www.imf.org/external/np/mae/pdebt/2000/eng/intro.htm.

20
Fund’s General Data Dissemination System (GDDS), but there is still room to strengthen the frequency, timeliness and coverage of the economic statistics that are being provided.
B. Roadmap to Strengthen Debt Management
5. The high costs that have been incurred in the past and risks that are inherent in the central government’s debt structure call for strengthening Belize’s debt management. Putting in place a sound framework for debt management would involve at least three steps. First, resources devoted to debt management would need to be boosted, including through the establishment of a dedicated debt management office (DMO). Second, the legal framework for debt management and the government’s transparency policies should be strengthened. Finally, a portfolio and risk management framework would need to be put in place to guide decisions in the area of public indebtedness.
Establishing a debt management unit
6. The establishment of a dedicated DMO would help enhance and centralize debt management functions. In the case of Belize, the DMO could reside in the MoF, which would centralize and streamline the debt management process. The DMO should take charge of core debt management functions─debt policy and strategy formulation and analyses, debt-raising activities, debt recording and monitoring, and the registrar and payment function for government securities. The CBB could be the agent for effecting external debt payments, conducting primary market issues, and issuing and redeeming treasury bills and notes.
7. The DMO should be operationally divided into front and back offices and cover the main financial obligations of the government. The front office would take charge of executing transactions in financial markets, such as managing auctions and other funding operations, and relations with market participants. The back office would deal with the settlement of transactions, the maintenance of financial records, and the analyses and reports of risks. The responsibility of the DMO should cover marketable debt and concessional financing secured from bilateral and official sources, as well as potential exposures arising from off-balance sheet claims on the central government such as contingent liabilities or guarantees.
8. Establishing the DMO would help clarify the roles and responsibilities of the DMO, the MoF, and the CBB, and thus strengthen coordination of monetary and fiscal policies. Prudent debt management, fiscal, and monetary policies can reinforce each other in lowering the risk premia in the debt structure. The DMO’s analysis of cost and risk in the government’s debt composition may contain useful information for the MoF’s debt sustainability analysis. The DMO’s observation of investor behavior and discussion with market participants would ensure a better understanding of investor willingness to hold Belizean debt. Hence, the DMO’s role in designing the debt structure could complement the

21
MoF’s role in setting the debt levels and help identify any emerging debt sustainability concerns.
Strengthening the institutional framework and transparency policies
9. The institutional framework should be enhanced to clearly define the roles and mandates of debt management, possibly through legislation. The Treasury Bill Act’s limits on domestic borrowing should be complemented with a ceiling on external borrowing. In addition, the organizational framework surrounding debt management should be well articulated, particularly regarding coordination and information sharing. To improve accountability, debt managers should be encouraged to prepare annual debt management reports, which review the previous year’s activities, lay out borrowing plans for the current year based on annual budget projections, explain the assumptions and trade-offs underling the debt plan, and disclose the performance of the DMO.
10. Improving transparency policies would involve publishing Belize’s debt management objectives, policies, and operations through the creation of a formal investor relations program (IRP). An IRP could increase investors’ familiarity with Belize’s economic and debt management objectives, policies, and operations and foster an ongoing dialogue between the authorities and investors. To facilitate the forthcoming debt restructuring, the authorities have made a website available to publish economic data and debt-related announcements. After the restructuring, this website, along with other means of communication, such as e-mails, conference calls, road shows, responses to individual inquires, and meetings with market participants, could be used to disseminate and update debt management information and maintain regular contact with creditors. Such improved disclosure and communication would enhance the credibility of government policies, improve governance and accountability, and reduce uncertainty.
Building a portfolio and risk management framework
11. To ensure that Belize has the capacity to incur new debt and honor its payment obligations over time, the DMO should develop an effective debt management strategy. The strategy would assess the appropriate level of borrowing, debt-service costs, sources of financing, the choice of instruments, the maturity structure, currency composition, and interest rate structure of the debt portfolio. All of this calls for building a portfolio and risk management framework. In light of Belize’s limited resources, the following steps can be taken in the order of priority.
12. In the short term, the authorities should seek to put in place cost-effective cash management policies. Because of the uncertainty surrounding access to international markets and the lack of a well-developed domestic capital market, it would be desirable to line up some backup sources of funding, such as liquid financial assets and contingent credit lines. These would enable the authorities to honor their obligations, while providing a
22
cushion to absorb shocks when market access is very costly or temporarily cut. However, since liquidity provided by this type of funding generally comes at a cost, it will therefore be important to manage these resources in a cost-efficient fashion.
13. The government should consider further steps to minimize risk exposures associated with contingent liabilities. These should seek to limit the total face value of contingent liabilities; minimize both the likelihood of contingent liabilities being called and the government’s liability if a call is made; further strengthen governance and transparency of quasi-fiscal entities; and improve recording and monitoring of contingent liabilities.
14. The DMO should build a comprehensive debt database. Belize has been using the Commonwealth Secretariat Debt Recording and Management System (CS-DRMS) to record most of its external debt. The system can record basic details and terms of an instrument and actual transactions. The authorities should consider using the external debt module to include all external debt and the domestic debt module to cover domestic debt. Although the system seems to leave out some complex terms embedded in Belize’s debt instruments such as insurance and options, it represents a good starting point to build and maintain an inventory of Belize’s public debt in one place.
15. Once the information in the debt database has been completed, the DMO should undertake regular reviews of the debt portfolio. Overall, the debt portfolio could be broken down by creditor sources (multilateral, bilateral, and commercial), borrower type, (government, parastatal ), economic sectors, and use of funds (project finance, BoP support, debt relief, and commodity assistance). Within each category, the DMO should analyze the relative balance, trends, shifts, concessions, guarantees, and insurance of each type. The DMO should also examine debt composition in terms of maturity, currency, and interest rate. In particular, it should compare maturities from different sources of finance, highlight any bunching of maturities, examine the currency composition against currency of export earnings and FX reserves, and identify over-exposure to fluctuating currencies or variable interest rates.
16. By combining information from the debt database with relevant macroeconomic variables, the DMO could develop a system to regularly monitor reserve adequacy and debt vulnerability. Reserve adequacy could be evaluated based on indicators such as reserves over short-term external debt, reserves over imports, and reserves over broad money. Debt vulnerability could be partially assessed by indicators such as external debt-to-exports, external debt-to-GDP, average interest rate on external debt, average maturity, and share of foreign currency external debt in total debt. However, it should be kept in mind that, while useful, these indicators have limitations in revealing the sensitivity of the debt structure to market movements and should therefore over time be complemented with more sophisticated methods of analysis (see below).

23
17. After the previous steps have been completed, the debt managers could make increasing use of the management tools module in CS-DRMS to assess new borrowing using scenario analysis and sensitivity tests. The module allows the debt managers to analyze the effects of different levels of new borrowing and compare different terms based on certain criteria in a simple scenario framework. Debt managers can also test the impact of interest rate and exchange rate volatility on the debt stock and debt-servicing costs, and stress test the portfolio for economic and financial shocks to which the government is potentially exposed. This would enable the DMO to identify and manage the trade-offs between expected cost and risk in Belize’s government debt portfolio.
18. The ultimate goal in the longer term would be to gradually introduce more sophisticated models of debt service projection and to move toward an integrated analysis of cash flows under a full-fledged asset-liability management framework (ALM). The CS-DRSM module cannot address all the debt management needs of Belize. It has limited functionality and coverage, currently working only with external loans. Once the DMO has secured more resources and gained sufficient capacity through training its staff, it should move to more advanced debt-service projections using complex models involving sophisticated statistical and simulation techniques. Developing full-fledged ALM would imply moving toward an integrated analysis of the cash flows arising from both assets and liabilities. In the case of Belize, this would mean that in order to manage comprehensively fiscal risks, borrowing decisions would need to take into account the timing, volatility, and magnitude of revenue, including from oil, the availability of international reserves, and the exposure to natural disasters.
Timing and resources
19. Strengthening Belize’s debt management will take time and requires additional resources. Building institutional capacity and training staff to achieve competency may be a long process, and therefore it will be critical to prioritize measures and take a phased approach. Resource constraints pose an additional challenge, particularly if the country is going to undertake a debt restructuring. To boost resources, the authorities may consider mobilizing donor funds and seeking technical assistance from the Fund and other regional and international financial institutions.
20. To make efficient use of time and resources, the recommended measures could be implemented in a sequential manner. Initially, the existing debt management functions could be expanded by building a debt database, monitoring contingent liabilities, and implementing cash management policies. With some minor legislation changes and the hiring of a small number of qualified staff, the authorities could also establish a DMO and initiate an IRP. As more resources and technical assistance become available, the efforts could be shifted toward strengthening the institutional framework, formulating a comprehensive debt management strategy, and developing ALM.

24
C. Conclusions
21. This chapter suggests ways to enhance public debt management in Belize. In particular, it proposes establishing a debt management office, strengthening the institutional framework, developing an investor relations program, and building step-by-step a portfolio and risk management framework that could ultimately evolve into full-fledged asset-liability management. Sound debt management, coupled with other supportive policies, would help the country restore its fiscal and external sustainability and enhance the credibility of the authorities’ medium-term framework.
25
III. ASSESSMENT OF BANKING SECTOR SOUNDNESS1
1. Belize’s banking system is facing challenging times. Until recently, banks had mostly operated in an environment of strong economic growth, price stability and ample domestic and international liquidity. However, over the past two years the economy has begun to decelerate under the weight of tighter monetary and fiscal policies, and market risks and more generally uncertainty have risen.
2. Against this background, this chapter assesses the vulnerability of the banking sector. Section A provides a brief description of the structure of Belize’s banking system and its balance sheet, followed by an assessment of the banking sector based on a broad set of financial soundness indicators (Section B). Since these indicators are relatively static and offer a somewhat backward-looking measure of balance sheets, they are supplemented by sensitivity tests (Section C).
A. The Structure of the Banking System
3. Belize’s commercial banking sector is composed of five domestic and seven offshore banks.2 Domestic banks are authorized to undertake business with residents, in both domestic and foreign currency, while offshore banks are authorized to deal with non-residents, exclusively in foreign currency.3 Offshore banks are also allowed to do business with firms operating in Export Processing Zones (EPZs), Commercial Free Zones (CFZs), and government agencies with certain limitations.
4. Domestic banks account for the dominant share of banking activity. As of June 2006, domestic banks held total assets of about 80 percent of GDP, while assets held by offshore banks amounted to 12 percent of GDP. Because of the relatively small size of offshore banking activity, the assessment in this chapter focuses mainly on domestic banks. Some basic information about the regulation and financial health of offshore banks is provided in Box 1.
1 Prepared by Pelin Berkmen (WHD).
2 In addition, there are 14 registered credit unions that engage in deposit taking and lending activities. However, the central bank has only recently obtained a mandate to supervise these entities, and more detailed financial information on these entities is only expected to become available later this year.
3 In Belize’s legislation, offshore banks are referred to as international banks.

26
Box 1. Offshore Banks The prudential framework for offshore banks is broadly similar to the one for domestic banks. While the risk-weighted capital-asset requirement is slightly higher for offshore banks (10 percent) than for domestic banks (9 percent), other regulations, such as those pertaining to credit classification and loan-loss provisioning, are identical.
In general, offshore banks appear to be financially sound. Their risk-weighted-capital-asset-ratios are well above the legal requirement, with an industry average of about 36 percent. The system is overall profitable, with the larger banks exhibiting higher profitability. Banks are also highly liquid, as liquid asset holdings more than double the statutory requirement for the system.
One distinct feature of the offshore banks is that out of seven banks only the largest one reports any adversely classified loans. For this bank the share of adversely classified loans in its total loan portfolio is relatively large (21.7 percent), while loan-loss provisions are very low.1 Even though, most of the remaining banks are very small, the complete lack of adversely classified loans merits closer examination by the bank supervisor to ensure that loan classification and provisioning rules in these banks are being correctly applied. _____________________________________
1 Specific loan-loss provisions only cover 3.6 percent of adversely classified loans.
Source: Central Bank of Belize and Fund staff estimates
Net Earnings (BZ$'000,000) 2/
0
1
2
3
4
5
6
7
8
Total Bank 1 Bank 2 Bank 3 Bank 4 Bank 5 Bank 6 Bank 7
Capitalization 1/
0
10
20
30
40
50
60
Bank 1 Bank 2 Bank 3 Bank 4 Bank 5 Bank 6 Bank 7
Statutory requirement(10 percent)
Excess Statutory Liquidity 3/
0
50
100
150
200
250
300
350
Bank 1 Bank 2 Bank 3 Bank 4 Bank 5 Bank 6 Bank 7
Industry average
3/ In percent of the statutory liquidity requirement.
1/ Capital to risk weighted assets ratio in percent.
2/ Sum of the last four quarters.

27
5. The banking system is entirely private, with both foreign and local ownership, and highly concentrated. There are no publicly owned commercial banks in Belize. Two banks are owned by international banks, one of them as a branch and the other one as a wholly-owned subsidiary. One bank has majority foreign ownership, and the remaining two banks are locally owned. The three largest banks account for more than 80 percent of all lending and 75 percent of deposits. Similarly the Hirshman-Herfindahl index for deposit concentration reaches about 2,500, a figure that is much higher than in many other emerging market countries.4 6. Banks are focused on traditional commercial banking activities, including the provision of demand, savings, and time deposits, and demand and term loans, including residential mortgages. The lending portfolio is concentrated in the real estate and consumer sectors, which account for about 60 percent of all loans and advances by the domestic banks (Figure 1). Lending to export sectors (primary sectors and tourism) accounts for about 20 percent of the loan portfolio, while credit to the government and the utility sectors is marginal.
Figure 1. Credit Distribution, June 2006
Government Services2%
Utilities3%
Primary Sectors12%
Manufacturing1%
Tourism7%
Real Estate and Construction
36%
Services18%
Consumer Loans21%
7. The safety net for the banking system and the systemic liquidity infrastructure in Belize are underdeveloped. While the central bank has an overdraft line at which banks can satisfy unforeseen liquidity needs at penalty rates, there is no deposit insurance. Check clearing occurs manually on a daily basis at the central bank, and there is no functioning interbank money or foreign exchange market.
4 For example, in Brazil this index stands at about 1,300 and in Argentina and Chile at about 900. See Gelos and Roldos (2004) for comparative data.
28
B. Assessment Based on Financial Soundness Indicators
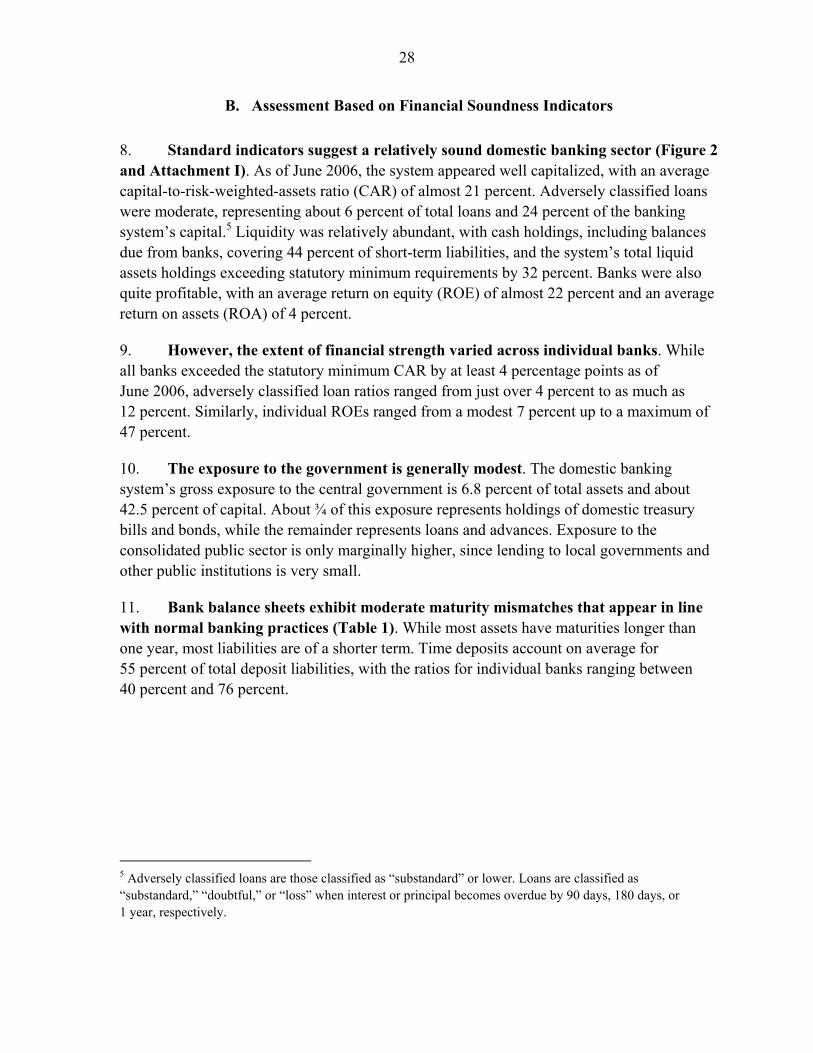
8. Standard indicators suggest a relatively sound domestic banking sector (Figure 2 and Attachment I). As of June 2006, the system appeared well capitalized, with an average capital-to-risk-weighted-assets ratio (CAR) of almost 21 percent. Adversely classified loans were moderate, representing about 6 percent of total loans and 24 percent of the banking system’s capital.5 Liquidity was relatively abundant, with cash holdings, including balances due from banks, covering 44 percent of short-term liabilities, and the system’s total liquid assets holdings exceeding statutory minimum requirements by 32 percent. Banks were also quite profitable, with an average return on equity (ROE) of almost 22 percent and an average return on assets (ROA) of 4 percent.
9. However, the extent of financial strength varied across individual banks. While all banks exceeded the statutory minimum CAR by at least 4 percentage points as of June 2006, adversely classified loan ratios ranged from just over 4 percent to as much as 12 percent. Similarly, individual ROEs ranged from a modest 7 percent up to a maximum of 47 percent.
10. The exposure to the government is generally modest. The domestic banking system’s gross exposure to the central government is 6.8 percent of total assets and about 42.5 percent of capital. About ¾ of this exposure represents holdings of domestic treasury bills and bonds, while the remainder represents loans and advances. Exposure to the consolidated public sector is only marginally higher, since lending to local governments and other public institutions is very small.
11. Bank balance sheets exhibit moderate maturity mismatches that appear in line with normal banking practices (Table 1). While most assets have maturities longer than one year, most liabilities are of a shorter term. Time deposits account on average for 55 percent of total deposit liabilities, with the ratios for individual banks ranging between 40 percent and 76 percent.
5 Adversely classified loans are those classified as “substandard” or lower. Loans are classified as “substandard,” “doubtful,” or “loss” when interest or principal becomes overdue by 90 days, 180 days, or 1 year, respectively.

29
Figure 2. Belize: Domestic Banking System Indicators, June 2006
Sources: Central Bank of Belize; and Fund staff estimates.
Assets(BZ$'000)
Belize Bank, 750,531(45%)
First Caribbean Bank, 198,020
(12%)
Atlantic Bank, 244,507 (15%)
Alliance Bank, 40,645 (8%)
Scotiabank, 324,639 (20%)
-6-4-202468
101214
Alliance Bank Atlantic Bank Belize Bank First CaribbeanBank
Scotiabank
Total industry growthTotal Credit Growth(percent)
0
2
4
6
8
10
12
14
Alliance Bank Atlantic Bank Belize Bank First CaribbeanBank
Scotiabank
Adversely Classified Loans 1/ (percent)
Industry average
1/ Adversely classified loans as a share of
0
20
40
60
80
100
120
140
160
Alliance Bank Atlantic Bank Belize Bank First CaribbeanBank
Scotiabank
Industry average
Liquidity 1/(percent)
0
5
10
15
20
25
30
35
Alliance Bank Atlantic Bank Belize Bank First CaribbeanBank
Scotiabank
Specific Loan Loss Reserves 1/(percent)
0%
20%
40%
60%
80%
100%
120%
140%
Alliance Bank Atlantic Bank Belize Bank First CaribbeanBank
Scotiabank
Deposit Structure(percent)
1/ Statutory liquidity in percent of short-term liabilities.
Net Earnings(BZ$'000,000)
0
11
22
33
44
55
66
Total AllianceBank
Atlantic Bank Belize Bank FirstCaribbean
Bank
Scotiabank0
5
10
15
20
25
30
Alliance Bank Atlantic Bank Belize Bank First CaribbeanBank
Scotiabank
Statutory requirement(9 percent)
Capitalization 1/(percent)
1/ Capital to risk weighted assets ratio.
1/ In percent of adversely classified loans
Industry average
Time deposits Sight deposits

30
Table 1. Maturity Composition of Assets and Liabilities (In millions of BZ$), June 2006 1/
Banking Individual Banks
System Min Max
< 3 months -91 -52 20
3-6 months -272 -152 -6
6-12 months -315 -119 -23
> 12 months 821 58 371
Sources: Central Bank of Belize; and Fund staff calculations. 1/ Net asset position. Negative sign indicates that liabilities Exceed assets for the respective maturity bracket.
12. Financial dollarization is low, and the domestic banking system has a long position in foreign currency. Foreign currency deposits represent less than 5 percent of total deposits, while the share of foreign-currency denominated loans is about 7 percent. This relatively low extent of financial dollarization in the system is largely explained by the existence of foreign exchange controls. While the banking system has on aggregate a sizeable long position in foreign currency, this currency mismatch is mainly concentrated in two banks, and the net foreign exchange position of the other three banks is broadly balanced. (Table 2)
Table 2. Net Foreign Currency Position (In millions of BZ$), June 2006
Banking Individual Banks System Min Max
I. Foreign currency denominated loans 91.0 0.0 83.8 II. Other foreign currency denominated assets (net) 28.0 -57.3 39.8 III. Foreign currency deposits 57.8 2.0 21.4 IV. Net foreign exchange position (I+II-III) 61.2 -1.7 29.3
Memorandum items: Foreign currency deposits (in percent of total deposits) 4.5 1.7 6.2
Net foreign exchange position (in percent of capital) 21.8 -4.2 98.4
Sources: Central Bank of Belize; and Fund staff calculations.
13. Loan-loss provisions are quite low by international standards and an area of weakness. As of June 2006, specific loan-loss provisions only covered 17.5 percent of adversely classified loans. This ratio increases to 32.9 percent if general provisions are included. The low level results mainly from the fact that on average banks only provide for about 6 percent of their substandard loans, in turn reflecting current regulations that only require banks to provide for the unsecured portion of these loans and the absence of formal requirements on the valuation of loan collateral.

31
14. Most banks seem to comply with existing provisioning requirements. Current regulations require a general provision of 1 percent for pass loans; a specific provision of 100 percent for the unsecured portion of sub-standard loans; and specific provisions of 50 percent and 100 percent for doubtful and loss loans, respectively. Overall, the banking system’s provisions are only short of the regulatory requirement by some BZ$ 0.2 million, which can be easily met by the current capital levels (Table 3).
Table 3. Correction for Under-Provisioning (In millions of BLZ $), June 2006
Banking Individual Banks
System Min Max
Provisions needed 24.2 1.7 9.1
Provisions held 26.2 1.6 9.0
Provisions to be made 0.2 0.0 0.2
Current CAR (in percent) 20.6 13.0 26.0
CAR after correction (in percent) 20.6 13.0 26.0
Change in CAR (in percent) -0.01 -0.2 0.0
Sources: Central Bank of Belize; and Fund staff calculations.
15. The domestic banking system could accommodate a tightening of provisioning requirements that brought them in line with international comparators. Provisions for “doubtful” and “loss” loans are broadly in line with international standards, but international standards would suggest raising the provision for “substandard” loans to a minimum of 20 percent. This would require banks to set aside additional provisions of between BZ$9.6 million and BZ$12.9 million, which could be met relatively easily with existing levels of capital (Tables 4 and 5).6 At most, the banking system’s average CAR would decline by slightly more than ¾ percent, and all banks would comfortably remain above the required minimum CAR of 9 percent (Table 5)7.
6 The additional provisions that would be required depend on how loan-collateral is distributed among substandard loans. However, this information is currently not available to the bank supervisor. Tables 4 and 5 present the theoretical minimum and maximum of additional provisions, respectively.
7 However, additional provisions would be required if stricter valuation rules led to a reduction in the assessed collateral values.

32
Table 4. Tightening of Loan-Loss Provision Requirements–Minimum (In millions of BLZ $) /1
Banking Individual Banks
System Min Max
Provisions needed 35.8 2.6 13.8
Provisions held 26.2 1.6 9.0
Provisions to be made 9.6 0.6 4.7
Current CAR (in percent) 20.6 13.0 26.0
CAR after correction (in percent) 20.0 12.8 25.4
Change in CAR (in percent) -0.6 -1.1 -0.2
Sources: The Central Bank of Belize; and Fund staff calculations. 1 / Assumes that a minimum provision of 20 percent is established for substandard loans and that all current provision for substandard loans derive from fully unsecured loans. The exercise is based on June 2006 data.
Table 5. Tightening of Loan-Loss Provision Requirements–Maximum
(In millions of BLZ $) /1
Banking Individual Banks
System Min Max
Provisions needed 39.1 2.9 14.9
Provisions held 26.2 1.6 9.0
Provisions to be made 12.9 1.1 5.9
Current CAR (in percent) 20.6 13.0 26.0
CAR after correction (in percent) 19.8 12.7 25.3
Change in CAR (in percent) -0.8 -1.4 -0.3
Sources: The Central Bank of Belize; and Fund staff calculations. 1/ Assumes that a minimum provision of 20 percent is established for substandard loans, and that current provisions for substandard loans are uniformly distributed across the loan portfolio. The exercise is based on June 2006 data.
C. Sensitivity Tests
16. To undertake a more forward looking assessment of banking sector soundness, we perform sensitivity tests, using bank-by-bank data. This exercise is partially based on a toolkit developed by the IMF’s Monetary and Capital Markets Department,8 which consists of a spreadsheet that, after being populated with banking sector data as of June 2006, can
8 See International Monetary Fund and the World Bank (2003) and Čihák (2004).

33
simulate the static impact that plausible shocks to a number of variables will cause on the levels of capitalization and profitability of the banking sector. To capture more demanding capital requirements, we use as a starting point for this analysis the corrected CAR that was obtained in the previous section under the assumption of tighter rules for loan-loss provisioning (see Table 5).
17. Belize’s banking sector is potentially exposed to a variety of risks, including:
• Market risk, stemming, for example, from hypothetical exchange rate or interest rate shocks;
• Liquidity risk, stemming, for example, from a significant further tightening of monetary policy through an increase in reserve requirements, which could be motivated by a need to achieve further domestic adjustment; and
• Credit risk, such as a sharp increase in non-performing loans, possibly triggered by a downturn in economic activity.
Market risk
18. Because of Belize’s exchange rate peg, banks are not exposed to market fluctuations in exchange rates. Indeed, given that the banking system has a long position in foreign currency, direct balance sheet impact would be positive. Furthermore, since foreign currency loans are only a small proportion of the total loan portfolio and primarily extended to export industries, any indirect effects through a deterioration in loan quality would likely to be modest.
19. The sensitivity of banking sector capitalization to an interest rate shock is relatively small. The volatility of interest rates in the domestic banking system has historically been very low, with a standard deviation of less than 100 bps over the past 20 years.9 In addition, the central bank does not currently use the interest rate as an instrument for monetary policy implementation, and massive government financing in the domestic market is unlikely since the government’s financing needs are overwhelmingly in foreign currency to cover debt service. Even if an interest shock were to occur, its impact would be limited to the income loss caused by maturity mismatches, since banks hold virtually no securities on their balance sheet and changes in interest rates would therefore not cause major valuation effects. For instance, a 4 percentage point increase in both lending and
9 The low volatility of interest rates may be related to the concentration of the banking sector and its small size.

34
deposit interest rates, which would be very high by historical standards,10 would reduce the average CAR of the banking system only by about 1.7 percentage point and leave all banks well above the statutory minimum requirement of 9 percent (Table 6).
Table 6. Sensitivity to Interest Rate Shock /1
Banking Individual Banks
System Min Max
Current CAR 19.8 12.7 25.3
CAR after shock 18.1 10.3 23.9
Change in CAR -1.7 -2.4 -1.3
Sources: The Central Bank of Belize; and Fund staff calculations. 1/ Assumes a 4 percentage point increase in average deposit and lending rates. The exercise is based on June 2006 data. The risk-adjusted capital-asset-ratios are shown in percent.
Liquidity risk
20. The central bank’s main monetary policy instruments are the cash and liquid assets reserve requirements. Despite several increases in these requirements since May 2005, by June 2006 most banks had again accumulated significant levels of excess liquidity. This section simulates the effect that an additional sharp tightening of reserve and liquid asset requirements would have on the profitability of domestic banks. To keep within the boundaries of plausible shocks, we assume that the reserve ratios are raised to their historical maxima, which were 11 percent for cash reserves and 30 percent for liquid assets, respectively.11
21. The simulated reserve requirement shock would force all banks, except one, to build additional cash reserves and liquid assets. The aggregate cash shortage for the banking system would be BZ$11.8 million and the liquid asset shortage BZ$12.5 million. In order to meet the cash requirement, banks would need to convert some of their liquid assets into cash. However, in order to meet the liquid asset requirement, it is assumed that banks proceed to call some of their loans, possibly starting with overdrafts.
10 Historically the difference between the minimum and the maximum rates has never exceeded 5 percent for deposit rates and 3.3 percent for lending rates.
11 As of June 2006, the cash reserve and liquid asset requirements were 9 percent and 22 percent, respectively. The central bank later raised both reserve requirements by one percentage point each, effective September 1.

35
22. Attempting to raise additional cash reserves and liquid assets would cause sizeable interest income losses, but the banking system is currently profitable enough to bear this burden. The expected total annual interest income loss would be about BZ$7 million, but even after this shock all banks would remain profitable (Table 7).
Table 7. Sensitivity to a Tightening of Monetary Policy (In millions of BLZ $) 1/
Banking Individual Banks
System Min Max
Current excess cash 13.6 -0.04 11.4
Current excess liquidity 88.9 8.0 44.4
Post shock cash shortage -11.8 -9.5 8.0
Post shock liquidity shortage -12.5 -29.7 30.9
Interest income loss owing to cash reserve requirement 0.5 0.0 0.2
Interest income loss owing to liquidity requirement 6.2 0.0 4.2
Profits post shock/pre-shock risk-weighted assets (ratio) 1.4 0.3 2.1
Profits post shock/post-shock risk-weighted assets (ratio) 1.5 0.3 2.2
Sources: The Central Bank of Belize; and Fund staff calculations. 1/ Assumes an increase in the cash reserve ratio of 2 percentage points and an increase in the liquid assets reserve ratio of 8 percentage points. The exercise is based on June 2006 data.
Credit risk
23. The limited exposure of the banking system to the government means that the system’s direct vulnerability to a possible sovereign credit event is small. Banks do not hold any of the government’s foreign debt instruments, and their lending to the government is almost exclusively denominated in local currency.
24. The banking system’s capital also provides a significant buffer against other credit risks. The absence of information on how previous economic downturns have affected the ratio of adversely classified loans makes the definition of plausible shocks difficult. To avoid choosing an arbitrary shock, we calculate the deterioration in the performing loan portfolio that the banking system would be able to absorb before falling below the statutory minimum capitalization levels. As shown in Tables 8 and 9, the loan portfolio deteriorations that could be tolerated are relatively large. For instance, 25 percent of the banking sector’s performing loans could become non-performing before the statutory minimum CAR of 9 percent was breached. This would imply an increase in the ratio of adversely classified loans (as a share of total loans) from the current level of 6.3 percent to about 31 percent (Table 8). However, it must be noted that there are wide differences at the individual bank levels. For instance, the least capitalized bank in the system could only withstand an increase in adversely classified loans of about 8 percent of the current performing loan portfolio, before its CAR would fall below the statutory minimum.
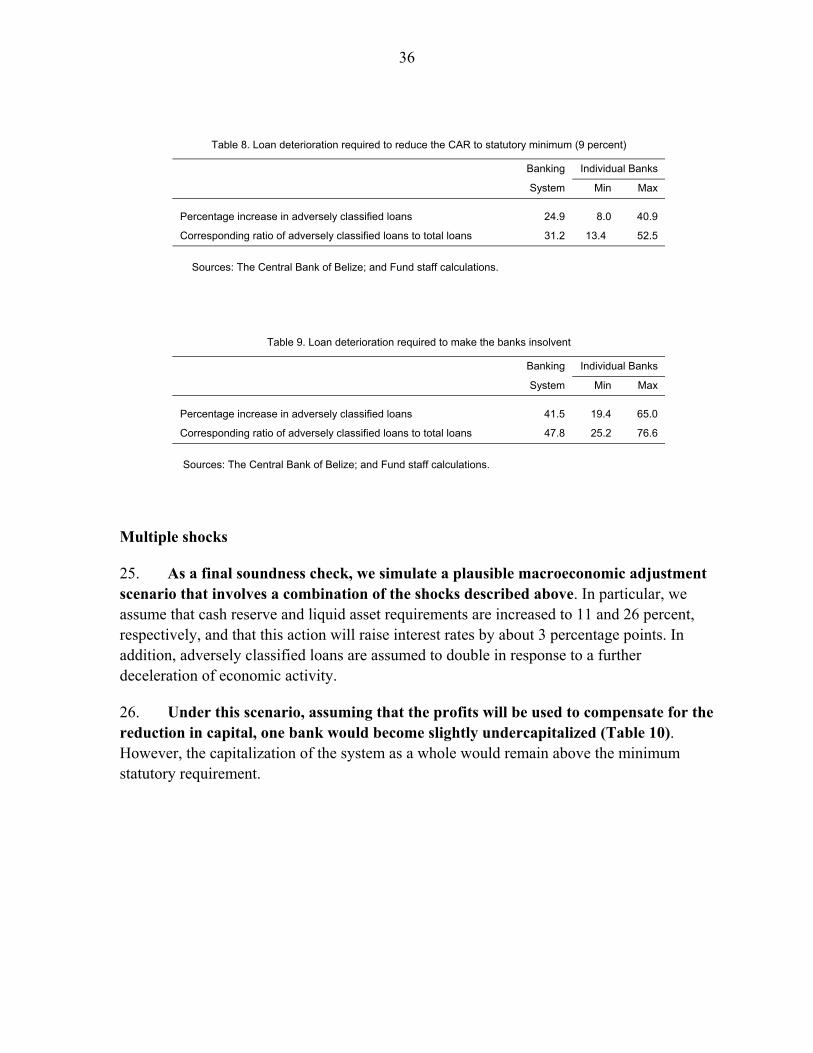
36
Table 8. Loan deterioration required to reduce the CAR to statutory minimum (9 percent)
Banking Individual Banks
System Min Max
Percentage increase in adversely classified loans 24.9 8.0 40.9
Corresponding ratio of adversely classified loans to total loans 31.2 13.4 52.5
Sources: The Central Bank of Belize; and Fund staff calculations.
Table 9. Loan deterioration required to make the banks insolvent
Banking Individual Banks
System Min Max
Percentage increase in adversely classified loans 41.5 19.4 65.0
Corresponding ratio of adversely classified loans to total loans 47.8 25.2 76.6
Sources: The Central Bank of Belize; and Fund staff calculations.
Multiple shocks
25. As a final soundness check, we simulate a plausible macroeconomic adjustment scenario that involves a combination of the shocks described above. In particular, we assume that cash reserve and liquid asset requirements are increased to 11 and 26 percent, respectively, and that this action will raise interest rates by about 3 percentage points. In addition, adversely classified loans are assumed to double in response to a further deceleration of economic activity.
26. Under this scenario, assuming that the profits will be used to compensate for the reduction in capital, one bank would become slightly undercapitalized (Table 10). However, the capitalization of the system as a whole would remain above the minimum statutory requirement.

37
Table 10. Macroeconomic Adjustment Scenario /1
Banking Individual Banks
System Min Max
Current CAR 19.8 12.7 25.3
CAR after shock 17.9 8.9 23.5
Change in CAR -1.9 -5.0 -0.5
Sources: The Central Bank of Belize; and Fund staff calculations. 1/ Assumes an increase in the cash reserve ratio of 2 percentage points and an increase in the liquid assets reserve ratio of 4 percentage points; a 3 percentage point increase in average deposit and lending rates; and a doubling of the NPL ratio. The exercise is based on June 2006 data. The CARs are shown in percent.
D. Conclusions
27. The vulnerability of the banking sector appears relatively modest. The exposure of the domestic banks to the sovereign is small, and capital ratios and profitability would provide a substantial buffer against the effects of a range of plausible shocks.
28. However, the current level of loan-loss provisions and collateral valuation rules are not up to the international standards. International standards would argue for the introduction of a 20 percent minimum provision for substandard loans and conservative guidelines on the valuation of loan collateral. The current levels of capitalization would seem to allow domestic banks to accommodate tighter provisioning requirements relatively easily.
29. Although the analyses above suggest that the domestic banking sector is relatively robust, bank supervisors will need to remain vigilant. In particular, Belize is highly vulnerable to natural disasters and terms-of-trade shocks, and the ongoing debt restructuring discussions illustrate that the balance of payments and fiscal situations are under considerable stress. Care will also be needed to ensure that banks and bank regulations are adequately prepared for possible credit, macroeconomic, and other shocks.

38
References Čihák, M., 2004, Case Study and Group Exercise on Assessing Financial Sector Stability:
Background Note, mimeo. International Monetary Fund and the World Bank, 2003, Analytical Tools of the FSAP.
Available at http://www.imf.org/external/np/fsap/2003/022403a.pdf Roldos, Jorge and Gaston Gelos, 2004, Consolidation and Market Structure in Emerging
Market Banking Systems, Emerging Markets Review, Vol. 5, Issue 1, March.

39
Atta
chm
ent 1
. Bel
ize:
Sum
mar
y of
Fin
anci
al S
ound
ness
Indi
cato
rs fo
r the
Dom
estic
Ban
king
Sec
tor Cha
nge
from
Cha
nge
from
Jun-
05Se
p-05
Dec
-05
Mar
-06
Jun-
06pr
evio
us q
uarte
rpr
evio
us y
ear
(In B
Z$'0
00)
(in p
erce
nt)
Tota
l ass
ets
1,64
0,13
9
1,65
8,34
2
1,69
1,67
8
1,
701,
412
1,76
3,76
5
3.
7
7.5
O
f whi
ch:
tota
l sta
tuto
ry li
quid
ity36
3,91
5
34
3,60
6
33
0,02
6
351,
618
36
8,02
1
4.7
1.
1
Of w
hich
: go
vern
men
t sec
uriti
es/in
vest
men
ts80
,024
75
,101
51
,161
75,8
29
90
,987
20.0
13.7
Of w
hich
: to
tal l
oans
1,18
5,12
4
1,22
9,61
7
1,25
4,65
2
1,
259,
108
1,27
5,53
3
1.
3
7.6
To
tal d
epos
its1,
301,
477
1,
285,
711
1,
306,
457
1,24
2,78
5
1,
297,
510
4.4
(0
.3)
Of w
hich
: tim
e an
d sa
ving
dep
osits
, in
perc
ent o
f tot
al d
epos
its70
72
70
74
72
(1.7
)
2.
5
Net
ear
ning
s (lo
ss)
15,1
20
16,4
81
13,6
57
17
,177
14,7
43
(1
4.2)
(2.5
)
Tota
l exp
osur
e to
gov
ernm
ent a
s a
shar
e of
ass
ets
6.83
6.87
5.23
6.21
6.75
8.7
(1.2
)
O
f whi
ch:
secu
ritie
s4.
884.
533.
024.
465.
1615
.7
5.
7
O
f whi
ch:
loan
s1.
952.
352.
201.
751.
59(9
.1)
(18.
5)
Tota
l exp
osur
e to
gov
ernm
ent a
s a
shar
e of
cap
ital
48.3
47.0
34.9
39.2
42.5
8.5
(11.
9)
Of w
hich
: se
curit
ies
34.5
30.9
20.2
28.1
32.5
15.5
(5.8
)
O
f whi
ch:
loan
s13
.816
.014
.711
.110
.0(9
.3)
(27.
3)
A. L
iqui
dity
(In p
erce
nt, u
nles
s in
dica
ted
othe
rwis
e)C
ash
and
bala
nces
due
from
ban
ks 1
/44
.1
42
.6
43
.2
43.6
44
.2
0.6
0.
2
Tota
l sta
tuto
ry li
quid
ity 1
/53
.2
51
.6
47
.4
50.1
49
.6
(0.5
)
(3
.6)
Exce
ss s
tatu
tory
liqu
idity
2/
33.5
26.8
21.5
32
.5
31.9
(0
.6)
(1.6
)
B. A
sset
qua
lity
Adve
rsel
y cl
assi
fied
loan
s/to
tal l
oans
6.0
5.
8
8.7
8.7
6.3
(2.3
)
0.
3
Spec
ific
loan
loss
rese
rves
/adv
erse
ly c
lass
ified
loan
s19
.3
20
.4
13
.0
12.9
17
.5
4.7
(1
.8)
Adve
rsel
y cl
assi
fied
loan
s/ca
pita
l 3/
24.7
23.5
37.5
35
.3
23.8
(1
1.5)
(1.0
)
To
tal l
oan
loss
rese
rves
/adv
erse
ly c
lass
ified
loan
s35
.0
36
.4
22
.9
23.9
32
.9
9.0
(2
.1)
C. P
rofit
abilit
yN
et e
arni
ngs/
asse
ts (r
etur
n on
ave
rage
ass
ets)
4/
4.3
4.
1
3.8
3.7
3.7
(0.1
)
(0
.6)
Net
ear
ning
s/eq
uity
(ret
urn
on a
vera
ge e
quity
) 4/
30.9
29.2
26.2
25
.4
21.9
(3
.5)
(9.0
)
N
et in
tere
st m
argi
n 5/
2.1
2.
1
2.1
2.0
2.0
(0.0
)
(0
.1)
D. C
apita
l ade
quac
yTo
tal c
apita
l/tot
al a
sset
s14
.2
14
.6
15
.0
15.9
15
.9
0.0
1.
7
Reg
ulat
ory
capi
tal/r
isk
wei
ghte
d as
sets
6/
20.9
19.5
18.9
19
.5
20.8
1.
4
(0.1
)
E.
Effi
cien
cyIn
tere
st ra
te s
prea
d, in
bas
is p
oint
s 7/
632
643
63
6
60
3
60
3
-
(2
8.8)
Sour
ces:
Cen
tral B
ank
of B
eliz
e; a
nd F
und
staf
f cal
cula
tions
.
1/ E
xpre
ssed
in p
erce
nt o
f sho
rt-te
rm li
abilit
ies
(dem
and
and
savi
ngs
depo
sits
plu
s ba
lanc
es d
ue to
ban
ks a
nd to
the
CBB
).2/
Exp
ress
ed in
per
cent
of t
he s
tatu
tory
liqu
idity
requ
irem
ent.
3/ A
dver
sely
cla
ssifi
ed lo
ans
are
net o
f spe
cific
rese
rves
.4/
Sum
of n
et in
com
e ov
er th
e la
st fo
ur q
uarte
r div
ided
by
the
aver
age
asse
ts (o
r equ
ity) f
or th
e sa
me
perio
d.5/
Def
ined
as
the
ratio
of n
et in
tere
st in
com
e to
the
sum
of a
vera
ge lo
ans
and
gove
rnm
ent s
ecur
ities
.6/
The
sta
tuto
ry re
quire
men
t is
9 pe
rcen
t.7/
Def
ined
as
the
diffe
renc
e be
twee
n w
eigh
ted
aver
age
lend
ing
rate
and
wei
ghte
d av
erag
e fix
ed d
epos
it ra
te.
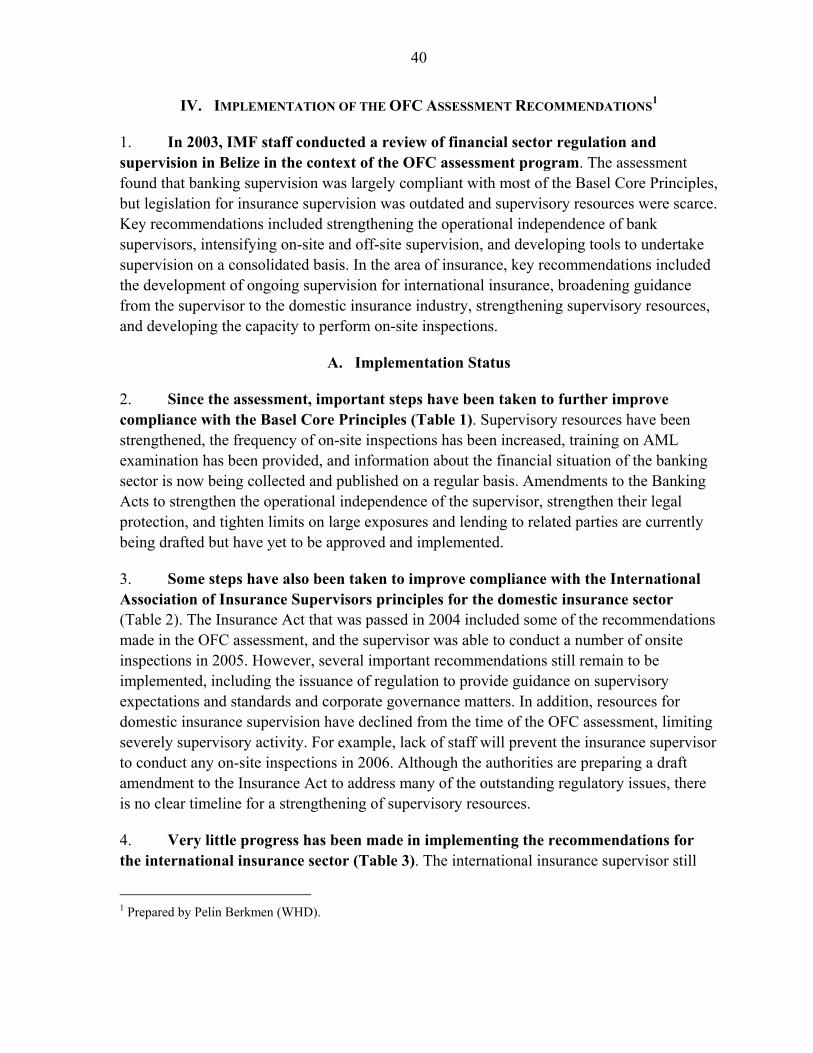
40
IV. IMPLEMENTATION OF THE OFC ASSESSMENT RECOMMENDATIONS1
1. In 2003, IMF staff conducted a review of financial sector regulation and supervision in Belize in the context of the OFC assessment program. The assessment found that banking supervision was largely compliant with most of the Basel Core Principles, but legislation for insurance supervision was outdated and supervisory resources were scarce. Key recommendations included strengthening the operational independence of bank supervisors, intensifying on-site and off-site supervision, and developing tools to undertake supervision on a consolidated basis. In the area of insurance, key recommendations included the development of ongoing supervision for international insurance, broadening guidance from the supervisor to the domestic insurance industry, strengthening supervisory resources, and developing the capacity to perform on-site inspections.
A. Implementation Status
2. Since the assessment, important steps have been taken to further improve compliance with the Basel Core Principles (Table 1). Supervisory resources have been strengthened, the frequency of on-site inspections has been increased, training on AML examination has been provided, and information about the financial situation of the banking sector is now being collected and published on a regular basis. Amendments to the Banking Acts to strengthen the operational independence of the supervisor, strengthen their legal protection, and tighten limits on large exposures and lending to related parties are currently being drafted but have yet to be approved and implemented.
3. Some steps have also been taken to improve compliance with the International Association of Insurance Supervisors principles for the domestic insurance sector (Table 2). The Insurance Act that was passed in 2004 included some of the recommendations made in the OFC assessment, and the supervisor was able to conduct a number of onsite inspections in 2005. However, several important recommendations still remain to be implemented, including the issuance of regulation to provide guidance on supervisory expectations and standards and corporate governance matters. In addition, resources for domestic insurance supervision have declined from the time of the OFC assessment, limiting severely supervisory activity. For example, lack of staff will prevent the insurance supervisor to conduct any on-site inspections in 2006. Although the authorities are preparing a draft amendment to the Insurance Act to address many of the outstanding regulatory issues, there is no clear timeline for a strengthening of supervisory resources.
4. Very little progress has been made in implementing the recommendations for the international insurance sector (Table 3). The international insurance supervisor still
1 Prepared by Pelin Berkmen (WHD).

41
lacks the capacity to asses complex insurance operations or to conduct on-site inspections. An amendment of the International Insurance Act is currently being drafted, but it would address only some of the recommended changes to the prudential framework. In particular, the authorities are reluctant to take steps such as tightening asset valuation rules for solvency purposes and to [implement] requirements for minimum paid up share capital, as this would reduce the competitiveness of the industry.
B. Assessment
5. While Belize has implemented many of the recommendations of the 2003 OFC assessment, progress has been uneven across sectors. Banking supervision has been significantly strengthened in response to the recommendations, including through IMF technical assistance.2 Progress in strengthening insurance supervision has proven much more elusive, notwithstanding its critical importance for financial sector soundness given Belize’s significant exposure to natural disasters.3
6. Important steps are needed to bring financial sector regulation and supervision fully up to the recommended standards. In the area of insurance supervision, there is the need to significantly increase the resources and capacity of the supervisors for both domestic and international insurance companies. In the area of bank supervision, it is essential to strengthen the independence and legal protection of supervisors, tighten regulations regarding large exposures and related lending practices, and establish rules on corporate governance. Several of these reforms are contained in planned amendments to the domestic and international Banking and Insurance Acts, and early action is needed to approve and implement this legislation.
2 A resident technical advisor assisted the central bank from early 2004 through June 2005.
3 Banks in Belize typically require their lenders to contract insurance to cover the provided loan collateral against the impact from natural disasters. A failure by the insurance sector to honor these insurance policies in case of a disaster event would immediately compromise the soundness of the banking system, as the quality of the loan portfolio would be drastically reduced and banks would be forced to set aside additional loan-loss provisions.

42
Table 1. Progress with Recommended Action Plan to Improve Compliance of the Basel Core Principles
Reference Principle Action recommended in the 2003 BCP Assessment
Implementation Status
1.2 - Operational Independence and Adequate Resources
Amend both the Banking and Financial Intermediation Act (BFIA) and International Banking Act (IBA) to reduce the role of the Minister in supervisory matter and have the same provisions in each act.(Proposals were developed following the assessment). Engage further staff in the Banking and Services Supervision Department (FSSD) and train through courses, visits, and on the job.
In progress. Amendments to the BFIA and IBA have been drafted with technical assistance from Canada. The authorities are currently reviewing the drafts and hope that they can be concluded by end-2006. Afterwards, there will be a consultation period before the amendments are submitted to the House of Representatives for approval. The staff of the FSSD has been increased from 11 at the time of the assessment to 15 in 2006. 3 more is planned for this year. Training has been provided, including through an IMF resident expert from 2004-05 and IDB support.
1.4 - Powers to address compliance with laws as well as safety and soundness concerns.
Amend both BFIA and IBA to authorize sharing of information with domestic authorities in Belize. Amend other Belize Acts to authorize other competent authorities to share with CBB.
In progress. The authorities intend to address this recommendation in planned amendments to the BFIA and IBA. The authorities note that in practice information sharing with domestic authorities already takes place.
1.5 - Legal protection for supervisors
Amend BFIA to clarify that CBB staff are protected from legal action when carrying out their duties.
In progress. The authorities intend to address this recommendation in planned amendments to the BFIA and IBA.
1.6 - Arrangements for sharing information
See 1.4 above See 1.4 above
3 – Licensing See 1.2 above See 1.2 above
9 - Large Exposure Limits
Apply 6X capital limit to the aggregate of exposures over 10 percent of capital rather than exposures over 25 percent of capital. Reconsider absence of any aggregate limit on large exposures in IBA.
See 1.5 above
10 - Lending to parties related to the bank
Amend both Acts to require connected lending be on arms length terms and that Board approval be given. Address limits on connected party exposure (secured and unsecured) for individual exposures and aggregate of all connected party lending.
In progress. The authorities intend to address this recommendation in planned amendments to the BFIA and IBA by introducing 50 percent limit on capital in addition to the 2 percent limit on secured loans.
11 – Country Risk Address country risk for international banks. Not acted upon so far.
12 – Market Risk Address market risk Not acted upon so far.
13 – Other Risks Separate liquidity requirements from measures designed to foster lending for residential mortgages. Collect information from banks on maturities of assets and liabilities.
Implemented. Was addressed in a directive issued April 1, 2004 that excluded residential mortgages from assets that count towards liquidity requirements. Information on maturities of assets and liabilities is being collected starting June 2004 on a quarterly basis..
14 - Internal Control and Audit
Issue circular on responsibilities of directors. Issue circular on Internal Control. Foster contact with Internal Auditors, External Auditors.
Still in progress. A consultant financed with funds from the IDB is currently developing corporate governance guidelines, which would address these issues.
15 – Money Laundering More frequent checks of banks. Develop a detailed questionnaire. Work with the FIU to strengthen guidance notes and regulations to take full account of the Basle Committee paper on customer due diligence. Periodic training for CBB staff at all levels on AML and CFT.
Done. An expert from the US Treasury trained staff on AML examination in 2005. So far, one AML examination has been done for an international bank and one in a domestic bank. No questionnaire though.

43
16 - On and Off-site Supervision
Training and experience for examiners. Review examination process with an eye to more frequent visits, perhaps shorter visits. Broaden focus from credit review work and also review and assess banks' processes.
Done. Training provided through an IMF resident advisor in 2004/05. The frequency of on-site inspections has been increased, with 6 examinations completed for 2005 and 6 more planned for 2006 covering two international banks, credit unions and domestic banks.
17 - Bank Management Contact
Contact bank management more frequently on a regular basis. Train staff in understanding banks from a banker's point of view.
Done. The supervisor maintains regular contact with bank management.
18 - Off-site Supervision
Have banks report consolidated figures on a more frequent basis.
Done. The two banks that are liable to consolidated reporting do so on a monthly basis.
20 - Consolidated Supervision
Develop knowledge and understanding of groups that own banks, particularly international banks. Understand intergroup transactions. Identify risks. Determine whether things can be done to reduce risks to the bank.
Done. FSSD staff had three meetings in Guatemala in 2005 to visit parent banks of two international banks and local supervisors.
21 - Accounting and Disclosure
Publish international bank financial figures as is done with local bank figures. Amend Act if required.
Done. Data is being published on a quarterly basis on the central bank website.
22 - Remedial Measures
See 1.2 Amend IBA to parallel BFIA and remove Minister from the process of requiring a bank to take remedial measures
In progress. The authorities intend to address this recommendation in planned amendments to the BFIA and IBA.
24 - Host Country Supervision
Consider publicly enunciating policy of no parallel banks and requirement that banks are held by the bank within any group.
Done. Licensing guidelines for international banks, including a requirement that banks be held by the bank within a group, were issued in 2004

44
Table 2. Recommended Action Plan to Improve Observance of IAIS Insurance Core
Principles—Domestic Insurance
Reference Principle Recommended Action Implementation Status
Organization of an Insurance Supervisor i.e., CP 1
Need for more effective powers, for legal protection and for additional resources—primarily to allow more intensive supervision, including through on-site inspections and through more systematic and thorough evaluation of companies’ gross exposures, retention levels and reinsurance protections. The legal issues will be adequately addressed if the Insurance Bill is enacted as drafted. At least two experienced staff should be hired to design and implement an on-site inspection program. The Acting Supervisor should be involved in the selection of new staff so that their aptitude for this specialist work can be assessed. Staff should receive all the training necessary to have a greater understanding of reinsurance issues. Guidance should be issued to the industry on supervisory expectations and standards. The “Practitioners Code” issued by the IFSC would proved a good model, if suitably adapted.
Partial progress. Supervisory resources have declined. The number of staff has declined from four to three since the assessment. The Insurance Act that was passed in 2004 provides for legal protection and more effective supervisory powers. One onsite inspection was conducted last year. Three more are planned for this year, but these will not be conducted because of a lack of resources. Online training for the supervisor on reinsurance is planned for this year. An amendment to the Insurance Act is currently under preparation to define the supervisory expectations and standards.
Licensing and Changes in Control i.e., CPs 2–3
Application forms should be included in the Insurance (Account and Form). Regulations and the definition of “fit and proper” should be provided in the law. These might conveniently follow those developed by the IFSC for use with international companies. Prior regulatory consent should be required before changes of control take place. (The Insurance Act addresses this issue.)
Done. The 2004 Insurance Act requires regulatory consent before changes of control take place and provides a definition of “fit and proper”.
Corporate Governance and Internal Controls i.e., CPs 4–5
Guidance notes should be issued that require the Boards of Directors of licensed institutions to address compliance with corporate governance principles. Guidance notes on appropriate internal controls should be issued to institutions. These should outline minimum standards that the supervisor deems necessary, including standards for monitoring underwriting risks, claims responsibilities, compliance with the law, fair treatment of customers and anti-money laundering requirements. Consideration should be given to a requirement that company auditors report annually, together with providing their audit opinion on the accounts, on the adequacy of the company’s systems and controls, identifying any areas of weakness.
Partial progress. An amendment to the Insurance Act is currently under preparation provide to guidance on corporate governance and to set the legal basis for the publication of company-by-company information by the supervisor. An IMF sponsored insurance-sector specific training on anti-money laundering was provided in 2004. The 2004 Insurance Act requires auditors to certify the adequacy of internal controls.

45
Reference Principle Recommended Action Implementation Status
Prudential Rules i.e., CPs 6–10
Consideration should be given to reducing the six month period allowed for the submission of annual audited returns, or as a minimum, the industry should be warned that requests for extension of the six month deadline will only be granted exceptionally. The requirement for actuarial valuation for long-term business should be for triennial, rather than quinquennial reviews. The Act should be amended to allow the Supervisor to appoint an independent actuary, at the expense of the company, to perform an independent actuarial study. Insurers should submit additional details of their reinsurance arrangements and their reinsurers as a matter of routine; these should include a statement of its major treaty and facultative reinsurers; premiums payable to the reinsurers; anticipated recoveries; deposits received from the reinsurers, and details of any connection between the insurer and any of its reinsurers. A full analysis of the reinsurance program should be performed, particularly an examination of the per risk maximum retention relative to capital and surplus.
Partial progress. The 2004 Insurance Act reduced the submission period for annual audited financial statements to 4 months (plus two months with valid excuse) and imposed a late penalty. However, foreign-owned companies from the region have compliance problems since the requirements for their parent companies are often less stringent (mostly 6 months). In addition, unaudited balance sheets are submitted on a quarterly basis. Consolidated data is available, but with problems. The 2004 Insurance Act empowered the supervisor to approve the actuary and appoint a special auditor. A special auditor was appointed last year for 1 insurer. Information on reinsurance programs is submitted to the supervisor on an annual basis, but the capacity to analyze this information is still weak because of a lack of resources and training (although participation in an online training program for the supervisor is envisaged this year).
Market Conduct i.e., CP 11
A review of regulatory practices with respect to intermediaries should be carried out particularly to determine how to monitor compliance effectively.
Partial progress. Onsite inspections and some spot checks on intermediaries (i.e. agents) are being conducted regularly. The supervisor is empowered to sanction on agents who are non-compliant, and the draft amendment of the Insurance Act will extend sanctions in such cases to insurance companies as well.
Monitoring, Inspection, and Sanctions i.e., CPs 12–14
A fully documented and structured on-site program should be developed and a comprehensive inspection manual which includes anti-money laundering procedures, compliance and internal control issues, underwriting and claim practices, reinsurance, accounting, corporate governance as well as capital adequacy and investment management. It would be desirable that a guidance note be developed, and that companies be required to describe their investment policy when filing their annual return.
Partial progress. A manual for on-site inspections was produced in-house, but it is not comprehensive. The supervisor has suspended four insurance licenses, 2 of which were involuntary.

46
Table 3. Recommended Action Plan to Improve Observance of the IAIS Core Principles—International Insurance
Reference Principle Recommended Action Implementation Status
Organization of an Insurance Supervisor CP 1
The Supervisor should, as a matter of urgency, acquire the resources necessary to understand and assess potentially complex insurance operations; the viability of their business plans, the adequacy of their resources to carry out these plans, and the appropriateness and strength of their reinsurance programs—having regard to the nature and range of business written and their resilience to potential adverse developments, and to carry out on-site inspections. In the short term, and having regard to the very early stage of development of this sector of the industry, it may be appropriate for this assessment to be outsourced to suitably experienced insurance experts. If an outsourcing route is chosen the IFSC should have at least on member of staff with the necessary financial skills to act as an “intelligent customer.” Any provider of outsourced advice should be accountable solely to the JFSC and should have no connection (whether as auditors or otherwise) with any of the companies in relation to whom they provide advice.
Given the technical complexity of the regulations, etc., that are still needed to complete the legislative framework consideration should also be given to providing additional and specialist resource to the Supervisor of International Insurance for this purpose—again through outsourcing if appropriate.
Not acted upon so far. Resources for international insurance supervision have not been increased. Efforts are underway to fill a financial analyst position that has become vacant.
Outsourcing of prudential assessments has been hampered by a lack of qualified domestic experts, and no onsite inspections have been conducted so far. However, the supervisor is getting some help from the financial supervision department at the central bank.
The legislative framework has not been completed. However, a mission from the UN Office on Drugs and Crime is scheduled to visit Belize shortly to help implement under domestic law the international AML/FT conventions that have been signed and ratified by Belize.
Licensing and Changes in Control CPs 2–3
See recommendations as to resourcing noted under Principle 1. In addition: -Current requirements as to minimum paid up share capital should be reviewed, and brought into line, at the least, to those specified for domestic insurance companies in the current draft of the Insurance Bill. -Reinsurers should be subject to the same requirements as insurers. -Changes in control, should be subject to prior consent by the Supervisor who should establish appropriate procedures for this purpose. Procedures should be put in place for handling changes of control.
In progress. See CP 1 above
Requirements regarding minimum paid up share capital have not been raised. Under the current international insurance act, reinsurers are subject to the same requirements as insurers, and changes in control are to be approved by the supervisor.
Corporate Governance and Internal Controls i.e., CPs 4–5
Guidance should be issued on appropriate standards of corporate governance. Guidance should be issued on the Supervisors expectations as to the systems and controls he would expect to see in place in registered international insurers (which should include controls over downside risks from the use of derivatives. The Supervisor should consider whether the adequacy of systems and controls should be made the subject of a regular report by the auditor.
Not acted upon so far.

47
Reference Principle Recommended Action Implementation Status
Prudential Rules i.e., CPs 6–10
The IFSC should complete the legislative framework, including by making the remainder of regulations envisaged in Section 39 of the International Insurance Act, including in particular regulations governing the valuation of liabilities and the form and content of accounts and statements to be submitted to the supervisor. The regulations on asset valuation for solvency purposes should be extended to cover requirements for diversification, for asset liability matching and for liquidity. Guidance should be issued on the way in which the Supervisor would expect to exercise his discretion to disallow assets for solvency purposes, e.g., to ensure adequate diversification. Consideration should be given to introducing greater risk sensitivity into the solvency regime—either through class enhancement of minimum margin requirements or, through risk sensitive capital charges.
In progress. A draft amendment of the International Insurance Act includes the remainder of regulations envisaged in Section 39. However, the draft amendment has not yet been submitted to parliament. No action was taken on asset valuation for solvency purposes.
Market Conduct i.e., CP 11
The Supervisor should consider adopting a more pro-active approach to the monitoring of standards of market conduct.
Not acted upon so far.
Monitoring, Inspection, and Sanctions i.e., CPs 12–14
See recommendations as to resourcing noted under CP 1.
In addition:
Powers should be taken allowing the Supervisor to take immediate action (i.e., without the need for prior notice) in urgent cases.
The Supervisor should review the adequacy of his powers to undertake, or to commission, routine on-site inspections in cases where the grounds to appoint an inspector are not met.
Not acted upon so far. Powers to allow supervisors to take immediate action have not been formalized, but the authorities contend that they exist in practice.
The authorities contend that the current powers are sufficient to conduct onsite inspections. However, none have been conducted so far.
Cross-Border Operations, Supervisory Coordination and Cooperation, and Confidentiality i.e., CPs 15–17
The Supervisor should consider taking a more active part in relevant international bodies both to facilitate more effective cooperation on a pro-active basis and also as an aid to establishing and maintaining insurance supervisory expertise. Consideration should be given to extending confidentiality protection to all information provided by another supervisory authority without the need for a specific request.
Not acted upon so far.

48
V. EXCHANGE RATE AND COMPETITIVENESS1
1. Since the late 1990s, Belize has experienced a sharp widening of its external current account deficit, raising the question whether the country might be facing an external competitiveness problem. We approach this question with three complementary tools intended to gauge whether Belize’s current account balance and real exchange rate are consistent with underlying macroeconomic fundamentals. First, we examine a broad range of relative price indicators, including several alternative measures of the Real Effective Exchange Rate (REER), and explore whether their trajectory can explain the observed widening of the current account deficit (Section B). Subsequently, we estimate a reduced form REER model to assist whether the REER has over time adjusted in tandem with its long-run determinants, or whether there have been persistent deviations that could point to a competitiveness problem (Section C). Finally, we analyze the structure of the current account and some of its flows to obtain additional insights about what drives Belize’s remaining current account imbalances (Section D).
A. Is Competitiveness a Problem?
2. Belize has pegged its currency since 1976 to the U.S. dollar, and concomitantly achieved generally satisfactory macroeconomic outcomes. Inflation has been relatively low and stable, growth has been above the regional average, and exports have performed well.
3. Several structural characteristics may have helped Belize to sustain the exchange rate peg. Among them are the small size of Belize’s economy; its openness, as measured by a sum of exports and imports that borders 100 percent of GDP; the geographical concentration of its trade, with the United States accounting for about 45 percent of its total trade in goods and services; some diversification of exports (Table 1); the existence of exchange controls; and the relative soundness of its banking sector, which has operated without any need for potentially destabilizing liquidity support from the central bank.
1 Prepared by Pelin Berkmen (WHD).
Table 1. Main Export Groups(In percent of exports of goods and services)
2004-2005 Average
Major merchandise exports 25.77 Marine products 8.81 Citrus juice 5.75 Banana 4.79 Sugar 4.13 Papaya 2.28
Tourism 34.11Other goods and services 40.13
Source: Central bank of Belize; Fund staff calculations

49
4. However, the emergence of large current account imbalances over the past years is posing rising challenges. Belize’s current account deficit rose to more than 20 percent of GDP during 2000-2002 in response to strongly expansionary monetary and fiscal policies (Figure 1). Despite the more recent tightening of policies, the current account deficit has remained rather large, raising questions about the economy’s underlying competitiveness and the consistency of the current exchange rate to macroeconomic fundamentals.
B. Indicator-Based Analysis
5. Overall, relative price indicators provide little evidence that Belize is facing an inherent external competitiveness problem. During the time period in which the external current account weakened, the CPI-based REER depreciated significantly. This observation also holds for a range of alternative REER indicators (Figure 2):
• REER indices with weights representing the respective market shares of competitors in the tourism sector or customers, both show a gradual real depreciation since the late 1990s.2 3
2 For the competitor-based REER, this trend was only interrupted during 2003-04, when the Dominican Republic’s peso depreciated sharply. 3 Weights for the competitor-based REER were derived from shares of tourist arrivals in the Caribbean, and for the customer-based REER from information on tourist arrivals by nationality to Belize. The actual weights are reported in the Appendix I.
-25
-20
-15
-10
-5
01992 1994 1996 1998 2000 2002 2004 2006
2
2
Figure 1. Current Account (Percent of GDP)
Source: Central Bank of Belize; and Fund staff estimates.
Customer-based REER,
tourism
Competitor-based REER,
tourism
REER, CPI based
80
85
90
95
100
105
110
115
120
1995 1996 1997 1998 1999 2000 2001 2002 2003 2004 2005
Competitor-based REER, Commodity
Source: IMF Information Notice System; and Fund staff estimates. 1/ Index, 2000=1000 and an increase (decrease) represents appreciation (depreciation).
Figure 2. Alternative REER Measures 1/

50
• A competitor-based REER index for Belize’s main commodity exports provides only a slightly more nuanced picture of competitiveness.4 According to this measure, there was a gradual trend of real appreciation that began in the mid-1990s, however since 2001 this trend has been largely reversed.
6. Belize’s relative price level also appears well aligned in relation to the country’s level of income. Indeed, in a large sample of emerging market countries, the data point for Belize’s fully fits into the relationship that can be observed between relative domestic price levels and relative per capita GDP, as would be predicted by the Harrod-Balassa-Samuelson effect (Figure 3).5
7. Alternative indicators, which seek to proxy developments in relative productivity levels provide a broadly similar picture. For instance, Belize’s real per capita GDP relative to real per capita GDP in its five largest trading partner countries displays a steady increase during the period in which the external current account deficit ballooned (Figure 4). Non-traded prices relative to those in trading partner countries have been broadly unchanged since 1999, albeit with some fluctuation. While these indicators do not suggest that Belize has made a strong productivity leap in recent years, they do not show that the country has fallen back either (Figure 5).
Figure 4. Relative real GDP per capita(2000=100)
80
85
90
95
100
105
110
1993 1994 1995 1996 1997 1998 1999 2000 2001 2002 2003 2004 2005
Figure 5. Relative Non-traded prices(Three-year moving averages)
50
60
70
80
90
100
110
1993Q1 1994Q3 1996Q1 1997Q3 1999Q1 2000Q3 2002Q1 2003Q3 2005Q1
NTP_USNTP_trading partners
Source: Central bank of Belize; Fund staff calculations.Source: World Bank, World Development Indicators; Fund staff calculations.
4 The weights for this index were obtained by using the export shares of the top-15 exporters of the four main commodity exports of Belize (shrimp, sugar, banana, and citrus) and then re-weighting these shares according to the shares of each commodity in Belize’s total exports. See Appendix I for the actual weights. 5 Balassa (1964) and Obstfeld and Rogoff (1999).
ARG
MLTHKG
JAM
BRACHL
MEX
BOL
CHN
KOR
MYS
SGPBHS
BLZ
0
20
40
60
80
100
0 20 40 60 80 100
GDP per capita relative to US (in percent)Dom
estic
pric
e le
vel r
elat
ive
to U
S p
rices
(in
per
cent
)
Sources: IMF, World Economic Outlook; and Fund staff estimates. 1/ Measured as the ratio of nominal GDP in current dollars to nominal GDP in current PPP dollars.
Figure 3. Relative Income and Price Levels 1/

51
C. Equilibrium Real Exchange Rate Analysis
8. An alternative approach to assess external competitiveness consists in investigating whether the real exchange rate level is consistent with the level of its long-run determinants. For this purpose we estimate an equilibrium real exchange rate model based on the Johansen cointegration methodology, using fundamental explanatory variables that have been widely considered elsewhere in the equilibrium real exchange rate literature for developing countries.6 The a priori expectation about the relationship between these fundamental explanatory variables and the equilibrium real exchange rate is as follows:
• Trade openness, has generally been found to be associated with a more depreciated real exchange rate.7
• An increase in productivity in the tradable sector is associated with an increase in relative non-traded prices, and therefore a real appreciation, consistent with the Balassa-Samuelson effect.
• Terms of trade improvements tend to appreciate the real exchange rate, while an increase in real gasoline prices would be expected to cause a depreciation for an oil importing country like Belize. 8
• Net foreign assets (NFA) are commonly used as explanatory variables in equilibrium real exchange rate models and can affect the equilibrium rate through various channels.9 However, since NFA data is not available for Belize, we use the external public debt net of reserves (in percent of GDP) as a proxy. A higher debt ratio is likely to depreciate the real exchange rate, because interest payments on the debt would induce current account deficits, and countries with high debt-to-GDP ratios are less likely to sustain large current account deficits.
• Alternatively, the income balance is also included in the regressions to directly capture the effect of the interest burden on the equilibrium exchange rate.10
6 See Johansen (1995) and, for example, MacDonald and Ricci (2003). The definition and source of each variable is presented in Appendix II. 7 See, for example, Goldfajn and Valdes (1999). 8 Terms of trade are calculated using export and import data from the national accounts.
9 Lane and Milessi-Ferretti (2000) 10 The sign of the income balance is inverted for the regressions, so that an increase in this variable represents an increase in the interest payments.

52
• Finally, the impact of government consumption (or more generally the fiscal balance) is ambiguous, depending on the composition of consumption between traded and nontraded goods. However, to the extent that higher government consumption reduces the national savings, the real exchange rate would depreciate.
9. Almost all selected explanatory variables present non-stationarity. Standard unit root tests suggest that we cannot reject the null hypothesis of a unit root neither for the REER nor for its long term determinants.11 Since the variables are non-stationary, a Johansen maximum likelihood estimator is used to test for the long-run relationship between the level of the real effective exchange rate and the levels of its fundamental determinants.
10. Our estimation results support most of the expected relationships between the REER and the variables described above. Table 2 presents a set of alternative regression results based on a sample of quarterly data for the period 1990–2005.12 The cointegration tests indicate the presence of one cointegrating vector. All obtained signs are line with a priori expectations.13 The error correction terms are also statistically significant, indicating that the short-term deviations from the equilibrium tend to revert. Furthermore, these reversals occur rather quickly. For example, one-half of the deviation from the estimated equilibrium disappears within a year, implying that misalignments are not persistent despite the existence of a fixed exchange rate regime. This finding contrasts with the results of other recent empirical studies and could point to relatively flexible prices in Belize, although it may also be a consequence of Belize’s high degree of openness.14
11 Some caution in interpreting these results is advisable, since the power of the unit root tests is low for short data series. 12 The REER, relative non-traded prices, and gasoline prices are quarterly series. The other series are only available annually, and have therefore been linearly interpolated. 13 A commodity price index was used to capture the price movements of the main commodity exports. Since the estimates were found to be either insignificant or having the wrong sign, these results are not reported here. In addition, as an alternative productivity proxy, relative real GDP per capita with respect to trading partners is used, but the results were not statistically significant. 14 See for example Goldfajn and Valdes (1999), Cashin and McDermott (2006), and Mac Donald and Ricci (2003).

53
Regression number 1 2 3
Cointegration relationship
LREER(-1) 1 1 1
LRNTP(-1) -0.84 -0.56 -0.32[-3.94] [-3.29] [-2.58]
NETDEBT(-1) 0.001 0.001[ 2.49] [ 4.76]
LTOT(-1) -0.13 -0.18[-0.72] [-1.33]
INCBAL(-1) 0.005[ 1.42]
LRGAS(-1) 0.05[ 2.85]
OPEN(-1) 0.01 0.005 0.004[ 6.60] [ 5.92] [ 6.15]
GCON(-1) 0.09 0.06 0.05[ 7.49] [ 7.48] [ 6.93]
C -2.45 -3.78 -3.45
Speed of adjustment of the real exchange rate
CointEq1 -0.2 -0.3 -0.4[-4.06] [-3.94] [-4.52]
Half time of the deviation from the equilibrium 0.7 0.5 0.4(in years)t - statistics are in square brackets
Table. 2 Selected Results of the VECM
11. The estimated long-run relationship allows the calculation of an “equilibrium” exchange rate. Since the explanatory variables can present short-term fluctuations, the temporary components were removed by using Friedman’s super smoother.15 The long-run components of the fundamental variables were then used to obtain an equilibrium exchange rate path, which can be compared with the actual REER. The following figure presents the equilibrium exchange rate using the first regression presented in Table 2.16
15 See Friedman (1984). Alternative smoothers produce similar results. 16 The other regressions produce very similar results.

54
Figure 6. Equilibrium Real Effective Exchange Rate
80
85
90
95
100
105
110
1990
Q4
1991
Q3
1992
Q2
1993
Q1
1993
Q4
1994
Q3
1995
Q2
1996
Q1
1996
Q4
1997
Q3
1998
Q2
1999
Q1
1999
Q4
2000
Q3
2001
Q2
2002
Q1
2002
Q4
2003
Q3
2004
Q2
2005
Q1
2005
Q4
Equilibrium REER
Actual REER
12. Overall, our results show that the REER appears to have adjusted appropriately to the level of its fundamentals. According to Figure 6, the actual REER has followed its estimated equilibrium closely. Both the equilibrium and the actual REER have been depreciating since 2001, in line with the increase in foreign debt, and as of December 2005, the gap between both variables was less than 2 percentage points.
D. Current Account Flows
13. The analysis of the current account flows provides another avenue for assessing the determinants of Belize’s remaining current account imbalances. One aspect to consider in this context is export performance. Poor export performance at the root of large account deficits could signal the presence of a competitiveness problem. However, this does not appear to have been the case in Belize. As Figure 7 shows, in the period of widening current account deficits, exports of goods and services have been growing at healthy rates of more than 10 percent on average per year.
14. More generally, a breakdown of the savings-investment balance shows that the resource gaps of the private sector are relatively small if the portion that are financed in a non debt-creating way are excluded (Figure 8).17 In the case of the private sector, 17 A significant part of the large private sector resource gaps in 2000–03 is explained by the sharp increase in domestic lending and asset purchases by the state-owned Development Finance Corporation (DFC). The DFC funded these activities through foreign borrowing. However, the DFC eventually generated large losses and a significant part of its foreign liabilities has been assumed by the government.
Average growth rate, 1999- 2006
-5
0
5
10
15
20
25
1995 1997 1999 2001 2003 2005
Figure 7. Exports of Goods and Services (Percent Change)
Source: Central Bank of Belize; and Fund staff estimates.

55
foreign direct investment (FDI) covers most of the resource needs, while the public sector has to rely to a much greater extent on debt-creating sources of financing.
15. A closer examination of the different current account components reveals that the remaining current account imbalances are increasingly determined by the income account. Since the late 1990s the income account has deteriorated sharply, owing in good part to the rising costs of servicing the soaring public external debt (Figure 9). The weight of these debt service costs now explains much of the remaining current account imbalance. In fact, the current account before public sector interest payments has been steadily improving since 2001, and is expected to drop to around 2.5 percent of GDP in 2006. (Figure 10).
Source: Ministry of Finance, the CBB, and IMF staff estimates.
Total public external debt
stock as percent of
GDP
Income balance as a
percent of GDP (right
scale)
0
20
40
60
80
100
120
1996 1998 2000 2002 2004-12
-10
-8
-6
-4
-2
0
-24
-20
-16
-12
-8
-4
0
1998 1999 2000 2001 2002 2003 2004 2005 2006
CA CA excluding interest payments
Figure 9. Debt stock and income balance Figure 10. Current Account excluding public sector interest payments
Figure 10. External Current Account Balance (Percent of GDP)
-30
-25
-20
-15
-10
-5
0
1998 1999 2000 2001 2002 2003 2004 2005
Public S-I gap excl. Privatizations 1/Private S-I gap excl. FDI
Figure 8. Non-debt-creating Current Account Balance (Percent of GDP)
-30
-25
-20
-15
-10
-5
0
1998 1999 2000 2001 2002 2003 2004 2005
Public S-I gap excl. Privatizations 1/Private S-I gap excl. FDI
Source: Central statistics office; Central Bank of Belize; and Fund staff calculations. 1/ Only central government.
56
E. Conclusions
16. Our assessment does not provide major evidence that Belize’s remaining current account imbalances are explained by an external competitiveness problem. The REER under several alternative definitions has depreciated in recent years and adjusted broadly in line with its fundamental determinants. In addition, the performance of the export sector has been relatively solid, and private sector resource gaps beyond the levels that can be financed with FDI are relatively modest. Instead, it seems that the public interest bill is an important factor in determining the remaining current account deficit.
17. The findings in this chapter highlight the importance that debt service reduction through sound macroeconomic policies and other steps will play to ensure a sustainable external position and the continuation of the currency peg. This point can be illustrated by using the external sustainability approach to assess the adequacy of the real exchange rate level going forward. For this purpose, we first calculate the difference between the projected medium-term current account balance and the current account that would stabilize the debt-to-GDP ratio at a target level.18 Subsequently, we estimate the change in the real exchange rate that would be needed to close the gap between the projected and debt stabilizing current account balance19. Under the staff’s active scenario, which involves a considerable additional fiscal adjustment effort, stabilizing the external public debt ratio at a level of about 50 percent of GDP by 2015 would only require a marginal real depreciation of 1.9 percent. This magnitude of real exchange rate adjustment would not appear to be inconsistent with the current exchange rate peg.
18. Several technical caveats apply to our analysis. First, our indicators-based assessment would be more comprehensive if it included indicators of cost competitiveness, such as a unit-labor-cost-based REER. Data limitations have prevent us from undertaking this type of analysis for Belize. Second, the power of the performed econometric estimates is limited by the relatively short data series, particularly when the focus is to capture long term trends and equilibrium values. However, it is nonetheless reassuring that all three employed methods yielded broadly similar results.
18 The debt stabilizing current account is calculated the following formula: * *
(1 )(1 )gCA Dg
ππ
+=
+ +
where g, π, and D stand for real growth rate, inflation and debt-to-GDP ratio (with a negative sign), respectively. The growth rate and inflation are taken from the projections for 2015 in the staff’s active medium-term scenarios. The resulting debt-stabilizing current account balance is -3 percent of GDP.
19 The export and import elasticities with respect to the real exchange rate that are required for this step are obtained from Isard and others (2001).
57
References Agénor, P., and Montiel, J. M. , 1999, Development Macroeconomics, Princeton, New
Jersey: Princeton University Press. Balassa, B., 1964, “The Purchasing-Power Parity Doctrine: A Reappraisal,” Journal of
Political Economy, Vol. 72, pp. 584–96. Cashin, P. and McDermott, J., 2006, “Parity Reversion in Real Exchange Rates: Fast, Slow
or Not al All,” IMF Staff Papers, Vol. 53, No. 1. Eichengreen, B., Masson, P., and others, 1998, “Exit Strategies: Policy Options for Countries
Seeking Greater Exchange Rate Flexibility,” IMF Occasional Paper No. 168. Friedman, J. H., 1984, “A Variable Span Smoother,” Stanford University, Technical Report
LCS5. Goldfajn, I. and Valdes, R., 1999, “The Aftermath of Appreciations,” Quarterly Journal of
Economics, Vol. 114., 229–62. Husain, A. M., 2006, “To Peg or not to Peg: A Template for Assessing the Nobler,” IMF
Working Paper No. 06/54. Isard, P., Faruqee, H., Kincaid, R. and Fatherston, M., 2001, “Methodology for Current
Account and Exchange Rate Assessments,” IMF Occasional Papers No. 239. Johansen, S., 1995, The Likelihood-based Inference in Cointegrated Vector Autoregressive
Models (Oxford, U.K.: Oxford University Press). Lane, P. and Milessi-Ferretti, G., 2000, “The Transfer Problem Revisited: Net Foreign Assets
and Real Exchange Rates,” IMF Working Paper No. 00/123. MacDonald, R. and Ricci, L. 2003, “Estimation of the Equilibrium Real Exchange Rate for
South Africa,” IMF Working Paper No. 03/44. Mundell, R., 1961, “A Theory of Optimum Currency Areas,” American Economic Review,
Sept., Vol. 51, pp. 657–65. Obstfeld, M. and Rogoff, K., 1999, Foundations of International Macroeconomics,
Cambridge, MA: The MIT Press.

58
Attachment I. Belize: Real Effective Exchange Rate Weights
Competitor -based REER, Tourism Competitor -based REER, Commodity
Weights WeightsDominican Republic 22.90 Spain 16.72Mexico 16.68 United States 7.30United States 16.42 Belgium 7.18Netherlands Antilles 12.77 Brazil 6.17Bahamas, The 9.68 Canada 5.40Jamaica 9.34 France 4.96Dominica 4.29 Ecuador 4.95Trinidad and Tobago 2.87 Thailand 4.10United Kingdom 2.02 Netherlands 3.61Suriname 0.87 Germany 3.55Grenada 0.83 China 3.09Guyana 0.75 Mexico 2.78St. Vincent and the Grenadines 0.59 South Africa 2.50
Indonesia 2.48Customer -based REER, Tourism Colombia 2.43
Weights India 2.39Switzerland 0.5 United Kingdom 2.37Sweden 0.4 Costa Rica 2.22United States 57.5 Australia 1.91Mexico 4.3 Turkey 1.65Japan 2.0 Morocco 1.39United Kingdom 4.7 Philippines 1.30Germany 2.0 Argentina 1.17Guatemala 8.3 Italy 1.08Korea 0.8 Guatemala 0.99Canada 5.1 Denmark 0.97France 1.2 Bangladesh 0.97Bahamas, The 0.8 Poland 0.83Netherlands 1.9 Malaysia 0.83Jamaica 0.8 Mauritius 0.67Spain 0.7 Greece 0.61Italy 1.6 Egypt, Arab Rep. 0.49Thailand 0.8 Panama 0.43China 0.8 Cameroon 0.30Belgium 1.2 Sweden 0.21Dominican Republic 0.8C528 0.8Brazil 0.8Greece 1.2Trinidad and Tobago 0.8

59
Attachment II. Belize: Data Description
Variable Definition Source
LREER Ln(Real effective exchange rate) IMF, Information Notice System
LRNTPLn(100*Relative non-traded prices in Belize / Relative non-traded prices in the U.S. ) Cental Bank of Belize; IMF, International Financial StatisticsIFS; and Fund staff calculations
LTOT Ln(terms of trade) Central Statistical Office; and IMF, World Economic Outlook
OPEN Ln(Exports+Imports/GDP) Cental Bank of Belize; IMF, International Financial StatisticsIFS; and Fund staff calculations
NETDEBTExternal Public Sector Debt net of reservesas a share of GDP Belizean authorities; and World Bank, Global Development Finance
GCON Government Consumption as a share of GDP Belizean authorities; and World Bank, Global Development FinanceLRGAS Ln(Real Gasoline Prices) IMF, Commodity Price SystemINCBAL Net income balance as a share of GDP Cental Bank of Belize; and IMF, International Financial Statistics
Variables
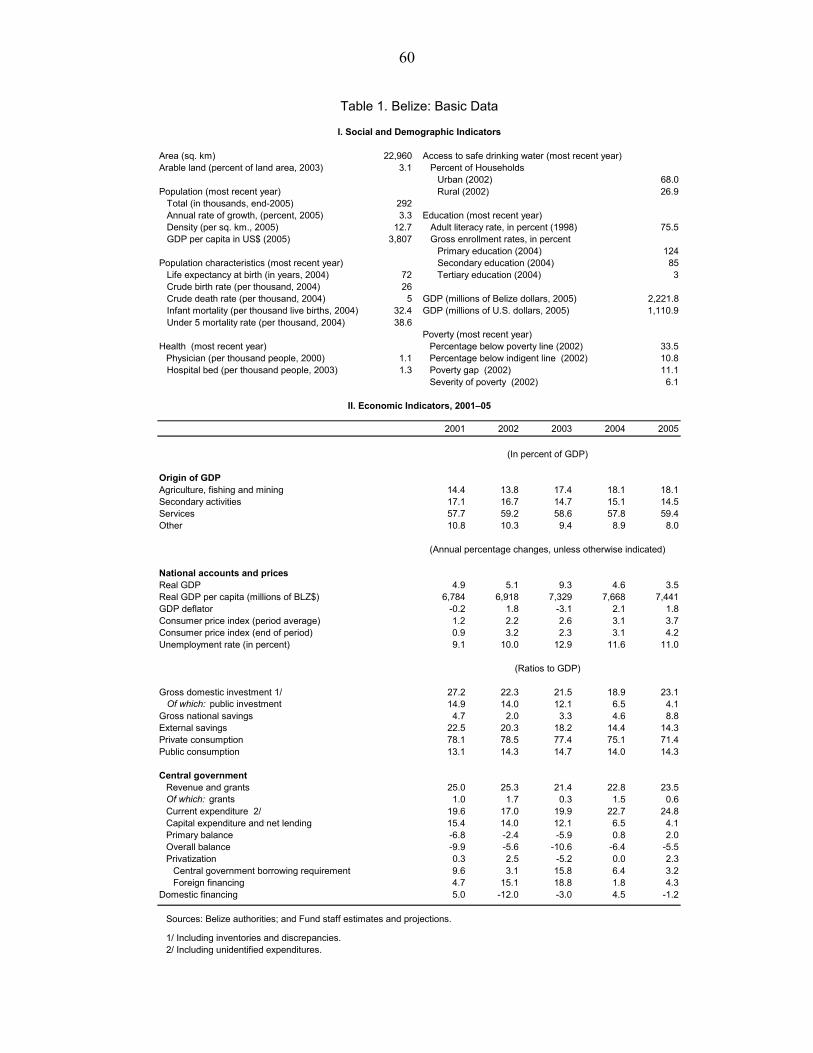
60
Table 1. Belize: Basic Data
I. Social and Demographic Indicators
Area (sq. km) 22,960 Access to safe drinking water (most recent year)Arable land (percent of land area, 2003) 3.1 Percent of Households
Urban (2002) 68.0Population (most recent year) Rural (2002) 26.9 Total (in thousands, end-2005) 292 Annual rate of growth, (percent, 2005) 3.3 Education (most recent year) Density (per sq. km., 2005) 12.7 Adult literacy rate, in percent (1998) 75.5 GDP per capita in US$ (2005) 3,807 Gross enrollment rates, in percent
Primary education (2004) 124Population characteristics (most recent year) Secondary education (2004) 85 Life expectancy at birth (in years, 2004) 72 Tertiary education (2004) 3 Crude birth rate (per thousand, 2004) 26 Crude death rate (per thousand, 2004) 5 GDP (millions of Belize dollars, 2005) 2,221.8 Infant mortality (per thousand live births, 2004) 32.4 GDP (millions of U.S. dollars, 2005) 1,110.9 Under 5 mortality rate (per thousand, 2004) 38.6
Poverty (most recent year)Health (most recent year) Percentage below poverty line (2002) 33.5
Physician (per thousand people, 2000) 1.1 Percentage below indigent line (2002) 10.8 Hospital bed (per thousand people, 2003) 1.3 Poverty gap (2002) 11.1
Severity of poverty (2002) 6.1
II. Economic Indicators, 2001–05
2001 2002 2003 2004 2005
(In percent of GDP)
Origin of GDPAgriculture, fishing and mining 14.4 13.8 17.4 18.1 18.1Secondary activities 17.1 16.7 14.7 15.1 14.5Services 57.7 59.2 58.6 57.8 59.4Other 10.8 10.3 9.4 8.9 8.0
(Annual percentage changes, unless otherwise indicated)
National accounts and pricesReal GDP 4.9 5.1 9.3 4.6 3.5Real GDP per capita (millions of BLZ$) 6,784 6,918 7,329 7,668 7,441GDP deflator -0.2 1.8 -3.1 2.1 1.8Consumer price index (period average) 1.2 2.2 2.6 3.1 3.7Consumer price index (end of period) 0.9 3.2 2.3 3.1 4.2Unemployment rate (in percent) 9.1 10.0 12.9 11.6 11.0
(Ratios to GDP)
Gross domestic investment 1/ 27.2 22.3 21.5 18.9 23.1 Of which: public investment 14.9 14.0 12.1 6.5 4.1Gross national savings 4.7 2.0 3.3 4.6 8.8External savings 22.5 20.3 18.2 14.4 14.3Private consumption 78.1 78.5 77.4 75.1 71.4Public consumption 13.1 14.3 14.7 14.0 14.3
Central governmentRevenue and grants 25.0 25.3 21.4 22.8 23.5Of which: grants 1.0 1.7 0.3 1.5 0.6Current expenditure 2/ 19.6 17.0 19.9 22.7 24.8Capital expenditure and net lending 15.4 14.0 12.1 6.5 4.1Primary balance -6.8 -2.4 -5.9 0.8 2.0Overall balance -9.9 -5.6 -10.6 -6.4 -5.5Privatization 0.3 2.5 -5.2 0.0 2.3
Central government borrowing requirement 9.6 3.1 15.8 6.4 3.2Foreign financing 4.7 15.1 18.8 1.8 4.3
Domestic financing 5.0 -12.0 -3.0 4.5 -1.2
Sources: Belize authorities; and Fund staff estimates and projections.
1/ Including inventories and discrepancies.2/ Including unidentified expenditures.

61
Table 2. Belize: Sectoral Origin of Real Gross Domestic Product(In millions of Belize dollars at constant 2000 prices)
2001 2002 2003 2004 2005
GDP at constant factor cost Primary activities 252.2 252.9 348.0 380.7 392.4Agriculture and forestry 178.0 183.9 212.4 237.6 236.0Fishing 64.9 60.3 126.8 133.8 146.9Mining 9.3 8.8 8.8 9.3 9.5
Secondary activities 299.3 306.3 295.0 316.7 314.0Manufacturing 156.7 159.0 158.2 177.7 178.0Electricity and water supply 58.6 60.2 65.3 64.3 63.9Construction 83.9 87.0 71.5 74.7 72.2
Services 1,006.4 1,086.4 1,175.2 1,213.7 1,290.2Wholesale and retail trade, repairs 290.2 301.8 306.0 305.9 323.0Hotels and restaurants 66.4 68.0 77.9 84.0 87.4Transport and communication 158.5 176.4 191.5 201.1 216.7Financial intermediation 103.8 131.1 172.5 181.8 205.3Real estate, renting and business services 110.9 121.7 123.0 129.9 142.3Community, social and personal services 102.2 106.2 111.5 115.8 117.8General government services 174.4 181.2 192.7 195.3 197.7Banking charges
Net indirect taxes 240.0 262.4 285.0 289.0 288.6
GDP at constant market prices 1,745.7 1,834.6 2,005.9 2,098.8 2,171.3
Source: Central Statistical Office.

62
Table 3. Belize: National Accounts at Current Prices
2001 2002 2003 2004 2005
(In millions of Belize dollars)
Gross domestic expenditure 2,022 2,175 2,224 2,293 2,337Private final consumption expenditure 1,361 1,464 1,529 1,584 1,587Government final consumption expenditure 228 267 290 295 319Fixed capital formation 438 421 375 373 415Change in inventories -6 23 31 40 16
Balance of goods and nonfactor services -279 -311 -249 -183 -115 Exports 887 980 1,053 1,070 1,223 Imports 1,205 1,233 1,306 1,238 1,389
Discrepancy 1/ 39 -58 3 -15 50
GDP at market prices 1,743 1,864 1,975 2,110 2,222
(In percent of GDP at market prices)
Gross domestic expenditure 116.0 116.7 112.6 108.7 105.2Private final consumption expenditure 78.1 78.5 77.4 75.1 71.4Government final consumption expenditure 13.1 14.3 14.7 14.0 14.3Fixed capital formation 25.2 22.6 19.0 17.7 18.7Change in inventories -0.4 1.3 1.8 2.3 0.9
Balance of goods and nonfactor services -16.0 -16.7 -12.6 -8.7 -5.2 Exports 50.9 52.6 53.3 50.7 55.0 Imports 69.1 66.2 66.1 58.7 62.5
Discrepancy 1/ 2.2 -3.1 0.2 -0.7 2.3
Source: Central Statistical Office.
1/ Negative figure indicates expenditure approach yields a higher estimate of GDP than the production approach.

63
Table 4. Belize: Savings and Investment
2001 2002 2003 2004 2005
(In millions of Belize dollars at current prices)
Gross domestic investment 474 416 425 400 514Fixed capital formation 1/ 480 393 394 359 498Change in inventories -6 23 31 40 16
Gross national savings 82 38 65 96 195
Foreign savings 2/ 392 378 360 303 318
(In percent of GDP)
Gross domestic investment 27.2 22.3 21.5 18.9 23.1Fixed capital formation 1/ 27.5 21.1 19.9 17.0 22.4Change in inventories -0.4 1.2 1.6 1.9 0.7
Gross national savings 4.7 2.0 3.3 4.6 8.8
Foreign savings 2/ 22.5 20.3 18.2 14.4 14.3
Source: Central Bank of Belize.
1/ Including discrepancies2/ Current account deficit of the balance of payments.

64
Table 5. Belize: Agriculture, Forestry, Fish, and Industrial Production
2001 2002 2003 2004 2005
Agriculture, Forestry and Fish Production (In units as indicated)
Sugarcane ( '000 long tons) 1/ 1,023 1,151 1,073 1,149 929Oranges ('000 90-lb. boxes) 5,589 4,171 4,089 5,072 6,259Grapefruit ('000 80-lb. boxes) 1,960 1,246 1,049 2,194 998Bananas (' 00040-lb boxes) 2,608 2,369 4,043 4,346 4,037Lobster 478 562 598 612 …Shrimp 9,964 7,134 24,661 24,506 …
Sugar (long tons) 1/ 103,862 111,312 104,433 116,515 100,435Molasses (long tons) 1/ 2/ 34,411 40,947 42,944 41,117 37,074Flour ('000 lbs.) 26,122.1 26,078.4 26,952.2 27,783.1 26,959.9Fertilizer (' 000tons) 24,509 27,775 30,866 26,899 26,874Cigarettes (millions) 87.6 84.1 86.4 83.7 78.2Beer ('000 gals.) 2,385 2,388 2,313 2,156 1,891Soft drinks ('000 gals.) 5,277 5,475 5,690 5,474 4,929Batteries (units) 5,397.00 4,297.00 2,998.00 470.00 6.000Garments ('000 units) 1,172.5 985.2 1,074.1 1,157.8 611.9Citrus concentrates ('000 gals) 5,703 4,129 3,915 2,973 …Single strength juices ('000 gals) 1,032 657 1,658 2,102 …
Agriculture, Forestry and Fish Production (Annual percentage change)
Sugarcane 1/ 12.4 -6.7 7.1 -19.1Oranges -25.4 -2.0 24.0 23.4Grapefruit -36.4 -15.8 109.2 -54.5Bananas -9.2 70.7 7.5 -7.1Lobster 17.7 6.3 2.3 …Shrimp -28.4 245.7 -0.6 …
Sugar (long tons) 1/ -13.6 7.2 -6.2 11.6 -13.8Molasses (long tons) 1/ 2/ -3.5 19.0 4.9 -4.3 -9.8Flour ('000 lbs.) 3.6 -0.2 3.4 3.1 -3.0Fertilizer (' 000tons) 2.3 13.3 11.1 -12.9 -0.1Cigarettes (millions) 3.9 -4.0 2.7 -3.1 -6.6Beer ('000 gals.) 17.3 0.1 -3.1 -6.8 -12.3Soft drinks ('000 gals.) 7.7 3.7 3.9 -3.8 -10.0Batteries (units) -30.9 -20.4 -30.2 -84.3 -98.7Garments ('000 units) -33.4 -16.0 9.0 7.8 -47.1Citrus concentrates ('000 gals) 12.7 -27.6 -5.2 -24.1 …Single strength juices ('000 gals) -73.5 -36.3 152.4 26.8 …
Source: Central Bank of Belize.
1/ Production data on a crop year basis (December–November). 2/ Data refers to Tower Hill factory.
Industrial Production
Industrial Production (Annual percentage change)

65
Table 6. Belize: Indices of Industrial Products
(2000 = 100)
Weight (percent) 2001 2002 2003 2004 2005
Sugar 1/ 89 93 87 100 80Molasses 1/ 101 117 121 117 105Fertilizer 67 56 61 66 35Cigarettes 104 100 103 99 93Beer 117 117 114 106 93Soft drinks 108 112 116 112 101Batteries 69 55 38 6 0Garments 102 116 129 112 112Orange 110 79 77 92 124Grapefruit 171 65 58 127 59
Industrial production 2/ 105.2 97.5 98.2 101.7 99.9 (percentage change) 5.2 -7.3 0.8 3.5 -1.7
Source: Central Statistical Office.
1/ Production data are on a crop year basis (December–November). 2/ Based on value added of the manufacturing sector.

66
Table 7. Belize: Consumer Price Index 1/
2001 2002 2003 2004 2005
(Index numbers: November 1990 = 100)
End of period 2/Consumer price index 120.5 124.4 127.3 131.2 136.7
Food, beverages, and tobacco 120.0 122.3 125.0 129.2 135.6Clothing and footwear 89.2 88.7 89.2 89.6 89.6Household goods and maintenance 111.4 112.1 112.0 112.1 114.1Rent, water, fuel, and power 134.7 136.8 143.1 148.0 156.0Medical care 137.5 140.6 141.9 143.5 147.5Transportation and communication 123.1 136.1 140.5 148.6 158.1Recreation, education, and culture 124.6 129.0 129.5 130.9 131.9Personal care 121.0 122.7 121.6 121.3 121.9
AverageConsumer price index 120.2 122.8 126.0 129.9 134.7
Food, beverages, and tobacco 119.8 121.2 124.3 127.5 133.4Clothing and footwear 89.8 88.9 89.6 90.0 90.0Household goods and maintenance 111.6 112.0 112.2 112.3 113.2Rent, water, fuel, and power 135.7 134.2 139.1 146.4 152.4Medical care 137.0 140.2 141.4 142.8 145.3Transportation and communication 120.2 131.9 138.7 146.3 154.6Recreation, education, and culture 125.1 129.3 128.8 130.5 131.6Personal care 121.0 121.9 122.2 121.1 122.2
(Annual percentage change)
End of period 2/Consumer price index 0.9 3.2 2.3 3.1 4.2
Food, beverages, and tobacco 0.2 1.9 2.2 3.3 5.0Clothing and footwear -2.0 -0.5 0.6 0.4 -0.1Household goods and maintenance -1.0 0.7 -0.1 0.1 1.7Rent, water, fuel, and power 0.6 1.5 4.6 3.4 5.4Medical care 0.9 2.2 0.9 1.2 2.8Transportation and communication 5.5 10.5 3.3 5.8 6.4Recreation, education, and culture -0.8 3.6 0.4 1.1 0.8Personal care 0.9 1.3 -0.8 -0.3 0.5
AverageConsumer price index 1.2 2.2 2.6 3.1 3.7
Food, beverages, and tobacco 0.5 1.1 2.6 2.5 4.7Clothing and footwear -3.5 -1.0 0.8 0.4 -0.1Household goods and maintenance -0.9 0.3 0.2 0.1 0.7Rent, water, fuel, and power 2.1 -1.1 3.7 5.2 4.2Medical care 1.9 2.3 0.9 1.0 1.8Transportation and communication 5.3 9.7 5.2 5.5 5.7Recreation, education, and culture -0.4 3.4 -0.4 1.3 0.8Personal care 0.3 0.8 0.2 -0.9 0.9
Source: Central Bank of Belize.
1/ Based on the household expenditure survey conducted four times a year: February, May, August, and November. 2/ November of each year.

67
Tabl
e 8.
Bel
ize:
Pric
e S
truct
ure
of P
etro
leum
Pro
duct
s
Dec
embe
r 200
3D
ecem
ber 2
004
Dec
embe
r 200
5Pr
emiu
mR
egul
arKe
rose
neD
iese
lPr
emiu
mR
egul
arKe
rose
neD
iese
lPr
emiu
mR
egul
arKe
rose
neD
iese
l
Ret
ail p
rice
7.33
7.25
4.64
5.44
8.39
8.08
5.17
5.87
9.08
8.95
6.32
6.84
Tota
l lan
ded
cost
2.13
2.08
2.20
2.14
2.66
2.62
2.91
2.85
3.51
3.66
4.06
3.95
Acqu
isiti
on c
ost
1.98
1.93
2.05
1.99
2.51
2.47
2.76
2.70
3.36
3.51
3.91
3.80
Han
dlin
g ch
arge
s0.
130.
130.
130.
130.
130.
130.
130.
130.
130.
130.
130.
13Po
rt D
ues
0.02
0.02
0.02
0.02
0.02
0.02
0.02
0.02
0.02
0.02
0.02
0.02
Gov
ernm
ent c
harg
es4.
174.
171.
722.
414.
514.
271.
512.
114.
304.
021.
421.
89St
amp
duty
0.02
0.02
0.02
0.02
0.03
0.03
0.03
0.03
0.04
0.04
0.05
0.05
Valu
e-ad
ded
tax
0.29
0.29
0.25
0.27
0.38
0.38
0.36
0.39
0.53
0.55
0.55
0.57
Impo
rt du
ty0.
450.
450.
000.
270.
450.
450.
000.
270.
450.
450.
000.
27En
viro
nmen
tal t
ax0.
020.
020.
020.
020.
030.
020.
030.
030.
070.
070.
080.
08R
even
ue re
plac
emen
t tax
3.39
3.39
1.43
1.83
3.62
3.39
1.09
1.39
3.21
2.91
0.74
0.92
Com
mer
cial
cha
rges
1.03
1.00
0.72
0.89
1.22
1.19
0.75
0.91
1.27
1.27
0.84
1.00
Del
iver
y co
st to
ser
vice
sta
tion
0.07
0.07
0.06
0.06
0.07
0.07
0.07
0.07
0.07
0.07
0.07
0.07
Who
lesa
ler M
argi
n0.
410.
380.
230.
280.
410.
380.
230.
280.
410.
380.
230.
28G
ross
mar
gin-
deal
er0.
550.
550.
430.
550.
740.
740.
450.
560.
790.
820.
550.
65
(Bel
ize
dolla
rs p
er g
allo
n)

68
Tabl
e 9.
Bel
ize:
Ope
ratio
ns o
f the
Soc
ial S
ecur
ity B
oard
(In
Bel
ize
dolla
rs)
1999
2000
2001
2002
2003
2004
2005
Rev
enue
33,2
56,4
6536
,569
,000
51,0
40,0
8653
,442
,272
56,9
78,0
2368
,177
,115
65,3
25,8
84C
ontri
butio
ns16
,703
,661
18,3
97,6
5931
,184
,264
35,1
20,0
9140
,977
,522
46,6
81,3
9750
,327
,886
Inte
rest
and
oth
er in
com
e16
,552
,804
18,1
71,3
4119
,855
,822
18,3
22,1
8116
,000
,501
21,4
95,7
1814
,997
,998
Tota
l exp
endi
ture
23,1
98,6
2130
,244
,732
34,4
05,0
3640
,878
,936
46,0
27,8
7545
,411
,718
51,0
56,5
47C
urre
nt e
xpen
ditu
re23
,145
,436
25,4
25,3
5133
,231
,377
39,7
74,9
7142
,367
,790
45,2
79,3
8147
,056
,304
Be
nefit
pay
men
ts13
,846
,171
14,7
91,1
0122
,126
,523
27,2
75,0
9128
,587
,150
30,9
24,1
6931
,292
,035
Ad
min
istra
tion
9,29
9,26
510
,634
,250
11,1
04,8
5412
,499
,880
13,7
80,6
4014
,355
,212
15,7
64,2
69C
apita
l exp
endi
ture
53,1
854,
819,
381
1,17
3,65
91,
103,
965
3,66
0,08
513
2,33
74,
000,
243
Shar
es a
nd o
ther
long
-term
inve
stm
ents
1/
174,
991,
196
197,
110,
592
217,
523,
585
220,
809,
891
226,
193,
035
182,
820,
890
180,
512,
208
Cur
rent
bal
ance
10,1
11,0
2911
,143
,649
17,8
08,7
0913
,667
,301
14,6
10,2
3322
,897
,734
18,2
69,5
80
Ove
rall
bala
nce
10,0
57,8
446,
324,
268
16,6
35,0
5012
,563
,336
10,9
50,1
4822
,765
,397
14,2
69,3
37
Mem
oran
dum
item
s:
Tota
l res
erve
s20
0,88
2,38
720
8,31
8,53
022
5,53
0,63
423
8,38
6,32
625
1,47
6,69
527
3,58
0,69
228
5,92
4,80
6
Of w
hich
: ca
sh a
nd c
ertif
icat
e of
dep
osits
29,5
05,0
948,
965,
992
7,19
4,59
012
,499
,257
16,6
32,6
9277
,570
,308
92,1
82,6
41
So
urce
s: B
eliz
e au
thor
ities
; and
Fun
d st
aff e
stim
ates
.
1/
In 2
000/
01 th
e So
cial
Sec
urity
Boa
rd b
ough
t sha
res
of th
e w
ater
aut
horit
y eq
uiva
lent
to B
Z$6
milli
on fr
om th
e ce
ntra
l gov
ernm
ent.

69
Table 10. Belize: Central Government Revenue 1/
2001/02 2002/03 2003/04 2004/05 2005/06
(In millions of Belize dollars)
Total revenue and grants 436.5 431.3 452.1 469.4 550.0Total revenue 418.3 412.5 428.4 454.8 527.1 Current revenue 402.4 406.0 421.8 447.0 527.1
Tax revenue 326.1 359.6 376.6 408.1 476.2Income tax 77.0 78.9 89.1 99.6 129.5Property tax 2.8 2.4 2.9 4.5 5.5Taxes on goods and services 107.9 113.3 120.0 141.0 164.0Taxes on international trade 138.4 164.9 164.5 162.9 177.3
Of which : revenue replacement duty 58.9 74.8 78.2 74.6 56.7Nontax revenue 76.3 46.4 45.2 39.0 50.8
Capital revenue 15.9 6.5 6.6 7.8 0.0Grants 18.2 18.8 23.7 14.6 22.9
(In percent of GDP)
Total revenue 23.6 21.8 21.3 21.3 23.2Tax revenue 18.4 19.0 18.7 19.1 20.9
Income tax 4.3 4.2 4.4 4.7 5.7Property tax 0.2 0.1 0.1 0.2 0.2Taxes on goods and services 6.1 6.0 6.0 6.6 7.2Taxes on international trade 7.8 8.7 8.2 7.6 7.8
Nontax revenue 4.3 2.5 2.3 1.8 2.2Capital revenue 0.9 0.3 0.3 0.4 0.0
(Annual percentage change)
Total revenue 19.1 -1.4 3.8 6.2 15.9Tax revenue 9.9 10.3 4.7 8.4 16.7
Income tax 0.9 2.5 12.9 11.8 30.0Taxes on goods and services 27.3 -12.8 19.0 56.1 21.7Taxes on international trade 6.0 5.0 5.9 17.5 16.3
Nontax revenue 81.1 -39.1 -2.5 -13.9 30.5
Sources: Ministry of Finance; and Fund staff estimates.
1/ Fiscal year from April to March.

70
Table 11. Belize: Treasury Securities by Holder
(In millions of Belize dollars, end of period)
2001 2002 2003 2004 2005
Total holdings 93.3 93.3 123.3 123.3 123.3
Treasury bills 70.0 70.0 100.0 100.0 100.0
Central Bank of Belize 5.6 0.5 54.1 81.4 72.6
Commercial banks 63.1 64.9 33.2 13.9 24.9
Other 1/ 1.3 4.6 12.6 4.7 2.5
Treasury notes at commercial banks 23.3 23.3 23.3 23.3 23.3
Source: Central Bank of Belize.
1/ Includes Caribbean Development Bank.

71
2001 2002 2003 2004 2005
Assets Current assets Cash and claims on banks - unrestricted 21.35 8.69 6.09 8.15 6.83 Cash and claims on banks - restricted - 13.84 14.84 17.86 18.36 Accounts receivable and prepayments 45.85 45.41 88.12 139.38 7.89 Interest receivable, net of provisions 4.48 3.11 3.59 3.76 0.94 Supplies and spare parts inventory 0.02 0.02 0.02 0.02 0.02 Long term assets Credit to the private sector
Loan to borrowers (restricted) 77.41 194.36 155.66 90.02 78.95 Loan to borrowers 188.36 115.60 168.28 241.39 223.98 Less: provision for bad debt (2.38) (5.10) (10.98) (28.00) (66.31)
Assets held for resale 159.75 167.90 156.46 138.85 28.06 Santa Cruz lodge and Libertad land 6.00 5.19 5.31 5.31 - Reserves and retained interests - - - - - Investments 5.58 6.29 6.52 4.50 2.52 Sinking funds 70.95 73.41 81.38 - - Agency accounts, net 1.11 1.50 1.80 (0.14) (3.18) Fixed assets, net of depreciation 6.44 6.40 6.39 5.07 4.17
LiabilitiesCurrent liabilities Accounts payable and accrued expenses 20.98 27.40 45.88 87.41 47.25 Current repayments long-term loans and bonds 26.26 39.52 19.78 23.87 18.28 Short-term liability 40.22 5.00 2.50 1.50 - Long-term liabilities CDB loans 37.66 33.36 40.34 44.81 36.05 CBB loans 85.01 8.24 5.48 0.22 0.11 Other loans 197.69 260.72 306.67 299.48 106.33 Bonds - 83.08 76.88 71.24 63.34 Other liabilities Sinking fund 70.95 73.41 81.38 - - Deferred income - Securitization 69.77 61.81 53.87 47.90 - Deferred income other - 6.61 7.08 7.25 - CapitalShare capital 29.13 29.13 34.50 34.50 26.31 Minority interest 1.33 1.32 1.16 1.34 1.16 Capital grants 6.46 6.61 6.56 6.63 5.27 Accumulated deficit (2.36) (1.84) (1.00) (1.41) (2.24) Reserve for unrealized gains on investments 1.85 2.25 2.42 1.43 0.38
Source: Belize authorities.
(In millions of Belize dollars)
Table 12. Belize: Accounts of the Development Financial Corporation

72
Diff
eren
ceTr
easu
ryC
entra
lS
prea
d b
etw
een
Bill
Ban
k C
omm
erci
al B
ank
Rat
esle
ndin
g m
inus
B
eliz
e an
d D
isco
unt
Lend
ing
Sav
ing
Tim
e P
erso
nal
Com
mer
cial
Mor
tgag
eU
S$L
IBO
R
dep
osits
in
tern
atio
nal
rate
rate
de
posi
tsde
posi
ts 2
/ lo
ans
loan
slo
ans
Dep
osits
Loan
s90
-Day
inte
rest
rate
sin
tere
st ra
tes
3/
2001 I
5.91
12.0
05.
436.
6316
.63
15.5
814
.50
4.40
15.6
45.
3411
.24
1.29
II5.
9112
.00
5.48
6.36
16.4
715
.06
14.1
24.
2515
.28
4.18
11.0
32.
18III
5.91
12.0
05.
376.
1016
.42
15.0
316
.42
4.19
15.2
53.
4511
.06
2.65
IV5.
9112
.00
5.39
6.11
16.8
314
.76
16.8
34.
2715
.37
2.14
11.1
03.
97
2002 I
5.91
12.0
05.
106.
1716
.69
14.8
314
.01
4.13
15.3
01.
9011
.17
4.27
II5.
9112
.00
5.07
6.26
15.7
814
.45
13.6
34.
3314
.64
1.90
10.3
14.
36III
3.25
12.0
05.
036.
3215
.51
14.3
013
.52
4.36
14.4
81.
8110
.12
4.51
IV3.
2212
.00
5.07
6.52
15.8
614
.26
13.3
44.
5314
.50
1.55
9.97
4.97
2003 I
3.22
12.0
05.
096.
8115
.97
14.1
913
.23
4.71
14.4
41.
339.
735.
48II
3.22
12.0
05.
066.
9315
.71
14.2
213
.01
4.78
14.3
51.
249.
575.
69III
3.22
12.0
05.
056.
9715
.78
14.2
112
.96
4.83
14.4
01.
139.
575.
84IV
3.22
12.0
05.
067.
2315
.75
13.9
112
.36
4.94
14.2
11.
179.
276.
06
2004 I
3.22
12.0
05.
117.
2715
.50
13.8
012
.52
4.98
13.9
91.
129.
016.
15II
3.22
12.0
05.
047.
4815
.57
13.9
212
.61
5.25
13.8
91.
308.
646.
18III
3.22
12.0
05.
107.
5015
.41
13.9
012
.59
5.24
13.8
51.
758.
615.
75IV
3.22
12.0
05.
067.
6015
.47
13.9
612
.59
5.24
14.0
42.
308.
805.
30
2005 I
3.22
12.0
05.
087.
5015
.48
14.1
812
.84
5.25
14.2
32.
838.
984.
67II
3.22
12.0
05.
107.
7815
.96
14.1
312
.86
5.31
14.2
53.
288.
944.
50III
3.22
12.0
05.
107.
7016
.06
14.3
413
.08
5.40
14.3
83.
778.
983.
93IV
3.22
12.0
05.
187.
8215
.99
14.1
513
.12
5.46
14.3
04.
348.
843.
48
2006 I
3.22
12.0
05.
208.
1615
.92
13.9
212
.99
5.87
14.2
04.
768.
333.
40II
3.22
12.0
05.
208.
1716
.05
13.8
013
.17
5.76
14.1
85.
218.
422.
96
S
ourc
e: C
entra
l Ban
k of
Bel
ize.
1/
Qua
rterly
ave
rage
s.
2/ 9
0-da
y tim
e de
posi
ts.
3/
Tim
e de
posi
ts ra
te c
ompa
red
with
U.S
. dol
lar L
IBO
R, b
oth
for 9
0-da
y de
posi
ts.
Wei
ghte
d A
vera
ge
Tabl
e 13
. Bel
ize:
Inte
rest
Rat
es 1
/(A
nnua
l per
cent
age)

73
Table 14. Belize: Sectoral Distribution of Credit to the Private Sector
2001 2002 2003 2004 2005 2006
(In millions of Belize dollars)
Primary sectors Agriculture 91,485.0 104,886.0 117,996.0 126,913.0 117,169.0 124,622.0 Sugar 14,720.0 11,228.0 8,759.0 9,948.0 9,523.0 7028 Citrus 18,306.0 18,771.0 22,122.0 19,044.0 15,988.0 16850 Bananas 29,528.0 36,560.0 45,219.0 52,944.0 57,981.0 62727 Grains 1,253.0 3,526.0 4,685.0 9,948.0 3,733.0 3381 Other agriculture 27,678.0 34,801.0 37,211.0 35,029.0 29,944.0 34636 Other primary 4,703.0 11,898.0 17,753.0 219,565.0 24,507.0 26856Secondary sectors Manufacturing 44,285.0 23,021.0 12,642.0 14,932.0 19,156.0 18487 Construction 177,711.0 201,673.0 282,509.0 258,744.0 263,745.0 259726Services Transportation 40,090.0 27,237.0 38,432.0 38,735.0 33,345.0 36212 Tourism 43,993.0 51,761.0 78,080.0 84,545.0 71,478.0 89293 Trade and commerce 136,312.0 150,532.0 162,391.0 165,206.0 157,584.0 158936 Other services 71,005.0 130,285.0 156,742.0 229,482.0 271,372.0 230023Personal 2/ 172,998.0 191,544.0 208,401.0 197,111.0 259,033.0 303285
Primary sectors Agriculture 11.7 11.7 11.0 9.5 9.6 10.0 Sugar 1.9 1.3 0.8 0.7 0.8 0.6 Citrus 2.3 2.1 2.1 1.4 1.3 1.4 Bananas 3.8 4.1 4.2 4.0 4.8 5.0 Rice 0.2 0.4 0.4 0.7 0.3 0.3Other agriculture 3.5 3.9 3.5 2.6 2.5 2.8 Other primary 0.6 1.3 1.7 16.4 2.0 2.2Secondary sectors Manufacturing 5.7 2.6 1.2 1.1 1.6 1.5 Construction 22.7 22.6 26.3 19.4 21.7 20.8Services Transportation 5.1 3.1 3.6 2.9 2.7 2.9 Tourism 5.6 5.8 7.3 6.3 5.9 7.2 Trade and commerce 17.4 16.9 15.1 12.4 12.9 12.7 Other services 9.1 14.6 14.6 17.2 22.3 18.4Personal 2/ 22.1 21.5 19.4 14.8 21.3 24.3
Sources: Central Bank of Belize
1/ Loans and advances only. 2/ Includes mortgage loans, credit card balances, and credit union loans.
(In percent of total)

74
Table 15. Belize: Commercial Banks' Liquidity Position
2001 2002 2003 2004 2005
(In percent of average deposit liabilities)
Minimum liquid assets requirement 232,456 243,396 252,223 237,923 271,604Cash reserve requirement 1/ 35,118 60,849 63,056 83,273 103,468Other liquid assets requirement 2/ 197,338 182,547 189,167 154,650 168,136
Actual liquid assets 354,170 304,155 303,357 324,280 330,024Reserves at central bank 1/ 87,174 64,831 79,629 81,719 111,821Other liquid assets 2/ 266,996 239,324 223,728 242,561 218,203 Of which Foreign assets 107,705 101,468 80,780 111,049 129,056 Treasury bills 64,578 33,089 19,780 25,940 22,818
Excess liquidity 121,714 60,759 51,134 86,357 58,420
(In millions of Belize dollars)
Memorandum items:Average deposit liabilities 986,567 1,014,149 1,050,931 1,189,615 1,293,352Total deposits (end-of-period) 989,415 1,020,550 1,063,718 1,218,328 1,306,457 Of which Central government 8,113 12,751 6,668 13,244 19,441 Social Security Board 12,815 14,721 13,828 68,923 74,692Total loans and advances 788,542 904,528 1,041,689 1,176,047 1,254,652Credit/deposit ratio 0.80 0.89 0.98 0.97 0.96
Source: Central Bank of Belize.
1/ Deposits at the central bank. 2/ Includes cash in vault, Belize government treasury bills, foreign assets, and other approved assets.

75
Table 16. Belize: Principal Domestic Exports 1/ (In millions of U.S. dollars, volume as indicated, unit value in U.S. dollars)
2001 2002 2003 2004 2005
Total exports (value) 269.1 309.7 315.5 307.5 321.9Total domestic exports (value) 160.7 146.3 179.8 187.0 194.3 Main exports (value) 145.3 131.4 164.5 165.5 164.3 Other exports (value) 15.4 14.9 15.3 21.5 30.0Reexports, f.o.b. 108.2 163.2 135.5 119.5 127.4Coverage adjustments 2/ 0.2 0.2 0.2 0.2 0.2SugarValue 29.7 33.0 35.6 40.8 34.9Volume ('000 long tons) 95.5 103.3 98.6 112.1 88.1Unit value (U.S. cents/lb.) 13.9 14.3 16.1 16.2 17.7MolassesValue 0.8 1.3 1.2 0.9 1.4Volume (million gallons) 4.8 5.6 5.6 5.0 5.1Unit value (U.S. cents/gallon) 16.7 23.2 21.4 18.0 27.5Seafood productsValue 33.2 34.9 55.1 53.7 45.4Volume (million pounds) 7.5 7.6 17.1 18.4 20.1Unit value (U.S. dollars/pound) 4.4 4.6 3.2 2.9 2.3BananaValue 21.4 16.8 26.3 26.5 25.5Volume (million boxes of 42 lbs.) 2.7 2.3 4.0 4.4 4.2Unit value (U.S. cents/lb.) 19.8 18.3 16.4 15.1 15.2Citrus concentrates 3/Value 38.0 27.1 27.5 22.9 38.3Volume (million ps) 37.2 25.3 26.3 27.8 35.5Unit value (U.S. dollars/ps) 1.0 1.1 1.0 0.8 1.1Single strength juices 3/Value 5.5 1.7 1.6 0.6 0.5Volume (million ps) 2.6 0.6 0.6 0.3 0.2Unit value (U.S. dollars/ps) 2.1 2.8 2.7 2.0 2.5Sawn woodValue 1.2 1.3 1.8 1.5 1.3Volume (million board feet) 1.0 1.1 1.1 1.1 0.7Unit value (U.S. cents/bd. foot) 120.0 118.2 163.6 136.4 185.7GarmentsValue 15.5 15.3 15.4 18.6 17.0Volume (mn lbs) 3.2 3.3 3.2 3.9 3.4Unit value (U.S. dollars/doz.)Memorandum items:Total exports (percent change) 15.1 1.9 -2.5 4.7Total exports (percent of GDP) 15.4 16.6 16.0 14.6 14.6
Sources: Central Statistical Office; and Fund staff estimates. 1/ Domestic exports defined as total exports minus reexports. 2/ Exports through parcel post. 3/ Comprises actual sales abroad, net of inventory accumulation abroad.

76
Table 17. Belize: Domestic Exports by Standard International Trade Classification Category
2001 2002 2003 2004 2005
(In thousands of U.S. dollars)
Total domestic exports, f.o.b. 1/ 162.7 158.4 190.7 205.1 212.8Food 144.2 134.4 171.0 180.4 187.0Crude material 1.7 1.6 2.3 1.8 1.7Chemicals 0.3 1.0 0.3 1.8 4.4Manufactured goods 0.5 5.9 1.0 2.3 2.3Machinery and equipment 0.7 0.5 0.5 0.2 0.0Miscellaneous manufactures 15.6 15.2 15.6 18.6 17.4
(In percent of total exports)
Total domestic exports, f.o.b. 1/ 100.0 100.0 100.0 100.0 100.0Food 88.6 84.8 89.7 88.0 87.8Crude material 1.0 1.0 1.2 0.9 0.8Chemicals 0.2 0.6 0.2 0.9 2.1Manufactured goods 0.3 3.7 0.5 1.1 1.1Machinery and equipment 0.4 0.3 0.3 0.1 0.0Miscellaneous manufactures 9.6 9.6 8.2 9.1 8.2 Memorandum item:Domestic exports as percent of GDP 9.3 8.5 9.7 9.7 9.6 Sources: Central Statistical Office; and Fund staff estimates.
1/ Domestic exports defined as total exports minus reexports.

77
Table 18. Belize: Retained Imports by Standard InternationalTrade Classification Category
2001 2002 2003 2004 2005
(In millions of U.S. dollars)
Gross imports, c.i.f. 1/ 520.1 537.3 568.0 530.7 614.1Temporary imports 2/ 8.1 12.1 n.a. n.a. n.a
Retained imports, c.i.f. 1/ 468.9 485.7 463.3 443.1 474.2Food and live animals 58.7 53.5 58.9 54.4 60.0Beverages and tobacco 3.8 4.1 4.4 4.9 8.7Crude materials 5.7 3.7 3.3 3.6 4.5Mineral, fuels and lubricants 69.9 57.6 65.7 76.8 97.1Animal and vegetable oils 1.6 1.5 1.6 1.5 1.6Chemicals and related products 35.5 42.3 41.0 37.8 43.2Manufactured goods: materials 67.9 63.9 64.1 67.6 68.8Machinery and transport equipment 113.7 96.6 92.9 84.5 98.4Miscellaneous manufactured articles 37.4 39.9 51.4 40.7 50.1Commodities and transactions N.E.C. 3/ 74.7 122.6 80.0 71.3 41.9
(In percent of total retained imports)
Retained imports, c.i.f. 1/ 100.0 100.0 100.0 100.0 100.0Food and live animals 12.5 11.0 12.7 11.7 12.9Beverages and tobacco 0.8 0.8 1.0 1.1 1.9Crude materials 1.2 0.8 0.7 0.8 1.0Mineral, fuels and lubricants 14.9 11.9 14.2 16.6 21.0Animal and vegetable oils 0.3 0.3 0.4 0.3 0.3Chemicals and related products 7.6 8.7 8.8 8.2 9.3Manufactured goods: materials 14.5 13.2 13.8 14.6 14.8Machinery and transport equipment 24.2 19.9 20.0 18.2 21.2Miscellaneous manufactured articles 8.0 8.2 11.1 8.8 10.8Commodities and transactions N.E.C. 3/ 15.9 25.3 17.3 15.4 9.0
Memorandum itemsRetained imports Percentage change 3.6 -4.6 -4.4 7.0 In percent of GDP 26.9 26.1 23.5 21.0 21.5Gross imports Percentage change 3.3 5.7 -6.6 15.7 In percent of GDP 29.8 28.8 28.8 25.1 27.8
Sources: Central Bank of Belize; and Fund staff estimates.
1/ Includes imports through parcel post and electricity. 2/ Starting in 1997 with the opening of the Corozal free trade zone discrepancies arose betweentemporary imports and reexports. 3/ Commodities & Transactions N.E.C. includes some transactions for Export Processing Zones and electricity purchased from Mexico.

78
2001 2002 2003 2004 2005
(In millions of U.S. dollars)
Consumer GoodsFood and beverages 45.0 43.3 44.6 44.2 49.0Transport equipment 5.0 7.8 4.9 6.6 7.1Durable goods 12.2 11.6 13.2 16.9 23.5Semi-durable goods 15.1 15.3 16.6 16.5 17.8Nondurable goods 23.7 25.4 39.9 24.8 28.1Passenger motor cars 1.0 4.9 12.3 9.8 9.2
Intermediate GoodsFood and beverages 9.2 7.2 8.7 6.9 9.3Fuels and lubricants 139.8 128.3 44.8 54.1 70.9Parts and accessories 39.3 31.0 23.6 22.5 22.3Industrial supplies nes 25.4 23.0 123.3 105.5 126.7Motor spirit 12.9 11.0 1.9 23.2 12.7
Capital GoodsTransport equipment 49.0 39.6 17.3 12.8 12.8Other capital goods 21.3 23.5 43.1 33.4 47.5
Other goodsGoods to EPZ 66.0 110.6 65.4 56.9 62.4Goods to CFZ 43.5 40.0 90.3 78.3 91.9Householdgoods 2.1 1.6 1.7 1.3 1.4Goods nes 0.5 0.4 0.6 0.2 0.5Total 511.0 524.5 552.1 514.0 592.9
Source: Central Statistical Office.
Table 19. Belize: Imports by Economic End-Use

79
Table 20. Belize: Sugar Exports by Destination
(In millions of U.S. dollars; volume in thousands of long tons; prices in U.S. cents per pound)
2001 2002 2003 2004 2005
Total sugar exportsValue 29.7 33 35.6 40.8 34.9Volume 95.5 103.5 98.6 107.1 88.1Unit Value (U.S. cents/lb.) 13.9 14.2 16.1 17.0 17.7
United StatesValue 4.4 4.8 5.0 4.3 4.2Volume 10.9 11.0 10.9 10.9 11.0Unit Value (U.S. cents/lb.) 18.0 19.5 20.5 17.6 17.0
European UnionValue 18.8 21.9 23.3 23.7 21.2Volume 44.6 48.9 46.4 48 39.9Unit Value (U.S. cents/lb.) 18.8 20.0 22.4 22.0 23.7
Free marketValue 6.5 6.3 7.3 12.8 9.5Volume 40.0 43.6 41.3 48.2 37.2Unit Value (U.S. cents/lb.) 7.3 6.5 7.9 11.9 11.4
Memorandum item:Share of sugar exports in domestic exports (in percent) 18.5 22.6 19.8 21.8 18.0
Source: Central Statistical Office.

80
Table 21. Belize: Visitor Arrivals
(In persons, unless otherwise indicated)
2001 2002 2003 2004 2005
Stay-over tourist arrivals by origin 195,955 199,521 220,574 230,832 236,573Annual percentage change 0.1 1.8 10.6 4.7 2.5By origin
North America 123,523 123,201 143,431 156,143 165,450United States 106,292 104,603 127,288 137,367 145,977Canada 9,492 9,185 9,831 11,925 13,580Mexico 7,739 9,413 6,312 6,851 5,893
Europe 28,736 29,115 33,530 32,770 33,468United Kingdom 8,313 9,444 9,318 9,991 9,989Holland 3,906 3,656 4,212 3,585 3,617Germany 3,841 3,602 4,146 4,269 3,966Italy 3,093 3,122 3,847 2,851 3,080France 1,829 2,218 3,115 3,308 3,805Spain 1,510 1,377 1,737 1,402 1,386Switzerland 988 974 1,019 1,028 804Other European 5,256 4,722 6,136 6,336 6,821
Central America 21,904 28,619 27,514 24,956 20,828Caribbean countries 1,760 1,941 2,055 2,210 2,086South America 1,793 1,560 1,784 1,941 1,937Other 18,239 15,085 12,260 12,812 12,804
Cruise ship arrivals 48,116 319,690 575,196 851,436 800,331Annual percentage change -17.2 564.4 79.9 48.0 -6.0
Tourism receipts (US$ million) 120.5 132.8 155.7 172.7 174.7Annual percentage change 1.9 10.2 17.2 10.9 1.2
Source: Belize Tourism Board.

81
Table 22. Belize: Direction of Trade
2001 2002 2003 2004 2005
(In millions of U.S. dollars)
Domestic exports, f.o.b. 1/ 162.7 158.3 190.7 205.1 206.0United States 84.3 84.1 105.8 113.1 107.3United Kingdom 39.0 39.0 46.8 40.3 45.4Other European Union 11.4 14.8 10.3 20.7 13.7Canada 1.2 0.9 0.5 0.4 0.2Mexico 1.2 1.9 2.8 2.8 8.8CARICOM 10.8 11.2 16.1 23.3 23.7Other 14.9 6.5 8.6 4.4 6.8 Total imports, c.i.f. 516.8 524.5 552.1 514.1 592.9United States 237.0 226.9 234.8 199.0 231.9United Kingdom 11.0 14.1 14.0 12.0 9.3Other European Union 26.4 27.2 28.2 19.9 30.4Canada 5.3 16.1 6.8 6.2 7.9Mexico 43.5 40.9 43.7 53.0 55.6CARICOM 20.8 15.9 15.1 13.2 14.2Other 172.8 183.4 209.5 210.8 243.6
(In percent of total) Domestic exports, f.o.b. 1/ 100.0 100.0 100.0 100.0 100.0United States 51.8 53.1 55.5 55.1 52.1United Kingdom 24.0 24.6 24.5 19.7 22.1Other European Union 7.0 9.4 5.4 10.1 6.7Canada 0.7 0.6 0.2 0.2 0.1Mexico 0.7 1.2 1.5 1.4 4.3CARICOM 6.6 7.1 8.4 11.4 11.5Other 9.1 4.1 4.5 2.2 3.3 Total imports, c.i.f. 100.0 100.0 100.0 100.0 100.0United States 45.9 43.3 42.5 38.7 39.1United Kingdom 2.1 2.7 2.5 2.3 1.6Other European Union 5.1 5.2 5.1 3.9 5.1Canada 1.0 3.1 1.2 1.2 1.3Mexico 8.4 7.8 7.9 10.3 9.4CARICOM 4.0 3.0 2.7 2.6 2.4Other 33.4 35.0 37.9 41.0 41.1
Source: Central Bank of Belize.
1/ Domestic exports defined as total exports minus reexports.

82
Table 23. Belize: Public and Publicly Guaranteed Debt
2001 2002 2003 2004 2005
(In millions of U.S. dollars)
Debt outstanding (end-of-period) 730.8 830.0 1,010.8 1,057.4 1,094.5Domestic debt 1/ 73.6 29.9 56.1 94.8 81.4External debt 657.2 800.1 954.6 962.6 1,013.2
Public sector debt 615.4 744.1 899.2 885.6 965.1Central government 341.3 470.6 719.2 810.5 876.2Nonfinancial public sector 24.2 8.1 7.1 6.1 29.0Financial public sector 249.9 265.4 172.9 69.0 59.9
CBB 48.4 10.7 5.0 2.3 0.9DFC 201.5 254.7 167.8 66.7 59.0
Publicly guaranteed external debt 41.8 56.0 55.4 77.0 48.1
(In percent of GDP)
Debt outstanding (end-of-period) 83.9 89.0 102.3 100.2 98.5Domestic debt 1/ 8.4 3.2 5.7 9.0 7.3External debt 75.4 85.8 96.7 91.2 91.2
Public sector debt 70.6 79.8 91.1 83.9 86.9Central government 39.2 50.5 72.8 76.8 78.9Nonfinancial public sector 2.8 0.9 0.7 0.6 2.6Financial public sector 28.7 28.5 17.5 6.5 5.4
CBB 5.6 1.1 0.5 0.2 0.1DFC 23.1 27.3 17.0 6.3 5.3
Publicly guaranteed external debt 4.8 6.0 5.6 7.3 4.3
Source: Central Bank of Belize.
1/ Refers to central government.

83
Table 24. Belize: Indices of Effective Exchange Rate 1/
(Indices 2000= 100)
Nominal effective Real effectiveexchange rate exchange rate 2/
Quarterly averages
2001I 101.9 100.4II 103.2 101.4III 102.9 100.8IV 103.2 100.8
2002I 103.8 101.2II 102.8 100.7III 101.5 99.7IV 102.1 100.2
2003I 101.2 99.0II 100.1 97.8III 100.5 98.0IV 99.2 96.8
2004I 98.1 95.5II 99.3 96.6III 98.9 96.1IV 96.8 93.9
2005I 95.7 92.6II 96.4 93.8III 97.1 94.9IV 98.1 95.9
Annual averages2000 100.0 100.02001 102.8 100.92002 102.5 100.42003 100.2 97.92004 98.3 95.52005 97.1 95.2
Sources: IMF Information Notice System; and Fund staff estimates.
1/ Trade weighted, an increase (decrease) indicates appreciation (depreciation). 2/ Nominal exchange rate deflated by seasonally adjusted relative consumer prices.