Belgrade Public Schools · McKibben Demographic Research October 2014 2 EXECUTIVE SUMMARY 1....
32
Belgrade Public Schools POPULATION AND ENROLLMENT FORECASTS, 2015 - 2024 Prepared by: Jerome N. McKibben, Ph.D. McKibben Demographic Research Rock Hill, South Carolina mckibbendemographics.com 978-501-7069 October 2014
Transcript of Belgrade Public Schools · McKibben Demographic Research October 2014 2 EXECUTIVE SUMMARY 1....
Belgrade Public Schools
POPULATION AND ENROLLMENT FORECASTS, 2015 - 2024
Prepared by:
Jerome N. McKibben, Ph.D.
McKibben Demographic Research
Rock Hill, South Carolina
mckibbendemographics.com
978-501-7069
October 2014
McKibben Demographic Research October 2014 1
Table of Contents
EXECUTIVE SUMMARY ................................................... 2
INTRODUCTION ............................................................... 3
DATA ................................................................................ 5
ASSUMPTIONS ................................................................ 7
METHODOLOGY ............................................................ 12
RESULTS AND ANALYSIS-POPULATION FORECASTS ....... 16
Table 1: Forecasted Population Change, 2010 to 2020 ........................................ 16 Table 2: Forecasted Elementary Area Population Change, 2010 to 2020 ............. 17 Table 3: Household Characteristics by Elementary Districts, 2010 Census .......... 19 Table 4: Householder Characteristics by Elementary Districts, 2010 Census ...... 22 Table 5: Single Person Households and Single Person Households over age 65 by Elementary Districts, 2010 Census ................................................................... 23
RESULTS AND ANALYSIS-ENROLLMENT FORECASTS…...23 Elementary Enrollment .............................................................................................. 23
Table 6: Total Elementary Enrollment, 2013, 2018, 2023 ...................................... 24 Middle School Enrollment .......................................................................................... 28 High School Enrollment ............................................................................................. 29
REFERENCES ................................................................ 30
McKibben Demographic Research October 2014 2
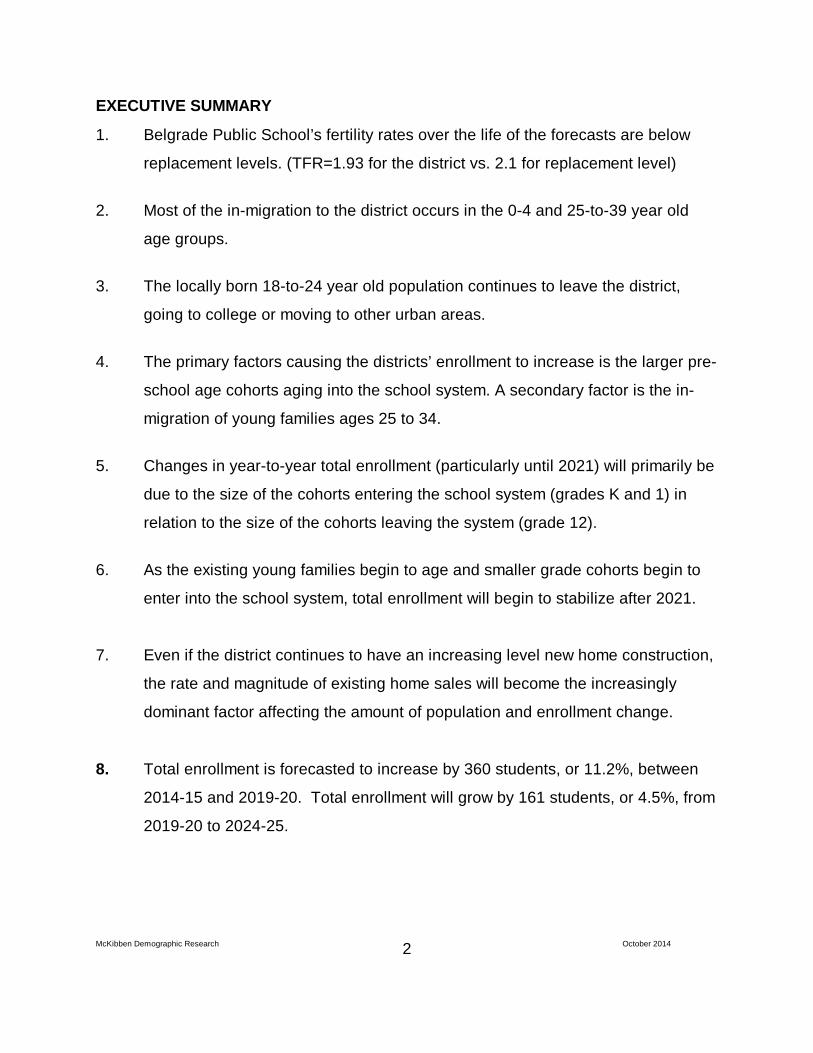
EXECUTIVE SUMMARY
1. Belgrade Public School’s fertility rates over the life of the forecasts are below
replacement levels. (TFR=1.93 for the district vs. 2.1 for replacement level)
2. Most of the in-migration to the district occurs in the 0-4 and 25-to-39 year old
age groups.
3. The locally born 18-to-24 year old population continues to leave the district,
going to college or moving to other urban areas.
4. The primary factors causing the districts’ enrollment to increase is the larger pre-
school age cohorts aging into the school system. A secondary factor is the in-
migration of young families ages 25 to 34.
5. Changes in year-to-year total enrollment (particularly until 2021) will primarily be
due to the size of the cohorts entering the school system (grades K and 1) in
relation to the size of the cohorts leaving the system (grade 12).
6. As the existing young families begin to age and smaller grade cohorts begin to
enter into the school system, total enrollment will begin to stabilize after 2021.
7. Even if the district continues to have an increasing level new home construction,
the rate and magnitude of existing home sales will become the increasingly
dominant factor affecting the amount of population and enrollment change.
8. Total enrollment is forecasted to increase by 360 students, or 11.2%, between
2014-15 and 2019-20. Total enrollment will grow by 161 students, or 4.5%, from
2019-20 to 2024-25.
McKibben Demographic Research October 2014 3
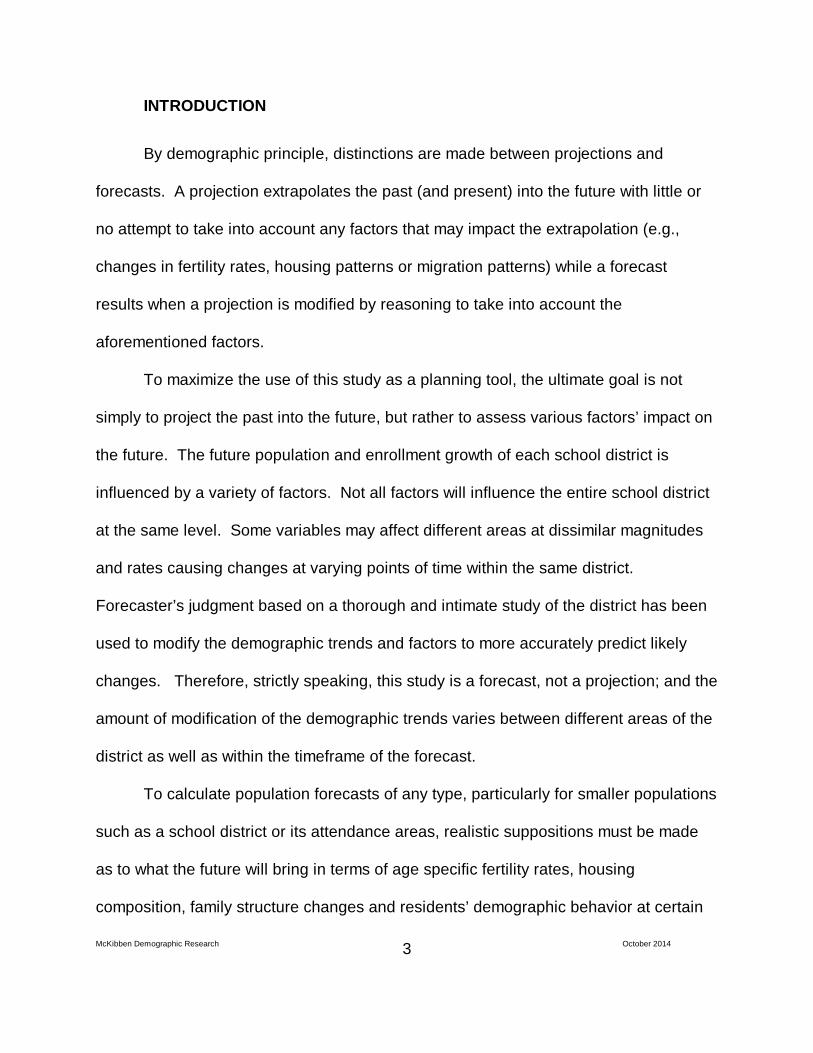
INTRODUCTION
By demographic principle, distinctions are made between projections and
forecasts. A projection extrapolates the past (and present) into the future with little or
no attempt to take into account any factors that may impact the extrapolation (e.g.,
changes in fertility rates, housing patterns or migration patterns) while a forecast
results when a projection is modified by reasoning to take into account the
aforementioned factors.
To maximize the use of this study as a planning tool, the ultimate goal is not
simply to project the past into the future, but rather to assess various factors’ impact on
the future. The future population and enrollment growth of each school district is
influenced by a variety of factors. Not all factors will influence the entire school district
at the same level. Some variables may affect different areas at dissimilar magnitudes
and rates causing changes at varying points of time within the same district.
Forecaster’s judgment based on a thorough and intimate study of the district has been
used to modify the demographic trends and factors to more accurately predict likely
changes. Therefore, strictly speaking, this study is a forecast, not a projection; and the
amount of modification of the demographic trends varies between different areas of the
district as well as within the timeframe of the forecast.
To calculate population forecasts of any type, particularly for smaller populations
such as a school district or its attendance areas, realistic suppositions must be made
as to what the future will bring in terms of age specific fertility rates, housing
composition, family structure changes and residents’ demographic behavior at certain
McKibben Demographic Research October 2014 4
points of the life course. The demographic history of the school district and its interplay
with the social and economic history of the area is the starting point and basis of most
of these suppositions particularly on key factors such as the age structure of the area.
The unique nature of each district's and attendance area’s demographic composition
and rate of change over time must be assessed and understood to be factors
throughout the life of the forecast series. Moreover, no two populations, particularly at
the school district and attendance area level, have exactly the same demographic
characteristics.
The manifest purpose of these forecasts is to ascertain the demographic factors
and their magnitudes that will ultimately influence the enrollment levels in the district’s
schools. There are of course, other non-demographic factors the affect enrollment
levels over time. These factors include, but are not limited to transfer policies within the
district; student transfers to and from neighboring districts; placement of “special
programs” within school facilities that may serve students from outside the attendance
area; state or federal mandates that dictate the movement of students from one facility
to another (No Child Left Behind is an excellent example of this factor); the
development of charter schools in the district; the prevalence of home schooling in the
area; and the dynamics of local private schools.
Unless the district specifically requests the calculation of forecasts that reflect
the effects of changes in these non-demographic factors, their influences are held
constant for the life of the forecasts. Again, the main function of these forecasts is to
determine what impact demographic changes will have on future enrollment. It is quite
McKibben Demographic Research October 2014 5
possible to calculate special “scenario” forecasts to measure the impact and magnitude
of school policy modifications as well as planned economic and financial changes.
However in this case the results of these population and enrollment forecast are meant
to represent the most likely scenario for demographic changes over the next 10 years
in the district and its attendance areas.
The first part of the report will examine the assumptions made in calculating the
10 year population forecasts for the Belgrade Public Schools. Since the results of the
population forecasts drive the subsequent enrollment forecasts, the assumptions listed
in this section are paramount to understanding the area’s demographic dynamics. The
remainder of the report is an explanation and analysis of the district's population
forecasts and how they will shape the district's grade level enrollment forecasts.
DATA
The data used for the forecasts come from a variety of sources. Enrollments by
grade and attendance center were provided by the Belgrade Public Schools for school
years 2008-2009 to 2014-15. Birth and death data were obtained from the Montana
Department of Public Health and Human Services for the years 2000 through 2012.
The net migration values were calculated using Internal Revenue Service migration
reports for the years 2000 through 2011. The data used for the calculation of migration
models came from the United States Bureau of the Census, 2005 to 2010, and the
models were designed using demographic and economic factors. The base age-sex
population counts used are from the results of the 2010 Census.
McKibben Demographic Research October 2014 6
Recently the Census Bureau began releasing annual estimates of demographic
variables at the block group and tract level from the American Community Survey
(ACS). There has been wide scale reporting of these results in the national, state and
local media. However, due to the methodological problems the Census Bureau is
experiencing with their estimates derived from ACS data, particularly in areas with a
population of less than 60,000, the results of the ACS are not used in these forecasts.
For example, given the sampling framework used by the Census Bureau, each year
only 210 of the over 7,300 current households in the district would have been included.
For comparison 1,200 households in the district were included in the sample for the
long form questionnaire in the 2000 Census. As a result of this small sample size, the
ACS survey result from the last 5 years must be aggregated to produce the tract and
block group estimates.
To develop the population forecast models, past migration patterns, current age
specific fertility patterns, the magnitude and dynamics of the gross migration, the age
specific mortality trends, the distribution of the population by age and sex, the rate and
type of existing housing unit sales, and future housing unit construction are considered
to be primary variables. In addition, the change in household size relative to the age
structure of the forecast area was addressed. While there was a drop in the average
household size in Gallatin County as well as most other areas of the state during the
previous 20 years, the rate of this decline has been forecasted to slow over the next ten
years.
McKibben Demographic Research October 2014 7
ASSUMPTIONS
For these forecasts, the mortality probabilities are held constant at the levels
calculated for the year 2010. While the number of deaths in an area are impacted by
and will change given the proportion of the local population over age 65, in the
absence of an extraordinary event such as a natural disaster or a breakthrough in the
treatment of heart disease, death rates rarely move rapidly in any direction, particularly
at the school district or attendance area level. Thus, significant changes are not
foreseen in district’s mortality rates between now and the year 2024. Any increases
forecasted in the number of deaths will be due primarily to the general aging of the
district’s population and specifically to the increase in the number of residents over age
65.
Similarly, fertility rates are assumed to stay fairly constant for the life of the
forecasts. Like mortality rates, age specific fertility rates rarely change quickly or
dramatically, particularly in small areas. Even with the recently reported rise in the
fertility rates of the United States, overall fertility rates have stayed within a 10% range
for most of the last 40 years. In fact, the vast majority of year to year change in an
area’s number of births is due to changes in the number of women in child bearing
ages (particularly ages 20-34) rather than any fluctuation in an area’s fertility rate.
The total fertility rate (TFR), the average number of births a woman will have in
her lifetime, is estimated to be 1.93 for the total district for the ten years of the
population forecasts. A TFR of 2.1 births per woman is considered to be the theoretical
“replacement level” of fertility necessary for a population to remain constant in the
McKibben Demographic Research October 2014 8
absence of in-migration. Therefore, over the course of the forecast period, fertility will
not be sufficient, in the absence of net in migration, to maintain the current level of
population within the Belgrade Public Schools.
A close examination of data for Belgrade Public Schools has shown the age
specific pattern of net migration will be nearly constant throughout the life of the
forecasts. While the number of in and out migrants has changed in past years for
Belgrade Public Schools (and will change again over the next 10 years), the basic age
pattern of the migrants has stayed nearly the same over the last 40 years. Based on
the analysis of data it is safe to assume this age specific migration trend will remain
unchanged into the future. This pattern of migration shows high out-migration
occurring in the locally born 18-to-24 year old age group as young adults leave the
area to go to college or move to other urban areas. The second group of out-migrants
is those householders aged 70 and older who are downsizing their residences. Most of
the local in-migration occurs in the 25-39 age groups (bulk of which is from areas within
100 miles of the city of Belgrade) primarily consisting of younger adults.
As the city of Belgrade is not currently contemplating any major expansions or
contractions, the forecasts also assume the current economic, political, transportation
and public works infrastructure (with a few notable exceptions), social, and
environmental factors of Belgrade Public Schools and its attendance areas will remain
the same through the year 2024.
Below is a list of assumptions and issues that are specific to the city of Belgrade
and Belgrade Public Schools. These issues have been used to modify the population

McKibben Demographic Research October 2014 9
forecast models to more accurately predict the impact of these factors on each area’s
population change. Specifically, the forecasts for Belgrade Public Schools assume that
throughout the study period:
a. There will be no short term economic recovery in the next 18 months and the
national, state or regional economy does not go into deep recession at anytime
during the 10 years of the forecasts; (Deep recession is defined as four
consecutive quarters where the GDP contracts greater than 1% per quarter)
b. Interest rates have reached an historic low and will not fluctuate more than one
percentage point in the short term; the interest rate for a 30 year fixed home
mortgage stays below 5.5%;
c. The rate of mortgage approval stays at 1999-2002 levels and lenders do not
return to “sub-prime” mortgage practices;
d. There are no additional restrictions placed on home mortgage lenders or
additional bankruptcies of major credit providers;
e. The rate of housing foreclosures does not exceed 125% of the 2005-2007
average of Gallatin County for any year in the forecasts;
f. All currently planned, platted, and approved housing developments are built out
and completed by 2023. All housing units constructed are occupied by 2024;
g. The unemployment rates for Gallatin County will remain below 4.5% for the 10

McKibben Demographic Research October 2014 10
years of the forecasts;
h. The rate of students transferring into and out of Belgrade Public Schools will
remain at the 2008-09 to 2014-15 average;
i. The inflation rate for gasoline will stay below 5% per year for the 10 years of the
forecasts;
j. There will be no building moratorium within the district;
k. Businesses within the district and Gallatin County will remain viable;
l. The number of existing home sales in the district that are a result of “distress
sales” (homes worth less than the current mortgage value) will not exceed 20%
of total homes sales in the district for any given year;
m. Housing turnover rates (sale of existing homes in the district) will remain at their
current levels. The majority of existing home sales are made by home owners
over the age of 55;
n. Private school and home school attendance rates will remain constant;
o. The recent decline in new home construction has ended and building rates have
stabilized;
p. The rate of foreclosures for commercial property remains at the 2004-2007
average for Gallatin County;
If a major employer in the district or in the Greater Gallatin County area closes,
reduces or expands its operations, the population forecasts would need to be adjusted
McKibben Demographic Research October 2014 11
to reflect the changes brought about by the change in economic and employment
conditions. The same holds true for any type of natural disaster, major change in the
local infrastructure (e.g., highway construction, water and sewer expansion, changes in
zoning regulations etc.), a further economic downturn, any additional weakness in the
housing market or any instance or situation that causes rapid and dramatic population
changes that could not be foreseen at the time the forecasts were calculated.
The high proportion of high school graduates from Belgrade Public Schools that
attend college or move to urban areas outside of the district for employment is a
significant demographic factor. Their departure is a major reason for the extremely
high out-migration in the locally born18-to-24 age group and was taken into account
when calculating these forecasts. The out-migration of graduating high school seniors
is expected to continue over the period of the forecasts and the rate of out-migration
has been forecasted to remain the same over the life of the forecast series. Given that
the district will have progressively larger graduation classes over the next 10 years,
(the classes of 2023 and 2024 should be approximately 10% larger than the 12th grade
class of the 2014-15 school year) the number of out migrants the district will increase.
Finally, all demographic trends (i.e., births, deaths, and migration) are assumed
to be linear in nature and annualized over the forecast period. For example, if 1,000
births are forecasted for a 5-year period, an equal number, or proportion of the births
are assumed to occur every year, 200 per year. Actual year-to-year variations do and
will occur, but overall year to year trends are expected to be constant.
McKibben Demographic Research October 2014 12
METHODOLOGY
The population forecasts presented in this report are the result of using the
Cohort-Component Method of population forecasting (Siegel, and Swanson, 2004: 561-
601) (Smith et. al. 2004). As stated in the INTRODUCTION, the difference between a
projection and a forecast is in the use of explicit judgment based upon the unique
features of the area under study. Strictly speaking, a cohort projection refers to the
future population that would result if a mathematical extrapolation of historical trends.
Conversely, a cohort-component forecast refers to the future population that is
expected because of a studied and purposeful selection of the components of change
(i.e., births, deaths, and migration) and forecast models are developed to measure the
impact of these changes in each specific geographic area.
Five sets of data are required to generate population and enrollment forecasts.
These five data sets are:
a. a base-year population (here, the 2010 Census population for Belgrade Public Schools and its attendance areas);
b. a set of age-specific fertility rates for each attendance area to be used over
the forecast period; c. a set of age-specific survival (mortality) rates for each attendance area;
d. a set of age-specific migration rates for each attendance area; and
e. the historical enrollment figures by grade.
The most significant and difficult aspect of producing enrollment forecasts is the
generation of the population forecasts in which the school age population (and
McKibben Demographic Research October 2014 13
enrollment) is embedded. In turn, the most challenging aspect of generating the
population forecasts is found in deriving the rates of change in fertility, mortality, and
migration. From the standpoint of demographic analysis, Belgrade Public Schools and
its three elementary attendance center districts are classified as “small area”
populations (as compared to the population of the state of Montana or to that of the
United States). Small area population forecasts are more complicated to calculate
because local variations in fertility, mortality, and migration may be more irregular than
those at the regional, state or national scale. Especially challenging is the forecast of
the migration rates for local areas, because changes in the area's socioeconomic
characteristics can quickly change from past and current patterns (Peters and Larkin,
2002.)
The population forecasts for Belgrade Public Schools and it attendance areas
were calculated using a cohort-component method with the populations divided into
male and female groups by five-year age cohorts that range from 0-to-4 years of age to
85 years of age and older (85+). Age- and sex-specific fertility, mortality, and migration
models were constructed to specifically reflect the unique demographic characteristics
of each of Belgrade Public Schools attendance areas as well as the total school district.
The enrollment forecasts were calculated using a modified average survivorship
method. Average survivor rates (i.e., the proportion of students who progress from one
grade level to the next given the average amount of net migration for that grade level)
over the previous five years of year-to-year enrollment data were calculated for grades
McKibben Demographic Research October 2014 14
two through twelve. This procedure is used to identify specific grades where there are
large numbers of students changing facilities for non-demographic factors, such as
private school transfers or enrollment in special programs.
The survivorship rates were modified or adjusted to reflect the average rate of
forecasted in and out migration of 5-to-9, 10-to-14 and 15-to-17 year old cohorts to
each of the attendance centers in Belgrade Public Schools for the period 2005 to 2010.
These survivorship rates then were adjusted to reflect the forecasted changes in age-
specific migration the district should experience over the next five years. These
modified survivorship rates were used to project the enrollment of grades 2 through 12
for the period 2010 to 2015. The survivorship rates were adjusted again for the period
2015 to 2020 to reflect the predicted changes in the amount of age-specific migration in
the districts for the period.
The forecasted enrollments for kindergarten and first grade are derived from the
5-to-9 year old population of the age-sex population forecast at the elementary
attendance center district level. This procedure allows the changes in the incoming
grade sizes to be factors of forecasted population change and not an extrapolation of
previous class sizes. Given the potentially large amount of variation in Kindergarten
enrollment due to parental choice, changes in the state's minimum age requirement,
and differing district policies on allowing children to start Kindergarten early, first grade
enrollment is deemed to be a more accurate and reliable starting point for the
forecasts. (McKibben, 1996) The level of the accuracy for both the population and
McKibben Demographic Research October 2014 15
enrollment forecasts at the school district level is estimated to be +2.0% for the life of
the forecasts.
McKibben Demographic Research October 2014 16
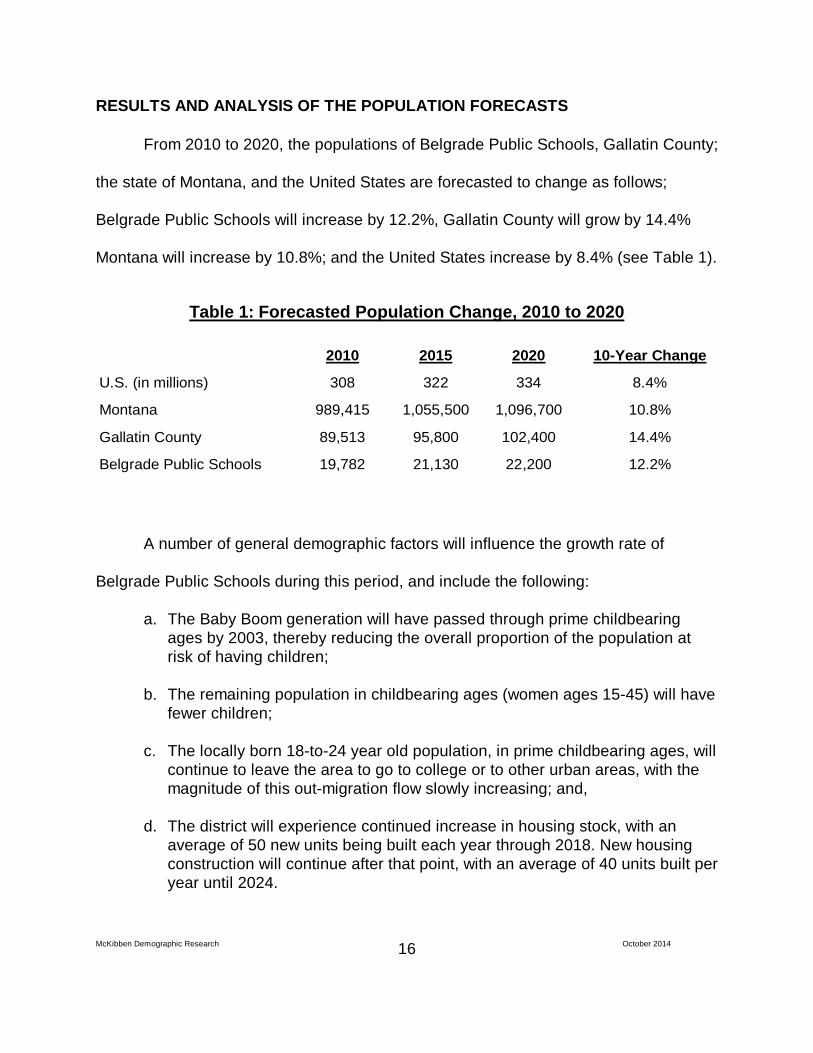
RESULTS AND ANALYSIS OF THE POPULATION FORECASTS
From 2010 to 2020, the populations of Belgrade Public Schools, Gallatin County;
the state of Montana, and the United States are forecasted to change as follows;
Belgrade Public Schools will increase by 12.2%, Gallatin County will grow by 14.4%
Montana will increase by 10.8%; and the United States increase by 8.4% (see Table 1).
Table 1: Forecasted Population Change, 2010 to 2020
2010 2015 2020 10-Year Change
U.S. (in millions) 308 322 334 8.4%
Montana 989,415 1,055,500 1,096,700 10.8%
Gallatin County 89,513 95,800 102,400 14.4%
Belgrade Public Schools 19,782 21,130 22,200 12.2%
A number of general demographic factors will influence the growth rate of
Belgrade Public Schools during this period, and include the following:
a. The Baby Boom generation will have passed through prime childbearing ages by 2003, thereby reducing the overall proportion of the population at risk of having children;
b. The remaining population in childbearing ages (women ages 15-45) will have
fewer children;
c. The locally born 18-to-24 year old population, in prime childbearing ages, will continue to leave the area to go to college or to other urban areas, with the magnitude of this out-migration flow slowly increasing; and,
d. The district will experience continued increase in housing stock, with an
average of 50 new units being built each year through 2018. New housing construction will continue after that point, with an average of 40 units built per year until 2024.
McKibben Demographic Research October 2014 17
Belgrade Public Schools will continue to experience significant in-migration
(movement of new young families into the district) over the next 10 years. However,
the size and age structure of the pool of potential in-migrants will change and the
effects of the in-migration of families on population growth will be greatly offset by the
continued steady growing out-migration of young adults as graduating seniors continue
to leave the district.
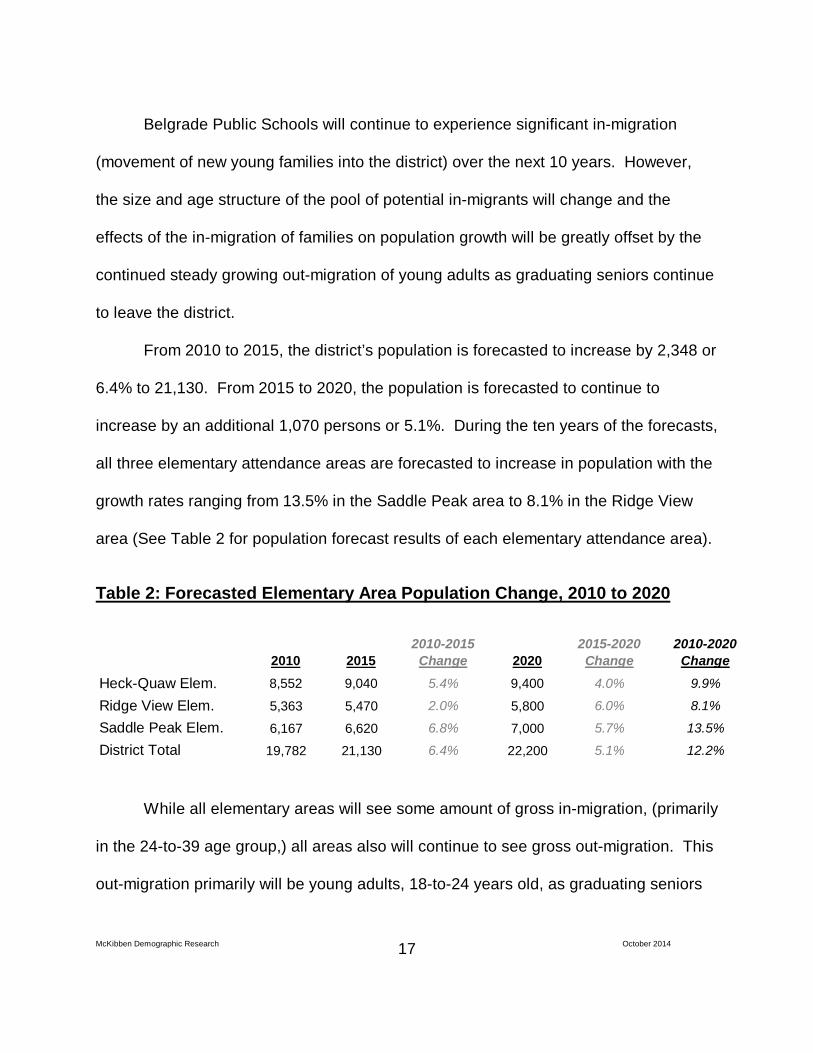
From 2010 to 2015, the district’s population is forecasted to increase by 2,348 or
6.4% to 21,130. From 2015 to 2020, the population is forecasted to continue to
increase by an additional 1,070 persons or 5.1%. During the ten years of the forecasts,
all three elementary attendance areas are forecasted to increase in population with the
growth rates ranging from 13.5% in the Saddle Peak area to 8.1% in the Ridge View
area (See Table 2 for population forecast results of each elementary attendance area).
Table 2: Forecasted Elementary Area Population Change, 2010 to 2020
2010 20152010-2015 Change 2020
2015-2020 Change
2010-2020 Change
Heck-Quaw Elem. 8,552 9,040 5.4% 9,400 4.0% 9.9%
Ridge View Elem. 5,363 5,470 2.0% 5,800 6.0% 8.1%
Saddle Peak Elem. 6,167 6,620 6.8% 7,000 5.7% 13.5%
District Total 19,782 21,130 6.4% 22,200 5.1% 12.2%
While all elementary areas will see some amount of gross in-migration, (primarily
in the 24-to-39 age group,) all areas also will continue to see gross out-migration. This
out-migration primarily will be young adults, 18-to-24 years old, as graduating seniors
McKibben Demographic Research October 2014 18
continue to leave the district to go to college or seek employment in larger urban areas.
Consequently, most of the attendance areas will experience a modest reduction in their
average household size.
As stated in the ASSUMPTIONS and emphasized above, the impact of the high
proportion of high school graduates that leave the district to continue on to college or to
seek employment in large urban areas is significant to the size and structure of the
future population of the district. Up to 70% of all births occur to women between the
ages of 20 and 29. As the graduating seniors continue leave the district, the number of
women at risk of childbirth during the next decade declines. Consequently, even though
the district’s fertility rate is slightly below the replacement level, the relatively small
number of non-college women in the district ages 20-29 will keep the number of births
declining at a modest rate despite the district having a growing population (see the
population pyramids in the appendix of this report for a graphic representation of the
age distributions of the district and all of the attendance areas).
As a general rule of thumb, for every two seniors that leave the district, one new
household must move into the district to replace the young adults that have left and to
replace their lost potential fertility. Over the course of the forecast period, the average
number of graduating seniors will be approximately 213 per year and at least 75% of
them will move out of the district within three years of graduation. Using the general
rule, approximately 75 new families will be required to move into the district every year
or 750 new families for the ten-year study period to replace the graduating seniors and
their lost fertility. It is forecasted that the impact of the steadily increasing out-migration
McKibben Demographic Research October 2014 19
of young adults will continue to be mostly offset by young family in-migration and that
the total number of births will continue to slightly decline throughout the forecast period.
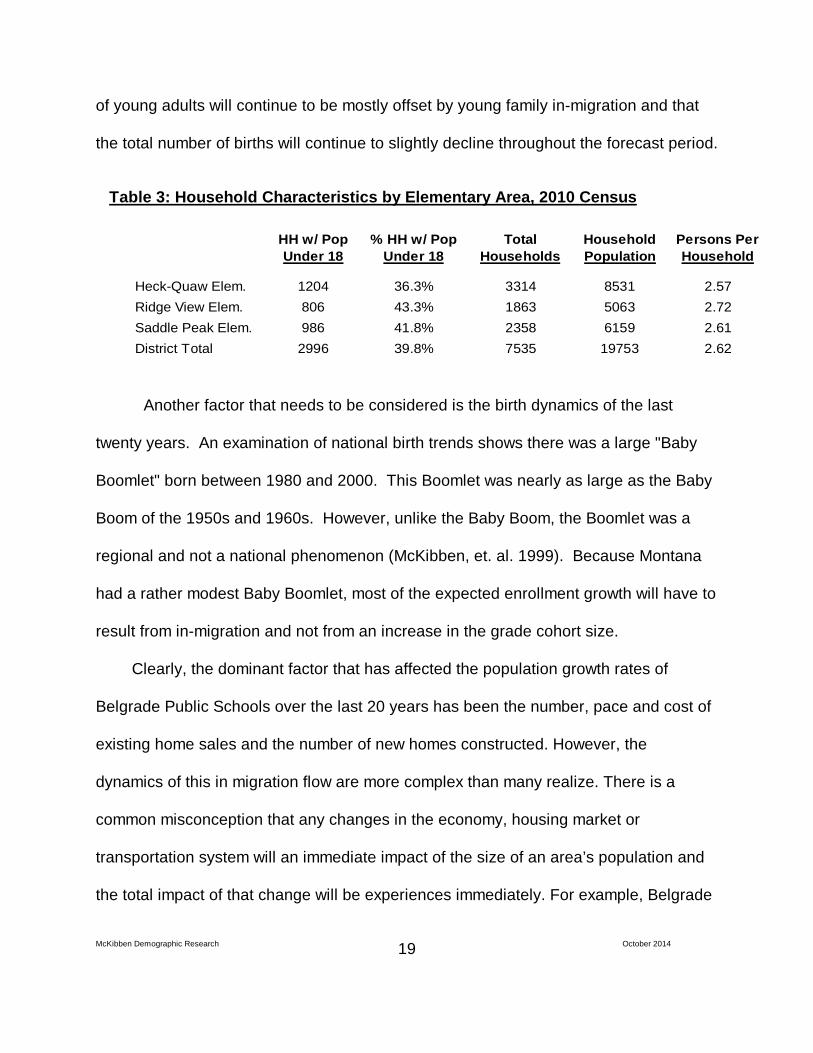
Table 3: Household Characteristics by Elementary Area, 2010 Census
HH w/ Pop Under 18
% HH w/ Pop Under 18
Total Households
Household Population
Persons Per Household
Heck-Quaw Elem. 1204 36.3% 3314 8531 2.57Ridge View Elem. 806 43.3% 1863 5063 2.72Saddle Peak Elem. 986 41.8% 2358 6159 2.61District Total 2996 39.8% 7535 19753 2.62
Another factor that needs to be considered is the birth dynamics of the last
twenty years. An examination of national birth trends shows there was a large "Baby
Boomlet" born between 1980 and 2000. This Boomlet was nearly as large as the Baby
Boom of the 1950s and 1960s. However, unlike the Baby Boom, the Boomlet was a
regional and not a national phenomenon (McKibben, et. al. 1999). Because Montana
had a rather modest Baby Boomlet, most of the expected enrollment growth will have to
result from in-migration and not from an increase in the grade cohort size.
Clearly, the dominant factor that has affected the population growth rates of
Belgrade Public Schools over the last 20 years has been the number, pace and cost of
existing home sales and the number of new homes constructed. However, the
dynamics of this in migration flow are more complex than many realize. There is a
common misconception that any changes in the economy, housing market or
transportation system will an immediate impact of the size of an area’s population and
the total impact of that change will be experiences immediately. For example, Belgrade
McKibben Demographic Research October 2014 20
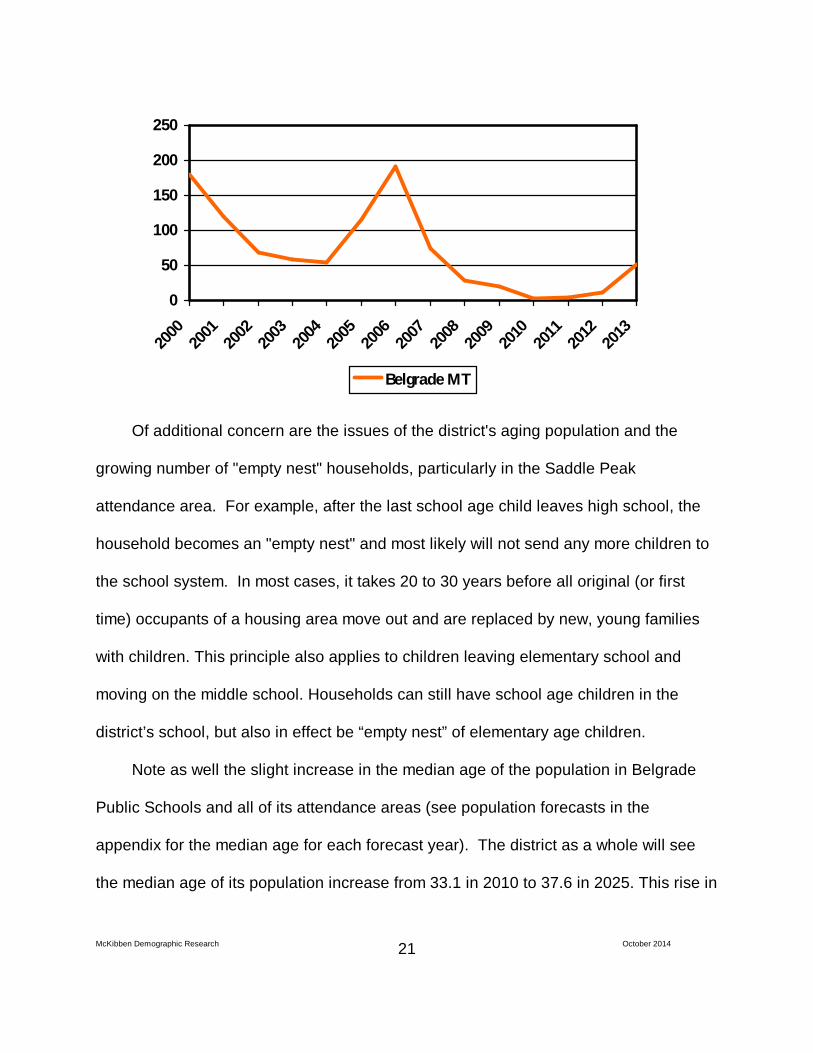
Public Schools had been experiencing an average of approximately 100 new housing
units constructed per year from 2000 to 2007. From 2008 to 2013 the district has been
averaging about 30 new housing units per year. There has been a similar percentage
decline in the number of existing home sales over these two periods as well.
This “delayed demographic reaction” is a key issue when attempting to ascertain
the impact and duration of a trend. While it is true that the households moving into
these new housing units bring many school age (particularly elementary) children into
the district, they also bring many preschool age children as well. Consequently, the full
impact of the growth in existing home sales and new home construction is not seen
immediately in elementary enrollment as it takes three to seven years for all of the
children to age into the schools. This is a key issue since the number of births in
Belgrade Public Schools is insufficient to maintain current enrollment levels.
Chart 1: Residential Building Permits, Belgrade MT, 2000 to 2013
McKibben Demographic Research October 2014 21
0
50
100
150
200
250
20002001
20022003
20042005
20062007
20082009
20102011
20122013
Belgrade MT
Of additional concern are the issues of the district's aging population and the
growing number of "empty nest" households, particularly in the Saddle Peak
attendance area. For example, after the last school age child leaves high school, the
household becomes an "empty nest" and most likely will not send any more children to
the school system. In most cases, it takes 20 to 30 years before all original (or first
time) occupants of a housing area move out and are replaced by new, young families
with children. This principle also applies to children leaving elementary school and
moving on the middle school. Households can still have school age children in the
district’s school, but also in effect be “empty nest” of elementary age children.
Note as well the slight increase in the median age of the population in Belgrade
Public Schools and all of its attendance areas (see population forecasts in the
appendix for the median age for each forecast year). The district as a whole will see
the median age of its population increase from 33.1 in 2010 to 37.6 in 2025. This rise in
McKibben Demographic Research October 2014 22
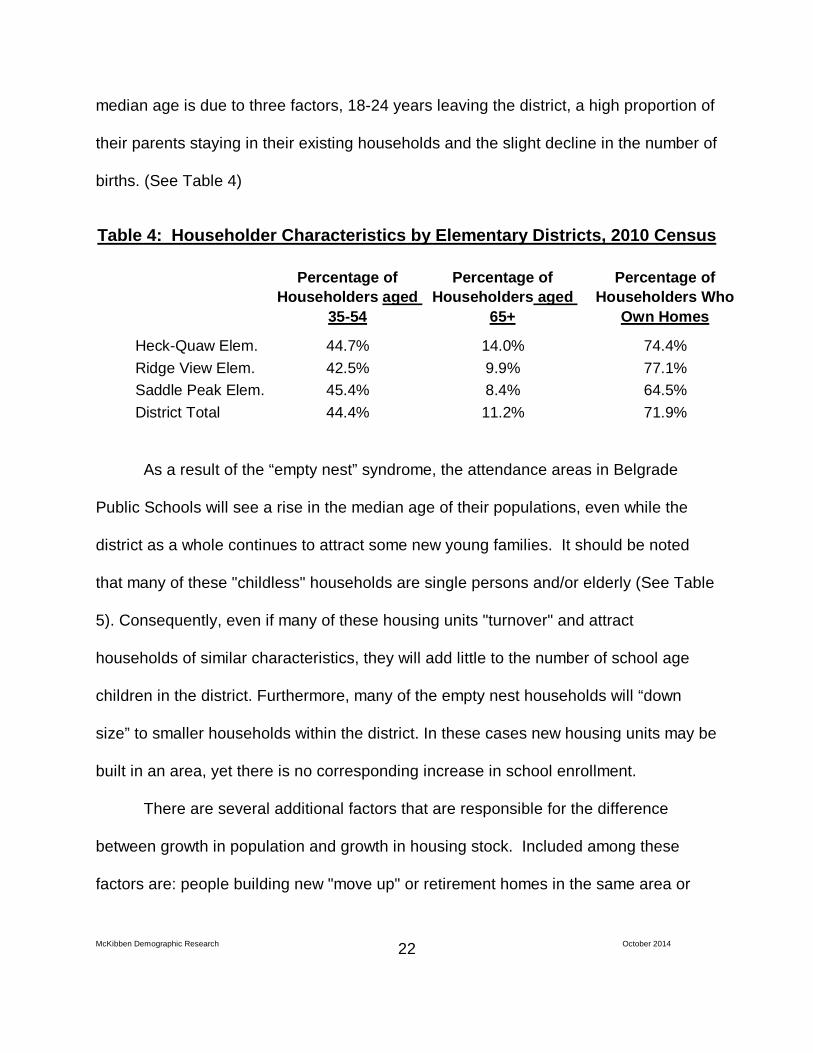
median age is due to three factors, 18-24 years leaving the district, a high proportion of
their parents staying in their existing households and the slight decline in the number of
births. (See Table 4)
Table 4: Householder Characteristics by Elementary Districts, 2010 Census
Percentage of Householders aged
35-54
Percentage of Householders aged
65+
Percentage of Householders Who
Own Homes
Heck-Quaw Elem. 44.7% 14.0% 74.4%Ridge View Elem. 42.5% 9.9% 77.1%Saddle Peak Elem. 45.4% 8.4% 64.5%District Total 44.4% 11.2% 71.9%
As a result of the “empty nest” syndrome, the attendance areas in Belgrade
Public Schools will see a rise in the median age of their populations, even while the
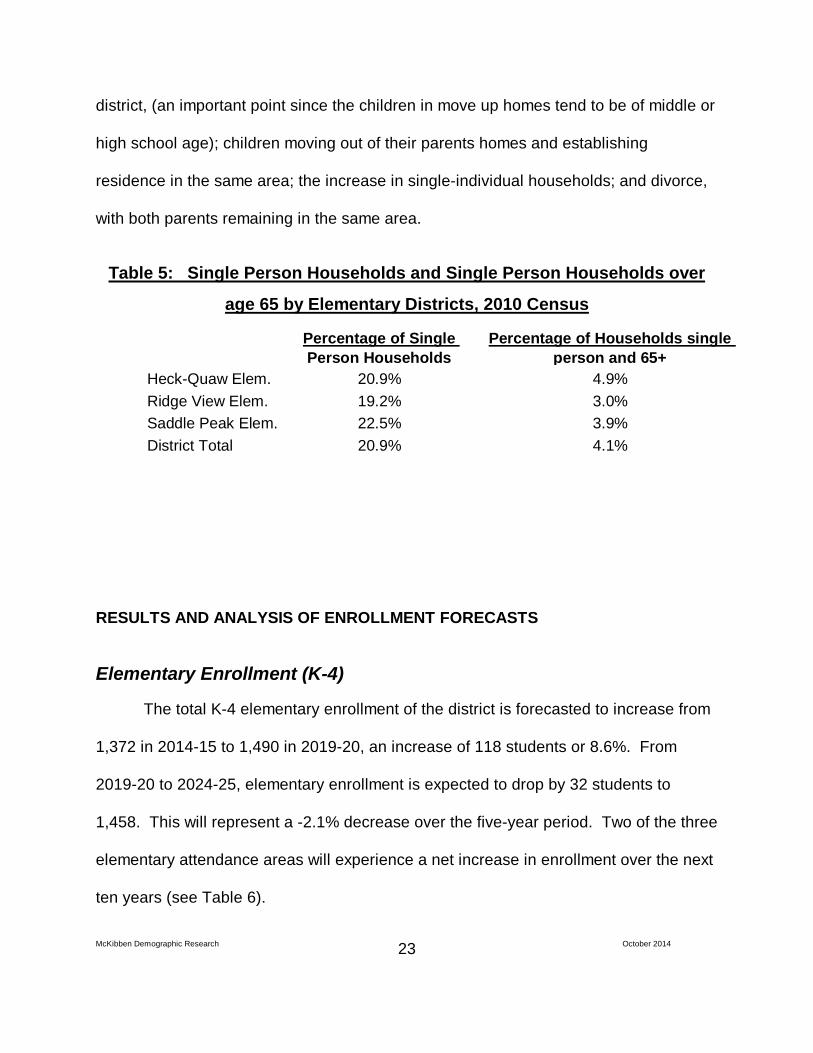
district as a whole continues to attract some new young families. It should be noted
that many of these "childless" households are single persons and/or elderly (See Table
5). Consequently, even if many of these housing units "turnover" and attract
households of similar characteristics, they will add little to the number of school age
children in the district. Furthermore, many of the empty nest households will “down
size” to smaller households within the district. In these cases new housing units may be
built in an area, yet there is no corresponding increase in school enrollment.
There are several additional factors that are responsible for the difference
between growth in population and growth in housing stock. Included among these
factors are: people building new "move up" or retirement homes in the same area or
McKibben Demographic Research October 2014 23
district, (an important point since the children in move up homes tend to be of middle or
high school age); children moving out of their parents homes and establishing
residence in the same area; the increase in single-individual households; and divorce,
with both parents remaining in the same area.
Table 5: Single Person Households and Single Person Households over
age 65 by Elementary Districts, 2010 Census
Percentage of Single Person Households
Percentage of Households single person and 65+
Heck-Quaw Elem. 20.9% 4.9%Ridge View Elem. 19.2% 3.0%Saddle Peak Elem. 22.5% 3.9%District Total 20.9% 4.1%
RESULTS AND ANALYSIS OF ENROLLMENT FORECASTS
Elementary Enrollment (K-4)
The total K-4 elementary enrollment of the district is forecasted to increase from
1,372 in 2014-15 to 1,490 in 2019-20, an increase of 118 students or 8.6%. From
2019-20 to 2024-25, elementary enrollment is expected to drop by 32 students to
1,458. This will represent a -2.1% decrease over the five-year period. Two of the three
elementary attendance areas will experience a net increase in enrollment over the next
ten years (see Table 6).
McKibben Demographic Research October 2014 24
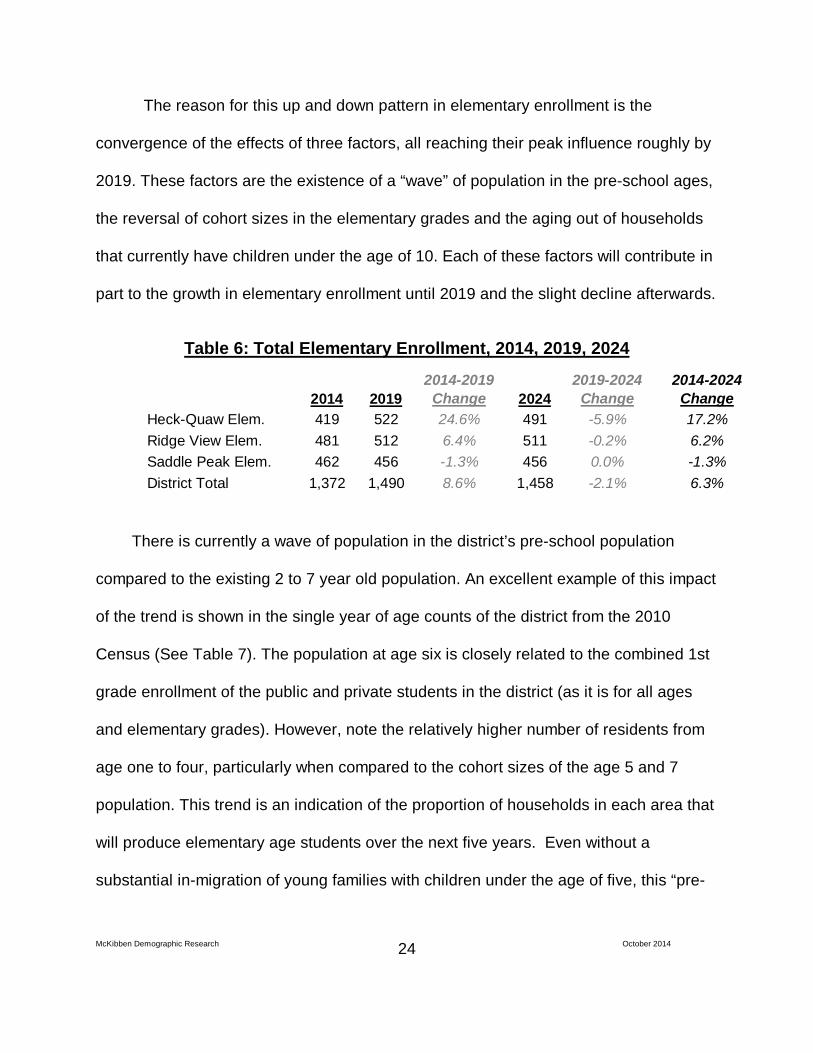
The reason for this up and down pattern in elementary enrollment is the
convergence of the effects of three factors, all reaching their peak influence roughly by
2019. These factors are the existence of a “wave” of population in the pre-school ages,
the reversal of cohort sizes in the elementary grades and the aging out of households
that currently have children under the age of 10. Each of these factors will contribute in
part to the growth in elementary enrollment until 2019 and the slight decline afterwards.
Table 6: Total Elementary Enrollment, 2014, 2019, 2024
2014 20192014-2019
Change 20242019-2024
Change2014-2024
ChangeHeck-Quaw Elem. 419 522 24.6% 491 -5.9% 17.2%Ridge View Elem. 481 512 6.4% 511 -0.2% 6.2%Saddle Peak Elem. 462 456 -1.3% 456 0.0% -1.3%District Total 1,372 1,490 8.6% 1,458 -2.1% 6.3%
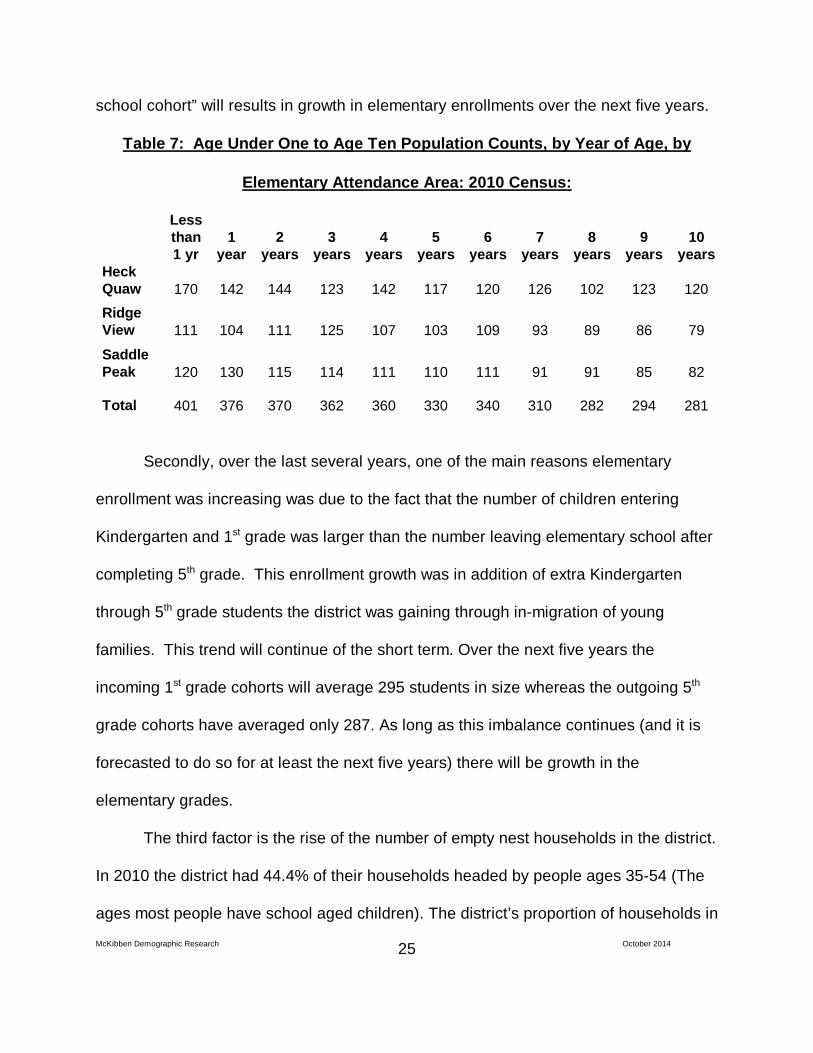
There is currently a wave of population in the district’s pre-school population
compared to the existing 2 to 7 year old population. An excellent example of this impact
of the trend is shown in the single year of age counts of the district from the 2010
Census (See Table 7). The population at age six is closely related to the combined 1st
grade enrollment of the public and private students in the district (as it is for all ages
and elementary grades). However, note the relatively higher number of residents from
age one to four, particularly when compared to the cohort sizes of the age 5 and 7
population. This trend is an indication of the proportion of households in each area that
will produce elementary age students over the next five years. Even without a
substantial in-migration of young families with children under the age of five, this “pre-
McKibben Demographic Research October 2014 25
school cohort” will results in growth in elementary enrollments over the next five years.
Table 7: Age Under One to Age Ten Population Counts, by Year of Age, by
Elementary Attendance Area: 2010 Census:
Less than 1 yr
1 year
2 years
3 years
4 years
5 years
6 years
7 years
8 years
9 years
10 years
Heck Quaw 170 142 144 123 142 117 120 126 102 123 120 Ridge View 111 104 111 125 107 103 109 93 89 86 79
Saddle Peak 120 130 115 114 111 110 111 91 91 85 82
Total 401 376 370 362 360 330 340 310 282 294 281
Secondly, over the last several years, one of the main reasons elementary
enrollment was increasing was due to the fact that the number of children entering
Kindergarten and 1st grade was larger than the number leaving elementary school after
completing 5th grade. This enrollment growth was in addition of extra Kindergarten
through 5th grade students the district was gaining through in-migration of young
families. This trend will continue of the short term. Over the next five years the
incoming 1st grade cohorts will average 295 students in size whereas the outgoing 5th
grade cohorts have averaged only 287. As long as this imbalance continues (and it is
forecasted to do so for at least the next five years) there will be growth in the
elementary grades.
The third factor is the rise of the number of empty nest households in the district.
In 2010 the district had 44.4% of their households headed by people ages 35-54 (The
ages most people have school aged children). The district’s proportion of households in
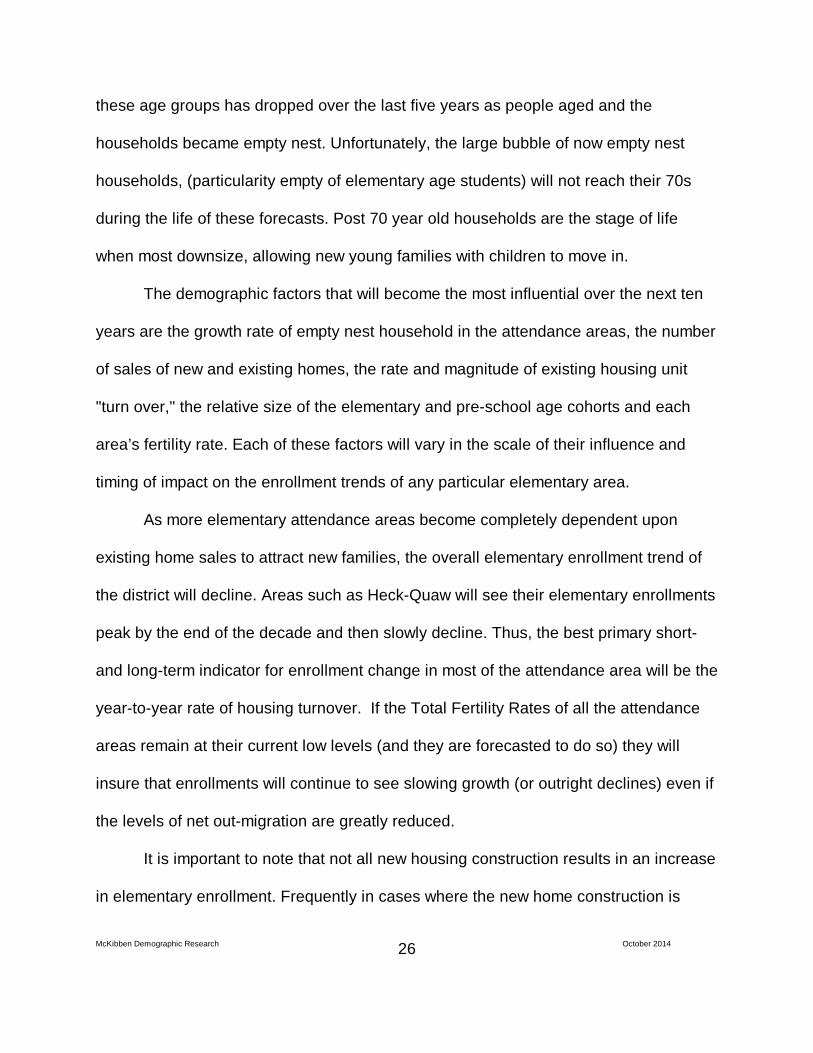
McKibben Demographic Research October 2014 26
these age groups has dropped over the last five years as people aged and the
households became empty nest. Unfortunately, the large bubble of now empty nest
households, (particularity empty of elementary age students) will not reach their 70s
during the life of these forecasts. Post 70 year old households are the stage of life
when most downsize, allowing new young families with children to move in.
The demographic factors that will become the most influential over the next ten
years are the growth rate of empty nest household in the attendance areas, the number
of sales of new and existing homes, the rate and magnitude of existing housing unit
"turn over," the relative size of the elementary and pre-school age cohorts and each
area’s fertility rate. Each of these factors will vary in the scale of their influence and
timing of impact on the enrollment trends of any particular elementary area.
As more elementary attendance areas become completely dependent upon
existing home sales to attract new families, the overall elementary enrollment trend of
the district will decline. Areas such as Heck-Quaw will see their elementary enrollments
peak by the end of the decade and then slowly decline. Thus, the best primary short-
and long-term indicator for enrollment change in most of the attendance area will be the
year-to-year rate of housing turnover. If the Total Fertility Rates of all the attendance
areas remain at their current low levels (and they are forecasted to do so) they will
insure that enrollments will continue to see slowing growth (or outright declines) even if
the levels of net out-migration are greatly reduced.
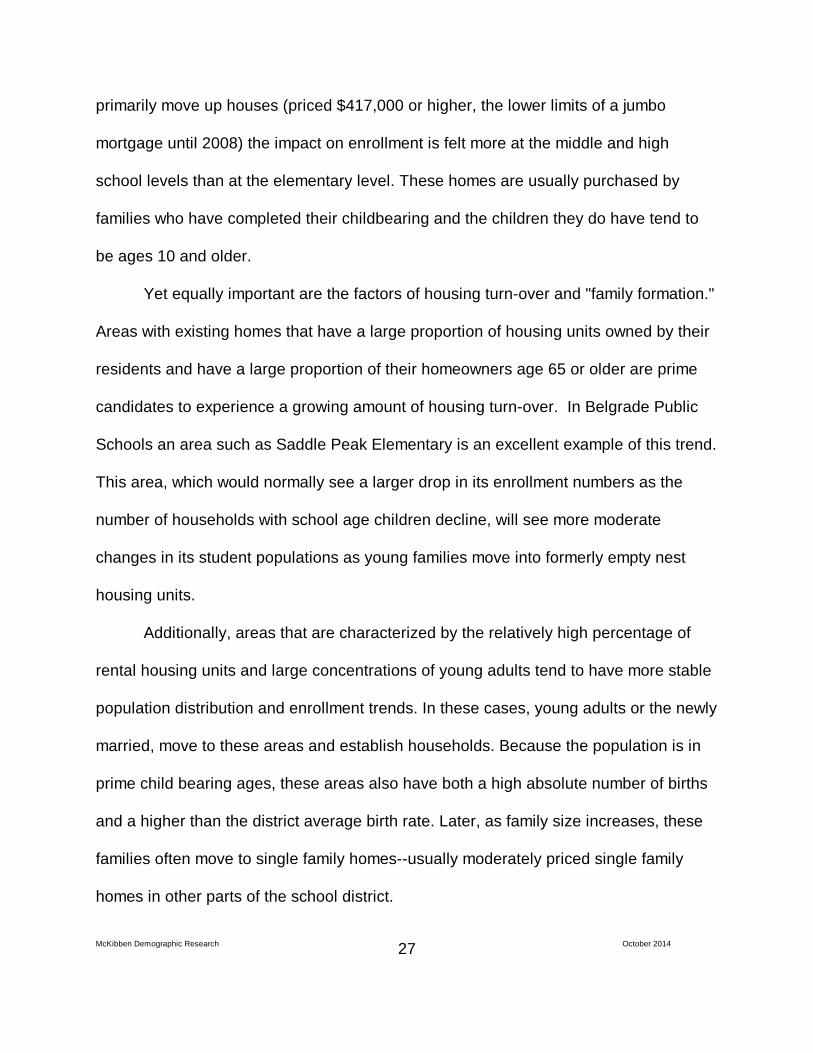
It is important to note that not all new housing construction results in an increase
in elementary enrollment. Frequently in cases where the new home construction is
McKibben Demographic Research October 2014 27
primarily move up houses (priced $417,000 or higher, the lower limits of a jumbo
mortgage until 2008) the impact on enrollment is felt more at the middle and high
school levels than at the elementary level. These homes are usually purchased by
families who have completed their childbearing and the children they do have tend to
be ages 10 and older.
Yet equally important are the factors of housing turn-over and "family formation."
Areas with existing homes that have a large proportion of housing units owned by their
residents and have a large proportion of their homeowners age 65 or older are prime
candidates to experience a growing amount of housing turn-over. In Belgrade Public
Schools an area such as Saddle Peak Elementary is an excellent example of this trend.
This area, which would normally see a larger drop in its enrollment numbers as the
number of households with school age children decline, will see more moderate
changes in its student populations as young families move into formerly empty nest
housing units.
Additionally, areas that are characterized by the relatively high percentage of
rental housing units and large concentrations of young adults tend to have more stable
population distribution and enrollment trends. In these cases, young adults or the newly
married, move to these areas and establish households. Because the population is in
prime child bearing ages, these areas also have both a high absolute number of births
and a higher than the district average birth rate. Later, as family size increases, these
families often move to single family homes--usually moderately priced single family
homes in other parts of the school district.
McKibben Demographic Research October 2014 28
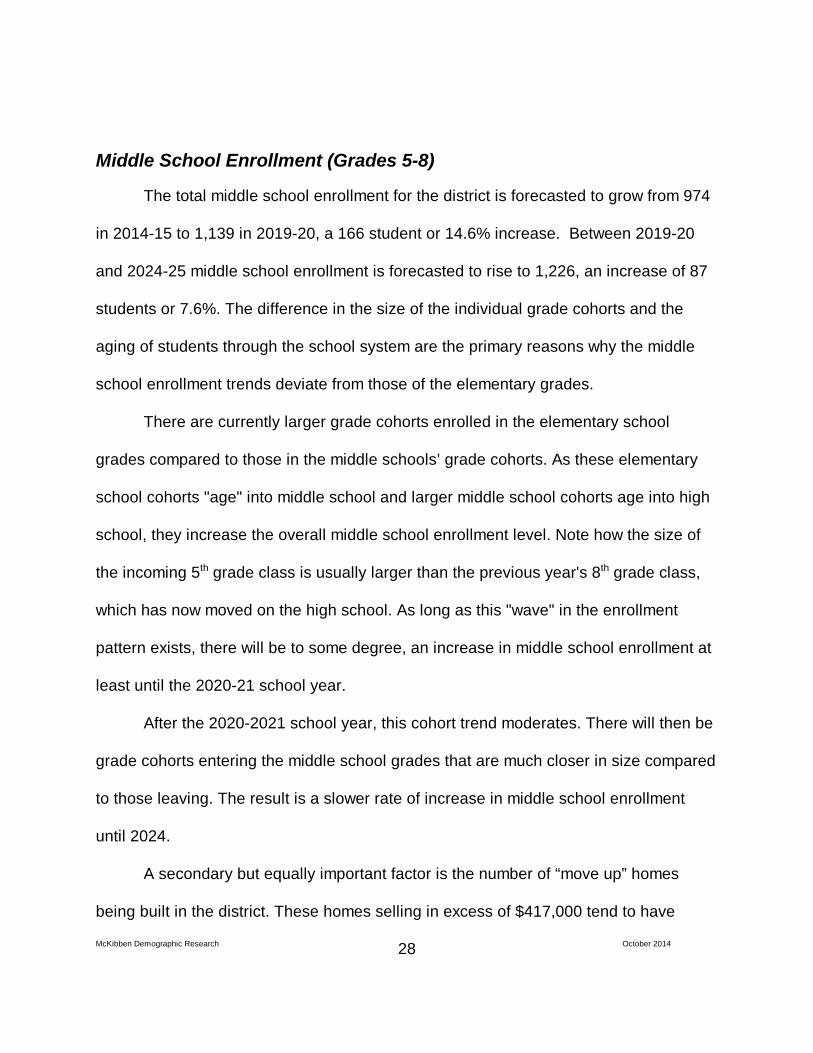
Middle School Enrollment (Grades 5-8)
The total middle school enrollment for the district is forecasted to grow from 974
in 2014-15 to 1,139 in 2019-20, a 166 student or 14.6% increase. Between 2019-20
and 2024-25 middle school enrollment is forecasted to rise to 1,226, an increase of 87
students or 7.6%. The difference in the size of the individual grade cohorts and the
aging of students through the school system are the primary reasons why the middle
school enrollment trends deviate from those of the elementary grades.
There are currently larger grade cohorts enrolled in the elementary school
grades compared to those in the middle schools’ grade cohorts. As these elementary
school cohorts "age" into middle school and larger middle school cohorts age into high
school, they increase the overall middle school enrollment level. Note how the size of
the incoming 5th grade class is usually larger than the previous year's 8th grade class,
which has now moved on the high school. As long as this "wave" in the enrollment
pattern exists, there will be to some degree, an increase in middle school enrollment at
least until the 2020-21 school year.
After the 2020-2021 school year, this cohort trend moderates. There will then be
grade cohorts entering the middle school grades that are much closer in size compared
to those leaving. The result is a slower rate of increase in middle school enrollment
until 2024.
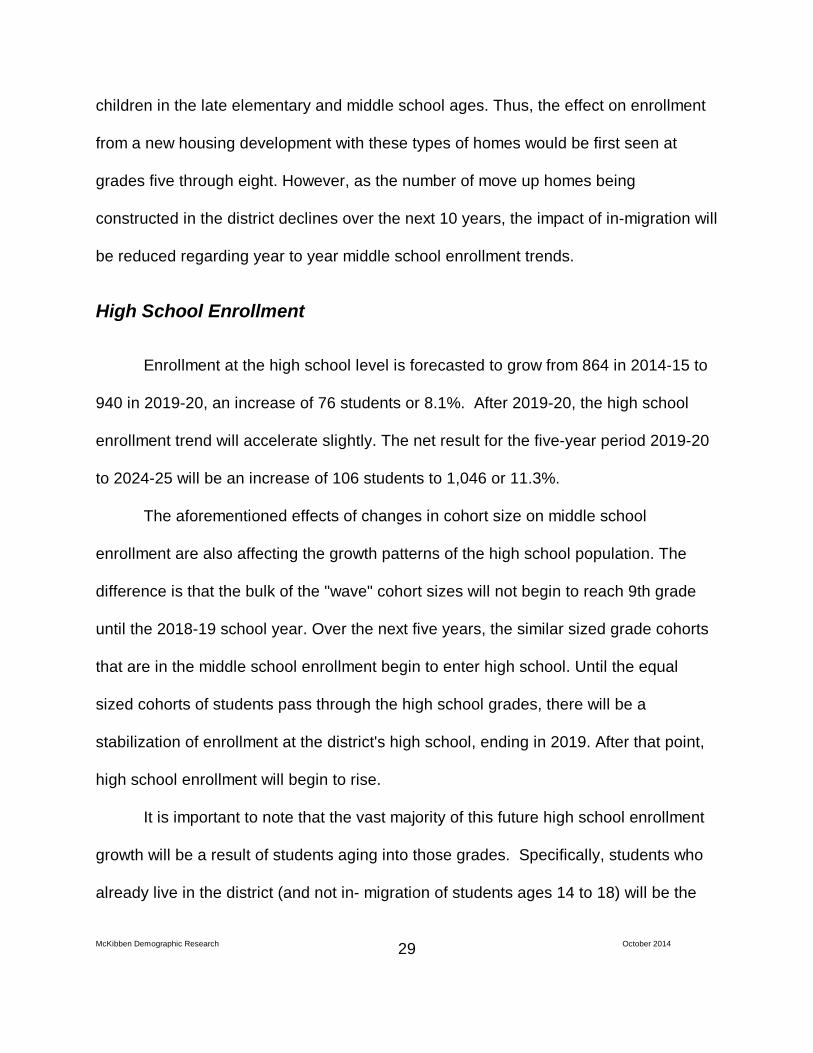
A secondary but equally important factor is the number of “move up” homes
being built in the district. These homes selling in excess of $417,000 tend to have
McKibben Demographic Research October 2014 29
children in the late elementary and middle school ages. Thus, the effect on enrollment
from a new housing development with these types of homes would be first seen at
grades five through eight. However, as the number of move up homes being
constructed in the district declines over the next 10 years, the impact of in-migration will
be reduced regarding year to year middle school enrollment trends.
High School Enrollment
Enrollment at the high school level is forecasted to grow from 864 in 2014-15 to
940 in 2019-20, an increase of 76 students or 8.1%. After 2019-20, the high school
enrollment trend will accelerate slightly. The net result for the five-year period 2019-20
to 2024-25 will be an increase of 106 students to 1,046 or 11.3%.
The aforementioned effects of changes in cohort size on middle school
enrollment are also affecting the growth patterns of the high school population. The
difference is that the bulk of the "wave" cohort sizes will not begin to reach 9th grade
until the 2018-19 school year. Over the next five years, the similar sized grade cohorts
that are in the middle school enrollment begin to enter high school. Until the equal
sized cohorts of students pass through the high school grades, there will be a
stabilization of enrollment at the district's high school, ending in 2019. After that point,
high school enrollment will begin to rise.
It is important to note that the vast majority of this future high school enrollment
growth will be a result of students aging into those grades. Specifically, students who
already live in the district (and not in- migration of students ages 14 to 18) will be the
McKibben Demographic Research October 2014 30
primary cause of the forecasted increase in high school enrollment. Additionally, as
was mentioned earlier, these forecasts represent the demographic changes that will
affect high school enrollment. Any changes in the district’s student transfer policy
and/or changes in special high school level programs will need to be added or
subtracted from the forecast result
High school enrollment is the most difficult of all the grade levels to project. The
reason for this is the varying and constantly changing dropout rates, particularly in
grades 10 and 11. For these forecasts the dropout rates at the high school were
calculated for each grade over the last five years. These five-year averages were then
held constant for the life of the forecast. The effects of any policy changes dealing with
any school's dropout rates, program placement or reassignment of former students to
new grade levels will need to be added or subtracted from the forecast results.
REFERENCES
McKibben, J.
McKibben Demographic Research October 2014 31
The Impact of Policy Changes on Forecasting for School Districts. Population
Research and Policy Review, Vol. 15, No. 5-6, December 1996
McKibben, J., M. Gann, and K. Faust.
The Baby Boomlet's Role in Future College Enrollment. American
Demographics, June 1999.
Peters, G. and R. Larkin
Population Geography. 7th Edition. Dubuque, IA: Kendall Hunt Publishing. 2002.
Siegel, J. and D. Swanson
The Methods and Materials of Demography: Second Edition, Academic Press:
New York, New York. 2004.
Smith, S., J. Tayman and D. Swanson
State and Local Population Projections, Academic Press, New York, New York.
2001.