BEIS Public Attitudes Tracker Wave 33: key findings · BEIS Public Attitudes Tracker (March 2020,...
61
Responsible statistician: Stephen Kelly Email: [email protected] Media enquiries: 020 7215 1000; [email protected] Public enquiries: 020 7215 5000 Next publication: August 2020 BEIS Public Attitudes Tracker (March 2020, Wave 33, UK) 7th May 2020 Official Statistics As well as the quarterly questions on renewable energy, fracking and a new question on Net Zero 1 the March 2020 wave of the tracker covered some topics asked on an annual basis including on Climate Change, energy use and smart meters. In March 2020: • Three quarters (76%) of people said they were either very concerned (35%) or fairly concerned (41%) about climate change. This fell from the peak of 80% in March 2019. • Among all people except the 2% who don’t believe in climate change, 25% think people in the UK are currently being affected a great deal by climate change (Figure 1), an increase from 14% in March 2019). • Awareness of carbon capture reached its highest point across the tracker at 46%. • Awareness of smart meters also reached a peak of 89%. Figure 1: How much climate change is currently affecting people in the UK as a whole (among all people except those who believe there is no such thing as climate change), March 2019 to March 2020 Q181. And how much, if at all, do you think climate change is currently affecting … People in the UK as a whole Base: All respondents apart from those who don’t believe in climate change – March 2020 (1,812); March 2019 (4,129). (Asked Annually.) What you need to know about these statistics: The results presented here are based on questions included in a face-to-face omnibus survey in March 2020. Fieldwork finished early due to the outbreak of COVID-19, leading to a smaller size for this wave. The survey uses a random location sampling approach which is a form of quota sampling. Further information on this sampling approach and the steps taken to minimise the risk of sample bias can be found in the Technical notes. 1 Net zero means that the UK’s total greenhouse gas (GHG) emissions would be equal to or less than the emissions the UK removed from the environment. This can be achieved by a combination of emission reduction and emission removal. 14% 25% 59% 53% 17% 15% 6% 3% 4% 4% March 2019 (Wave 29) March 2020 (Wave 33) A great deal To some extent Not too much Not at all Don't know 79% 73% % thinking it is affected
Transcript of BEIS Public Attitudes Tracker Wave 33: key findings · BEIS Public Attitudes Tracker (March 2020,...

Responsible statistician: Stephen Kelly Email: [email protected] Media enquiries: 020 7215 1000; [email protected] Public enquiries: 020 7215 5000 Next publication: August 2020
BEIS Public Attitudes Tracker (March 2020, Wave 33, UK) 7th May 2020 Official Statistics
As well as the quarterly questions on renewable energy, fracking and a new question on Net Zero1 the March 2020 wave of the tracker covered some topics asked on an annual basis including on Climate Change, energy use and smart meters. In March 2020:
• Three quarters (76%) of people said they were either very concerned (35%) or fairly concerned (41%) about climate change. This fell from the peak of 80% in March 2019.
• Among all people except the 2% who don’t believe in climate change, 25% think people in the UK are currently being affected a great deal by climate change (Figure 1), an increase from 14% in March 2019).
• Awareness of carbon capture reached its highest point across the tracker at 46%.
• Awareness of smart meters also reached a peak of 89%.
Figure 1: How much climate change is currently affecting people in the UK as a whole (among all people except those who believe there is no such thing as climate change), March 2019 to March 2020
Q181. And how much, if at all, do you think climate change is currently affecting … People in the UK as a whole
Base: All respondents apart from those who don’t believe in climate change – March 2020 (1,812); March 2019 (4,129). (Asked Annually.)
What you need to know about these statistics:
The results presented here are based on questions included in a face-to-face omnibus survey in March 2020. Fieldwork finished early due to the outbreak of COVID-19, leading to a smaller size for this wave. The survey uses a random location sampling approach which is a form of quota sampling. Further information on this sampling approach and the steps taken to minimise the risk of sample bias can be found in the Technical notes.
1 Net zero means that the UK’s total greenhouse gas (GHG) emissions would be equal to or less than the emissions the UK removed from the environment. This can be achieved by a combination of emission reduction and emission removal.
14%
25%
59%
53%
17%
15%
6%
3%
4%
4%
March 2019(Wave 29)
March 2020(Wave 33)
A great deal To some extent Not too much Not at all Don't know
79%
73%
% thinking it is affected

2
Contents Executive summary _________________________________________________________ 4
Introduction _______________________________________________________________ 6
Headline findings ___________________________________________________________ 8
Net Zero ________________________________________________________________ 8
Climate change ___________________________________________________________ 9
Concern about climate change ____________________________________________ 10
Causes of climate change ________________________________________________ 11
Impact of climate change ________________________________________________ 11
Changing behaviour ____________________________________________________ 17
Tackling climate change _________________________________________________ 22
Trust in information sources ______________________________________________ 24
Attitudes in relation to climate change ______________________________________ 25
Energy security __________________________________________________________ 27
Energy infrastructure _____________________________________________________ 29
Renewables __________________________________________________________ 29
Nuclear energy ________________________________________________________ 32
Shale gas ____________________________________________________________ 34
Carbon capture and storage ______________________________________________ 37
Energy saving and wasting _________________________________________________ 39
Smart meters ___________________________________________________________ 42
Energy bills and suppliers __________________________________________________ 43
Energy bills ___________________________________________________________ 43
Energy suppliers and switching ____________________________________________ 45
Corporate trust and transparency ____________________________________________ 47
Office for Product Safety and Standards ______________________________________ 49
Technical information _______________________________________________________ 51
Technical notes _________________________________________________________ 51
Fieldwork dates and sample sizes ___________________________________________ 54
Definitions _______________________________________________________________ 56
Further information _________________________________________________________ 59
Future updates to these statistics ____________________________________________ 59
Revisions policy _________________________________________________________ 59
Related Statistics ________________________________________________________ 59
Uses of these statistics ____________________________________________________ 60

3
User engagement _____________________________________ 60
Pre-release access to statistics _____________________________________________ 60
Contact ________________________________________________________________ 60

4
Executive summary The key findings for the March 2020 wave of the tracker are presented below.
Net Zero • A new question was added to the survey in March 2020 to understand the public’s
awareness of the concept of “Net Zero”. The proportion of people who had any awareness of “Net Zero” was 35%.
Climate change • In March 2020, 76% of the public said they were either very concerned (35%) or fairly
concerned (41%) about climate change, a fall from the peak of 80% observed in March 2019.
• Almost half of the public (47%) said that climate change is either entirely (17%) or mainly (30%) caused by human activity, remaining at its highest point since the question was first asked.
• Among all people apart from the 2% who did not believe in climate change:
• 68% thought that climate change is already having an impact in the UK.
• 56% thought that climate change is currently affecting people in their local area, 79% thought it was affecting people in the UK and 86% thought it was affecting people in other countries.
• The largest expected impact over the next 15 to 20 years was rising sea levels or more flooding (61%), followed by more extreme events such as storms (53%) and rising temperatures or hotter summers (52%).
• More people thought that the government should have the most responsibility for tackling the effects of climate change in the UK (47%) compared with the general public (25%) and businesses (11%).
Renewables • In March 2020, levels of support for renewable energy remained stable at 82%. Levels
of support have remained between 74% and 85% since the question was first asked in March 2012.
• Most of the public continued to support each of the renewable energy sources included in the tracker in March 2020: solar (86%); off-shore wind (81%); wave and tidal (80%); on-shore wind (77%); and biomass (68%).
Nuclear energy • In March 2020, 32% of the public supported nuclear energy, reaching its lowest point
across the tracker, continuing a downward trend in support since September 2014 (42%). The proportion who opposed nuclear energy remained stable at 23%. A large proportion of people neither supported nor opposed nuclear in energy (41%), a continuation of a longer-term upward trend since September 2012 (34%).

5
Shale gas • In March 2020, awareness of fracking remained stable at 78%, with levels unchanged
since December 2018.
• Opposition to fracking reached its highest point across the tracker at 45% in March 2020, while support reached its lowest point at 8%. The proportion of people that neither supported nor opposed fracking remained stable at 45%.
Carbon capture and storage • In March 2020, awareness of carbon capture reached its highest point across the
tracker at 46%, having previously remained between 36% and 41%. Just over six in ten (62%) of those who knew a lot or a little about carbon capture and storage said they supported it.
Energy saving and wasting • In March 2020, 80% of people claimed to give at least a fair amount of thought to saving
energy in their home.
Smart meters • Awareness of smart meters reached a peak of 89% in March 2020, having gradually
increased from 47% in March 2012.
Energy bills • In March 2020, 26% of people were worried about paying for energy bills. This figure
has remained relatively stable since falling from a peak of 59% in March 2013.
Energy suppliers and switching • In March 2020, the public were asked whether they trusted energy suppliers on a range
of measures. The public were most likely to trust suppliers to provide a bill which accurately reflects energy use (68%) and to provide a breakdown of the components of their bill (68%). They were least likely to trust suppliers to improve their home to make it more energy efficient (49%).
• In March 2020, 21% of people said they had switched energy supplier in the last year. This has gradually increased from 15% in March 2016 to the highest level since the survey started in March 2012.
Corporate trust and transparency • In March 2020, the public were asked questions on corporate trust and transparency of
large financial and legal businesses. The public were most likely to trust (a great deal or to some extent) businesses to treat employees fairly (45%), to be open and honest in their dealings with customers (40%) and to act in a socially responsible way (40%). They were least likely to trust these businesses to be open and honest about how much tax they pay (25%).
Office for Product Safety and Standards • In March 2020, 17% said they had heard of the OPSS, most commonly in a newspaper
or on TV (29% of those that heard of OPSS). More than eight in ten (85%) of those who had heard of the OPSS said they trusted it a great deal (25%) or to some extent (60%).
6
Introduction The Public Attitudes Tracker (PAT) survey covers public attitudes towards Department for Business, Energy and Industrial Strategy (BEIS) policies such as energy, climate change, consumer rights, artificial intelligence and workers’ rights. The survey began in March 2012 and runs four times a year. Questions on issues where attitudes are expected to shift more quickly or to be affected by seasonal changes are repeated quarterly; other questions are asked annually. The tracker is regularly reviewed to ensure that the data continue to offer valuable insight.
This report presents summary headline findings from March 2020 (Wave 33). Data for wave 33 were collected between 11 March and 17 March using face-to-face in-home interviews with a representative sample of 1,851 adults (aged 16 and over) in the UK. Interviews were carried out using the Kantar UK Omnibus, which uses a random location quota sampling approach.
Fieldwork for this wave stopped early due to the outbreak of Coronavirus (COVID-19) in the UK, and the associated lockdown measures. As such, the sample size for this wave is lower than previous waves. Although the fieldwork took place before full lockdown measures had been implemented, it is unclear what effect the COVID-19 outbreak and associated media coverage during fieldwork may have had on public behaviours, attitudes and perceptions towards the topics in this report. This report adopts the same approach as previous waves and provides selected headline findings and highlights statistically significant differences at the 95% level between wave 33 and previous waves, and between subgroups for wave 33. However, the factors described above should be taken into consideration when using these results for analysis.
Further information on the sampling approach and the steps taken to minimise the risk of sample bias can be found in the Technical Notes.
This report makes references to other outputs that are published alongside this report. These are described below:
• Tables: This refers to the PDF crosstabulations for the current wave. This includes demographic and key question sub-group comparisons for all questions. These are also available in Excel.
• Excel Summary tables: This refers to the Excel Summary tables showing trends across all waves of the tracker.
Most questions included at wave 33 had been asked in at least one previous wave. The exception is the question on the concept of Net Zero, which was introduced at wave 33. Full details of the methodology are provided in the technical note.2
The wave 33 questionnaire covered the following topics:
• Net Zero
• Climate change
2 Available at: https://www.gov.uk/government/publications/beis-public-attitudes-tracker-technical-note

7
• Renewables
• Nuclear energy
• Shale gas
• Carbon capture and storage
• Energy saving and wasting
• Smart meters
• Energy bills
• Energy suppliers and switching
• Corporate trust and transparency
• Office for Product Safety and Standards

8
Headline findings
Net Zero
In June 2019 the government announced a new target which will require the UK to bring all greenhouse gas emissions to net zero by 2050. A new question was introduced to the tracker in March 2020 to understand the public’s awareness of the concept of “Net Zero”.
In March 2020, most people were unaware of the concept of Net Zero, with 64% saying they had not heard of it. The proportion of people who had any awareness of the concept of Net Zero was 35%. This compromised 3% who knew a lot about it, 9% who knew a fair amount, 13% who knew a little, and 10% who had only heard about it (Figure 2).
Figure 2: Awareness of the concept of “Net Zero” (based on all people), March 2020
Q220. The Government promotes the concept of ‘Net Zero’. Before today, how much, if anything, did you know about this concept?
Base: All wave respondents. (Asked quarterly). See technical appendix for base sizes.
Note: Awareness includes those who said they knew a lot about it, knew a fair amount about it, knew a little about it and knew hardly anything but had heard of it.
Awareness was higher among men (46%, compared with 26% of women) and those in social grades AB (50%, compared with 20% in social grades DE) (Table 63).
3%
9%
13%
10%
64%
Hadn't heardabout this beforenow
Hardly anythingbut I've heardabout this
A little
A fair amount
A lot% with anyawareness
35%

9
Climate change
The public were asked a series of questions on climate change in March 2020. This included a series of questions added to the survey in March 2019, to provide a more detailed picture of public attitudes and knowledge about climate change. These questions were asked again in March 2020, with a view that findings could be compared with the previous annual wave. However, as the March 2020 wave was conducted during the COVID-19 outbreak, it is unclear how this may have affected public behaviours, attitudes and perceptions towards climate change. Therefore, caution should be applied when comparing results over time. Please see the Technical Notes for further details.
We present the results for climate change under the headings below:
• Concern about climate change
• Causes of climate change
• Impact of climate change (introduced in March 2019)
• Changing behaviour (introduced in March 2019)
• Tackling climate change (introduced in March 2019)
• Trust in information sources (introduced in March 2019)
• Attitudes in relation to climate change (introduced in March 2019)

10
Concern about climate change
In March 2020, 76% of the public said they were either very (35%) or fairly concerned (41%) about climate change, a fall from the peak of 80% observed in March 2019 (Figure 3; Excel Summary Tables, Q21). The proportion of people saying they were very concerned has not changed since March 2019 (35%) despite the fall in concern. Over the longer term, concern about climate change has gradually increased from 65% in June 2012, when this question was first asked. The proportion who are very concerned has increased from 20% to 35% over the same period.
In March 2020, 22% of the public said they were either not very concerned (17%) or not at all concerned (6%), an increase from the low of 19% observed in March 2019. Over the longer-term, this figure has fallen steadily in recent years since this question was first asked in June 2012, when 35% said they were not very or not at all concerned (Excel Summary Tables, Q21).
Figure 3: Concern about climate change (based on all people), June 2012 to March 2020
Q21. How concerned, if at all, are you about climate change, sometimes referred to as ‘global warming’?
Bases: All wave respondents – June 2012 and March 2013 to March 2020. (Asked annually.) See technical appendix for base sizes.
* 2012 figures are taken from June (Wave 2) as this question was not asked in a comparable format in March 2012 (Wave 1).
Those in higher social grades were more likely to say they were concerned about climate change (83% of those in social grades ABC1, compared with 65% of those in social grades DE). Levels of concern did not differ greatly by age, though people aged 16 to 24 (81%) and 55 to 64 (80%) were most likely to say they were concerned, compared with 71% among people aged 35 to 44.
6566 68 66
70 7174
8076
35 33 31 3329 27
2319
22
0
20
40
60
80
100
Jun 2012*(Wave 2)
Mar 2013(Wave 5)
Mar 2014(Wave 9)
Mar 2015(Wave 13)
Mar 2016(Wave 17)
Mar 2017(Wave 21)
Mar 2018(Wave 25)
Mar 2019(Wave 29)
Mar 2020(Wave 33)
%
Very or fairlyconcerned
Not very or notat all concerned

11
Causes of climate change
In March 2020, almost half (47%) of the public said that climate change is either entirely (17%) or mainly (30%) caused by human activity. The proportion that thought that climate change is caused entirely or mainly by human activity has remained fairly stable since March 2018, having gradually risen from a low of 35% in March 2014 (Figure 4).
In March 2020, the proportion of the public that thought climate change is entirely (2%) or mainly (6%) caused by natural processes remained low at 8%. Just under four in ten (39%) thought that climate change is caused partly by natural processes and partly by human activity. A further 2% of the public did not think there was such a thing as climate change (Excel Summary Tables, Q22).
Figure 4: Whether people think climate change is caused by human activity, natural processes or both (based on all people), June 2012 to March 2020
Q22. Thinking about the causes of climate change, which, if any, of the following best describes your opinion?
Bases: All wave respondents – June 2012 and March 2013 to March 2020. (Asked annually.) See technical appendix for base sizes.
2012 figures are taken from June (Wave 2) as this question was not asked in a comparable format in March 2012 (Wave 1).
Those aged 16 to 24 were more likely to see climate change as being mainly or entirely caused by human activity than those in older age groups, with 59% responding in this way, compared with between 41% and 46% for all age groups 35 and over. Those in social grades AB were also more likely to say that climate change was caused by human activity (55%, compared with 40% of those in social grades DE) (Table 53).
Impact of climate change
In March 2020, all apart from the 2% who did not believe in climate change were asked about their perceptions of its impact in the UK (Figure 5). Just over two thirds (68%) said that climate change is already having an impact in the UK, 12% said that it is not yet having an impact but will do in their lifetime, and a further 12% said that it will not have an impact in their lifetime but will do for future generations in the UK. Three percent said that climate change is not happening or will never impact in the UK and 5% said they did not know about the impact of
35
4747
39
13
8
0
20
40
60
Jun 2012*(Wave 2)
Mar 2013(Wave 5)
Mar 2014(Wave 9)
Mar 2015(Wave 13)
Mar 2016(Wave 17)
Mar 2017(Wave 21)
Mar 2018(Wave 25)
Mar 2019(Wave 29)
Mar 2020(Wave 33)
%
Mainly orentirelyhumanactivity
Both naturalprocessesand humanactivity
Mainly orentirelynaturalprocesses

12
climate change in the UK. These results are unchanged from March 2019 (Excel Summary Tables, Q180).
Figure 5: Views on impact of climate change in the UK (among all people except those who believe there is no such thing as climate change), March 2020
Q180. Which of these describes your views about the impact of climate change in the UK?
Base: All respondents apart from those who don’t believe in climate change – March 2020 (1,812)
As with overall concern about climate change, those in higher social grades were more likely to think that climate change is already having an impact in the UK (84% in social grades AB, compared with 53% in social grades DE) (Table 64).
All apart from the 2% who did not believe in climate change were then asked how much they thought climate change is currently affecting:
• Their local area
• People in the UK as a whole
• People in other countries
While people in other countries were seen as being more heavily affected by climate change (86% overall: 45% a great deal and 41% to some extent), most people thought their local area (56%) and people in the UK (79%) were affected either a great deal or to some extent. There has also been an increase in the proportion thinking that climate change is affecting people in the UK over the last year (from 73% in March 2019 to 79% in March 2020).
A small minority thought that climate change was having no effect on their local area (10%), people in the UK as a whole (3%) or people in other countries (2%) (Figure 6; Figure 7).
68%
12%
12%
3%5% Don't know
Climate change is nothappening / will never havean impact in the UK
Climate change will not havean impact in my lifetime, butwill do for future generationsin the UK
Climate change is not yethaving an impact, but will doin my lifetime
Climate change is alreadyhaving an impact in the UK

13
Figure 6: How much climate change is currently affecting your local area, people in the UK as a whole, and people in other countries (among all people except those who believe there is no such thing as climate change), March 2020
Q181. And how much, if at all, do you think climate change is currently affecting …Your local area / …People in the UK as a whole / …People in other countries
Base: All respondents apart from those who don’t believe in climate change – March 2020 (1,812)
10%
25%
45%
46%
53%
41%
30%
15%7%10%
3% 2%5% 4% 6%
Your local area People in the UKas a whole
People in othercountries
Don't know
Not at all
Not too much
To some extent
A great deal
56%% thinking it is affected
79%86%

14
Figure 7: How much climate change is currently affecting people in the UK as a whole (among all people except those who believe there is no such thing as climate change), March 2019 to March 2020
Q181. And how much, if at all, do you think climate change is currently affecting … People in the UK as a whole
Base: All respondents apart from those who don’t believe in climate change – March 2020 (1,812); March 2019 (4,129). (Asked Annually.)
Two further questions were asked of all apart from the 2% who did not believe in climate change to determine:
• What, if any, impacts of climate change people had noticed in the UK over the past few years. This was asked unprompted and interviewers coded spontaneous responses.
• The extent to which people thought that impacts of climate change were likely to occur in the next 15 to 20 years in the UK. This was asked as a prompted question.
14%
25%
59%
53%
17%
15%
6%
3%
4%
4%
March 2019(Wave 29)
March 2020(Wave 33)
A great deal To some extent Not too much Not at all Don't know
79%
73%
% thinking it is affected

15
In March 2020, the most common impact of climate change people said they had noticed in the last few years was rising sea levels or more flooding (51%). This figure has increased markedly since March 2019 when 31% cited this as an impact (Figure 8). This is likely to be related to the fact that the UK had experienced severe flooding shortly before survey fieldwork (this occurred between November 2019 and February 2020).
Just under four in ten (38%) said they had noticed rising temperatures or hot summers, a notable decrease from 51% in March 2019. Again, this may be explained by different annual weather patterns: the March 2019 wave was conducted the year after there had been an unusually hot summer (in 2018).
Just over three in ten (32%) said they noticed more extreme events such as storms (no change since 2019). Eight in ten people (81%) had noticed at least one current impact of climate change in the UK; 14% had not noticed any impacts, a slight decrease from 17% in March 2019 (Excel Summary Tables, Q182; Table 69).
Figure 8: Impacts of climate change on UK noticed in past few years (among all people except those who believe there is no such thing as climate change), March 2019 to March 2020
Q182. Thinking just about the UK, have you noticed any impacts of climate change over the past few years? If so, which ones? [unprompted]
Base: All respondents apart from those who don’t believe in climate change – March 2020 (1,812); March 2019 (4,129). (Asked Annually).
4%
17%
1%
4%
7%
8%
11%
11%
15%
13%
17%
31%
51%
31%
4%
14%
4%
3%
7%
8%
10%
11%
13%
15%
16%
32%
38%
51%
Don't know
None of these/no impacts
Other
Change to seasons/no definitiveseasons/erractive weather patterns
Increased wildfires
Reduced food availability/impact onfarming
Reduced water availability/droughts
Increased coastal erosion
Changes in plants or wildlife/plant oranimal extinction
More health problems (e.g. asthma)
Increased pollution
More extreme events such as storms
Rising temperatures/heat/hottersummers
Rising sea levels/more flooding
March 2020 (Wave 33)
March 2019 (Wave 29)

16
The most common expected impacts over the next 15 to 20 years were consistent with perceived current impacts: 61% mentioned rising sea levels or more flooding (up from 56% in March 2019), 53% more extreme events such as storms and 52% rising temperatures of hotter summers (down from 62% in March 2019) (Figure 9). Other common impacts expected were increased pollution (47%), increased coastal erosion (43%) and more health problems (41%). For all impacts, the proportion of people who thought they were likely to occur in the next 15-20 years was considerably higher than the proportion who had noticed them in the past few years.3
Figure 9: Impacts of climate change on UK noticed in past few years and expected in next 15-20 years (among all people except those who believe there is no such thing as climate change), March 2020
Q182. Thinking just about the UK, have you noticed any impacts of climate change over the past few years? If so, which ones? [unprompted]
Q183. Which of these do you think are likely to occur in the UK in the next 15 to 20 years as a result of climate change? You can choose as many as you want. [prompted]
Base: All respondents apart from those who don’t believe in climate change – March 2020 (1,812)
3 This is partly explained by the different way the two questions were asked: current impacts as a spontaneous question and expected impacts as a prompted question.
5%
6%
0%
25%
31%
32%
38%
41%
43%
47%
52%
53%
61%
4%
14%
4%
7%
10%
8%
13%
15%
11%
16%
38%
32%
51%
Don't know
None of these/no impacts
Other
Increased wildfires
Reduced wateravailability/droughts
Reduced food availability/impacton farming
Changes in plants or wildlife/plantor animal extinction
More health problems (e.g.asthma)
Increased coastal erosion
Increased pollution
Rising temperatures/heat/hottersummers
More extreme events such asstorms
Rising sea levels/more flooding
Impacts noticed in pastfew years(spontaneous)
Expected impacts innext 15-20 years(prompted)

17
Changing behaviour
The public was asked whether they did any of the following actions:
• Choosing to walk, cycle or use public transport more instead of using a car
• Avoiding/eating less meat
• Avoiding/eating less dairy produce
• Avoiding/minimising throwing away food
• Driving an electric or hybrid car
• Thinking about the energy efficiency of appliances when making a purchase
• Minimising the amount of energy used at home
• Avoiding/minimising air travel.
People were first asked whether they did any of these things, without any reference to climate change. They were then asked whether they did these actions as a result of wanting to help limit the effects of climate change or for other reasons.

18
From the list presented, the most common actions that people took were avoiding or minimising throwing away food (54%), minimising the amount of energy they use at home (51%) and choosing to walk, cycle or use public transport more instead of using a car (46%) (Figure 10; Excel Summary Tables, Q184). The most common behaviours are consistent with those observed in March 2019, although the proportion doing each of these has decreased (from 57%, 56% and 51% in March 2019, respectively).
Over eight in ten (83%) of people had done at least one of these behaviours, 47% had done at least three, and 17% had done at least five (Table 71). These findings are consistent with those observed in March 2019.
Figure 10: Behaviours in everyday life (based on all people), March 2019 to March 2020
Q184. Thinking now about your everyday life, do you do any of these things?
Base: All respondents – March 2020 (1,851)
Those in higher social grades were more likely to have done at least five of these things compared to those in lower social grades (23% in social grades ABC1, compared with 10% in social grades C2 and 7% in social grades DE). Those who were very concerned about climate change were also more likely to have done at least five of these things (31%, compared with 12% of those fairly concerned, 5% of those not very concerned and 5% of those not at all concerned about climate change) (Table 71).
15%
5%
14%
14%
25%
40%
51%
56%
57%
15%
6%
15%
18%
27%
37%
46%
51%
54%
None of these
Drive an electric or hybrid car
Avoid/eat less dairy produce
Avoid/minimise air travel
Avoid/eat less meat
Think about the energy efficiency of productsand appliances when making a purchase
Choose to walk, cycle or use public transportmore instead of using a car
Minimise the amount of energy you use athome
Avoid/minimise throwing away food
March 2020 (Wave 33)
March 2019 (Wave 29)

19
People were then asked a follow-up question to determine whether they did these behaviours mainly because they wanted to limit the effects of climate change or for other reasons (e.g. lifestyle choice, cost, convenience, health or ethical reasons).
The proportion of people who drove an electric or hybrid car was small (6%), but 50% of this group said they did so mainly due to help limit climate change compared with 40% who did this mainly for other reasons. For all other behaviours, people were more likely to say they mainly did these things for reasons other than helping to limit climate change (Figure 11). For all behaviours other than driving an electric or hybrid car, there have been increases in the proportion of people doing these mainly to help limit the effects of climate change (Excel Summary Tables, Q185):
The proportion of people doing these behaviours who said this was to help limit the effects of climate change increased between March 2019 and March 2020:
• Thinking about the energy efficiency of products and appliances when making a purchase: 43%, up from 33% in March 2019
• Avoiding or minimising air travel: 42%, up from 28% in March 2019
• Minimising the amount of energy used at home: 34%, up from 26% in March 2019
• Avoiding or eating less meat: 32%, up from 20% in March 2019
• Avoiding or eating less dairy produce: 31%, up from 22% in March 2019
• Avoiding or minimising throwing away food: 26%, up from 22% in March 2019
• Choosing to walk, cycle, or use public transport more instead of using a car: 26%, up from 22% in March 2019
Some of these shifts are quite striking. In particular, the proportion of people reducing air travel who say this is related to climate change increased from 28% in March 2019 to 42% in March 2020. This may be related to Coronavirus, with many international flights already being disrupted in the early part of March 2020.

20
Figure 11: Things people said they do mainly due to climate change (among those saying they have done each type of behaviour), March 2020
Q185. You mentioned that you currently do [ITEM MENTIONED AT Q184]. Looking at this screen, what would you say is the main reason for this?
Bases: All who have done each thing (regardless of reasoning) – March 2020: Drive an electric or hybrid car (97); Think about the energy efficiency of products and appliances when making a purchase (640); Avoid/minimise throwing away food (980); Avoid/minimise air travel (334); Minimise the amount of energy you use at home (937); Avoid/eat less meat (468); Avoid/eat less dairy produce (261); Choose to walk, cycle of use public transport more instead of using a car (813); Avoid/eat less meat (989)
26%
26%
31%
32%
34%
42%
43%
50%
65%
66%
61%
59%
55%
52%
47%
40%
9%
8%
8%
9%
11%
6%
10%
10%
Choose to walk, cycle or use publictransport more instead of using a car
Avoid/minimise throwing away food
Avoid/eat less dairy produce
Avoid/eat less meat
Minimise the amount of energy youuse at home
Avoid/minimise air travel
Think about the energy efficiency ofproducts and appliances when
making a purchase
Drive an electric or hybrid car
Mainly to help limit the effects of climate change Mainly for other reasons A mixture of both

21
When calculated as a proportion of all people surveyed (i.e. including those who did not do each of these things) the most common things done mainly to reduce climate change were: minimising the amount of energy used at home (17%, up from 14% in March 2019); thinking about the energy efficiency of products and appliances when making a purchase (16%, up from 13% in March 2019); avoiding/minimising throwing away food (14%, up from 12% in March 2019); and choosing to walk, cycle or use public transport more instead of using a car (12%, no change) (Figure 12).
Figure 12: Things people said they do mainly due to climate change (based on all people), March 2019 to March 2020
Q185. You mentioned that you currently do [ITEM MENTIONED AT Q184]. Looking at this screen, what would you say is the main reason for this?
Base: All respondents – March 2019 to March 2020. (Asked annually.) See technical appendix for base sizes.
2%
3%
4%
5%
11%
12%
13%
14%
3%
5%
8%
9%
12%
14%
16%
17%
Drive an electric or hybrid car
Avoid/eat less dairy produce
Avoid/minimise air travel
Avoid/eat less meat
Choose to walk, cycle or use public transportmore instead of using a car
Avoid/minimise throwing away food
Think about the energy efficiency of productsand appliances when making a purchase
Minimise the amount of energy you use at home
March 2020(Wave 33)
March 2019(Wave 29)

22
Tackling climate change
In March 2020, all apart from the 2% who did not believe in climate change were asked which three behaviours they expected to have the biggest impact on tackling climate change in the UK, if everyone in the UK did these things. They were asked to select from the same eight options as presented in the ’Changing behaviour’ section (see above).
In March 2020, the behaviour expected to have the largest impact on tackling climate change was if everyone chose to walk, cycle or use public transport more instead of using a car, with 50% of people selecting this as one of their three choices (Figure 13, Excel Summary Tables, Q186). This was followed by minimising the amount of energy you use at home (41%) and driving an electric or hybrid car (33%). The behaviours considered to have the largest impact in tackling climate change are consistent with those observed in March 2019. That said, there has been a decrease in the proportion of people thinking this about each of these three options: choosing to walk, cycle or use public transport more instead of using a car (50% in March 2020, down from 56% in March 2019); minimising home energy use (41%, down from 47%); and driving an electric or hybrid car (33%, down from 38%).
The changes expected to have the least impact if everyone did them were avoiding/eating less dairy produce (7%) and avoiding/eating less meat (17%). These were followed by avoiding/minimising throwing away food (26%) and thinking about the energy efficiency of products when making a purchase (26%, down from 32% in March 2019). Nearly one in ten (9%) of people said they did not think any of these things would have an impact on climate change (Table 82).
Figure 13: Changes that would have the biggest impact on tackling climate change (among all people except those who believe there is no such thing as climate change), March 2020
Q186. If everybody in the UK did the following, which three of these do you think would have the biggest impact on tackling climate change in the UK?
Base: All respondents apart from those who don’t believe in climate change – March 2020 (1,812)
5%
9%
7%
17%
26%
26%
29%
33%
41%
50%
Don't know
None of these will have an impact on climate change
Avoid/eat less dairy produce
Avoid/eat less meat
Avoid/minimise throwing away food
Think about the energy efficiency of products andappliances when making a purchase
Avoid/minimise air travel
Drive an electric or hybrid car
Minimise the amount of energy you use at home
Choose to walk, cycle or use public transport moreinstead of using a car

23
In March 2020, all apart from the 2% who did not believe in climate change were asked who should have most responsibility for tackling the effects of climate change:
• Government, by introducing more policies to reduce the level of carbon emission
• The general public, by making changes to their lifestyle
• Businesses, by doing more to reduce their impact on the environment.
More people thought that the government should have the most responsibility (47%), compared with the general public (25%) and businesses (11%, down from 14% in March 2019) (Figure 14, Excel Summary Tables, Q186). Over one in ten (11%) said they could not choose one of these and 2% said they did not know (Table 187). These findings are broadly consistent with those observed in March 2019.
Figure 14: Who should have most responsibility for tackling the effects of climate change (among all people except those who believe there is no such thing as climate change), March 2020
Q187. Looking at this screen, which one of these do you think should have the most responsibility for tackling the effects of climate change in the UK?
Base: All respondents apart from those who don’t believe in climate change – March 2020 (1,812)
2%
14%
11%
25%
47%
Don't know
Can't choose, all/more than one equal
Businesses, by doing more to reduce theirimpact on the environment
The general public, by making changes totheir lifestyle
Government, by introducing more policies toreduce the level of carbon emissions

24
Trust in information sources
All people interviewed in March 2020 were asked how much they trusted eight different sources to provide accurate information about climate change.
People were most likely to trust scientists working at universities (with 81% trusting them a great deal or to some extent,) and scientific organisations such as the Royal Society and Met Office (80%,). Levels of trust were lowest for social media sites such as Facebook and Twitter (16%), newspaper or newspaper websites (38%) and the UK Government (50%) (Figure 15, Excel Summary Tables, Q180). These findings are broadly consistent with those observed in March 2019.
Figure 15: Trust in sources to provide accurate information about climate change (among all people except those who believe there is no such thing as climate change), March 2020
Q188. How much do you trust [INSERT ITEM] to provide accurate information about climate change?
Base: All respondents – March 2020 (1,851)
1%
2%
6%
9%
10%
17%
33%
36%
15%
36%
45%
52%
56%
52%
47%
44%
28%
33%
27%
23%
20%
17%
10%
10%
44%
22%
19%
12%
9%
9%
5%
5%
12%
6%
4%
4%
5%
5%
5%
5%
Social media such as Facebook,Twitter
Newspaper or newspaper websites
UK Government
TV news such as BBC, ITV, Sky
TV and radio documentaries
Charities, environmental or campaigngroups such as Greenpeace, Friends
of the Earth
Scientific organisations, such asRoyal Society, Met Office
Scientists working at universities
Trust a great deal Trust to some extent
Do not have much trust Do not trust at all
Not applicable/Don't know/It depends
26%
67% 29%
61% 35%
50% 46%
38% 56%
16%
% trust % little/no trust
81% 15%
80% 15%
69%
71%

25
Attitudes in relation to climate change
All people interviewed in March 2020 were asked about the extent to which they agreed or disagreed with five attitudinal statements in relation to climate change:
• It's not worth doing things to help reduce climate change if others don't do the same
• There is so much conflicting information about climate change it is difficult to know what to believe
• If everyone does their bit, we can reduce the effects of climate change
• I have the ability to make changes in my life that could help reduce climate change
• The media exaggerates the impacts of climate change
Figure 16: Agreement with statements regarding climate change (based on all people), March 2020
Q189. How much do you agree or disagree with the following statements?
All wave respondents – March 2020 (1,851)
1% 3% 7% 11%
33%
3%5%
12%
16%
25%
11%
15%
17%
25%
14%
35%
42%
37%
31%
16%
47%
33%25%
15%10%
If everyone doestheir bit, we can
reduce the effectsof climate change
I have the ability tomake changes inmy life that could
help reduceclimate change
There is so muchconflicting
information aboutclimate change itis difficult to know
what to believe
The mediaexaggerates the
impacts of climatechange
It's not worthdoing things to
help reduceclimate change if
others don't do thesame
Agreestrongly
Agreeslightly
Neitheragreenordisagree
Disagreeslightly
Disagreestrongly
82%
5%
% who agree
% who disagree
75%
8%
62%
19%
45%
27%
26%
58%

DRAFT OFFICIAL SENSITIVE BEIS Public Attitudes Tracker (March 2020, Wave 33, UK)
26
In March 2020, the public were most likely to agree (82%) that “If everyone does their bit, we can reduce the effects of climate change”, with 47% strongly agreeing with this statement (Figure 16). The majority of people (75%) also agreed that “I have the ability to make changes in my life that could help reduce climate change”, with 33% strongly agreeing. Those who said they were very concerned about climate change were far more likely than those who were unconcerned to agree with each of these statements (94% and 88% of those who were very concerned compared with 58% and 48% of those who were unconcerned, respectively).
More than six in ten people (62%) agreed that “There is so much conflicting information about climate change it is difficult to know what to believe”, including 25% who strongly agreed. Those aged 65 and over were more likely to strongly agreement with this statement (31%, compared with 17% of those aged 16 to 24)
The public were more likely to agree (45%) than disagree (27%) that “The media exaggerates the impacts of climate change”. This was also the statement with the highest proportion saying they neither agreed nor disagreed (25%), suggesting a degree of uncertainty among some members of the public. Those not concerned about climate change (56%) were more likely to agree with the statement compared with those saying they were concerned about climate change (43%).
People were least likely to agree (26%) that “It’s not worth doing things to help climate change if others don’t do the same”, with 10% agreeing strongly. More than half of people (58%) disagreed with this statement, including 33% who strongly disagreed. Those who were very concerned about climate change were particularly likely to disagree with this statement (73%). These findings are consistent with those observed in March 2019.

DRAFT OFFICIAL SENSITIVE BEIS Public Attitudes Tracker (March 2020, Wave 33, UK)
27
Energy security
In March 2020, people were asked how concerned they were about various issues happening in the future in relation to energy security:
• Steep rises in energy prices in the future
• The UK not investing fast enough in alternative sources of energy
• The UK becoming too dependent on energy from other countries
• UK supplies of fossil fuels not being sufficient to meet the UK's demand for them
• The UK not developing technology to use existing sources of fossil fuels sufficiently
• Power cuts becoming more frequent in the future.
Levels of concern (very or fairly concerned) in relation to the UK’s future energy security have mostly decreased from the levels recorded in March 2013 and March 2014.
In March 2020, the issues of greatest concern to the public were steep rises in energy prices in the future (68%, down from 75% in March 2019), the UK not investing fast enough in alternative sources of energy (64%, down from 69% in March 2019), and the UK becoming too dependent on energy from other countries (59%, down from 65% in March 2019) (Figure 17; Excel Summary Tables, Q23a/Q23b).
Figure 17: Concern regarding statements related to the UK’s future energy security (based on all people) (set 1), June 2020 to March 2020
Q23a./Q23b. I’m now going to ask you how concerned you are about various things happening in the future. When I talk about ‘the future’ I mean the next 10-20 years. How concerned, if at all, are you about…
Base: All wave respondents – March 2013 to March 2020. See technical note section for base sizes.
84
6871
64
74
59
30
40
50
60
70
80
90
June 2012(Wave 2)
Mar 2013(Wave 5)
Mar 2014(Wave 9)
Mar 2015(Wave 13)
Mar 2016(Wave 17)
Mar 2017(Wave 21)
Mar 2018(Wave 25)
Mar 2019(Wave 29)
Mar 2020(Wave 33)
%
Steep rises in energy pricesThe UK not investing fast enough in alternative energy sourcesThe UK becoming too dependent on energy from other countries

DRAFT OFFICIAL SENSITIVE BEIS Public Attitudes Tracker (March 2020, Wave 33, UK)
28
The public were slightly less concerned about power cuts becoming more frequent in the future (47%, no change from March 2019), the UK supplies of fossil fuels not being sufficient to meet demand for them (51%, down from 58% in March 2019), and the UK not developing technology to use existing sources of fossil fuels sufficiently (54%, down from 57% in March 2019) (Figure 18; Excel Summary Tables, Q23/Q23b).
Figure 18: Concern regarding statements related to the UK’s future energy security (based on all people) (set 2), June 2012 to March 2020
Q23a./Q23b. I’m now going to ask you how concerned you are about various things happening in the future. When I talk about ‘the future’ I mean the next 10-20 years. How concerned, if at all, are you about…
Base: All wave respondents – March 2013 to March 2020. See technical note section for base sizes.
Those who were concerned about the UK becoming too dependent on energy from other countries were asked to identify specific sources of energy that concerned them. Of those who were concerned about dependency on other countries, the public were most likely to be concerned about gas (50%, down from 55% in March 2019), followed by oil (37%) and electricity (25%). A further 29% of this subgroup said they had no specific energy source in mind, an increase from 25% in March 2019.
66
51
65
5457
47
30
40
50
60
70
80
90
June 2012(Wave 2)
Mar 2013(Wave 5)
Mar 2014(Wave 9)
Mar 2015(Wave 13)
Mar 2016(Wave 17)
Mar 2017(Wave 21)
Mar 2018(Wave 25)
Mar 2019(Wave 29)
Mar 2020(Wave 33)
%
UK supplies of fossil fuels not being sufficient to meet demandThe UK not developing technology to use existing sources of fossil fuels sufficientlyPower cuts becoming more frequent

DRAFT OFFICIAL SENSITIVE BEIS Public Attitudes Tracker (March 2020, Wave 33, UK)
29
Energy infrastructure
Renewables
Support for renewable energy remained steady at 82% in March 2020. Levels of support have remained between 74% and 85% since the question was first asked in March 2012 (Figure 19). In March 2020, opposition to renewable energy remained at its lowest point across the tracker at 2%, having previously fluctuated between 3% and 5% between March 2012 and June 2019 (Excel Summary Tables, Q3).
Figure 19: Whether support or oppose renewable energy (based on all people), June 2012 to June 2020
Q3. Do you support or oppose the use of renewable energy for providing our electricity, fuel and heat?
Base: All wave respondents. (Asked quarterly.) See technical appendix for base sizes.
In March 2020, support for renewable energy was highest among those in social grades AB (90%, compared with 73% of those in social grades DE) (Table 2).
Support for each of the five major renewable developments covered by the tracker has generally increased over the course of the tracker, but has either fallen from the peak levels observed in March 2019 or remained stable in March 2020 (Figure 20; Excel Summary Tables, Q13). The findings for renewable energy developments are summarised below:
• Support for solar energy has remained stable at 86% since September 2019 but has fallen from the peak of 90% observed in March 2019. Support for solar energy has remained between 80% and 90% throughout the tracker.
• Support for offshore wind has remained stable at 81% since September 2019 but has decreased slightly from the peak of 83% observed in March 2019. Support has risen from a low of 71% in July 2013 but has fluctuated between 79% and 83% since March 2017.
• Support for wave and tidal energy has remained stable at 80% since September 2019 but has decreased slightly from the peak of 82% observed in March 2020). However,
Dec 2019(Wave 32), 83%
Mar 2020(Wave 33), 82%
Mar 2020(Wave 33), 2%0
20
40
60
80
100
Mar 2012(Wave 1)
Mar 2013(Wave 5)
Mar 2014(Wave 9)
Mar 2015(Wave 13)
Mar 2016(Wave 17)
Mar 2017(Wave 21)
Mar 2018(Wave 25)
Mar 2019(Wave 29)
Mar 2020(Wave 33)
%
Total supportTotal oppose

DRAFT OFFICIAL SENSITIVE BEIS Public Attitudes Tracker (March 2020, Wave 33, UK)
30
there has been an overall trend of increasing support for wave and tidal energy since September 2015, when 73% supported this.
• Support for onshore wind has remained stable at 77% since September 2019, but this has decreased slightly from the peak of 79% observed in March 2019. Over the longer term, support has increased from 65% in March 2015 to its present levels.
• Support for biomass has remained stable since September 2017 at 68%. Over the longer-term, support has increased since March 2016, when 63% supported biomass.
Figure 20: Support for different forms of renewable energy (based on all people), March 2012 to March 2020
Q13. Generally speaking, do you support or oppose the use of the following renewable energy developments?
Bases: All wave respondents. (Asked biannually.) See technical appendix for base sizes.
Opposition levels for all renewable energy development remained relatively stable (between 3% and 6% in March 2020).
83
86
76
81
75
80
66
77
64
68
55
65
75
85
95
Mar 2012(Wave 1)
Mar 2013(Wave 5)
Mar 2014(Wave 9)
Mar 2015(Wave 13)
Mar 2016(Wave 17)
Mar 2017(Wave 21)
Mar 2018(Wave 25)
Mar 2019(Wave 29)
Mar 2020(Wave 33)
%
Solar
Off-shorewind
Wave andtidal
Onshore wind
Biomass

DRAFT OFFICIAL SENSITIVE BEIS Public Attitudes Tracker (March 2020, Wave 33, UK)
31
People were also asked whether they agreed or disagreed with the following three statements regarding renewable energy:
• Renewable energy industries and developments provide economic benefits to the UK
• I would be happy to have a large-scale renewable energy development in my area
• Renewable energy developments should provide direct benefit to the communities in which they are located
In March 2020, the proportion of the public that agreed with each of the given statements about renewable energy developments remained stable compared to March 2019 (Figure 21). Eight in ten (79%) agreed that renewable energy developments should provide economic benefits to the communities in which they are located, with 76% agreeing that renewable energy industries and developments provide economic benefits to the UK. Just over six in ten (63%) agreed that they would be happy to have a large-scale renewable energy development in their area. Levels of agreement for each of the three statements has gradually increased over the course of the tracker since the question was first asked in March 2012 (Excel Summary Tables, Q12).
Figure 21: Agreement statements regarding renewable energy development (based on all people), March 2020
Q12. I’m now going to read out a number of statements about renewable energy. Please tell me how much you agree or disagree with each one.
Base: All wave respondents – March 2020 (1,851).
63%
76%
79%
23%
18%
15%
13%
4%
4%
1%
2%
1%
I would be happy to have alarge scale renewable
energy development in myarea
Renewable energyindustries and
developments provideeconomic benefits to the
UK
Renewable energydevelopments should
provide a direct benefit tothe communities in which
they are located
Total agree Neither agree nor disagree Total disagree Don't know

DRAFT OFFICIAL SENSITIVE BEIS Public Attitudes Tracker (March 2020, Wave 33, UK)
32
Nuclear energy
In March 2020, 32% of the public supported nuclear energy, reaching its lowest point across the tracker and continuing a downward trend in support since September 2014 (42%). The proportion who opposed nuclear energy remained stable at 23%. The largest proportion of people said they neither supported nor opposed nuclear in energy (41%), an increase from the level observed in March 2019 (38%), and a continuation of a longer-term upward trend since September 2012 (34%) (Figure 22; Excel Summary Tables, Q14a).
Figure 22: Whether support or oppose nuclear energy (based on all people), September 2013 to March 2020
Q14a. From what you know, or have heard about using nuclear energy for generating electricity in the UK, do you support or oppose its use?
Bases: All wave respondents. (Asked quarterly to March 2018 and annually thereafter.) See technical appendix for base sizes
Support for nuclear energy was higher among men (39%, compared with 26% of women), and those in the youngest and eldest age groups (38% for those aged 16 to 24 or 65 and over, compared with between 25% and 31% for those aged 25 to 64) (Table 27).
34
41
3832
27 23
0
10
20
30
40
50
Sep 2012(Wave 3)
Mar 2013(Wave 5)
Mar 2014(Wave 9)
Mar 2015(Wave 13)
Mar 2016(Wave 17)
Mar 2017(Wave 21)
Mar 2018(Wave 25)
Mar 2019(Wave 29)
Mar 2020(Wave 33)
%
Neithersupportnoroppose
Support
Oppose

DRAFT OFFICIAL SENSITIVE BEIS Public Attitudes Tracker (March 2020, Wave 33, UK)
33
In March 2020, people were asked whether they agreed or disagreed with the following statements in relation to nuclear energy:
• Nuclear energy provides a reliable source of energy in the UK
• Nuclear energy offers affordable energy for the UK
• Nuclear energy will help combat climate change in the UK
• Nuclear energy provides a safe source of energy in the UK4
The public were most likely to agree (strongly or slightly) that nuclear energy provides a reliable source of energy in the UK (44%) (Figure 23). However, the proportion of the public that agreed with this statement reached its lowest point across the tracker, from the peak of 50% observed in March 2018. The proportion agreeing that nuclear energy will help climate change in the UK also fell to its lowest point across the tracker (from 33% in March 2019 to 30% in March 2020),
Just over three in ten (32%) agreed that nuclear energy provides a safe source of energy in the UK, although people were more likely to disagree with this statement than the others (26%). Under four in ten (36%) agreed that nuclear energy offers affordable energy for the UK. Agreement for these two statements has shown little change since the questions were first asked.
For each of the four statements, the proportion of respondents who neither agreed nor disagreed with each statement was between 34% and 39%, pointing to some uncertainty in attitudes in relation to nuclear energy.
Figure 23: Agreement statements regarding nuclear energy (based on all people), March 2020
Q14. I'm now going to ask you for your opinion on a number of issues in relation to nuclear energy. Please just tell me how much you agree or disagree with the following statements…
Base: All wave respondents – March 2020 (1,851).
4 First asked in March 2012 for ‘Nuclear energy will help combat climate change in the UK’ and March 2016 for the other three statements.
17%10% 10% 11%
27%
20% 22% 24%
34%
39% 35%39%
9%13% 15%
10%
6%11% 12% 7%
7% 8% 6% 8%
Nuclear energyprovides a reliablesource of energy in
the UK
Nuclear energy willhelp combat climate
change in the UK
Nuclear energyprovides a safe
source of energy inthe UK
Nuclear energyoffers affordable
energy for the UK
Don't know
Strongly disagree
Slightly disagree
Neither agree nordisagree
Slightly agree
Strongly agree
44%
15%24% 26% 17%
30% 32% 36%% who agree
% who disagree
DRAFT OFFICIAL SENSITIVE BEIS Public Attitudes Tracker (March 2020, Wave 33, UK)
34
Overall, under two in ten (17%) of people agreed with all four of these statements. Those most likely to agree with all four statements included men (22%, compared with 12% of women) and those in social grades AB (22%, compared with 15% of those in social grades DE).
Shale gas
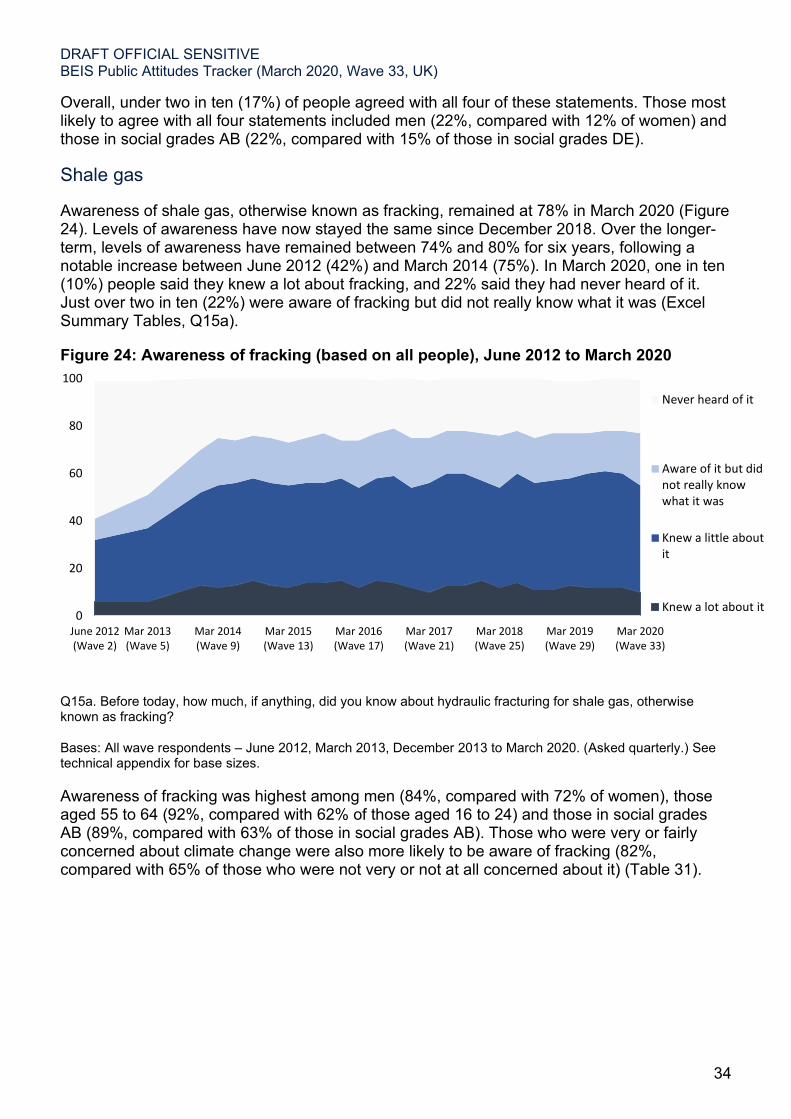
Awareness of shale gas, otherwise known as fracking, remained at 78% in March 2020 (Figure 24). Levels of awareness have now stayed the same since December 2018. Over the longer-term, levels of awareness have remained between 74% and 80% for six years, following a notable increase between June 2012 (42%) and March 2014 (75%). In March 2020, one in ten (10%) people said they knew a lot about fracking, and 22% said they had never heard of it. Just over two in ten (22%) were aware of fracking but did not really know what it was (Excel Summary Tables, Q15a).
Figure 24: Awareness of fracking (based on all people), June 2012 to March 2020
Q15a. Before today, how much, if anything, did you know about hydraulic fracturing for shale gas, otherwise known as fracking?
Bases: All wave respondents – June 2012, March 2013, December 2013 to March 2020. (Asked quarterly.) See technical appendix for base sizes.
Awareness of fracking was highest among men (84%, compared with 72% of women), those aged 55 to 64 (92%, compared with 62% of those aged 16 to 24) and those in social grades AB (89%, compared with 63% of those in social grades AB). Those who were very or fairly concerned about climate change were also more likely to be aware of fracking (82%, compared with 65% of those who were not very or not at all concerned about it) (Table 31).
0
20
40
60
80
100
June 2012(Wave 2)
Mar 2013(Wave 5)
Mar 2014(Wave 9)
Mar 2015(Wave 13)
Mar 2016(Wave 17)
Mar 2017(Wave 21)
Mar 2018(Wave 25)
Mar 2019(Wave 29)
Mar 2020(Wave 33)
Never heard of it
Aware of it but didnot really knowwhat it was
Knew a little aboutit
Knew a lot about it

DRAFT OFFICIAL SENSITIVE BEIS Public Attitudes Tracker (March 2020, Wave 33, UK)
35
In March 2020, the proportion of people who opposed fracking (either opposed or strongly opposed) reached its highest point across the tracker at 45%, up from 41% in December 2019 (Figure 25). Over the course of the tracker, there has been an increasing trend in opposition to shale gas from a low of 21% when this question was first asked in December 2013 (Excel summary tables, Q15b).
Support (either support or strongly support) for fracking reached its lowest point across the tracker (8%), down from 10% in December 2019. In line with opposition, support has decreased over the course of the tracker from 27% in December 2013.
The proportion of people that neither supported nor opposed fracking remained at 45%. The proportion that neither support nor oppose fracking has remained between 43% and 53% over the course of the tracker which indicates a persistent lack of knowledge and/or opinion on this topic (Excel Summary Tables, Q15b).
Figure 25: Whether support or oppose fracking (based on all people), March 2014 to March 2020
Q15b. From what you know, or have heard about, extracting shale gas to generate the UK’s heat and electricity, do you support or oppose its use?
Bases: All wave respondents – Asked all waves from December 2013 to March 2020 apart from June 2018. See technical appendix for base sizes.
Opposition to fracking in March 2020 differed by gender, age and social grade. Men (47%, compared with 42% of women), those aged 55 to 64 (57%, compared with 34% of those aged 16 to 24) and those in social grades AB (54%, compared with 34% of those in grades DE) were more likely to oppose fracking (Table 32). Those aged 16 to 24 were also less likely to have an opinion (58%, compared with 35% of those aged 55 to 64 and 38% of those 65 and over)
48
45
21
45
27
8
0
20
40
60
Mar 2014(Wave 9)
Mar 2015(Wave 13)
Mar 2016(Wave 17)
Mar 2017(Wave 21)
Mar 2018(Wave 25)
Mar 2019(Wave 29)
Mar 2020(Wave 33)
%
Neithersupportnoroppose
Oppose
Support

DRAFT OFFICIAL SENSITIVE BEIS Public Attitudes Tracker (March 2020, Wave 33, UK)
36
People were asked why they supported or opposed fracking5. In March 2020, the most common reasons for supporting fracking were: the need to use all available energy sources (36%); reducing the dependence on fossil fuels (34%); reducing the dependence on other countries for the UK’s energy supply (27%); being good for local jobs and investment (23%); and because it may result in cheaper energy bills (22%) (Table 33).
The main reasons for opposing fracking were the loss and destruction of the natural environment (57%), concern about the risk of earthquakes (45%), followed by concerns about the safety of the process (27%) (Table 34)
The main reason for neither supporting nor opposing fracking was not knowing enough about it (75%)
5 Responses were collected unprompted (without showing respondents a list) and were coded by interviewers into a predefined list.

DRAFT OFFICIAL SENSITIVE BEIS Public Attitudes Tracker (March 2020, Wave 33, UK)
37
Carbon capture and storage
In March 2020, 46% of people said they were aware of carbon capture and storage, its highest point across the tracker and an increase from 41% in March 2019 (Figure 26). Up until March 2019 levels of awareness had remained between 36% and 41% (Excel Summary Tables, Q15). The proportion of people who have never heard of carbon capture and storage reached its lowest point across the tracker in March 2020 (54%). This has gradually decreased from a high of 64% when the question was first asked in March 2012.
Figure 26: Awareness of carbon capture and storage (based on all people), March 2012 to March 2020
Q15. How much, if anything, do you know about carbon capture and storage?
Bases: All wave respondents – March 2012 to March 2020. (Asked annually.) See technical appendix for base sizes.
Men (56%, compared with 36% of women) and those in social grades AB (63%, compared with 29% of those in social grades DE) were more likely to be aware of carbon capture and storage (Table 8).
0
20
40
60
80
100
Mar 2012(Wave 1)
Mar 2013(Wave 5)
Mar 2014(Wave 9)
Mar 2015(Wave 13)
Mar 2016(Wave 17)
Mar 2017(Wave 21)
Mar 2018(Wave 25)
Mar 2019(Wave 29)
Mar 2020(Wave 33)
Never heard ofit
Aware of it butdon't reallyknow what it is
Know a littleabout it
Know a lotabout it

DRAFT OFFICIAL SENSITIVE BEIS Public Attitudes Tracker (March 2020, Wave 33, UK)
38
Those who said they knew at least a little about carbon capture and storage were asked whether they supported or opposed it (Figure 27). In March 2020, the proportion of people who supported carbon capture and storage remained steady at 62%. The proportion of people who opposed it (6%) and the proportion of people who neither supported nor opposed it (31%) also remained steady.
Figure 27: Whether support or oppose carbon capture and storage (among those who know a lot or a little about carbon capture and storage), March 2013 to March 2020
Q15ai. From what you know, or have heard about using carbon capture and storage in the UK, do you support or oppose its use?
Base: All respondents who know a lot/a little about carbon capture and storage: March 2013 (403), March 2014 (394), March 2015 (374), March 2016 (424), March 2017 (444), March 2018 (422), March 2019 (879), March 2020 (414). (Asked annually).
Levels of support were higher among men (68%, compared with 51% of women) (Table 29).
57 5752 55 54 57
63 62
7 8 6 8 7 6 6 6
3632
39 37 38 3630 31
0
10
20
30
40
50
60
70
80
90
100
Mar 2013(Wave 5)
Mar 2014(Wave 9)
Mar 2015(Wave 13)
Mar 2016(Wave 17)
Mar 2017(Wave 21)
Mar 2018(Wave 25)
Mar 2019(Wave 29)
Mar 2020(Wave 33)
%
Total support Total oppose Neither support nor oppose

DRAFT OFFICIAL SENSITIVE BEIS Public Attitudes Tracker (March 2020, Wave 33, UK)
39
Energy saving and wasting
In March 2020, 80% of the public said they gave at least a fair amount of thought to saving energy in their home. This figure has remained roughly between 70% and 80% since the beginning of the tracker (March 2012). Just over a quarter (27%) said they gave a lot of thought to saving energy in their home, while just over half (53%) said they gave it a fair amount of thought. A fifth (19%) said they gave not very much thought or no thought at all to saving energy in their home. These figures have remained relatively stable over the course of the survey.
Those more likely to give at least a fair amount of thought to saving energy in their home included those who own their property (81%, compared with 74% of private renters).
People were asked whether they engaged in the following energy wasting and saving behaviours:6
• Leave the lights on when you are not in the room (energy wasting)
• Boil the kettle with more water than you are going to use (energy wasting)
• Leave the heating on when you go out for a few hours (energy wasting)
• Wash clothes at 30 degrees or lower (energy saving)
• Try to keep rooms that you are not using at a cooler temperature than those you are using (energy saving).
6 People were not told which behaviours were considered energy saving or energy wasting.

DRAFT OFFICIAL SENSITIVE BEIS Public Attitudes Tracker (March 2020, Wave 33, UK)
40
In March 2020, nearly two thirds of people (65%) said that they at least occasionally boiled the kettle with more water than was needed, an increase from March 2019 (61%) (Figure 28). Just over half (53%) said that they at least occasionally leave the heating on when going out for a few hours, a slight increase from March 2019 (48%). Half (50%) said that they at least occasionally leave the lights on when not in the room.
Figure 28: Frequency of engaging in energy wasting behaviours (based on all people), March 2020
Q4. How often, if at all, do you personally do any of the following…
Base: All wave respondents – March 2020 (1,851)
In March 2020, three in ten (29%) said they engaged in all three energy wasting behaviours. Younger people were more likely to engage in all three energy wasting behaviours (36% of those aged 16 to 24, compared with between 24% and 26% for groups aged 45 and over) (Table 9).
6% 6% 3%
10% 8%5%
15%12%
10%
33%
28%31%
35%
46% 50%
Boil the kettle with more waterthan you are going to use
Leave the heating on whenyou go out for a few hours
Leave the lights on when youare not in the room
Not applicable
Don't know
Never
Occassionally
Quite often
Very often
Always
65% 53% 50%
% who do this at least occasionally

DRAFT OFFICIAL SENSITIVE BEIS Public Attitudes Tracker (March 2020, Wave 33, UK)
41
In March 2020, eight in ten (81%) respondents said that they at least occasionally wash clothes at 30 degrees or lower, an increase from 78% in March 2019 (Figure 29, Excel Summary Tables, Q4). The proportion that tried to keep rooms they weren’t using at a cooler temperature than those they were using remained stable at 78%.
Figure 29: Frequency of engaging in energy saving behaviours (based on all people), March 2020
Q4. How often, if at all, do you personally do any of the following…
Base: All wave respondents – March 2020 (1,851)
25% 25%
16% 19%
19%18%
18%19%
20% 14%
1% 3%1% 2%
Try to keep rooms that you are not using at acooler temperature than those you are using
Wash clothes at 30 degrees or lower
Not applicable
Don't know
Never
Occassionally
Quite often
Very often
Always
78% 81% % who do this at least occasionally

DRAFT OFFICIAL SENSITIVE BEIS Public Attitudes Tracker (March 2020, Wave 33, UK)
42
Smart meters
Awareness of smart meters reached a peak of 89% in March 2020, having gradually increased over the course of the survey (Figure 30). This included 40% who owned a smart meter, which was also at its highest point across the survey in March 2020 at 40%. This continues a pattern of steady increase in smart meter ownership, from an initial base of 6% when this question was first asked in March 2012. Over this period of eight years, the proportion who had never heard of smart meters dropped from 53% in March 2012 to 11% in March 2020 (Excel Summary Tables, Q8).
Figure 30: Awareness of Smart Meters (based on all people) – March 2012 to March 2020
Q8) Before today, had you heard of smart meters?
Bases: All wave respondents – March 2012 to March 2020. (Asked annually, plus September 2016 and September 2017.) See technical appendix for base sizes.
Note: Awareness includes those who said they either own a smart meter or who had heard of this.
Awareness of smart meters was highest among owner occupiers (92%, compared 79% of private renters). Awareness was lowest among those aged 16 to 24 (78%, compared with between 88% and 92% for all other age groups).
47
53
6266
73
8286 88 89
612 14
18 20
2631
3540
5347
3834
27
18 14 12 11
0
20
40
60
80
100
Mar 2012(Wave 1)
Mar 2013(Wave 5)
Mar 2014(Wave 9)
Mar 2015(Wave 13)
Mar 2016(Wave 17)
Mar 2017(Wave 21)
Mar 2018(Wave 25)
Mar 2019(Wave 29)
Mar 2020(Wave 33)
%
Awareness ofsmart meters
Owns a smartmeter
Has neverheard of them

DRAFT OFFICIAL SENSITIVE BEIS Public Attitudes Tracker (March 2020, Wave 33, UK)
43
Energy bills and suppliers
Energy bills
In March 2020, 26% of the public were worried (either very or fairly worried) about paying for energy bills (Figure 31). The level of worry over energy bills has remained relatively stable in recent years after falling steeply from a peak of 59% in March 2013 (Excel Summary Tables, Q16).
To provide a measure of the relative level of worry about energy bills compared with other expenses, people were also asked how worried they were about food and other household shopping costs, transport costs, and mortgage or rent payments. The proportion of people more worried about energy bills than both food and other household shopping bills and transport costs remained stable at 7% in March 2020 (Figure 31)7. This is lower than the peak of 14% observed in December 2013 (Excel Summary Tables, Q16)8.
Figure 31: Worries about energy bills (based on all people), March 2012 to March 2020
Q16. Over the last three months, how worried, if at all, have you been about paying for the following... Energy bills / …Food and other household shopping / …Transport, including petrol/diesel and public transport costs / …Mortgage or rent payments
Q16. % who were very or fairly worried about energy bills and less worried about food and other household shopping and transport costs (derived from Q16)
Bases: All wave respondents – March 2012 to March 2020. (Asked quarterly until 2018, thereafter annually.) See technical appendix for base sizes.
The level of worry about energy bills differed by social grade, with worry highest among those in social grades DE (32%, compared with 18% of those in social grades AB) and private or
7 This is the percentage of people saying they were very or fairly worried about their energy bills and less worried about food and other household shopping bills and transport costs. 8 Figure 31 only includes the results from the March waves of the survey. As such, the figure of 14% from December 2013 is not included on this chart.
5659
49
35
28 30 30 28 26
8
13 12 129 8 7 7 7
0
20
40
60
80
Mar 2012(Wave 1)
Mar 2013(Wave 5)
Mar 2014(Wave 9)
Mar 2015(Wave 13)
Mar 2016(Wave 17)
Mar 2017(Wave 21)
Mar 2018(Wave 25)
Mar 2019(Wave 29)
Mar 2020(Wave 33)
%
Total worried
Total moreworried aboutenergy bills thanother costs

DRAFT OFFICIAL SENSITIVE BEIS Public Attitudes Tracker (March 2020, Wave 33, UK)
44
social private renters (35% and 33% respectively, compared with 22% of home owners) (Table 37).
Those who were more worried about paying for their energy bills than other items were asked their reasons for this. In March 2020, 44% of people felt that energy bills were more expensive than other items, while 37% felt that energy prices had increased more than shopping or transport prices (Table 42).

DRAFT OFFICIAL SENSITIVE BEIS Public Attitudes Tracker (March 2020, Wave 33, UK)
45
Energy suppliers and switching
In March 2020, respondents were asked whether they trusted energy suppliers to do the following:
• Give customers a fair deal
• Provide you with a bill which accurately reflects the energy you have used
• Provide a breakdown of the components of your bill
• Inform you about the best tariff for you
• Improve your home to make it more energy efficient, if you paid them to do this – for example through installing different technologies to reduce heat loss, or generate electricity
• Provide impartial and accurate advice on energy efficiency measures.
People were most likely to trust (a lot or a fair amount) suppliers to provide a bill which accurately reflects energy use (68%) and to provide a breakdown of the components of their bill (68%). They were less likely to trust suppliers to improve their home to make it more energy efficient (49%). Levels of trust in energy suppliers in March 2020 were similar to those in March 2019 (Figure 32; Excel Summary Tables, Q18). In March 2020, 33% of the public trusted (a lot or a fair amount) energy suppliers across all six measures (Table 51).
Figure 32: Trust statements on energy suppliers (based on all people), March 2020
Q18. How much, if at all, do you trust your energy supplier to do the following…
Base: All wave respondents – March 2020 (1,851)
8%
11%
11%
12%
17%
17%
40%
45%
46%
42%
51%
51%
26%
25%
24%
24%
16%
16%
10%
9%
8%
12%
6%
6%
10%
6%
8%
6%
7%
7%
5%
3%
4%
3%
3%
3%
Improve your home to make it more energyefficient, if you paid them to do this
Give customers a fair deal
Provide impartial and accurate advice onenergy efficient measures
Inform you about the best tariff for you
Provide a breakdown of the components ofthe bill
Provide you with a bill which accuratelyreflects the energy you have used
A lot A fair amount Not very much Not at all Don't know Not applicable
% who trust a lot/a fair amount % who trust not very much/not at all
68% 22%
68% 22%
55% 36%
57% 32%
34%56%
49% 36%

DRAFT OFFICIAL SENSITIVE BEIS Public Attitudes Tracker (March 2020, Wave 33, UK)
46
Social renters (40%) were more likely than private renters and owner occupiers (32%) to trust energy suppliers across all six measures (Table 51).
People were asked about their history of switching gas or electricity supplier. In March 2020, 21% of people said they had switched supplier in the last year (Figure 33). This has gradually increased from 15% over the last four years to the highest level since the survey started (Excel Summary Tables, Q17a). Just over a third (35%) had switched supplier more than a year ago and a further 38% had never switched supplier.
Figure 33: Whether respondent has switched supplier (based on all people), March 2012 to March 2020
Q17a) Thinking about your gas and electricity supplier, which of the following best describes your current situation?
Base: All wave respondents – March 2020 (1,851)
Those in social grades AB (29%, compared with 15% of those in social grade DE) were more likely to have switched in the last year.
41
4543 43 42
4844
4138
3936 37
3539
31 32 33
35
15 16 15 16 1517 18
20 21
0
20
40
60
Mar 2012(Wave 1)
Mar 2013(Wave 5)
Mar 2014(Wave 9)
Mar 2015(Wave 13)
Mar 2016(Wave 17)
Mar 2017(Wave 21)
Mar 2018(Wave 25)
Mar 2019(Wave 29)
Mar 2020(Wave 33)
%
I have neverswitchedsupplier
I have switchedsupplier butmore than ayear ago
I have switchedsupplier in thelast year

DRAFT OFFICIAL SENSITIVE BEIS Public Attitudes Tracker (March 2020, Wave 33, UK)
47
Corporate trust and transparency
BEIS is also responsible for the policy area of corporate trust and transparency. To measure attitudes towards this, the public were asked how much they trust large financial and legal businesses to:
• Treat all their employees fairly
• Be open and honest in their dealings with customers
• Act in a socially responsible way
• Tell the truth
• Be open and honest about how much tax they pay
On the whole, people were more distrusting than trusting for each of these measures; less than 5% of people trusted these businesses a great deal for each of the measures and at least 49% said they did not have much or any trust for each of them (Figure 34). These figures were similar to those observed in March 2019 (Excel Summary Tables, Q190).
Figure 34: Trust statements on large businesses (based on all people), March 2020
Q190. Please now think about large financial and legal businesses, such as larger accountancy, law and banking firms. How much do you trust these types of businesses in the UK to …tell the truth / …be open and honest in their dealings with customers / …act in a socially responsible way / …be open and honest about how much tax they pay /…treat all their employees fairly
Base: All wave respondents – March 2020 (1,851)
The public were most likely to trust (a great deal or to some extent) these businesses to treat employees fairly (45%, up from 42% in March 2019), to be open and honest in their dealings with customers (40%) and to act in a socially responsible way (40%). They were least likely to
3% 3% 4% 3% 2%
42% 37% 37%31%
23%
30%34% 33%
37%
34%
19% 20% 21% 24%
35%
7% 5% 5% 5% 6%
Treat all theiremployees
fairly
Act in a sociallyresponsible
way
Be open andhonest in theirdealings with
customers
Tell the truth Be open andhonest abouthow much tax
they pay
Don't know
Do not trustthem at all
Do not havemuch trust
Trust tosome extent
Trust them agreat deal
45%
49% 54%
40%
55%
40%
61%
34% 25%
69%
% who do not trust businesses to do this
% who trust businesses to do this

DRAFT OFFICIAL SENSITIVE BEIS Public Attitudes Tracker (March 2020, Wave 33, UK)
48
trust these businesses to be open and honest about how much tax they pay (25%). Under two in ten respondents (17%) trusted businesses on all five of these measures (Table 105), with 36% of respondents saying they did not trust businesses on all five of these measures (Table 106).

DRAFT OFFICIAL SENSITIVE BEIS Public Attitudes Tracker (March 2020, Wave 33, UK)
49
Office for Product Safety and Standards
In March 2020, people were asked questions to understand public awareness and trust in the Office for Product Safety and Standard (OPSS). They were first presented with a list of consumer organisations and public authorities and asked which, if any, they had heard of. The proportion of respondents that were aware of OPSS remained similar to March 2019 at 17% (Figure 35).
Respondents were most likely to be aware of Citizens Advice (78%, down from 85% in March 2019), Trading Standards (72%, down from 75% in March 2019) and Ofcom (67%, down from 71% in March 2019). Levels of awareness have decreased for all other organisations, apart from Resolver (8%, up from 6% in March 2019).
Figure 35: Whether heard of different types of consumer organisations or public authorities, March 2020
Q200. The screen shows a list of consumer organisations and public authorities that protect consumers or provide information or help if things go wrong. Which organisations have you heard of?
Note: The answer category Office of Fair Trading (OFT) was replaced with the Competition and Market Authority (CMA) in March 2020.
Base: All wave respondents – March 2020 (1,851)
Owner occupiers (20%, compared with 11% of private renters and 12% of social renters) were more likely to be aware of the OPSS (Table 107).
3%
9%
8%
17%
19%
49%
62%
63%
67%
72%
78%
Don't know
None of these
Resolver
Office for Product Safety and Standards(OPSS)
Competition and Markets Authority (CMA)
British Standards Institute (BSI)
Which?
Ombudsman
Ofcom
Trading Standards
Citizens Advice/CAB

DRAFT OFFICIAL SENSITIVE BEIS Public Attitudes Tracker (March 2020, Wave 33, UK)
50
Those that had heard of the OPSS were asked:
• In what ways they had seen or read about the OPSS
• Whether they trust the OPSS to protect consumers from unsafe products
Of those that had heard it OPSS, people were most likely to have read about the OPSS in a newspaper or seen something on TV (29%). Some said they had read guidance published about the OPSS (18%), had seen an advert (17%), had heard about it through work (12%), or had visited the OPSS website (10%). Of those people who had heard of the OPSS, 9% said they had not seen or read anything about it (Table 108).
In March 2020, more than eight in ten (85%) of those who had heard of the OPSS said they either trusted it a great deal (25%) or to some extent (60%). However, 8% said they did not have much trust in the OPSS and 2% said they had no trust at all (Table 110).

DRAFT OFFICIAL SENSITIVE BEIS Public Attitudes Tracker (March 2020, Wave 33, UK)
51
Technical information
Technical notes
The wave 33 report provides selected headline findings and highlights statistically significant differences at the 95% level between wave 33 and previous waves, and between subgroups for wave 33.
Percentages included on charts in this report may not add up to 100% due to rounding, the exclusion of some categories (e.g. ‘Don’t know’ and ‘Refused’) and the option for more than one response to be selected at some questions. Similarly, percentages based on aggregating categories (for example ‘strongly support’ and ‘support’) may not always reflect the sum of the individual answer categories.
This report is not an exhaustive overview of the findings. Please refer to the accompanying Excel summary tables, Excel dataset and PDF/Excel cross tabulation tables to see full responses to all survey questions.
The results shown here for wave 33 are based on 1,851 face-to-face in-home interviews conducted with a representative sample of UK adults aged 16+. Fieldwork was conducted between 11 March and 17 March 2020 on the Kantar UK Omnibus which uses a random location sample approach.
Fieldwork for this wave stopped early due to the outbreak of Coronavirus (COVID-19) in the UK, and the associated lockdown measures. As such, the sample size for this wave is lower than previous waves. Although the fieldwork took place before full lockdown measures had been implemented, it is unclear what effect the COVID-19 outbreak and associated media coverage during fieldwork may have had on public behaviours, attitudes and perceptions towards the topics in this report. These factors should be taken into consideration when using these results for analysis.
Most questions included at wave 33 had been asked in at least one previous wave. The exception is the question on Net Zero, which was introduced at wave 33.
The representativeness of the data was controlled through sample design, fieldwork quotas and post-fieldwork weighting. Data were weighted for the following characteristics: sex, age, social grade, region and tenure. Results included here are based on data which have been weighted to reflect the UK population aged 16+.
The Kantar UK omnibus uses a random location sampling approach, with a unique sampling system developed by Kantar for this purpose. Random Location sampling is a high-quality form of quota sampling. The principal distinguishing characteristic of random location sampling is that interviewers are given very little choice in the selection of respondents. Respondents in each interviewer assignment are drawn from a small set of homogenous streets. Quotas are set in terms of characteristics which are known to have a bearing on individuals' probabilities of being at home and so available for interview. Rules are given which govern the distribution spacing and timing of interviews.

DRAFT OFFICIAL SENSITIVE BEIS Public Attitudes Tracker (March 2020, Wave 33, UK)
52
With these types of sample, the accuracy of estimates is conditional on the assumption that the combined effects of sampling, fieldwork protocols, quota application, and weighting have successfully eradicated biasing selection effects on the data. However, this assumption is untestable without substantial – and impractical – expenditure on collecting benchmark data using a random probability sampling approach.
The steps we have taken to minimise the risk of bias are as follows:
• The sample is drawn from the Postcode Address File (PAF). To ensure that the sample points selected are representative of the geographic profile of the UK population, stratification is done by region. A representative set of Primary Sampling Units (PSUs) are selected for the omnibus survey to use in 2020.
• Interviewers are given a block of addresses to work for each sample point. Interviewers are instructed to contact addresses within their block systematically to obtain their target of interviews. The tight geographic control limits interviewer choice, and therefore reduces sample bias.
• Quotas are used to ensure a range of respondent types are recruited, and to combat the natural variation in response propensity (both contact and co-operation) among the local population. For this study, quotas were set based on gender, age and working status. Although it should be noted that the coronavirus outbreak interrupted fieldwork before the full omnibus wave was completed.
• The weighting scheme for this study has been designed to correct for observed imbalances in demographic variables which are associated with key survey outcomes.
There was a concern that there may have been other imbalances in the sample which could have meant that this wave would not be comparable with previous waves of the tracker. Therefore, additional checks were conducted to compare the demographic profile of the weighted wave 33 sample with the weighted profile of the preceding waves. This confirmed that the sample profile was broadly consistent with previous waves of the study, and that trend analysis would still be robust. The characteristics included in this check were:
• Marital Status
• Employment Status
• Presence of children in the household
• Household Size
• Property Type
• Main way property is heated
• Whether connected to mains gas in the property
• Whether uses mains gas
• Presence of pensioners in the household
• Whether anyone in the household has a long-standing illness, disability, or infirmity
The variables included in the weighting matrix (and the source of the benchmark statistics for waves 30-33) were as follows:

DRAFT OFFICIAL SENSITIVE BEIS Public Attitudes Tracker (March 2020, Wave 33, UK)
53
• Age by Gender - ONS Mid-Year Population Estimates 2018
• Region (former Government Office Region) - ONS Mid-Year Population Estimates 2018
• Social Grade – Kantar TGI (Jan 18 - Dec 18)
• Housing tenure - ONS Annual Population Survey (Jan 18 - Dec 18)
It should be noted that the weighting only corrects for observed bias (for the set of variables included in the weighting matrix) and there is a risk of unobserved bias. Furthermore, the raking algorithm used for the weighting only ensures that the sample margins match the population margins. There is no guarantee that the weights will correct for bias in the relationship between the variables.
More detailed information can be found in the technical note. This is available at: https://www.gov.uk/government/publications/beis-public-attitudes-tracker-technical-note

DRAFT OFFICIAL SENSITIVE BEIS Public Attitudes Tracker (March 2020, Wave 33, UK)
54
Fieldwork dates and sample sizes
Wave Fieldwork dates Sample sizes
Wave 1 (Mar 2012) 21 to 25 March 2012 2,121
Wave 2 (Jun 2012) 27 June to 1 July 2012 2,100
Wave 3 (Sep 2012) 26 to 30 September 2012 2,118
Wave 4 (Dec 2012) 12 December 2012 to 2 January 2013
2,107
Wave 5 (Mar 2013) 27 to 31 March 2013 2,051
Wave 6 (Jul 2013) 3 to 7 July 2013 2,124
Wave 7 (Sep 2013) 25 to 29 September 2013 2,103
Wave 8 (Dec 2013) 11 to 15 December 2013 2,110
Wave 9 (Mar 2014) 26 to 30 March 2014 2,040
Wave 10 (Jun 2014) 25 to 29 June 2014 2,087
Wave 11 (Sep 2014) 24 to 28 September 2014 2,103
Wave 12 (Dec 2014) 10 December 2014 to 8 January 2015
2,119
Wave 13 (Mar 2015) 18 to 29 March 2015 1,981
Wave 14 (Jun 2015) 24 to 28 June 2015 2,118
Wave 15 (Sep 2015) 23 to 27 September 2015 2,121
Wave 16 (Dec 2015) 9 to 13 December 2015 2,121
Wave 17 (Mar 2016) 23 to 27 March 2016 2,105
Wave 18 (Jun 2016) 29 June to 3 July 2016 2,114

DRAFT OFFICIAL SENSITIVE BEIS Public Attitudes Tracker (March 2020, Wave 33, UK)
55
Wave 19 (Sep 2016) 28 September to 2 October 2016 2,080
Wave 20 (Dec 2016) 14 to 18 December 2016 2,138
Wave 21 (Mar 2017) 29 March to 2 April 2017 2,180
Wave 22 (Jun 2017) 30 June to 4 July 2017 2,097
Wave 23 (Sep 2017) 27 September to 1 October 2017 2,105
Wave 24 (Dec 2017) 13 to 17 December 2017 2,078
Wave 25 (Mar 2018) 28 March to 6 April 2018 2,102
Wave 26 (Jul 2018) 11 to 17 July 2018 4,2689
Wave 27 (Sep 2018) 19 to 30 September 2018 4,258
Wave 28 (Dec 2018) 5 to 16 December 2018 4,273
Wave 29 (Mar 2019) 13 to 24 March 2019 4,224
Wave 30 (Jun 2019) 5 to 16 June 2019 4,231
Wave 31 (Sep 2019) 11 to 22 September 2019 4,201
Wave 32 (Dec 2019) 4 to 22 December 2019 4,212
Wave 33 (Mar 2019) 11 to 17 March 2020 1,851
9 The sample size increased to c. 4,200 from Wave 26 (July 2018) onwards to allow greater scope for regional analysis.

DRAFT OFFICIAL SENSITIVE BEIS Public Attitudes Tracker (March 2020, Wave 33, UK)
56
Definitions
Base The number of people answering a survey question.
Carbon capture and storage
The process of capturing and storing carbon dioxide (CO2) emissions produced from the use of fossil fuels before it is released into the atmosphere.
Climate change Long-term shift in the planet’s weather patterns and rising average global temperatures.
Cognitive testing An in-depth interviewing method to determine the reliability and validity of survey questions.
Condensing boilers Water heating appliances that are run on either gas or oil, to improve energy efficiency.
Corporate trust and transparency
Public trust in UK corporations to tell the truth, to be open and honest in their dealings with customers, to act in a socially responsible way, to be open and honest about how much tax they pay, and to treat their employees fairly.
Energy infrastructure
A term used to capture a range of different energy sources that are covered by the survey and the interconnections between them. This includes a range of renewable sources (on-shore and off-shore wind, solar, wave and tidal, and biomass), nuclear, shale gas, and carbon capture and storage as well as the pipeline and other interconnectors between them.
Energy security The UK’s ability to secure sufficient, affordable, and consistent energy supplies.
Fieldwork The period where face-to-face interviews are conducted.
Net Zero Net zero means that the UK’s total greenhouse gas (GHG) emissions would be equal to or less than the emissions the UK removed from the environment. This can be achieved by a combination of emission reduction and emission removal. The new Net Zero target was announced by the government in June 2019, which requires the UK to bring all greenhouse gas emissions to net zero by 2050.
Nuclear energy The energy released during nuclear fission or fusion, mainly to generate electricity.
Omnibus survey A method of quantitative survey research where data on a wide variety of subjects submitted by a range of funders is collected during the same interview.
OPSS The Office for Product Safety and Standards. The OPSS identifies consumer risks and reinforces the UK’s safety standards to protect consumers when products need to be repaired or replaced.
Quotas A target number of interviews for a certain characteristic during survey fieldwork (e.g. age).

DRAFT OFFICIAL SENSITIVE BEIS Public Attitudes Tracker (March 2020, Wave 33, UK)
57
Random location quota sampling
A form of quota sampling that combines elements of random sampling and quota sampling. Once a random sample is drawn, interviewers are tasked with interviewing a range of sub-groups across different timing patterns based on a pre-agreed number of respondents.
Representativeness Similarity of the sample profile to benchmark population statistics, such as the Office for National Statistics mid-year population estimates.
Sample size The number of people included in the sample (a subset of the population).
Shale gas and fracking
Shale gas is natural gas found in shale, a non-porous rock which does not allow the gas to escape. Hydraulic fracturing or “fracking” is a process of pumping water at high pressure into shale to create narrow fractures which allow the gas to be released and captured. The gas can then be used for electricity and heating.
Social grade Social grade is a classification system based on occupation. It contains the following categories:
A: Higher managerial, administrative and professional
B: Intermediate managerial, administrative and professional
C1: Supervisory, clerical and junior managerial, administrative and professional
C2: Skilled manual workers
D: Semi-skilled and unskilled manual workers
E: State pensioners, casual and lowest grade workers, unemployed with state benefits only
Statistical significance
A statistical test to determine whether relationships observed between two survey variables are likely to exist in the population from which the sample is drawn. We only report on findings that are statistically significant at the 95% level.
Survey outputs The key deliverables from the survey. This includes:
A key finding report, presenting summary headline findings from September 2019.
Summary tables (Excel), showing trends across all waves of the tracker.
An Excel dataset containing questionnaire variables, demographic variables and derived variables for further analysis. An SPSS version of the dataset is available upon request.
Excel label data (CSV), containing labels for all variables.
Excel numeric data (CSV), containing numeric values for all variables.

DRAFT OFFICIAL SENSITIVE BEIS Public Attitudes Tracker (March 2020, Wave 33, UK)
58
Cross tabulation tables (PDF and Excel) for the current wave, including demographic and key question sub-group comparisons for all questions.
Weighting An adjustment made to the data to ensure that survey results are representative of the target population (in this case, all UK adults).

DRAFT OFFICIAL SENSITIVE BEIS Public Attitudes Tracker (March 2020, Wave 33, UK)
59
Further information
Future updates to these statistics
Results from the Public Attitudes Tracker are published quarterly. The next release is scheduled to be published on 6 August 2020. Note that not all Tracker questions are included in each wave.
Revisions policy The BEIS statistical revisions policy sets out the revisions policy for these statistics, which has been developed in accordance with the UK Statistics Authority Code of Practice for Statistics.
Related Statistics
There are various other surveys which seek the general public’s opinion on topics related to those covered by the BEIS Public Attitudes Tracker. These include:
Public Attitudes to Science
A collection of studies looking at the UK public’s attitudes to science, scientists and science policy.
Public attitudes towards transport
The department for transport publishes a wide range of reports on the public’s attitude to various modes of transport.
Biannual Public Attitudes Tracker - Food Standards Agency
This survey monitors changes in consumer attitudes to food-related issues in England, Wales and Northern Ireland.
The English Housing Survey
The English Housing Survey is a continuous national survey commissioned by the Ministry of Housing, Communities and Local Government (MHCLG). It collects information about people’s housing circumstances and the condition and energy efficiency of housing in England. There are some waves of the PAT which cover similar topics such as the number of households with condensing boilers.
BEIS also publishes a wealth of energy statistics which provide context for the attitude data collected by the PAT. These are available on the Statistics at BEIS website.

DRAFT OFFICIAL SENSITIVE BEIS Public Attitudes Tracker (March 2020, Wave 33, UK)
60
Uses of these statistics
These statistics are used by BEIS to guide BEIS policy, by many academics in their related studies, by ministers and by the general public. Some examples on the uses of previous waves of the PAT include
• Monitoring attitudes towards fracking by policy makers, the media and local groups to understand how this is changing over time and the reasons why people support or oppose it.
• Understanding public awareness of key BEIS policies such as the concept of clean growth.
• Monitoring public attitudes to climate change and government policies associated with this and understanding how concern varies between demographic groups.
• Understanding public acceptability of different renewable energy sources which contribute to the government’s aim to reduce the dependence on fossil fuels.
User engagement Users are encouraged to provide comments and feedback on how these statistics are used and how well they meet user needs. Comments on any issues relating to this statistical release are welcomed and should be sent to: [email protected].
The BEIS statement on statistical public engagement and data standards sets out the department’s commitments on public engagement and data standards as outlined by the Code of Practice for Statistics.
Pre-release access to statistics Some ministers and officials receive access to these statistics up to 24 hours before release. Details of the arrangements for doing this and a list of the ministers and officials that receive pre-release access to these statistics can be found in the BEIS statement of compliance with the Pre-Release Access to Official Statistics Order 2008.
Contact
• Responsible statistician: Stephen Kelly
• Email: [email protected]
• Media enquiries: 020 7215 1000; [email protected]
• Public enquiries: 020 7215 5000

© Crown copyright 2020
This publication is licensed under the terms of the Open Government Licence v3.0 except where otherwise stated. To view this licence, visit nationalarchives.gov.uk/doc/open-government-licence/version/3 or write to the Information Policy Team, The National Archives, Kew, London TW9 4DU, or email: [email protected].
Where we have identified any third-party copyright information you will need to obtain permission from the copyright holders concerned.
This publication is available from: https://www.gov.uk/government/collections/public-attitudes-tracking-survey
If you need a version of this document in a more accessible format, please email [email protected]. Please tell us what format you need. It will help us if you say what assistive technology you use.