
Being a Public Company: Public Debt or Public...
48
Being a Public Company: Public Debt or Public Equity? by Elazar Berkovitch IDC, Herzeliya Ruth Gesser University of Haifa Oded Sarig * IDC, Herzeliya and the Wharton School Abstract We examine the choice of security with which to be public. We find that many firms are public only with debt and that they are significantly different from firms that are public with equity. We also find that firms often move from being public with one security to being public with another security as their characteristics change. Public Equity firms have more volatile sales and return on assets, higher R&D intensity, lower fraction PP&E, and are more profitable than Public Debt firms. Firms with significant investments and R&D intensity are more likely to be public with equity than with debt. Firms that transition from being private to being public have abundant cash and pay significant dividends both before and after the transition. We interpret our results as indicating that agency and information collection motives dominate information asymmetry considerations in the private-public decision. JEL classification: G14, G32, G34 Key words: Public Equity, Public Debt ______________________________ * Corresponding author: Oded Sarig, IDC, P.O. Box 167, Herzeliya 46150, Israel; phone: +972-9-9527575; fax: +972-9-9527218; email: [email protected] . We would like to thank Yakov Amihud, Simon Benninga, Jacob Boudoukh, Roni Michaely, Amir Ziv, and seminar participants at IDC, the Hebrew University, Tel Aviv University, University of Haifa, and the Wharton School for helpful comments and suggestions.
Transcript of Being a Public Company: Public Debt or Public...
Being a Public Company:
Public Debt or Public Equity?
by
Elazar Berkovitch
IDC, Herzeliya
Ruth Gesser University of Haifa
Oded Sarig*
IDC, Herzeliya and the Wharton School
Abstract
We examine the choice of security with which to be public. We find that many firms are
public only with debt and that they are significantly different from firms that are public
with equity. We also find that firms often move from being public with one security to
being public with another security as their characteristics change. Public Equity firms
have more volatile sales and return on assets, higher R&D intensity, lower fraction
PP&E, and are more profitable than Public Debt firms. Firms with significant
investments and R&D intensity are more likely to be public with equity than with debt.
Firms that transition from being private to being public have abundant cash and pay
significant dividends both before and after the transition. We interpret our results as
indicating that agency and information collection motives dominate information
asymmetry considerations in the private-public decision.
JEL classification: G14, G32, G34
Key words: Public Equity, Public Debt ______________________________
* Corresponding author: Oded Sarig, IDC, P.O. Box 167, Herzeliya 46150, Israel; phone: +972-9-9527575;
fax: +972-9-9527218; email: [email protected]. We would like to thank Yakov Amihud, Simon Benninga,
Jacob Boudoukh, Roni Michaely, Amir Ziv, and seminar participants at IDC, the Hebrew University, Tel
Aviv University, University of Haifa, and the Wharton School for helpful comments and suggestions.
2
Being a Public Company: Public Debt or Public Equity?
Introduction
Being public has long been identified with issuing equity to public investors.
Many features of becoming a public firm by issuing equity, however, are relevant for
firms that choose to become public by issuing debt. These features include reporting
requirements, observable security prices, improved access to financial markets, dealing
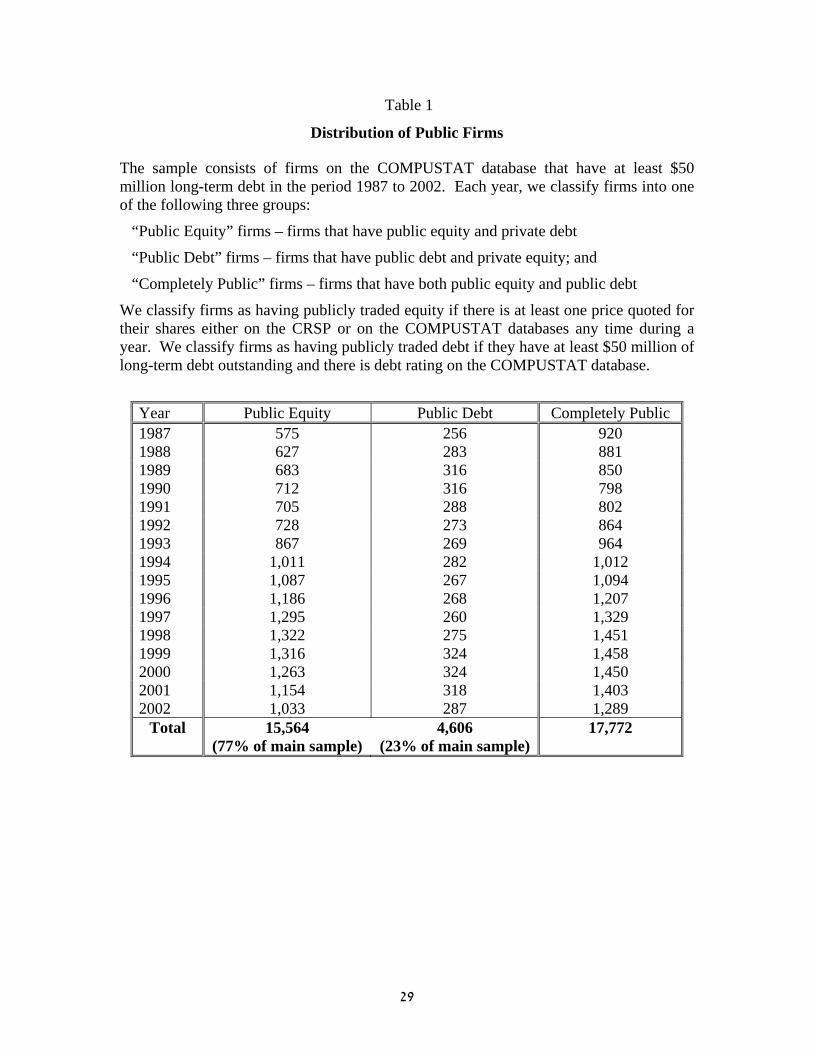
with many security holders, etc. Indeed, as Table 1 below shows, about a quarter of the
firms which are public with one security – either debt or equity – issue only debt to
public investors, presumably having considered both alternatives. Moreover, as Table 3
shows, firm change their status as a public company – with public debt or with public
equity – as their characteristics change. Hence, in this paper, we expand the private-
public decision to include the choice of security with which to be public. We compare
the characteristics of both types of public firms and examine the determinants of this
choice. In this analysis, we utilize the fact that both types of public firms are required to
file standardized financial reports, which are scrutinized by the SEC and are available on
the COMPUSTAT database. In some instances, this comparison also sheds light on the
decision to go public in the first place.
The theoretical literature on the private-public decision does not explicitly analyze
the optimal security that firms should use to become public. Rather, the analysis is
carried in two separate routes – one for equity and one for debt. Yet, these separate
analyses suggest similar determinants of the being public decision: information

3
asymmetry, monitoring, agency costs, transaction costs, etc.1 The similarity of the
separate analyses of equity and debt issuance probably stems from the similarity of the
salient features of public issuance of a security, whether equity or debt. To wit, public
issuance of a security entails a larger number of security holders than a private
placement, improves access to financial markets and liquidity, makes security values
readily observable, and necessitates making private information available to the public.
Therefore, when firms decide to become public, they face similar tradeoffs whether they
decide to issue equity or debt. Yet, the tradeoffs are not identical due to the different
characteristics of debt and equity and their markets. Indeed, the difference between
publicly traded equity and debt is highlighted in the analysis in Fulghieri and Lukin
(2001) who highlight the differential information generated by the respective security
holders.
Similar to the separation of the theoretical analysis of public issuance of debt and
equity, most of the empirical analysis of the decision to be public examines separately the
decision with regard to equity and to debt. While the evidence relating to the decision to
issue public equity is scarce due to lack of data about private firms (Pagano, Panneta, and
Zingales 1998 analysis of Italian data is a notable exception), the evidence regarding
issuance of public debt is much wider. Several empirical studies examine debt issuance
decisions by firms with public equity (e.g., Houston and James 1996, Krishnaswami,
Spindt and Subramaniam 1999, Cantillo and Wright 2000, Datta, Iskandar-Datta and
Patel 2000, and Denis and Mihov 2003). Similarly, Gomes and Phillips (2004) examine
1 Compare, for example, the analysis of going public with equity in Benveniste and Spindt (1989), Chemmanur and Fulghieri (1994, 1999), Zingales (1995), Maug (2001), and Maksimovitch and Pichler (2001) to the analysis of the choice between “arms-length” debt and “relationship” debt in Diamond (1989, 1991) and Rajan (1992), among others.

4
several security issues – equity, debt, and convertible bonds – by firms with public
equity. The Gomes and Phillips (2004) analysis is closest in spirit to ours. Their analysis
differs from ours, however, since they examine each issuance decision independent of
other issuance decisions and the overall public-private status of the firm while we
examine the overall decision to have public debt or public equity.
We analyze the private-public decision separately from the analysis of the optimal
capital structure. This is because the optimal capital structure decision can be
implemented with both public and private securities. For example, if the firm optimally
should increase its leverage to minimize taxation, it will be able to do so both with
private debt and with public debt. Hence, such a firm will decide its private-public status
independent of its decision to increase leverage. Moreover, to the extent that the two
decisions interact, we control for the leverage choices of the sample firms in our analysis
of the private-public decision.
A company determines the security to be public with based on the marginal
differences between the costs and benefits of having publicly traded debt or equity. The
focus of our analysis is on these differences, which are explicated in the following
section. Specifically, we compare firm characteristics that are related to information
asymmetries, control, monitoring, information gathering needs, and agency
considerations using the COMPUSTAT database in the period 1987-2002. We refer to
firms that have public equity while their debt is private as “Public Equity firms” and to
firms that have public debt while their equity is private as “Public Debt firms”. Firms
with both public equity and public debt are called “Completely Public firms” and firms
with no public security are called “Private firms”.
5
In addition to examining the cross-sectional differences between Public Debt
firms and Public Equity firms, we also conduct a time-series analysis of firms that
transition from being private to being public. This test is possible because
COMPUSTAT back-fills data for firms that become public (and, hence, enter the
COMPUSTAT database) for fiscal years preceding the year in which they become public.
In this analysis, we compare changes in characteristics of firms that choose to become
public with equity to changes in characteristics in firms that choose to become public
with debt around the transition time.
Lastly, since some of the hypotheses we examine may be affected by the presence
of financial constraints, we explicitly examine whether financial constraints impact our
results. We do so by restricting our analysis to a subset of firms for which we have
positive proof that they are not financially constrained. As we explain in detail later, we
take firms to be financially unconstrained when they have significant cash reserves and
pay dividends.
We find that Public Equity firms have higher sales volatility, higher volatility of
returns on assets, higher R&D intensity, and lower fraction of assets in place than Public
Debt firms. These differences suggest that Public Equity firms are exposed to more
information asymmetry than Public Debt firms. Moreover, we find the same differences
for firms that are not financially constrained, which means that our findings are not
driven by these constraints. We also find that firms with significant investment
opportunities are more likely to be public with equity than with debt. This suggests that
these firms value the information provided by stock prices more than they value the
information provided by bond prices. Lastly, we find that firms that transition from being

6
private to being public have abundant cash and pay significant dividends both before and
after the transition. This is true for both Public Equity and Public Debt firms. We
interpret our results as indicating that information asymmetry motives for issuing
securities to public investors (e.g., the Pecking Order hypothesis) are inconsistent with
the data. Rather, the data are consistent with firms incorporating agency and information
collection motives in their private-public decisions.
The remainder of the paper is organized as follows. In Section I, we discuss the
tested hypotheses, in Section II we present the data, in Section III we present the results,
and in Section IV we present our conclusions.
I. Hypotheses
In this section, we develop testable hypotheses that are based on the differential effects
on debt and equity of the theorized determinants of the private-public decision.
Specifically, the effects we examine are information asymmetry, information acquisition,
monitoring, agency relations, and transaction costs.
Firms in our sample have the choice of issuing both debt and equity (public or
private). Therefore, their issuance decisions may be affected by capital structure
considerations. However, since firm can obtain the same capital structure by issuing
either private or public securities, we separate the choice of an optimal capital structure
from the choice of being public. Our premise is that if a firm chooses to issue public debt
over private debt, it does so because of the different characteristics between a private
security and a public security, and not because of capital structure considerations. That
is, if the optimal capital structure of a firm calls for a certain level of debt (e.g., to signal

7
firm value or to minimize tax payments), both private debt and public debt can be issued.
To ensure that our results are not driven by leverage choice, we control for leverage in
our analysis of the choice between being a Public Equity firm or a Public Debt firm.
Our analysis effectively decomposes the decision to be public into two
components: given that a firm chooses to be public, which security – debt or equity – is
issued and, based on this analysis, what are the determinants of the overall decision to be
public. The focus of our analysis is on the first component of the decision – the
comparison of firms that choose to be public with equity to firms that choose to be public
with debt. As we discuss bellow, some of the results of this analysis shed light on the
second component of the decision – why firms choose to be public in the first place.
Some of the benefits and costs of being public are equal for equity and for debt
issuance. For example, once a firm becomes public, by issuing either debt or equity, it is
obliged to publish a prospectus and its annual reports thereafter, thereby revealing
important information to its competitors. On the other hand, some of the benefits and
costs of issuing a security to the public depend on whether the issued security is debt or
equity. These differences are outlined below and serve as our basis for forming testable
hypotheses.
Consider first the effect of asymmetric information on the private-public decision.
A firm that decides to be public bears the cost of information asymmetry. Myers and
Majluf (1984) argue that, since information affects equity more than debt, information
asymmetry costs are greater for equity than for debt. Therefore, holding constant the
chosen capital structure and other reasons for being public, firms are more likely to be

8
public with debt when information asymmetry is high and to be public with equity when
asymmetry is low.
Note that the Pecking Order hypothesis does not necessarily apply to financially
constrained firms. Therefore, in our empirical work, we explicitly test for the potential
impact of financial constraints. Furthermore, Fulghieri and Lukin (2001) show that,
when information production is endogenous, the Pecking Order may be reversed if
information costs are sufficiently low. Indeed, our results do not support the Pecking
Order hypothesis even after we control for financial constraints.
The decision to be public also affects the ability of managers to acquire
information. Specifically, when firm securities are publicly traded, their prices reveal to
managers information that investors have. Managers can use this price information to
improve corporate decisions (e.g., Benveniste and Spindt 1989, Habib and Johnsen 2000,
and Maug 2001). Choosing to be public with equity or with debt affects the information
that can be inferred from market prices. This is because equity is typically more sensitive
to information and more actively traded than debt so that stock prices better continuously
reflect investor information than debt prices. Therefore, holding constant the optimal
capital structure and other reasons to be public, we expect firms that have much use for
price information will be public with equity and firms with low use for price information
will be public with debt.
The above analysis of the differential impact of information on the decision to go
public with debt or equity suggests the following hypotheses:
H1: Public Debt firms are exposed to more information asymmetry than Public
Equity firms
9
H2: Public Equity firms have more use for security price information than
Public Debt firms
In our empirical analysis, we measure the extent of information asymmetry (in the
tests of H1) by four proxies. The first two proxies – volatility of sales (VSALES) and
volatility of the return on assets (VROA) – measure the extent of uncertainty about firm
operations. The intuition is that firms with high uncertainty about their operations are
also firms with high potential for information asymmetry. The third proxy for
information asymmetry is R&D intensity (R&D). The intuition for this proxy is that
results of R&D efforts are known internally but not externally. The last proxy is the
fraction of tangible assets to total assets (PP&E). The intuition for this proxy is that there
is less information asymmetry about tangible assets than about intangible assets, so that
PP&E is negatively correlated with the extent of information asymmetry.
We test the hypothesis that Public Equity firms have more use for security price
information than Public Debt firms (H2) by focusing on firm investment decisions. The
intuition is that firms that need to make significant investment decisions place more value
on security price information than firms that do not need to make such decisions.
Accordingly, we proxy for the usefulness of security price information by the magnitude
of investments a firm makes as a fraction of its total assets (CAPX) and by the intensity
of its R&D activity (R&D).
Next, consider monitoring and agency costs. Given the choice of capital
structure, the decision to issue securities to the public (rather than to private investors)
differentially affects high quality and low quality managers. On the one hand, low
quality managers who finance their firms with public equity expose themselves to hostile

10
takeover risk.2 This implies that, ceteris paribus, managers of Public Equity firms are of
better quality than managers of Public Debt firms. On the other hand, issuing debt to the
public means that the debt will be rated by rating agencies, which gain access to private
information. Issuing equity, however, does not provide investors or analysts with such
inside information. Thus, the counter argument implies that, ceteris paribus, managers of
Public Equity firms are of worse quality than managers of Public Debt firms (Verrecchia
1983).
Agency considerations in the form of asset substitution also affect the decision to
be public with equity or with debt. Consider a firm that has substantial opportunities to
shift risk. Such opportunities allow shareholders to increase firm risk ex post – once debt
has been issued – and to transfer wealth from debt holders to themselves (c.f., Jensen and
Meckling 1976). Public debt holders, who cannot closely monitor risk shifting or recall
loans, price public debt assuming that the issuer will engage in risk increasing activity.
Private debt holders, on the other hand, can better monitor and recall debt than public
debt holders when shareholders increase risks. Moreover, risk-shifting incentives do not
arise with public issuance of equity. Thus, ex ante, a firm with substantial risk shifting
opportunities that decides to be public prefers to have its equity (rather than its debt)
publicly traded to minimize agency costs.
Holding constant the optimal capital structure and other reasons to be public, the
discussion of agency relations and monitoring leads to the following hypotheses:
H3: Public Debt firms are of worse/better quality (based on control vs.
monitoring theories) than Public Equity firms
2 Obviously, this implicitly assumes that insiders do not retain more than 50% of their firms’ equity.
11
H4: Public Debt firms are exposed to fewer risk shifting opportunities than
Public Equity firms
To measure the quality of the firm (in the tests of H3), we use a proxy that
measures firms’ operating profitability – the return on assets (ROA). We deliberately
choose not to use measures of shareholder returns (e.g., ROE) to avoid using a proxy for
firm quality that is affected by leverage and issuance decisions of firms.
In our empirical analysis, we measure shareholders’ ability to shift risk (H4) by
four proxies. The first three proxies – volatility of sales (VSALES), volatility of the
return on assets (VROA), and R&D intensity (R&D) – measure the fundamental
uncertainty of the firm. Intuitively, the higher the underlying uncertainty of the firm, the
more difficult it is for debt holders to monitor stockholders and the easier it is for
stockholders to hide risk-shifting activity. The fourth proxy – the fraction of fixed assets
of total assets (PP&E) – is a negative measure of the ease of risk shifting since fixed
assets cannot be easily substituted for riskier assets and can be used as tangible collateral
for debt claims. Note that H4 leads to predicted coefficients that are of the opposite sign
than the coefficients predicted by H1.
Another aspect of the choice of security with which to be public pertains to
transaction costs. If issuance costs are concave (e.g., due to existence of fixed
components), once a firm has gone public with a given security, additional issues of the
same security are less expensive than the first issue. For example, a Public Equity firm
may bear lower under-pricing costs on a secondary issue than on an IPO and it may be
cheaper for a Public Debt firm to access investors, to write a prospectus, and to be rated
than for a firm that issues debt for the first time. Hence, ceteris paribus:

12
H5: If transaction costs are concave, Public Debt firms will rely on a larger
fraction of debt in their overall financing than Public Equity firms
In our empirical analysis, we measure reliance on debt in the firm’s total financial
package in two ways. First, we use a flow measure of reliance on debt – the percentage
of new debt issued out of total funds raised (%DEBT). Second, we use a stock measure
of reliance on debt – the percentage of debt in the capital structure (LEVERAGE), which
is the aggregate of all prior financing decisions.
The above hypotheses, which are examined in the following sections, are derived
from the differential impact of the theorized determinants of the private-public decision
on debt and equity. The derived hypotheses implicitly assume that firms can optimally
determine the private-public status of their securities. Firms’ financing choices, however,
are potentially limited by their debt capacity and liquidity needs. Hence, in our analysis,
we examine the potential impact of debt capacity and liquidity needs on firms’ private-
public decisions. This is done by comparing the estimates we obtain for the general
population of firms to estimates we obtain for a sub-sample of firms for which there is
positive proof that they are not financially constrained. We detail these diagnostic checks
in the subsequent sections.
II. Data
We select our sample from the COMPUSTAT database, which includes firms with
publicly traded securities – either equity, or debt, or both. Each year, we divide these
firms into four subsets: Public Equity firms, Public Debt firms, Completely Public firms,
and Private firms. Recall that “Public Equity firms” have public equity while their debt is

13
private, “Public Debt firms” have public debt while their equity is private, and
“Completely Public firms” are firms with both public equity and public debt.
We classify equity as being publicly traded in a given year if there is at least one
price quote for the stock either on the CRSP or on the COMPUSTAT databases any time
during the year. We classify firms as having publicly traded debt if they have at least $50
million of long-term debt outstanding and there is debt rating on the COMPUSTAT
database for their debt. This classification is based on the stated policy of rating agencies
to rate all public debt issues with par value of at least $50 million.3
We exclude from our sample all financial firms (SIC code 6000). After this
exclusion, we are left with 37,942 yearly observations regarding 5,026 firms in the years
1987 through 2002. Table 1 describes the distribution of the sample across the three sub-
samples in each year. As can be seen in the table, about half of the observations are of
firms that are Completely Public. Of those that have one publicly traded security and one
privately traded security, 23% are Public Debt firms and 77% are Public Equity firms.
Table 2 describes the distribution of our sample across industries. Except for a slightly
increased fraction of Public Debt firms in industries 48 and 49 (“Communications” and
“Electric, Gas, and Sanity Services”, respectively), there are no apparent differences in
industry concentrations across the three classes of firms.
One important aspect of our data is that firms do not stay constantly in one
category of private-public status. To see this we provide the transition matrix of firms
across the different categories in Table 3. Note that, even though the COMPUSTAT
confines its database to firms with publicly traded securities, we have some data about
3 Note that some debt with less than $50 million face value may also be publicly issued and rated and that a small fraction of debt is rated based on public information only.

14
firms that are completely private (i.e., they do not have either public equity or public
debt). This is because the COMPUSTAT back-fills data for firms that enter its database,
so that some private firm data are in the COMPUSTAT database provided that the firms
eventually became public by issuing equity or debt to public investors. Additionally,
completely private firms that have more than 500 security holders are required to file
their reports with the SEC and, therefore, are also included in the COMPUSTAT
database and in our sample of completely private firms. Table 3 suggests that firms
adjust their private-public status quite often, presumable for reasons. This is in line with
the predictions of Benninga, Helmantel, and Sarig (2005). Hence, differences across firm
subsets, which we examine below, can indeed teach us about the determinants of their
private-public decisions.
In Table 4, we provide the descriptive statistics of the variables used in our
analysis as well as the correlations among them. The table shows that Assets and Sales
are skewed to the right, with some very large observations relative to median values. To
prevent extreme observations from overly affecting our results, we delete the most
extreme observations - the top and bottom 1% - of each variable in all our tests.
Furthermore, because Assets and Sales are highly correlated, we do not include both
variables jointly in our analysis.
Unreported in the table and not explicitly tested in the following section is the
difference in size between the three private-public categories. While there is no specific
hypothesis regarding size differences, some of our results may be interpreted as reflecting
size differences between Public Equity firms and Public Debt firms since many would
expect Public Equity firms to be larger than Public Debt firms. This, however, is not the

15
case: Public Equity firms (with average Assets of $2,981 million and average Sales of
$1,765) are smaller than Public Debt firms (with average Assets of $4,355 million and
average Sales of $2,585).4
III. Empirical Results
We begin our tests of the hypotheses by comparing the individual characteristics
of Public Debt firms to Public Equity firms. Since the private-public decision nets
multiple effects of the decision, we also present a multivariate PROBIT analysis of the
determinants of the decision. The PROBIT analysis also allows us to control for leverage
differences so that we can estimate the determinants of the private-public decision
separately from the determinants of the capital structure decision. We carry all estimates
on annual cross-sections and report and test the mean coefficients over time, similar to
Fama and MacBeth (1973), Fama and French (2001), and Garmaise and Moskowitz
(2003). In addition to testing the hypotheses detailed above, we further check our results
in two ways. First, we examine the extent to which debt or liquidity constrains may
affect private-public decisions. Second, we examine in detail the years in which firms
transition from being private to being public – either Public Equity or Public Debt.5
III.A Public Debt Firms vs. Public Equity Firms – Univariate Comparisons
To examine the differences in each firm characteristic between Public Debt and
Public Equity firms, we estimate the following equation for every year:
iiequitypublictti IcY εβ +⋅+= − ,
4 Completely Public firms are the largest firms, both in terms of Assets ($8,006 million on average) as well as in terms of Sales ($4,744 million on average). 5 We also examine years in which firms cease being public with both equity and debt to being public with one security – either equity or debt, but not both. We find similar results to those documented for the reverse transition but do not report them because this sub-sample is relatively small.

16
where:
iY is the examined characteristic (VSALES, PP&E, etc.)
equityPublicI − is a dummy variable that take the value “1” if the firm is Public Equity
and “0” if it is Public Debt
We report the mean coefficients over the sample period.
Table 5 shows the average estimated differences between the characteristics of
Public Equity and Public Debt firms. For sake of completeness, we also report the
average characteristics of Completely Public firms as well.6 Recall that the variables in
Table 5 are related to agency problems, asymmetric information, information acquisition,
monitoring, and transaction costs. We discuss these potential determinants of the private-
public decision sequentially below.
The first four variables in Table 5 - volatility of sales (VSALES), volatility of the
return on assets (VROA), R&D intensity (R&D), and the fraction of fixed assets of total
assets (PP&E) - relate both to H1 and H4. H1, which says that high information
asymmetry firms will choose to be Public Debt, implies that VSALES, VROA, and R&D
are higher in Public Debt firms than in Public Equity firms while PP&E is higher in
Public Equity firms. H4, which reflects agency considerations – risk shifting ability of
shareholders – suggests the opposite. The results for all four variables are inconsistent
with H1 and are consistent with H4: VSALES, VROA, and R&D are significantly higher
for Public Equity firms than for Public Debt firms and PP&E is significantly smaller.
The uniform inconsistency with H1 and consistency with H4 means that, among
the firms that choose to become public, agency considerations dominate information
6 We compare the characteristics of Completely Public firms to those of Public Equity firms in Table 6.

17
asymmetry considerations. Specifically, information asymmetries imply that Public
Equity firms have lower information asymmetry than Public Debt firms. This, however,
is inconsistent with the data: we find that Public Equity firms have higher information
asymmetry than Public Debt firms. On the other hand, consistent with agency theories of
the private-public decision, Public Equity firms are more exposed to agency problems
than Public Debt firms. This implies that minimizing agency costs is potentially an
important determinant of the security with which firms become public and, therefore, of
the overall private-public decision through the impact of the security choice on total
agency costs.
The second hypothesis deals with the information gathering needs of firms. H2
suggests that firms that greatly value price information are public with equity to enjoy the
information contained in stock prices, which is more accurate than the information
contained in bond prices. We consider firms that have extensive R&D efforts and firms
that have significant capital expenditures to be firms with much use for price information.
Indeed, both of our proxies for the usefulness of price information – the rate of capital
expenditures (CAPX) and R&D intensity (R&D) – support this prediction: Public Equity
firms have higher CAPX and R&D than Public Debt firms. The differences in CAPX
and R&D between Public Equity firms and Public Debt firms are also consistent with the
difference in VSALES: the higher the volatility of sales, the more important it is to obtain
market information and, hence, the more likely the firm will be Public Equity rather than
Public Debt. Thus, consistent with Fulghieri and Lukin (2001) when information
collection costs are high, the data suggest that firms that value price information prefer to
be public with equity rather than with debt. Note that the importance of information

18
acquisition considerations in the choice of security with which to become public implies
that information-gathering considerations are important in the overall private-public
decision. This is because private firms cannot obtain price information – either from
their equity price or from their debt price.
The next variable in Table 5 – ROA – measures the profitability of firms. Recall
that H3 is based on two competing arguments. The first argument is that monitoring by
public investors and their ability to seize control imply that high quality firms are public
with equity. The counter argument is that monitoring by debt rating agencies implies that
high quality firms are public with debt. Consistent with the later argument, we find that
Public Debt firms are more profitable, as measured by their average ROA – 13.5%, than
Public Equity firms – average ROA of 10.4%. Note that the difference in profitability is
not merely a reflection of returns to scale since the largest firms – Completely Public
firms – have an average ROA that is between the ROA of Public Debt firms and Public
Equity firms – 11.9%. Importantly, the data does not support the prediction that low
quality managers avoid the risk of hostile takeover by choosing to be public with debt,
though it is possible that the really poor managers avoid being public altogether so that
they are not in our sample.
Lastly, H5 predicts that if transaction costs are concave firms will be public with
the security that is expected to dominate their financing to minimize transaction costs.
Our results are consistent with this prediction. This is true both for the cumulative
issuance of securities – LEVERAGE – as well as for the annual flow of new financing –
%DEBT. These differences show that Public Debt firms use more debt in their financing
mix than Public Equity firms once they become public. Note that this result is also

19
consistent with H4 – agency motives for being public with equity, since the same reasons
that cause firms to be Public Debt may cause them to heavily rely on debt financing. In
other words, the high reliance on debt by Public Debt firms can reflect either agency
considerations or concave transaction costs or both.
In sum, Table 5 demonstrates the validity of the premise of our analysis – that
there are important differences between Public Debt firms and Public Equity firms. The
differences between these firms suggest that information asymmetry is not as important
as the information acquisition motives, agency costs, and monitoring in the choice of
security with which to be public and in the overall private-public decision.
For sake of completeness, in Table 6, we compare the characteristics of Public
Equity firms to Completely Public firms. Recall that we do not have specific hypotheses
regarding these differences. Indeed, several of the characteristics are not significantly
different between the groups and even those that are statistically significantly different
are economically similar. For example, the difference in R&D (1.0% vs. 1.2%) – is
statistically significant, yet this difference is economically small relative to the difference
from Public Debt firms’ R&D intensity – 0.3%.
III.B Public Debt Firms vs. Public Equity Firms – Multivariate Analysis
The above results describe the differences between the individual determinants of
the private-public decision, each examined separately. Firms’ decision to be public with
equity or with debt, however, may be jointly determined by all of these characteristics.
Hence, we present also a PROBIT estimation of the joint impact of these determinants on
the probability that a firm is public with equity rather than debt. Note that the PROBIT
analysis also enables us to control for the capital structure decision so that the estimated

20
effects are above and beyond the impact of the chosen leverage. In this analysis, we use
the proxies for information asymmetry, information gathering needs, agency, and
monitoring described above. We estimate the following PROBIT model of the
probability that a firm becomes public by issuing equity rather than debt:
εββ +⋅+= ∑−j
jijequityPublic XI 0
where:
equityPublicI − is a dummy variable that take the value “1” if the firm is Public Equity
and “0” if it is Public Debt, and
jiX are firm characteristics - VSALES, PP&E, R&D, ROA,
VROA, CAPX, LEVERAGE, and %DEBT.
In Table 7, we present the estimated PROBIT coefficients as well as a measure of
the goodness of fit – the average fraction of correct predictions over the sample period.
Overall, we find that the multivariate analysis yields similar results to the single variable
analysis as reported in Table 5, albeit with some firm characteristics losing their
statistical significance in the multivariate analysis. Specifically, firms with high R&D
expenditures and high CAPX have high probability of being public with equity, while
firms with high PP&E, high LEVERAGE, and high %DEBT are more likely to be public
with debt. The coefficients of VSALES, VROA, and ROA, while of the same sign as in
Table 5, are insignificant when their effects are considered jointly with the other
variables, even though they are individually significant. Largely, the results of the
multivariate analysis are consistent with the results of the single variable comparisons.
Furthermore, since the PROBIT estimation controls for capital structure differences by
including LEVERAGE in the estimated equation, the PROBIT results suggest that the

21
determinants of the private-public decision are above and beyond the impact of the
capital structure choice.
III.C Public Debt Firms vs. Public Equity Firms – Financial Constrains
Our results suggest that the actual characteristics of Public Equity firms relative to
Public Debt firms are inconsistent with the predictions that are based on information
asymmetry. One potential explanation for this result is that firms issue stock because
they are financially constrained – they are at their debt capacity yet they need liquidity, so
that equity is a “last resort” financing. Financial constraints are important for agency
theories of ownership structure as well since unconstrained entrepreneurs may avoid
outside financing of all types altogether (Jensen and Meckling 1976). Hence, next, we
check to what extent financial constraints drive our results.
In Table 8, we examine several indicators of whether firms are financially
constrained both before and after the transition from being a private firm to being a
public firm (either Public Equity or Public Debt). All indicators reported in Table 8 show
that, on average, both types of firms are not financially constrained. This is evident in
both high pre-issuance cash reserves (5% or more of total assets) as well as pre-issuance
generous dividend policies (at 1.3% annual dividend yield relative to total assets and 45%
or more dividend payout ratio). Moreover, if the transitioning firms issue securities
because of binding financial constrains, one would expect these firms to cut their
dividend payout to partially defray their financial needs. This is not the case: in our
sample, firms continue to pay dividends and keep substantial cash reserves. Thus,
consistent with the findings of Fama and French (2003) and Leary and Roberts (2004), it
appears that public issuance of equity is not driven by financial constraints.

22
To further check the potential impact of financial constrains, we re-estimate the
characteristics pertaining to H1 and H4 for firms that are not financially constrained yet
issue equity. We consider an equity issuing firm to be unconstrained financially if the
firm concurrently pays dividends. Table 9 reports the number of financially
unconstrained firms in each category (Panel A) and their fraction of the total number of
firms in this category (Panel B). The average characteristics pertaining to H1 and H4 for
each category of cash unconstrained firms are reported in Table 10.
As can be seen from Table 9, the fraction of dividend paying firms that
concurrently issue equity is substantial – about a quarter of the total number of firms,
making it unlikely that the results reported in Table 5 are driven by financially
constrained firms. This is further confirmed by the average characteristics reported in
Table 10, which are very similar to those reported in Table 5. In particular, the
differences between Public Equity and Public Debt firms in their VSALES, R&D, and
PP&E are significant and in the same direction as those obtained for the complete
sample. The difference in VROA remains of the same sign but loses its significance,
probably due to the reduced sample size. Thus, the rejection of H1 – the hypothesis
based on information asymmetry – does not appear to be driven by the characteristics of
cash constrained firms.
III.D Public Debt Firms vs. Public Equity Firms – Transition Years
To further examine the robustness of our results, we re-estimate Table 5 using
data only from the year immediately following the time a firm transitioned from being
private to being public, either Public Debt or Public Equity. Table 11 reports and
compares the average characteristics of Public Debt firms and Public Equity firms and

23
the sample sizes on which each average is based. Besides the lower power of the tests in
Table 11 relative to Table 5, which is due to smaller samples and manifests itself in lower
significance levels, the results reported in Tables 5 and 11 are virtually the same. The
coefficients of R&D, PP&E, and %DEBT, which are significant in Table 5, become
insignificant in Table 11 but, except for the difference in PP&E that drops to zero, the
differences remain as in Table 5.
In Table 12, we report the changes in firm characteristics around the time the
sample firms go public. The question we try to answer by this table is whether the
characteristics of firms that choose to become public continue to typify them post their
public issuance. Towards that end, we report the changes in firm characteristics from the
year preceding the transition to the year following the transition. Besides the obvious
change in leverage triggered by the issuance itself, it appears that firm characteristics are
little affected by the change in their private-public status. This suggests that firms
contemplate the transition to a public status based on rational expectations of their future
characteristics so that their pre-transition characteristics continue to typify them post the
transition.
IV. Conclusions
We examine the motives underlying firm choice of which type of security to be public
with. Our test is based on the observation that firms can be public with either equity, or
debt, or both. Indeed, the data validate the premise of our analysis – that there are
important differences between Public Debt firms and Public Equity firms. We examine

24
private-public decisions by comparing Public Debt firms to Public Equity firms, where
both provide public investors with similar regulated information.
We find that Public Equity firms are exposed to more information asymmetry
than Public Debt firms, contrary to the predictions of theories related to information
asymmetries (e.g., the Pecking Order hypothesis) but in line with the predictions of
agency theory and the predictions of Fulghieri and Lukin when information collection
costs are high. This holds true even for firms that are not financially constrained, which
means that our findings are not driven by financial constraints. We also find that firms
with significant investment opportunities are more likely to be public with equity than
with debt, highlighting the value of the information provided by prices of publicly traded
equity. Lastly, we find the same results around the time firms transition from being
private to being public and that transitioning firms have abundant cash and pay
significant dividends both before and after the transition.

25
References
Benninga, S., Helmantel, M., and Sarig, O. “The timing of initial public offerings”,
Journal of Financial Economics, 75, 115-132.
Benveniste, L.M., and Spindt, P.A., 1989, “How Investment Bankers Determine the Offer
Price and Allocation of New Issues”, Journal of Financial Economics, 24, 343-
361.
Cantillo, M., and Wright, J., 2000, “How Do Firms Choose Their Lenders? An Empirical
Investigation”, Review of Financial Studies, 13, 155-189.
Chemmanur, T., and Fulghieri, P., 1994, “Reputation, Renegotiation, and the Choice
between Bank Loans and Publicly Traded Debt”, Review of Financial Studies, 7,
475-506.
Chemmanur, T., and Fulghieri, P., 1999, “A Theory of the Going Public Decision”,
Review of Financial Studies, 12, 249-280.
Datta, S., Iskandar-Datta, M., and Patel, A., 2000, “Some Evidence on the Uniqueness of
Initial Public Debt Offerings”, Journal of Finance, 55, 715-742.
Denis, D.J., and Mihov, V.T., 2003, “The Choice between Bank Debt, Non-Bank Debt
and Public Debt: Evidence from New Corporate Borrowings”, Journal of
Financial Economics, 70, 3-28.
Diamond, D.W., 1989, “Reputation Acquisition in Debt Markets”, Journal of Political
Economy, 97, 828-862.
Diamond, D.W., 1991, “Monitoring and Reputation: The Choice between Bank Loans
and Directly Placed Debt”, Journal of Political Economy, 99, 689-721.

26
Habib, M.A., and Johnsen, D.B., 2000, “The Private Placement of Debt and Outside
Equity as an Information Revelation Mechanism”, Review of Financial Studies,
13, 1017-1055.
Fama, E. F., and K. R. French, 2001, “Disappearing dividends: changing characteristics
or lower propensity to pay?”, Journal of Financial Economics, 60, 3-43.
Fama, E. F., and K. R. French, 2003, “Financing Decisions: Who Issues Stock?”,
working paper, University of Chicago.
Fama, E. F., and MacBeth, J.D., 1973, “Risk, Return and Equilibrium: Empirical Tests”,
Journal of Political Economy, 81, 607-636.
Fulghieri, P., and Lukin, D., 2001, “Information Production, Dilution Costs, and Optimal
Security Design”, Journal of Financial Economics, 61, 3-42.
Garmaise, M. and T. Moskowitz, 2003, “Informal Financial Networks: Theory and
Evidence”, Review of Financial Studies, 16, 1007-1040.
Houston, J., and James, C., 1996, “Bank Information Monopolies and the Mix of Private
and Public Debt Claims”, Journal of Finance, 51, 1863-1889.
Jensen, M., and Meckling, W., 1976, “Theory of the Firm: Managerial Behavior, Agency
Costs and Ownership Structure”, Journal of Financial Economics, 3, 305-360.
Kliger, D. and O. Sarig, 2000, “The Information Value of Bond Ratings”, Journal of
Finance, 55, 2879-2902.
Krishnaswami, S., Spindt, P.A., and Subramaniam, V., 1999, “Information Asymmetry,
Monitoring, and the Placement Structure of Corporate Debt”, Journal of Financial
Economics, 51, 407-434.

27
Leary M. T., and M. R. Roberts, 2004, “Financial Slack and Tests of the Pecking Order’s
Financing Hierarchy”, working paper, Duke University.
Maug, E., 2001, “Ownership Structure and the Life Cycle of the Firm: A Theory of the
Decision to Go Public”, European Finance Review, 5, 167-200.
Maksimovic, V., and Pichler, P., 2001, “Technological Innovation and Initial Public
Offerings”, Review of Financial Studies, 14, 459-494.
Myers, S.C., and Majluf, N.S., 1984, “Corporate Financing and Investment Decisions
When Firms Have Information That Investors Do Not Have”, Journal of
Financial Economics, 13, 187-221.
Pagano, M., Panetta, F., and Zingales L., 1998, “Why Do Companies Go Public? An
Empirical Analysis”, Journal of Finance, 53, 27-64.
Pagano, M., and Röell, A., 1998, “The Choice of Stock Ownership Structure: Agency
Costs, Monitoring, and the Decision to Go Public”, Quarterly Journal of
Economics, 113, 187-225.
Rajan, R.G., 1992, “Insiders and Outsiders: The Choice between Informed and Arm’s
Length Debt”, Journal of Finance, 47, 1367-1400.
Ritter, R.J., and Welch, I., 2002, “A Review of IPO Activity, Pricing, and Allocations”,
Journal of Finance, 57, 1795-1828.
Stoughton, N.M, Wong, K.P. and Zechner, J., 2001, “IPO and Product Quality”, Journal
of Business, 74, 375-408.
Subrahmanyam, A., and Titman, S., 1999, “The Going-Public Decision and the
Development of Financial Markets”, Journal of Finance, 54, 1047-1082.

28
Verrecchia, R.E., 1983, “Discretionary Disclosure”, Journal of Accounting and
Economics, 5, 179-194.
Zingales, L., 1995, “Insider Ownership and the Decision to Go Public”, Review of
Economic Studies, 62, 425-448.
29
Table 1
Distribution of Public Firms
The sample consists of firms on the COMPUSTAT database that have at least $50 million long-term debt in the period 1987 to 2002. Each year, we classify firms into one of the following three groups:
“Public Equity” firms – firms that have public equity and private debt
“Public Debt” firms – firms that have public debt and private equity; and
“Completely Public” firms – firms that have both public equity and public debt
We classify firms as having publicly traded equity if there is at least one price quoted for their shares either on the CRSP or on the COMPUSTAT databases any time during a year. We classify firms as having publicly traded debt if they have at least $50 million of long-term debt outstanding and there is debt rating on the COMPUSTAT database.
Year Public Equity Public Debt Completely Public 1987 575 256 920 1988 627 283 881 1989 683 316 850 1990 712 316 798 1991 705 288 802 1992 728 273 864 1993 867 269 964 1994 1,011 282 1,012 1995 1,087 267 1,094 1996 1,186 268 1,207 1997 1,295 260 1,329 1998 1,322 275 1,451 1999 1,316 324 1,458 2000 1,263 324 1,450 2001 1,154 318 1,403 2002 1,033 287 1,289
Total 15,564 (77% of main sample)
4,606 (23% of main sample)
17,772

30
Table 2
Industry Distribution of Sample
The sample consists of firms on the COMPUSTAT database that have at least $50 million long-term debt in the period 1987 to 2002 and that have SIC reported in the database. Each year, we classify firms into one of the following three groups:
“Public Equity” firms – firms that have public equity and private debt
“Public Debt” firms – firms that have public debt and private equity; and
“Completely Public” firms – firms that have both public equity and public debt
We classify firms as having public equity if there is at least one price quoted for their shares either on the CRSP or on the COMPUSTAT databases any time during a year. We classify firms as having publicly traded debt if they have at least $50 million of long-term debt outstanding and there is debt rating on the COMPUSTAT database.
For each group, we stratified firms by their two-digit SIC. We report in the table those SIC for which there are at least 500 firms in total. All other SIC are grouped together under “others”. Numbers in parentheses are the percentages of firms in each SIC relative to the total number of firms in each category. 2 digits SIC Public Equity Public Debt Completely Public Total
13 537 (4.2%) 35 (1.1%) 680 (4.2%) 1252 (3.9%) 20 431 (3.4%) 124 (3.8%) 663 (4.1%) 1218 (3.8%) 26 200 (1.6%) 71 (2.2%) 504 (3.1%) 775 (2.4%) 27 307 (2.4%) 53 (1.6%) 298 (1.8%) 658 (2.0%) 28 715 (5.6%) 137 (4.2%) 1171 (7.2%) 2023 (6.3%) 29 166 (1.3%) 118 (3.6%) 396 (2.4%) 680 (2.1%) 33 430 (3.4%) 110 (3.3%) 484 (3.0%) 1024 (3.2%) 34 269 (2.1%) 72 (2.2%) 259 (1.6%) 600 (1.9%) 35 682 (5.4%) 99 (3.0%) 868 (5.3%) 1649 (5.1%) 36 629 (5.0%) 74 (2.3%) 730 (4.5%) 1433 (4.4%) 37 337 (2.7%) 115 (3.5%) 620 (3.8%) 1072 (3.3%) 38 353 (2.8%) 31 (0.8%) 413 (2.5%) 797 (2.5%) 48 888 (7.0%) 615 (18.7%) 1181 (7.3%) 2684 (8.3%) 49 1026 (8.1%) 424 (12.9%) 1971 (12.1%) 3421 (10.6%) 50 414 (3.3%) 36 (1.1%) 304 (1.9%) 754 (2.3%) 51 212 (1.7%) 37 (1.1%) 298 (1.8%) 547 (1.7%) 53 166 (1.3%) 27 (0.8%) 309 (1.9%) 502 (1.6%) 54 208 (1.6%) 109 (3.3%) 229 (1.4%) 546 (1.7%) 59 194 (1.5%) 55 (1.7%) 299 (1.8%) 548 (1.7%) 73 690 (5.4%) 78 (2.4%) 559 (3.4%) 1327 (4.1%) 79 173 (1.4%) 59 (1.8%) 281 (1.7%) 513 (1.6%) 80 309 (2.4%) 30 (0.9%) 329 (2.0%) 668 (2.1%)
Others 3358 (26.5%) 777 (23.6%) 3402 (20.9%) 7537 (23.4%) Total 12694 3286 16248 32228

31
Table 3
Transition Matrix of Sample Firms
The sample consists of all firms on the COMPUSTAT database that have at least $50 million long-term debt in the period 1987 to 2002. Each year, we classify firms into one of the following four groups:
“Public Equity” firms – firms that have public equity and private debt
“Public Debt” firms – firms that have public debt and private equity; and
“Completely Public” firms – firms that have both public equity and public debt
“Private” firms – firms that have neither public equity nor public debt
We classify firms as having publicly traded equity if there is at least one price quoted for their shares either on the CRSP or on the COMPUSTAT databases any time during a year. We classify firms as having publicly traded debt if they have at least $50 million of long-term debt outstanding and there is debt rating on the COMPUSTAT database.
For each group, we examine the status of the firm – private, public equity, public debt, or completely public – one year after their classification to examine the transition from one status group to another. For each group, we report the number of firm-year observations and the fraction of firms that belong to each group in the subsequent year.
Original
Status
Number of
Firm Years
To
Private
To
Public
Debt
To
Public
Equity
To
Completely
Public
Private 3557 65.3% 6.8% 23.4% 4.6%
Public Debt 4904 1.5% 93.8% 0.4% 4.3%
Public Equity 6257 1.2% 0.3% 73.5% 25.0%
Completely Public 5176 0.2% 3.2% 7.8% 88.9%

32
Table 4
Descriptive Statistics of Public Firms
The sample consists of firms on the COMPUSTAT database that have at least $50 million long-term debt in the period 1987 to 2002.
Assets and Sales are measured in constant 2002 dollars using the change in the CPI to adjust prior years’ data. VSALES measures the coefficient of variation of Sales over three preceding years. PP&E refers to the ratio of net PP&E to total assets. LEVERAGE is the ratio of long-term debt to total assets. R&D is the ratio of R&D expenses to sales. ROA is the ratio of operating income to total assets. VROA is the coefficient of variation of the ROA of the firm over three preceding years. %DEBT is the percentage of debt issuance to total funds raised in a given year. CAPX is the ratio of annual capital expenditure to total assets.
Mean Median St. dev. Min Max 25% 75% Assets ($ mil.) 5,501 1,410 11,875 107 113,950 533 4,498 Sales ($ mil.) 3,284 967 6,589 22 58,537 354 2,905 VSALES 0.128 0.088 0.121 0.001 0.703 0.044 0.168 PP&E 39.1% 35.7% 27.0% 0.5% 91.4% 16.3% 62.5% LEVERAGE 34.5% 29.0% 85.8% 0.3% 1185% 18.2% 42.1% R&D 1.0% 0.0% 2.8% 0.0% 23.2% 0.0% 0.4% ROA 11.4% 11.7% 7.2% -14.6% 34.7% 6.7% 15.8% VROA 0.207 0.128 0.242 0.001 1.975 0.065 0.253 %DEBT 77.8% 97.4% 34.5% 0.0% 100% 70.7% 100% CAPX 7.1% 5.6% 5.7% 0.2% 37.7% 3.2% 9.0% Correlation Matrix
Assets Sales VSALES PP&E Leverage R&D ROA VROA %DEBT Sales 0.925 VSALES -0.289 -0.254 PP&E 0.310 0.211 -0.123 Leverage -0.157 -0.296 0.001 0.380 R&D 0.187 0.305 -0.119 -0.282 -0.402 ROA 0.134 0.258 -0.184 0.150 -0.346 0.545 VROA 0.025 -0.051 0.068 0.112 0.112 -0.192 -0.422 %DEBT 0.003 -0.063 -0.055 0.206 0.117 -0.191 -0.126 0.080 CAPX 0.257 0.331 -0.035 0.488 0.174 0.064 0.261 -0.003 0.039

33
Table 5
Differences between Public Equity Firms and Public Debt Firms
The sample consists of firms on the COMPUSTAT database that have at least $50 million long-term debt in the period 1987 to 2002. Each year, we classify firms into one of the following three groups:
“Public Equity” firms – firms that have public equity and private debt
“Public Debt” firms – firms that have public debt and private equity; and
“Completely Public” firms – firms that have both public equity and public debt
We classify firms as having public equity if there is at least one price quoted for their shares either on the CRSP or on the COMPUSTAT databases any time during a year. We classify firms as having publicly traded debt if they have at least $50 million of long-term debt outstanding and there is debt rating on the COMPUSTAT database.
Assets and Sales are measured in constant 2002 dollars using the change in the CPI to adjust prior years’ data. VSALES measures the coefficient of variation of Sales over three preceding years. PP&E refers to the ratio of net PP&E to total assets. LEVERAGE is the ratio of long-term debt to total assets. R&D is the ratio of R&D expenses to sales. ROA is the ratio of operating income to total assets. VROA is the coefficient of variation of the ROA of the firm over three preceding years. %DEBT is the percentage of debt issuance to total funds raised in a given year. CAPX is the ratio of annual capital expenditure to total assets.
For each variable we report the mean and standard deviation (in parentheses) for every one of the three groups: Public Equity firms, Public Debt firms, and Completely Public firms. We test for significance of the differences of firm characteristics between Public Equity firms and Public Debt firms using the following cross-sectional equation:
iequityPublici IcY εβ +⋅+= − where Yi denotes the compared characteristic and IPublic-equity is a dummy variable that equals “1” for Public Equity firms and “0” for Public Debt firms.

34
Table 5 (cont.)
Differences between Public Equity Firms and Public Debt Firms
Variable Public Equity
firms Public
Debt firms Expected Difference
Difference (Std. error)
Completely Public firms
VSALES 13.38 8.37 -/+ 5.011**
(0.414) 12.94
VROA 21.93 15.78 -/+ 6.146** (0.655)
21.00
R&D 1.0% 0.3% - /+ 0.670** (0.036)
1.2%
PP&E 35.5% 56.2% -/+ -20.682** (1.080)
39.5%
CAPX 7.4% 6.5% + 0.835** (0.159)
7.1%
ROA 10.4% 13.5% -/+ -3.106** (0.282)
11.9%
LEVERAGE 33.4% 47.3% - -13.921** (2.072)
31.7%
%DEBT 86.4% 95.3% - -8.928** (0.448)
85.8%
* Significant at 5% ** Significant at 1%

35
Table 6
Differences between Public Equity Firms and Completely Public Firms
The sample consists of firms on the COMPUSTAT database that have at least $50 million long-term debt in the period 1987 to 2002. Each year, we classify firms into one of the following two groups:
“Public Equity” firms – firms that have public equity and private debt; and
“Completely Public” firms – firms that have both public equity and public debt
We classify firms as having public equity if there is at least one price quoted for their shares either on the CRSP or on the COMPUSTAT databases any time during a year. We classify firms as having publicly traded debt if they have at least $50 million of long-term debt outstanding and there is debt rating on the COMPUSTAT database.
Assets and Sales are measured in constant 2002 dollars using the change in the CPI to adjust prior years’ data. VSALES measures the coefficient of variation of Sales over three preceding years. PP&E refers to the ratio of net PP&E to total assets. LEVERAGE is the ratio of long-term debt to total assets. R&D is the ratio of R&D expenses to sales. ROA is the ratio of operating income to total assets. VROA is the coefficient of variation of the ROA of the firm over three preceding years. %DEBT is the percentage of debt issuance to total funds raised in a given year. CAPX is the ratio of annual capital expenditure to total assets.
For each variable we report the mean and standard deviation (in parentheses) for every one of the three groups: Public Equity firms, Public Debt firms, and Completely Public firms. We test for significance of the differences of firm characteristics between Public Equity firms and Public Debt firms using the following cross-sectional equation:
iequityPublici IcY εβ +⋅+= − where Yi denotes the compared characteristic and IPublic-equity is a dummy variable that equals “1” for Completely Public firms and “0” for Public Equity firms.

36
Table 6 (cont.)
Differences between Public Equity Firms and Completely Public Firms
Variable Public Equity firms
Completely Public firms
Difference (Std. error)
VSALES 13.38 12.94 -0.447 (0.343)
VROA 21.93 21.00 -0.929* (0.455)
R&D 1.0% 1.2% 0.211**
(0.019) PP&E 35.5% 39.5% 4.030**
(1.084) ROA 10.4% 11.9% 1.471**
(0.259) CAPX 7.4% 7.1% -0.236**
(0.085) LEVERAGE 33.4% 31.7% -0.390
(0.777) %DEBT 86.4% 85.8% -0.565
(0.407) * Significant at 5% ** Significant at 1%

37
Table 7
PROBIT Analysis of Determinants of the Private-Public Decision
The sample consists of firms on the COMPUSTAT database that have at least $50 million long-term debt in the period 1987 to 2002. Each year, we classify each firm into one of the following two groups:
“Public Equity” firms – firms that have public equity and private debt “Public Debt” firms – firms that have public debt and private equity
We classify firms as having public equity if there is at least one price quoted for their shares either on the CRSP or on the COMPUSTAT databases any time during a year. We classify firms as having publicly traded debt if they have at least $50 million of long-term debt outstanding and there is debt rating on the COMPUSTAT data base. Assets and Sales are measured in constant 2002 dollars using the change in the CPI to adjust prior years’ data. VSALES measures the coefficient of variation of Sales over three preceding years. PP&E refers to the ratio of net PP&E to total assets. LEVERAGE is the ratio of long-term debt to total assets. R&D is the ratio of R&D expenses to sales. ROA is the ratio of operating income to total assets. VROA is the coefficient of variation of the ROA of the firm over three preceding years. %DEBT is the percentage of debt issuance to total funds raised in a given year. CAPX is the ratio of annual capital expenditure to total assets. The estimated coefficients are from a PROBIT estimation of the equation:
ןj
jijequityPublic XaI εβ ++= ∑−
where equityPublicI − is a dummy variable that equals “1” for Public Equity firms and “0” for Public Debt firms, and Xji denotes variable j of firm i. The independent variables are: VSALES, VROA, PP&E, R&D, ROA, CAPX, LEVERAGE, and %DEBT.

38
Table 7 (Cont.)
PROBIT Analysis of Determinants of the Private-Public Decision
* Significant at 5% ** Significant at 1%
Firm Characteristic
VSALES 0.0215 (0.1955)
VROA 0.0011 (0.0016)
R&D 0.0597** (0.0124)
PP&E -0.0177** (0.0013)
ROA -0.0105 (0.0056)
CAPX 0.0487** (0.0061)
LEVERAGE -0.0081** (0.0014)
%DEBT -0.0161** (0.0019)
Correct classification 66.2%

39
Table 8
Liquidity Indicators of Public Equity Firms and Public Debt Firms around the
Time of Transition from being Private to being Public
The sample consists of firms on the COMPUSTAT database that have at least $50 million long-term debt in the period 1987 to 2002. Each year, we classify firms into one of the following two groups:
“Public Equity” firms – firms that have public equity and private debt; and
“Public Debt” firms – firms that have public debt and private equity
We classify firms as having public equity if there is at least one price quoted for their shares either on the CRSP or on the COMPUSTAT databases any time during a year. We classify firms as having publicly traded debt if they have at least $50 million of long-term debt outstanding and there is debt rating on the COMPUSTAT database. We examine only the firm years in which firms transition from being private to being either Public Equity or Public Debt firms. We exclude all firms for which we do not have data on Total Assets, Dividends (from the cash flow statement), Cash (including marketable securities), and Earnings.
We report liquidity indicators in the year before a firm switches from being private to being either Public Debt or Public Equity firm (“before”) and in the year the firm switched (“after”). For each variable we report the mean and standard deviation (in parentheses). We test for significance of the differences of liquidity characteristics between sample firms that transitioned from being private to being Public Equity and Public Debt firms using the following cross-sectional equation:
iequityPublici IcY εβ +⋅+= − where Yi denotes the compared characteristic and IPublic-equity is a dummy variable that equals “1” for Public Equity firms and “0” for Public Debt firms.

40
Table 8 (cont.)
Liquidity Indicators of Public Equity Firms and Public Debt Firms around the
Time of Transition from being Private to being Public
Variable To Public Equity
To Public Debt
Difference (Std. error)
Number of observations 723 221 Cash/assets before 7.1% 5.0% 2.1**
(0.772) Cash/assets after 8.9% 4.6% 4.3**
(0.808) Change in cash/assets 1.8% -0.4% 2.2%**
(0.629) Dividend/assets before 1.6% 1.3% 0.3
(0.436) Dividend/assets after 2.4% 1.3% 1.1
(0.877) Dividend/earnings before 45.5% 58.8% -13.3**
(3.444) Dividend/earnings after 45.4% 65.1% -19.7**
(3.382) Change in dividend/assets 0.8% 0.0% 0.7%
(0.917) Change in dividend/earnings -0.1% 6.3% -6.4%*
(3.621) * Significant at 5% ** Significant at 1%

41
Table 9
Sample Distribution of Firms that Pay Dividends and Concurrently Issue Equity
The sample consists of firms on the COMPUSTAT database that have at least $50 million long-term debt, that pay dividends, and that issue equity in the period 1987 to 2002. Each year, we classify firms into one of the following two groups:
“Public Equity” firms – firms that have public equity and private debt; and
“Public Debt” firms – firms that have public debt and private equity
We classify firms as having public equity if there is at least one price quoted for their shares either on the CRSP or on the COMPUSTAT databases any time during a year. We classify firms as having publicly traded debt if they have at least $50 million of long-term debt outstanding and there is debt rating on the COMPUSTAT database.
Panel A: Number of firms that pay dividends and concurrently issue equity
Year Public Equity Public Debt 1987 272 44 1988 262 40 1989 299 33 1990 286 30 1991 278 28 1992 287 53 1993 286 56 1994 318 39 1995 324 23 1996 309 32 1997 310 19 1998 312 20 1999 272 22 2000 240 13 2001 205 14 2002 182 10
Grand Total 4442 476

42
Table 9 (Cont.)
Sample Distribution of Firms that Pay Dividends and Issue Equity
Panel B: Fraction of firms that pay dividends and concurrently issue equity of total number of firms in each cell
Year Public Equity Public Debt 1987 47.3% 17.2% 1988 41.7% 14.1% 1989 43.7% 10.4% 1990 40.2% 9.5% 1991 39.4% 9.7% 1992 39.4% 19.4% 1993 32.9% 20.8% 1994 31.4% 13.8% 1995 29.8% 8.6% 1996 26.0% 11.9% 1997 23.9% 7.3% 1998 23.6% 7.2% 1999 20.6% 6.8% 2000 19.0% 4.0% 2001 17.7% 4.4% 2002 17.6% 3.5%
Grand Total 28.5% 10.3%

43
Table 10
Differences between Public Equity Firms and Public Debt Firms
for Firms that Pay Dividends and Concurrently Issue Equity
The sample consists of firms on the COMPUSTAT database that have at least $50 million long-term debt, pay dividends, and issued equity in the period 1987 to 2002. Each year, we classify firms into one of the following two groups:
“Public Equity” firms – firms that have public equity and private debt; and
“Public Debt” firms – firms that have public debt and private equity
We classify firms as having public equity if there is at least one price quoted for their shares either on the CRSP or on the COMPUSTAT databases any time during a year. We classify firms as having publicly traded debt if they have at least $50 million of long-term debt outstanding and there is debt rating on the COMPUSTAT database. We define firms as being not cash constrained if they both issue equity and pay dividends.
Assets and Sales are measured in constant 2002 dollars using the change in the CPI to adjust prior years’ data. VSALES measures the coefficient of variation of Sales over three preceding years. PP&E refers to the ratio of net PP&E to total assets. R&D is the ratio of R&D expenses to sales. ROA is the ratio of operating income to total assets. VROA is the coefficient of variation of the ROA of the firm over three preceding years.
For each variable we report the mean and standard deviation (in parentheses) for every one of the two groups: Public Equity firms, Public Debt firms. Numbers in bracketed parenthesis are the corresponding averages for all firms - cash constrained or not. We test for significance of the differences of firm characteristics between Public Equity firms and Public Debt firms using the following cross-sectional equation:
iequityPublicן IcY εβ ++= −
where: iY denotes the compared characteristic and equityPublicI − is a dummy variable that equals “1” for Public Equity firms and “0” for Public Debt firms.

44
Table 10 (cont.)
Differences between Public Equity Firms and Public Debt Firms
for Firms that Pay Dividends and Concurrently Issue Equity
Variable Public Equity firms
Public Debt firms
Expected Difference
Difference (Stand. error)
VSALES 11.70 [13.38]
9.07 [8.37]
-/+ 2.629** (0.727)
VROA 17.29 [21.93]
16.26 [15.78%]
-/+ 1.032 (1.738)
R&D 1.0% [1.0%]
0.3% [0.3%]
- /+ 0.700** (0.068)
PP&E 43.8% [35.5%]
62.3% [56.2%]
-/+ -18.494** (1.476)
* Significant at 5% ** Significant at 1%

45
Table 11
Differences between Public Equity Firms and Public Debt Firms Immediately After
They Become Public
The sample consists of firms on the COMPUSTAT database that have at least $50 million long-term debt in the period 1987 to 2002. Each year, we classify firms into one of the following three groups:
“Public Equity” firms – firms that have public equity and private debt
“Public Debt” firms – firms that have public debt and private equity; and
“Private” firms – firms that have neither publicly traded shares nor public debt
We classify firms as having public equity if there is at least one price quoted for their shares either on the CRSP or on the COMPUSTAT databases any time during a year. We classify firms as having publicly traded debt if they have at least $50 million of long-term debt outstanding and there is debt rating on the COMPUSTAT database. We report statistics in the year that follows the time a firm becomes Public Debt or Public Equity for the first time.
Assets and Sales are measured in constant 2002 dollars using the change in the CPI to adjust prior years’ data. VSALES measures the coefficient of variation of Sales over three preceding years. PP&E refers to the ratio of net PP&E to total assets. LEVERAGE is the ratio of long-term debt to total assets. R&D is the ratio of R&D expenses to sales. ROA is the ratio of operating income to total assets. VROA is the coefficient of variation of the ROA of the firm over three preceding years. %DEBT is the percentage of debt issuance to total funds raised in a given year. CAPX is the ratio of annual capital expenditure to total assets.
For each variable we report the mean and standard deviation (in parentheses) for every one of the three groups: Public Equity firms, Public Debt firms, and Completely Public firms. We test for significance of the differences of firm characteristics between Public Equity firms and Public Debt firms using the following cross-sectional equation:
iequityPublici IcY εβ +⋅+= − where Yi denotes the compared characteristic and IPublic-equity is a dummy variable that equals “1” for Public Equity firms and “0” for Public Debt firms.

46
Table 11
Differences between Public Equity Firms and Public Debt Firms Immediately After
They Become Public
Variable Public Equity firms
Public Debt firms
Expected Difference
Difference (Std. error)
VSALES 22.95 [697]
17.94 [173]
-/+ 5.006** (1.886)
VROA 53.78 [631]
48.51 [172]
-/+ 5.271 (19.69)
R&D 1.4% [720]
0.4% [180]
- /+ 0.928 (1.323)
PP&E 39.5% [664]
39.1% [176]
-/+ 0.387 (2.307)
CAPX 8.9% [659]
5.1% [175]
+ 3.067** (0.872)
ROA 11.6% [659]
13.9% [179]
- -2.339** (0.827)
LEVERAGE 36.4% [721]
57.8% [180]
- -21.463** (2.097)
%DEBT 82.0% [588]
82.6% [149]
- -0.563 (2.873)
* Significant at 5% ** Significant at 1%

47
Table 12
Changes in Firm Characteristics around the Time the Firms Become Public
The sample consists of firms on the COMPUSTAT database that have at least $50 million long-term debt in the period 1987 to 2002. Each year, we classify firms into one of the following three groups:
“Public Equity” firms – firms that have public equity and private debt
“Public Debt” firms – firms that have public debt and private equity; and
“Private” firms – firms that have neither publicly traded shares nor public debt
We classify firms as having public equity if there is at least one price quoted for their shares either on the CRSP or on the COMPUSTAT databases any time during a year. We classify firms as having publicly traded debt if they have at least $50 million of long-term debt outstanding and there is debt rating on the COMPUSTAT database.
For each group, we examine the status of the firm – private, public equity, public debt, or completely public – one year after their classification to examine the transition from one status group to another. We focus on firms that transition from being Private to being either Public Debt or Public Equity firms and examine the change in their characteristics from the year before the transition to the year following the transition.
We examine changes in the following variables. Assets and Sales are measured in constant 2002 dollars using the change in the CPI to adjust prior years’ data. PP&E refers to the ratio of net PP&E to total assets. LEVERAGE is the ratio of long-term debt to total assets. R&D is the ratio of R&D expenses to sales. ROA is the ratio of operating income to total assets. %DEBT is the percentage of debt issuance to total funds raised in a given year. CAPX is the ratio of annual capital expenditure to total assets.
For each variable we measure the change from the year before the transition to the year after the transition. We report the means of the changes and standard deviations of the changes (in parentheses) separately for firms that transition from being Private firms to being Public Equity firms and for firms that transition from being Private firms to being Public Debt firms. We test for significance of differences in changes in firm characteristics around the transition from being Private firms to being either Public Equity firms or Public Debt firms using the following cross-sectional equation:
iequityPublici IcY εβ +⋅+= − where Yi denotes the compared characteristic and IPublic-equity is a dummy variable that equals “1” for Public Equity firms and “0” for Public Debt firms.
Numbers in brackets are the number of sample transition firms in each cell.

48
Table 12 (cont.)
Changes in Firm Characteristics around the Time the Firms Become Public
* Significant at 5% ** Significant at 1%
Change in Characteristic
Become Public
Equity firms
Become Public
Debt firms
Difference (Std. error)
SALES 461 [715]
440 [174]
20.842 (198)
ASSETS 1,412 [721]
1,065 [180]
346.562 (778)
R&D -0.9% [720]
0.1% [180]
-0.974 (1.631)
PP&E -0.67% [663]
-0.66% [176]
-0.014 (0.949)
ROA -0.2% [647]
1.2% [173]
-1.429* (0.663)
CAPX 0.55% [641]
-0.04% [167]
0.594 (0.726)
LEVERAGE -8.9% [721]
1.3% [180]
-10.241** (1.853)
%DEBT -4.2% [502]
-4.4% [123]
0.187 (3.802)


![III. Public Debt Management Strategy 2013-20151].pdf · III. Public Debt Management Strategy 2013-2015 ... of the Public Debt Law, public debt is an unconditional ... Republic of](https://static.fdocuments.in/doc/165x107/5aebf0267f8b9a36698f0205/iii-public-debt-management-strategy-2013-1pdfiii-public-debt-management-strategy.jpg)