BEING A PART OF 550cr.* OUR GROWTH STORY
24
Facts Monthly fund analysis and market reviews Figures in August 2017 BOI AXA Regular Return Fund BOI AXA Equity Debt Rebalancer Fund BOI AXA Treasury Advantage Fund BOI AXA Short Term Income Fund THANK YOU FOR BEING A PART OF OUR GROWTH STORY * Latest AUM as on August 31, 2017. Refer Pg. No. 2 for Product Labelling Crossed ` 100cr.* Crossed ` 250cr.* Crossed ` 375cr.* Crossed ` 550cr.*
Transcript of BEING A PART OF 550cr.* OUR GROWTH STORY
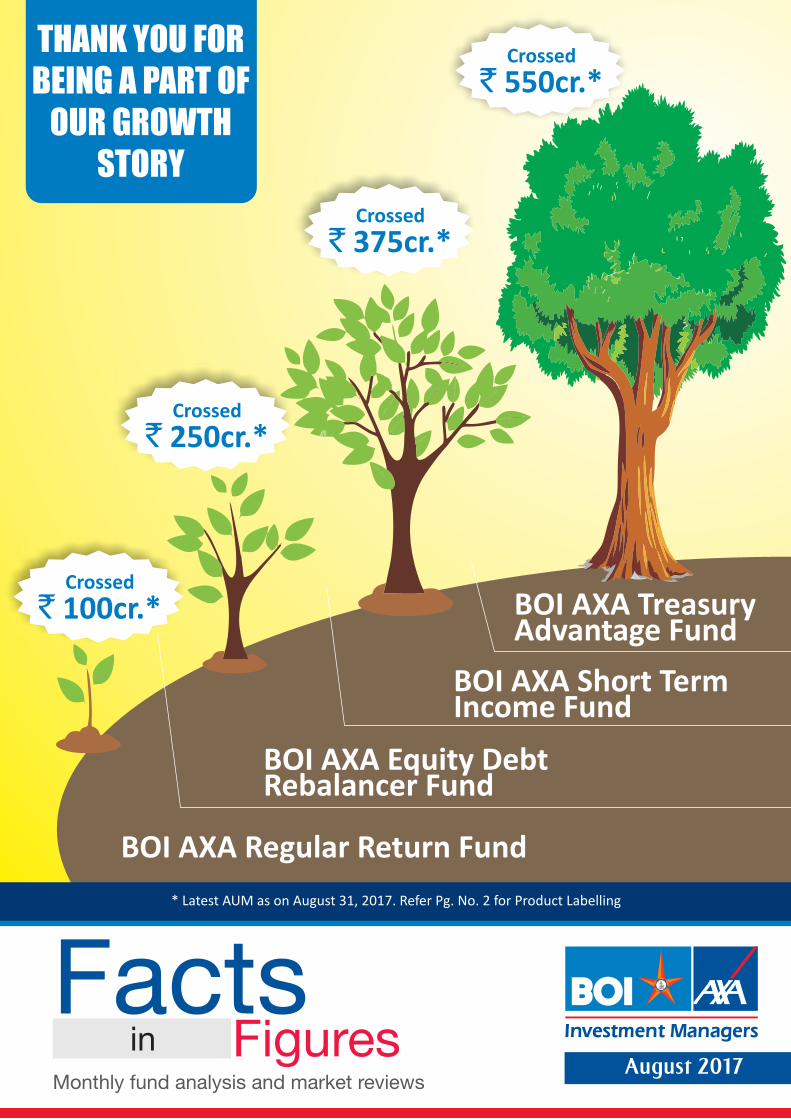
Facts Monthly fund analysis and market reviews
Figures inAugust 2017
BOI AXA Regular Return Fund
BOI AXA Equity Debt Rebalancer Fund
BOI AXA Treasury Advantage Fund
BOI AXA Short Term Income Fund
THANK YOU FOR BEING A PART OF
OUR GROWTH STORY
* Latest AUM as on August 31, 2017. Refer Pg. No. 2 for Product Labelling
Crossed
` 100cr.*
Crossed
` 250cr.*
Crossed
` 375cr.*
Crossed
` 550cr.*

2
PRODUCT LABEL
*Investor should consult their financial advisor if they are not clear about the suitability of the product.
SCHEME THIS PRODUCT IS SUITABLE FOR INVESTORS WHO ARE SEEKING*:
BOI AXA Treasury Advantage Fund
(An Open Ended Income Scheme)
• Regular income over short term.
• Investment in Debt and Money Market Instruments
BOI AXA Short Term Income Fund
(An Open Ended Income Scheme)
• Regular income over short to medium term.
• Investment in Debt / Money Market Instruments / Govt. Securities with portfolio average maturity not exceeding 5 years.
BOI AXA Regular Return Fund
(An Open Ended Income Scheme)
• Long term capital appreciation and regular income.
• Investment in equity and equity related securities (upto 20%) as well as fixed income securities (Debt/ Money Market Instruments/ Govt.Securities).
BOI AXA Corporate Credit Spectrum Fund
(An Open Ended Debt Scheme)
• Long term capital appreciation
• Investment primarily in corporate debt securities with medium to long term maturities across the credit spectrum within the universe of investment grade rating
RISKOMETER
BOI AXA Equity Fund
(An Open Ended Equity Growth Fund)
• Long-term capital growth.
• Investment in equity and equity-related securities including equity derivatives of companies across market capitalisations.
BOI AXA Tax Advantage Fund
(An Open-Ended Equity Linked Savings Scheme)
• Long-term capital growth.
• Investment in equity and equity-related securities of companies across market capitalisations.
BOI AXA Equity Debt Rebalancer Fund
(An Open Ended Dynamic Fund)
• Long term capital appreciation
• Dynamic asset allocation between equity and fixed income based on equity market valuations
Moderate
Low
High
Moderately
Low
ModeratelyHigh
Investors understand that their principal will be at moderately high risk
LOW HIGH
BOI AXA Manufacturing & Infrastructure Fund
(An Open Ended Sector Scheme)
• Long-term capital growth.
• Investment in equity and equity-related securities of companies engaged in manufacturing & infrastructure related sectors.
Moderate
Low
High
Moderately
Low
ModeratelyHigh
Investors understand that their principal will be at high risk
LOW HIGH
BOI AXA Liquid Fund
(An Open Ended Liquid Scheme)
• Income over short term.
• Investment in Debt and Money Market Instruments.Moderate
Low
High
Moderately
Low
ModeratelyHigh
Investors understand that their principal will be at low risk
LOW HIGH
Moderate
Low
High
Moderately
Low
ModeratelyHigh
Investors understand that their principal will be at moderately low risk
LOW HIGH
Moderate
Low
High
Moderately
Low
ModeratelyHigh
Investors understand that their principal will be at moderate risk
LOW HIGH
BOI AXA Mid Cap Equity & Debt Fund
(An Open-Ended Equity Fund)
• Long term capital appreciation and income distribution
• Equity fund investing in mid cap equity and equity related securities as well as fixed income securities.
Mutual Fund investments are subject to market risks, read all scheme related documents carefully.

3
Alok SinghCHIEF INVESTMENT OFFICERMARKET UPDATE
Market Update : GDP, GST & The Indian Economy
In recent times, geopolitical situations across the globe have induced a lot of volatility into financial markets. In the midst of this
agitation, the Indian economy was visibly grappling with GST related issues. Recent data released by the Central statistics Office shows
that India’s GDP growth slipped to 5.7% in Q1 FY18. Compared to the slowdown in Q4 FY17, largely related to lack of availability of cash,
the slowdown in Q1 FY18 can be attributed to adjustments in inventories of companies on account of the GST roll out from July 1st,
2017. The manufacturing sector is expected to revert to normal levels in the coming months. Purchasing Managers Index (PMI) data
released for August implies that activity has returned to trend levels and is expected to improve as re-monetization progresses.
During the last quarter, companies at large witnessed reduction in both top-line and bottom-line not only due to GST related issues, but
also because of higher commodity prices leading to contraction in margins. The mainstay of growth during the quarter continued to be
government spending and private consumption, though at rates lower than in Q4 FY17. Consumption is expected to boost growth in the
rest of FY 18 as incomes are set to be boosted by the Pay Commission, good agriculture produce and wealth effects.
The BOI AXA Perspective
Despite the dip in GDP, the rupee was able to hold on to its value globally. Foreign Portfolio Investment (FPI) inflows were seen in both
asset classes: debt and equity. On the valuation front, while traditional measures of valuation such as Real Effective Exchange Rate
(REER) show that the INR is overvalued, new research put out by RBI using Productivity Based (Balassa-Samuelson) and Sustainable
Current Account approaches show that INR is fairly valued. While FPI outflows may put some pressure on the INR, it seems on the
valuation front, the currency is not at overvalued levels.
The Indian government has front-loaded its spending in Q1 FY18 leading to a 93% utilisation of this year’s fiscal deficit target during
April-July compared to 73% of fiscal deficit target last year. The bigger challenge that looms for the economy will come in the form of
cutback in government spending. However, some of the dip in government spending in the coming months will be made up by revival in
other sectors such as manufacturing and real estate. In a positive show of fortunes, the trade, hotels, communication & broadcasting,
financial services, real estate and professional services sub-segments are showing signs of revival. In addition, the strength in non-oil-
non-gold imports suggests that economic activity will revert to normal levels from Q2 FY18 onwards thus ensuring that Gross value
added (GVA) growth is similar to last year’s levels.
The sharp decline in Q1 growth implies that RBI may also revise its growth outlook for FY18. Concerns raised by Monetary Policy
Committee (MPC) members on the growth front in the minutes released on 16th August 2017 have been proven right. While growth is
expected to bounce back, the RBI would have to lower its growth estimate of 7.3% for FY18. In addition, subdued CAPEX outlook amidst
high real rates implies RBI will be under pressure to cut rates one more time. While MPC members are ideally expected to have a
preference of 4% inflation over growth, a scenario wherein inflation objective looks achievable, another rate cut in the near future
cannot be ruled out.
Source; RBI, Bloomberg, IDFC (Unless indicated otherwise); Dated: September 1, 2017

BOI Equity Fund
AXA
An Open Ended Equity Growth FundAll data as on August 31, 2017(Unless indicated otherwise)
E
Q
U
I
T
Y
G
R
O
W
T
H
F
U
N
D
Debt Fund Liquid FundHybrid FundEquity Fund
PORTFOLIO DETAILSPortfolio Holdings Industry/ % to Net
Rating Assets
EQUITY & EQUITY RELATED
Listed / awaiting listing on the stock exchanges
Yes Bank Limited Banks 4.57
HDFC Bank Limited Banks 3.94
Maruti Suzuki India Limited Auto 3.93
ITC Limited Consumer Non Durables 3.76
RBL Bank Limited Banks 3.59
IIFL Holdings Limited Finance 3.59
IndusInd Bank Limited Banks 3.38
Motilal Oswal Financial Services Limited Finance 3.29
Hindalco Industries Limited Non - Ferrous Metals 3.28
The Federal Bank Limited Banks 2.97
Piramal Enterprises Limited Pharmaceuticals 2.86
Reliance Capital Limited Finance 2.69
Larsen & Toubro Limited Construction Project 2.62
Aurobindo Pharma Limited Pharmaceuticals 2.57
Minda Industries Limited Auto Ancillaries 2.45
Godrej Industries Limited Consumer Non Durables 2.38
Future Retail Limited Retailing 2.38
Graphite India Limited Industrial Products 2.36
Crompton Greaves Consumer Consumer Durables 2.28
Housing & Urban Development Finance 2.23
Vinati Organics Limited Chemicals 2.22
Housing Development Finance Finance 2.20
Aarti Industries Limited Chemicals 2.19
KEI Industries Limited Industrial Products 2.19
Reliance Industries Limited Petroleum Products 2.15
Eicher Motors Limited Auto 2.14
Dalmia Bharat Limited Cement 2.11
SREI Infrastructure Finance Limited Finance 2.09
The Ramco Cements Limited Cement 2.03
UltraTech Cement Limited Cement 2.03
Sintex Plastics Technology Limited Industrial Products 2.01
UPL Limited Pesticides 1.96
Titan Company Limited Consumer Durables 1.74
Britannia Industries Limited Consumer Non Durables 1.52
Dilip Buildcon Limited Construction 1.43
Whirlpool of India Limited Consumer Durables 1.34
BSE Limited Finance 0.88
Century Plyboards (India) Limited Consumer Durables 0.83
Total 94.16
Cash & Cash Equivalent
Net Receivables/Payables 1.89
CBLO / Reverse Repo / Liquid Fund Investments 3.95
Total 5.84
Electricals Limited
Corporation Limited
Corporation Limited
GRAND TOTAL 100.00
4
THIS PRODUCT IS SUITABLE FOR INVESTORS WHO ARE SEEKING^:
•Long-term capital growth.
•Investment in equity and equity-related securities including equity derivatives of companies across market capitalisations.
^For details, refer Page 2.
INVESTMENT STYLE
Growth Blend Value
Small
Medium
Large
Mar
ket
Cap
ital
isat
ion
SIP SHIELD AVAILABLE
TOP 15 INDUSTRY ALLOCATION
INVESTMENT OBJECTIVE
To generate income and long-term capital appreciation through a diversified portfolio of predominantly equity and equity-related securities including equity derivatives, across all market capitalizations. The Scheme is in the nature of diversified multi-cap fund. The Scheme is not providing any assured or guaranteed returns. There is no assurance that the investment objectives of the scheme will be realized.
WHO SHOULD INVEST
The fund is suited to investors with some prior experience in equity investing or even for first time equity investors who are aware of the risk associated with investing in equities, particularly with regard to mid and small capitalization companies.
BENCHMARK
Nifty 50 Index
DATE OF ALLOTMENT
October 21, 2008
FUND MANAGER
Alok Singh: (w.e.f. February 16, 2017) Around 17 years of experience, including 10 years in mutual fund industry.
AVERAGE AUM
` 86.12 Crs.
LATEST AUM
` 88.79 Crs.
MINIMUM APPLICATION AMOUNT (LUMPSUM)
Regular/ Direct Plan ` 5,000 and in multiples of ̀ 1
ADDITIONAL PURCHASE AMOUNT
Regular/ Direct Plan ` 1,000 and in multiples of ̀ 1
TOTAL EXPENSE RATIO
2.96% 2.25%1.88%
Average Expense Ratio excludes Goods & Services Tax on Management Fee
PORTFOLIO TURNOVER RATIO# #1.15 Times ( Basis last rolling 12 months)
OTHER PARAMETERS
Standard Deviation (Annualized): 15.05% (BOI AXA Equity Fund)15.61% (Nifty 50 Index)
Beta: 0.93Sharpe Ratio*: 0.52Tracking Error (Annualized): 3.83%Above ratios are calculated using 6 years history of monthly returns*Risk-free rate assumed to be 5.96% (MIBOR as on August 31, 2017)
NAV NAV (`)
Growth 34.40 Growth 35.93Bonus 34.39 Bonus 35.93Regular Dividend 13.47 Regular Dividend 15.28Quarterly Dividend 13.43 Quarterly Dividend 13.14
Growth 36.19Bonus 18.74Regular Dividend 15.43Quarterly Dividend 13.32
LOAD STRUCTURE (FOR ALL PLANS)
NIL
1% if redeemed within 1 year from the date of allotment
For Dividend History please refer page no. 14.
For Scheme Performance please refer page no. 15 to 20.
Regular Plan: Eco Plan: Direct Plan:
Regular Plan Eco Plan
Direct Plan
Entry Load
Exit Load
1.96%2.15%2.38%2.45%2.62%
3.28%4.40%
5.43%6.07%6.17%6.19%
6.56%7.67%
16.97%18.44%
PesticidesPetroleum Products
RetailingAuto Ancillaries
Construction ProjectNon - Ferrous Metals
ChemicalsPharmaceuticals
AutoCement
Consumer DurablesIndustrial Products
Consumer Non DurablesFinance
Banks

E
Q
U
I
T
Y
L
I
N
K
E
D
S
A
V
I
N
G
S
C
H
E
M
E
BOI AXATax Advantage FundAn Open-Ended Equity Linked Savings SchemeAll data as on August 31, 2017 (Unless indicated otherwise)
80C Benefit
5
THIS PRODUCT IS SUITABLE FOR INVESTORS WHO ARE SEEKING^:
•Long-term capital growth.
•Investment in equity and equity-related securities of companies across market capitalisations.
PORTFOLIO DETAILSPortfolio Holdings Industry/ % to Net
Rating Assets
EQUITY & EQUITY RELATED
Listed / awaiting listing on the stock exchanges
IndusInd Bank Limited Banks 4.29
Yes Bank Limited Banks 3.67
Minda Industries Limited Auto Ancillaries 3.03
Maruti Suzuki India Limited Auto 2.92
Motilal Oswal Financial Services Limited Finance 2.81
Future Retail Limited Retailing 2.59
Aurobindo Pharma Limited Pharmaceuticals 2.53
HDFC Bank Limited Banks 2.48
The Federal Bank Limited Banks 2.43
Aarti Industries Limited Chemicals 2.42
IIFL Holdings Limited Finance 2.17
TeamLease Services Limited Commercial Services 2.15
Shankara Building Products Limited Ferrous Metals 2.14
Muthoot Finance Limited Finance 2.14
Dalmia Bharat Limited Cement 2.11
Hindustan Petroleum Corporation Limited Petroleum Products 2.04
Igarashi Motors India Limited Auto Ancillaries 2.04
Indraprastha Gas Limited Gas 2.03
Piramal Enterprises Limited Pharmaceuticals 2.03
Reliance Capital Limited Finance 2.01
Capital First Limited Finance 1.98
Graphite India Limited Industrial Products 1.96
Blue Star Limited Consumer Durables 1.91
SREI Infrastructure Finance Limited Finance 1.87
Motherson Sumi Systems Limited Auto Ancillaries 1.84
Timken India Limited Industrial Products 1.79
Sintex Plastics Technology Limited Industrial Products 1.76
RBL Bank Limited Banks 1.74
Eicher Motors Limited Auto 1.72
Apar Industries Limited Industrial Capital Goods 1.67
KEI Industries Limited Industrial Products 1.66
Torrent Power Limited Power 1.55
Hindalco Industries Limited Non - Ferrous Metals 1.54
Vinati Organics Limited Chemicals 1.53
Heritage Foods Limited Consumer Non Durables 1.53
Jyothy Laboratories Limited Consumer Non Durables 1.53
Century Plyboards (India) Limited Consumer Durables 1.39
Techno Electric & Engineering Construction Project 1.38
Astral Poly Technik Limited Industrial Products 1.37
Crompton Greaves Consumer Consumer Durables 1.31
The Ramco Cements Limited Cement 1.31
PVR Limited Media & Entertainment 1.30
Quess Corp Limited Commercial Services 1.27
Pidilite Industries Limited Chemicals 1.27
BSE Limited Finance 1.26
Finolex Cables Limited Industrial Products 1.25
HEG Limited Industrial Products 1.20
Steel Strips Wheels Limited Auto Ancillaries 1.20
Housing & Urban Development Finance 1.12
Bhansali Engineering Polymers Limited Industrial Products 1.04
Whirlpool of India Limited Consumer Durables 1.00
Total 96.28
Company Limited
Electricals Limited
Corporation Limited
Cash & Cash Equivalent
Net Receivables/Payables (0.44)
CBLO / Reverse Repo / Liquid Fund Investments 4.15
Total 3.72
GRAND TOTAL 100.00
Debt Fund Liquid FundHybrid FundEquity FundINVESTMENT STYLE
Growth Blend Value
Small
Medium
Large
Mar
ket
Cap
ital
isat
ion
^For details, refer Page 2.
INVESTMENT OBJECTIVE
The Scheme seeks to generate long-term capital growth from a diversified portfolio of predominantly equity and equity-related securities across all market capitalisations. The Scheme is in the nature of diversified multi-cap fund. The Scheme is not providing any assured or guaranteed returns. There can be no assurance that the investment objectives of the Scheme will be realized.
WHO SHOULD INVEST
The fund is suitable for investors with a long-term investment horizon. In terms of fund management, the 3 year lock-in period gives the fund manager the comfort of planning his investments with a long-term horizon.
BENCHMARK
Nifty 50 Index
DATE OF ALLOTMENT
February 25, 2009
FUND MANAGER
Saurabh Kataria: Around 12 years of industry experience.
AVERAGE AUM
` 96.35 Crs.
LATEST AUM
` 100.30 Crs.
MINIMUM APPLICATION AMOUNT (LUMPSUM)
Regular/ Direct Plan ` 500 and in multiples of ̀ 1
ADDITIONAL PURCHASE AMOUNT
Regular/ Direct Plan ` 500 and in multiples of ̀ 1
TOTAL EXPENSE RATIO
3.00% 2.25% 1.79%
Average Expense Ratio excludes Goods & Services Tax on Management Fee
PORTFOLIO TURNOVER RATIO# #0.84 Times ( Basis last rolling 12 months)
OTHER PARAMETERS
Standard Deviation (Annualized): 15.18% (BOI AXA Tax Advantage Fund)15.61% (Nifty 50 Index)
Beta: 0.91Sharpe Ratio*: 0.66Tracking Error (Annualized): 5.33%Above ratios are calculated using 6 years history of monthly returns*Risk-free rate assumed to be 5.96% (MIBOR as on August 31, 2017)
NAV NAV (`)
Growth 49.50 Growth 51.58Dividend 15.81 Dividend 15.84
Growth 52.73Dividend 27.23
LOAD STRUCTURE (FOR ALL PLANS)
NIL
NIL
For Dividend History please refer page no. 14.
For Scheme Performance please refer page no. 15 to 20.
(w.e.f June 29, 2013)
Regular Plan: Eco Plan: Direct Plan:
Regular Plan Eco Plan
Direct Plan
Entry Load
Exit Load
SIP SHIELD AVAILABLE
TOP 15 INDUSTRY ALLOCATION
2.03%2.04%2.14%
2.59%3.06%
3.41%3.42%
4.56%4.64%
5.22%5.60%
8.12%12.03%
14.61%15.35%
GasPetroleum Products
Ferrous MetalsRetailing
Consumer Non DurablesCommercial Services
CementPharmaceuticals
AutoChemicals
Consumer DurablesAuto Ancillaries
Industrial ProductsBanks
Finance

An Open-Ended Sector Scheme**Fundamental Attributes and Name of the fund have been changed from BOI AXA Focused Infrastructure Fund to BOI AXA Manufacturing & Infrastructure Fund w.e.f. January 19, 2016.All data as on August 31, 2017 (Unless indicated otherwise)
BOI Manufacturing & Infrastructure Fund**
AXA
E
Q
U
I
T
Y
S
E
C
T
O
R
S
C
H
E
M
E
PORTFOLIO DETAILSPortfolio Holdings Industry/ % to Net
Rating Assets
EQUITY & EQUITY RELATED
Listed / awaiting listing on the stock exchanges
Power Grid Corporation of India Limited Power 6.43
Larsen & Toubro Limited Construction Project 5.04
Apar Industries Limited Industrial Capital Goods 4.68
Graphite India Limited Industrial Products 4.38
Blue Star Limited Consumer Durables 3.99
Kalpataru Power Transmission Limited Power 3.81
Maruti Suzuki India Limited Auto 3.58
KNR Constructions Limited Construction 3.56
Orient Refractories Limited Industrial Products 3.24
Techno Electric & Engineering Construction Project 3.08
The Ramco Cements Limited Cement 2.97
Astral Poly Technik Limited Industrial Products 2.96
APL Apollo Tubes Limited Ferrous Metals 2.95
KEI Industries Limited Industrial Products 2.77
ITC Limited Consumer Non Durables 2.73
VA Tech Wabag Limited Engineering Services 2.70
Greaves Cotton Limited Industrial Products 2.67
Torrent Power Limited Power 2.67
Carborundum Universal Limited Industrial Products 2.43
Kirloskar Brothers Limited Industrial Products 2.34
AIA Engineering Limited Industrial Products 2.25
Bhansali Engineering Polymers Limited Industrial Products 2.22
Aurobindo Pharma Limited Pharmaceuticals 2.21
Hindalco Industries Limited Non - Ferrous Metals 2.19
Eicher Motors Limited Auto 2.04
Triveni Turbine Limited Industrial Capital Goods 2.03
Siemens Limited Industrial Capital Goods 2.00
Sintex Plastics Technology Limited Industrial Products 1.96
Aarti Industries Limited Chemicals 1.95
Igarashi Motors India Limited Auto Ancillaries 1.95
Astra Microwave Products Limited Telecom - Equipment & 1.91
Dilip Buildcon Limited Construction 1.63
Skipper Limited Industrial Capital Goods 1.38
HEG Limited Industrial Products 1.22
R.P.P. Infra Projects Limited Construction 1.01
Total 96.94
NON-CONVERTIBLE DEBENTURES
NTPC Limited CRISIL AAA 0.21
Total 0.21
Cash & Cash Equivalent
Net Receivables/Payables 2.75
CBLO / Reverse Repo / Liquid Fund Investments 0.09
Total 2.85
Company Limited
Accessories
GRAND TOTAL 100.00
All corporate ratings are assigned by rating agencies like CRISIL, CARE, ICRA, India Rating,
Brickwork.
THIS PRODUCT IS SUITABLE FOR INVESTORS WHO ARE SEEKING^:
•Long-term capital growth.
•Investment in equity and equity-related securities of companies engaged in manufactur ing & infrastructure related sectors.
6
Debt Fund Liquid FundHybrid FundEquity FundINVESTMENT STYLE
Growth Blend Value
Small
Medium
Large
Mar
ket
Cap
ital
isat
ion
^For details, refer Page 2.
EQUITY INDUSTRY ALLOCATION
INVESTMENT OBJECTIVE
The Scheme seeks to generate long term capital appreciation through a portfolio of predominantly equity and equity related securities of companies engaged in manufacturing and infrastructure related sectors. Further, there can be no assurance that the investment objectives of the scheme will be realized. The Scheme is not providing any assured or guaranteed returns.
WHO SHOULD INVEST
The Scheme would be more suitable for investors who are desirous of increasing their exposure to manufacturing & infrastructure space in their personal equity portfolio. Thus, this Scheme could act as a "top up" over existing investments of such investors in diversified equity funds. However, for a first time investor, it might still be advisable to initially start his investment with a diversified equity fund.
BENCHMARK (SINCE JANUARY 19, 2016)
S&P BSE India Manufacturing Index (50%) and S&P BSE India Infrastructure Index (50%)
DATE OF ALLOTMENT
March 05, 2010
FUND MANAGER
Alok Singh: (w.e.f. February 16, 2017) Around 17 years of experience, including 10 years in mutual fund industry.
AVERAGE AUM
` 10.50 Crs.
LATEST AUM
` 10.77 Crs.
MINIMUM APPLICATION AMOUNT (LUMPSUM)
Regular/ Direct Plan ` 5,000 and in multiples of ̀ 1
ADDITIONAL PURCHASE AMOUNT
Regular/ Direct Plan ` 1,000 and in multiples of ̀ 1
TOTAL EXPENSE RATIO
2.99% 1.66%
Average Expense Ratio excludes Goods & Services Tax on Management Fee
PORTFOLIO TURNOVER RATIO# #0.68 Times ( Basis last rolling 12 months)
OTHER PARAMETERS
Standard Deviation (Annualized): 14.55% (BOI AXA Manufacturing & Infrastructure Fund)14.78% (S&P BSE India Manufacturing Index (50%) and S&P BSE India Infrastructure Index (50%)
Beta: 0.90Sharpe Ratio*: 0.39Tracking Error (Annualized): 6.23%
Above ratios are calculated using 3 years history of monthly returns of the fund and the above Indices as the inception of S&P BSE Infrastructure Index is May 28, 2014.
*Risk-free rate assumed to be 5.96% (MIBOR as on August 31, 2017)
NAV NAV (`)
Growth 15.36 Growth 16.21Regular Dividend 14.25 Regular Dividend 15.41Quarterly Dividend 13.60 Quarterly Dividend 15.99
LOAD STRUCTURE (FOR ALL PLANS)
NIL
1% if redeemed within 1 year from the date of allotment
For Dividend History please refer page no. 14.
For Scheme Performance please refer page no. 15 to 20.
Regular Plan: Direct Plan:
Regular Plan Direct Plan
Entry Load
Exit Load
1.91%1.95%1.95%2.19%2.21%2.70%2.73%2.95%2.97%
3.99%5.62%6.21%
8.12%10.09%
12.91%28.44%
Telecom - Equipment & AccessoriesAuto Ancillaries
ChemicalsNon - Ferrous Metals
PharmaceuticalsEngineering Services
Consumer Non DurablesFerrous Metals
CementConsumer Durables
AutoConstruction
Construction ProjectIndustrial Capital Goods
PowerIndustrial Products

E
Q
U
I
T
Y
S
E
C
T
O
R
S
C
H
E
M
E
PORTFOLIO DETAILSPortfolio Holdings Industry/ % to Net
Rating Assets
EQUITY & EQUITY RELATEDListed / awaiting listing on the stock exchangesHeritage Foods Limited Consumer Non Durables 3.20Minda Industries Limited Auto Ancillaries 3.15Apar Industries Limited Industrial Capital Goods 3.05The Federal Bank Limited Banks 2.41SREI Infrastructure Finance Limited Finance 2.19Graphite India Limited Industrial Products 2.15Sintex Plastics Technology Limited Industrial Products 2.13Future Retail Limited Retailing 2.09KEI Industries Limited Industrial Products 2.09Astral Poly Technik Limited Industrial Products 2.09Igarashi Motors India Limited Auto Ancillaries 1.97JM Financial Limited Finance 1.79Vinati Organics Limited Chemicals 1.63Blue Star Limited Consumer Durables 1.61Housing & Urban Development Finance 1.58
Carborundum Universal Limited Industrial Products 1.57TeamLease Services Limited Commercial Services 1.56Godrej Industries Limited Consumer Non Durables 1.53Shankara Building Products Limited Ferrous Metals 1.53VA Tech Wabag Limited Engineering Services 1.51Indraprastha Gas Limited Gas 1.49AU Small Finance Bank Limited Banks 1.49Centrum Capital Limited Miscellaneous 1.43V-Mart Retail Limited Retailing 1.36Techno Electric & Engineering Construction Project 1.27
HEG Limited Industrial Products 1.21IIFL Holdings Limited Finance 1.18Aarti Industries Limited Chemicals 1.14BSE Limited Finance 1.05APL Apollo Tubes Limited Ferrous Metals 1.04Bhansali Engineering Polymers Limited Industrial Products 1.03Timken India Limited Industrial Products 1.02Crompton Greaves Consumer Consumer Durables 1.01
Dalmia Bharat Limited Cement 0.98RBL Bank Limited Banks 0.92Supreme Industries Limited Industrial Products 0.92Somany Ceramics Limited Construction 0.85Navin Fluorine International Limited Chemicals 0.84Century Plyboards (India) Limited Consumer Durables 0.83AIA Engineering Limited Industrial Products 0.82Orient Refractories Limited Industrial Products 0.81Muthoot Finance Limited Finance 0.73Cera Sanitaryware Limited Construction 0.73Finolex Industries Limited Industrial Products 0.71Steel Strips Wheels Limited Auto Ancillaries 0.66Triveni Turbine Limited Industrial Capital Goods 0.66Natco Pharma Limited Pharmaceuticals 0.57PVR Limited Media & Entertainment 0.56Advanced Enzyme Technologies Limited Consumer Non Durables 0.54Kirloskar Brothers Limited Industrial Products 0.50Sudarshan Chemical Industries Limited Chemicals 0.42Total 69.60
BONDS & NCDsDewan Housing Finance Corporation Limited CARE AAA 8.67Housing Development Finance CRISIL AAA 3.42
Janalakshmi Financial Services Limited ICRA A 3.38Indiabulls Housing Finance Limited CARE AAA 0.85Total 16.33
GOVERNMENT BONDGovernment of India SOV 7.75Total 7.75
Cash & Cash EquivalentNet Receivables/Payables 1.41CBLO / Reverse Repo Investments 4.91Total 6.32
Corporation Limited
Company Limited
Electricals Limited
Corporation Limited
GRAND TOTAL 100.00
All corporate ratings are assigned by rating agencies like CRISIL, CARE, ICRA, India Rating, Brickwork.
7
Debt Fund Liquid FundHybrid FundEquity FundINVESTMENT STYLE
Growth Blend Value
Small
Medium
Large
Mar
ket
Cap
ital
isat
ion
EQUITY INDUSTRY ALLOCATION
INVESTMENT OBJECTIVE
The scheme's objective is to provide capital appreciation and income distribution to investors from a portfolio constituting of mid cap equity and equity related securities as well as fixed income securities. However there can be no assurance that the investment objectives of the Scheme will be realized.
BENCHMARK
Nifty Midcap 100 Index (70%) and CRISIL Short Term Bond Fund Index (30%)
DATE OF ALLOTMENT
July 20, 2016
FUND MANAGER
Alok Singh: (w.e.f. February 16, 2017) Around 17 years of experience, including 10 years in mutual fund industry.
Piyush Baranwal: Over 9 years’ experience in Portfolio Management and trading in Fixed Income securities.
AVERAGE AUM
` 167.50 Crs.
$LATEST AUM
` 176.22 Crs.
MINIMUM APPLICATION AMOUNT (LUMPSUM)
Regular/ Direct Plan ` 5,000 and in multiples of ̀ 1
ADDITIONAL PURCHASE AMOUNT
Regular/ Direct Plan ` 1,000 and in multiples of ̀ 1
TOTAL EXPENSE RATIO
2.60% 1.93%
Average Expense Ratio excludes Goods & Services Tax on Management Fee
PORTFOLIO TURNOVER RATIO
# #1.91 Times ( Basis last rolling 12 months)
NAV NAV (`)
Growth 12.63 Growth 12.76Regular Dividend 11.84 Regular Dividend 11.85
LOAD STRUCTURE (FOR ALL PLANS)
NIL
1% if redeemed within 12 months from the date of allotment
(w.e.f. July 20, 2016)
For Dividend History please refer page no. 14.
For Scheme Performance please refer page no. 15 to 20.
Regular Plan: Direct Plan:
Regular Plan Direct Plan
Entry Load
Exit Load
BOI AXA Mid Cap Equity & Debt Fund An Open-Ended Equity FundAll data as on August 31, 2017 (Unless indicated otherwise)
THIS PRODUCT IS SUITABLE FOR INVESTORS WHO ARE SEEKING^:
• Long term capital appreciation and income distribution
• Equity fund investing in mid cap equity and equity related securities as well as fixed income securities.
^For details, refer Page 2.
Crossed$
`175 crores
0.56%0.57%
0.98%1.27%1.43%1.49%1.51%1.56%1.58%
2.56%3.44%3.46%3.71%4.04%
4.82%5.27%
5.78%8.52%
17.05%
Media & EntertainmentPharmaceuticals
CementConstruction Project
MiscellaneousGas
Engineering ServicesCommercial Services
ConstructionFerrous Metals
Consumer DurablesRetailing
Industrial Capital GoodsChemicals
BanksConsumer Non Durables
Auto AncillariesFinance
Industrial Products

BOI Equity Debt Rebalancer Fund
AXA
Equity Fund Debt Fund Liquid FundEquity Fund Hybrid Fund
H
Y
B
R
I
D
S
C
H
E
M
E
An Open Ended Dynamic FundAll data as on August 31, 2017 (Unless indicated otherwise)
THIS PRODUCT IS SUITABLE FOR INVESTORS WHO ARE SEEKING^:
•Long term capital appreciation
•Dynamic asset allocation between equity and fixed income based on equity market valuations
8
EQUITY INDUSTRY ALLOCATION
INVESTMENT STYLE
Growth Blend Value
Small
Medium
Large
Mar
ket
Cap
ital
isat
ion
PORTFOLIO DETAILSPortfolio Holdings Industry/ % to Net % to Nav
Rating Assets Derivatives
Portfolio Holdings Industry/ % to Net % to Nav
Rating Assets Derivatives
EQUITY HOLDINGS (UNHEDGED)
Listed / awaiting listing on the
stock exchanges
Bajaj Finance Limited Finance 2.53
IndusInd Bank Limited Banks 2.16
Yes Bank Limited Banks 1.88
Aurobindo Pharma Limited Pharmaceuticals 1.72
Eicher Motors Limited Auto 1.55
HDFC Bank Limited Banks 1.43
Piramal Enterprises Limited Pharmaceuticals 1.22
Hindalco Industries Limited Non - Ferrous Metals 0.99
PNB Housing Finance Limited Finance 0.97
Maruti Suzuki India Limited Auto 0.96
Reliance Industries Limited Petroleum Products 0.94
Motherson Sumi Systems Limited Auto Ancillaries 0.91
Pidilite Industries Limited Chemicals 0.79
Marico Limited Consumer Non Durables 0.68
ITC Limited Consumer Non Durables 0.56
Titan Company Limited Consumer Durables 0.49
Equity Holdings (Unhedged) Total 19.77
EQUITY HOLDINGS (HEDGED)
Equity Holdings (Hedged) Total 45.00 (45.16)
Equity Holdings Total 64.76
BONDS & NCDs
Dewan Housing Finance CARE AAA 6.03
Housing Development Finance CRISIL AAA 1.98
IndoStar Capital Finance Limited CARE AA- 1.19
IDFC Bank Limited ICRA AAA 1.19
Janalakshmi Financial Services Limited ICRA A 1.57
Total 11.97
GOVERNMENT BOND
Government of India SOV 7.71
Total 7.71
FIXED DEPOSITS (MARGIN)
HDFC Bank Limited 0.69
Total 0.69
Cash & Cash Equivalent
Net Receivables/(Payables) after 8.86
adjusting for futures
CBLO / Reverse Repo / Liquid Fund Investments 6.01
Total 14.87
All corporate ratings are assigned by rating agencies like CRISIL, CARE, ICRA, India Rating, Brickwork.
Infosys Limited Software 3.91
Infosys Limited - Future (3.93)
Tata Motors Limited Auto 3.67
Tata Motors Limited - Future (3.70)
State Bank of India Banks 3.42
State Bank of India - Future (3.44)
Other Equity Holding (Hedged) 33.99
Other Stock Futures Holding (Hedged) (34.10)
Corporation Limited
Corporation Limited
MONEY MARKET INSTRUMENTS
GRAND TOTAL 100.00
^For details, refer Page 2.
INVESTMENT OBJECTIVE
The Scheme aims at generating long term returns with lower volatility by following a disciplined allocation between equity and debt securities. The equity allocation will be determined based on the month end P/E ratio of the Nifty 50 Index. There is no assurance that the investment objectives of the Scheme will be realized and the Scheme does not assure or guarantee any returns.
BENCHMARK
Nifty 50 (50%) & CRISIL Short Term Bond Fund Index (50%)
DATE OF ALLOTMENT
March 14, 2014
FUND MANAGER
Alok Singh (For Debt): (w.e.f. July 18, 2016) Around 17 years of experience, including 10 years in mutual fund industry.
Saurabh Kataria (for Equity): Around 12 years of industry experience.
AVERAGE AUM
` 246.40 Crs.
$LATEST AUM
` 253.66 Crs.
MINIMUM APPLICATION AMOUNT (LUMPSUM)
Regular/ Direct Plan ` 5,000 and in multiples of ̀ 1
ADDITIONAL PURCHASE AMOUNT
Regular/ Direct Plan ` 1,000 and in multiples of ̀ 1
TOTAL EXPENSE RATIO
2.25% 1.70%
Average Expense Ratio excludes Goods & Services Tax on Management Fee
AVERAGE MATURITY & MODIFIED DURATION
Average Maturity: 3.31 YearsModified Duration: 2.44
NAV NAV (`)
LOAD STRUCTURE (FOR ALL PLANS)
NIL
1% if redeemed within 1 year from the date of allotment
For Dividend History please refer page no. 14.
For Scheme Performance please refer page no. 15 to 20.
(w.e.f. September 11, 2014)
Growth 14.7360 Growth 14.9714Dividend 11.0753 Dividend 12.5081
Regular Plan:Direct Plan:
Regular Plan Direct Plan
Entry Load
Exit Load
Crossed$
`250 crores
0.49%
0.79%
0.91%
0.94%
0.99%
1.24%
2.51%
2.93%
3.50%
5.47%
Consumer Durables
Chemicals
Auto Ancillaries
Petroleum Products
Non - Ferrous Metals
Consumer Non Durables
Auto
Pharmaceuticals
Finance
Banks
Equity Fund Debt Fund Liquid FundEquity Fund Hybrid Fund
PORTFOLIO DETAILS
H
Y
B
R
I
D
S
C
H
E
M
E
Portfolio Holdings Industry/ % to Net Rating Assets
Portfolio Holdings Industry/ % to Net Rating Assets
EQUITY & EQUITY RELATEDListed / awaiting listing on the stock exchangesShankara Building Products Limited Ferrous Metals 1.10Dr. Lal Path Labs Limited Healthcare Services 0.86RBL Bank Limited Banks 0.82Motilal Oswal Financial Services Limited Finance 0.75Apar Industries Limited Industrial Capital Goods 0.72Piramal Enterprises Limited Pharmaceuticals 0.65SREI Infrastructure Finance Limited Finance 0.65Hindalco Industries Limited Non - Ferrous Metals 0.64Graphite India Limited Industrial Products 0.63Sintex Plastics Technology Limited Industrial Products 0.61Minda Industries Limited Auto Ancillaries 0.61Maruti Suzuki India Limited Auto 0.59The Federal Bank Limited Banks 0.59Future Retail Limited Retailing 0.53Astral Poly Technik Limited Industrial Products 0.52Dalmia Bharat Limited Cement 0.52IIFL Holdings Limited Finance 0.48Housing & Urban Development Finance 0.45
BSE Limited Finance 0.43Crompton Greaves Consumer Electricals Limited Consumer Durables 0.42V-Mart Retail Limited Retailing 0.38KEI Industries Limited Industrial Products 0.38Vinati Organics Limited Chemicals 0.37Steel Strips Wheels Limited Auto Ancillaries 0.36Blue Star Limited Consumer Durables 0.35PVR Limited Media & Entertainment 0.33AU Small Finance Bank Limited Banks 0.32HEG Limited Industrial Products 0.30L&T Technology Services Limited Software 0.30Timken India Limited Industrial Products 0.30Sudarshan Chemical Industries Limited Chemicals 0.29Advanced Enzyme Technologies Limited Consumer Non Durables 0.28Orient Refractories Limited Industrial Products 0.27Eicher Motors Limited Auto 0.24Pidilite Industries Limited Chemicals 0.22UltraTech Cement Limited Cement 0.22Larsen & Toubro Limited Construction Project 0.21Aurobindo Pharma Limited Pharmaceuticals 0.18Triveni Turbine Limited Industrial Capital Goods 0.14Total 18.01
BONDS & NCDsDewan Housing Finance Corporation Limited CARE AAA 5.88Housing Development Finance CRISIL AAA 5.80
IDFC Bank Limited ICRA AAA 4.82IndoStar Capital Finance Limited CARE AA- 2.89Indiabulls Housing Finance Limited CARE AAA 2.41Karuna Healthcare Private Limited IVR A(SO) 1.68NTPC Limited CRISIL AAA 0.01Total 23.49
GOVERNMENT BONDGovernment of India SOV 18.96Total 18.96
Cash & Cash EquivalentNet Receivables/Payables 1.18CBLO / Reverse Repo Investments 24.01Total 25.19
Corporation Limited
Corporation Limited
MONEY MARKET INSTRUMENTSCommercial Paper**Indiabulls Housing Finance Limited CRISIL A1+ 4.79Piramal Enterprises Limited ICRA A1+ 4.78Reliance Industries Limited CRISIL A1+ 4.77Total 14.34
**Thinly traded/Non traded securities and illiquid securities as defined in SEBI Regulations and Guidelines.
All corporate ratings are assigned by rating agencies like CRISIL, CARE, ICRA, India Rating, Brickwork.
GRAND TOTAL 100.00
THIS PRODUCT IS SUITABLE FOR INVESTORS WHO ARE SEEKING^:
• Long term capital appreciation and regular income.
• Investment in equity and equity related securities (upto 20%) as well as fixed income securities (Debt/ Money Market Instruments / Govt. Securities).
9
INVESTMENT STYLE
Growth Blend Value
Small
Medium
Large
Mar
ket
Cap
ital
isat
ion
25.19%
18.96%
^For details, refer Page 2.
COMPOSITION BY ASSETSEQUITY INDUSTRY ALLOCATION
INVESTMENT OBJECTIVE
The Scheme seeks to generate regular income through investments in fixed income securities and also to generate long term capital appreciation by investing a portion in equity and equity related instruments. However, there can be no assurance that the income can be generated, regular or otherwise, or the investment objectives of the Scheme will be realized.
BENCHMARK
CRISIL MIP Blended Index
DATE OF ALLOTMENT
March 18, 2009
FUND MANAGER
Alok Singh: (w.e.f. May 21, 2012) Around 17 years of experience, including 10 years in mutual fund industry.
AVERAGE AUM
` 98.47 Crs.
LATEST AUM
` 104.15 Crs.
MINIMUM APPLICATION AMOUNT (LUMPSUM)
Regular/ Direct Plan ` 10,000 and in multiples of ̀ 1
ADDITIONAL PURCHASE AMOUNT
Regular/ Direct Plan ` 1,000 and in multiples of ̀ 1
TOTAL EXPENSE RATIO
2.00% 1.75% 1.48%
Average Expense Ratio excludes Goods & Services Tax on Management Fee
AVERAGE MATURITY & MODIFIED DURATION
Average Maturity: 2.46 YearsModified Duration: 1.81
NAV NAV (`)
Growth 20.2208 Growth 20.4913Monthly Dividend 12.5207 Monthly Dividend 17.9803Quarterly Dividend 11.5362 Quarterly Dividend 10.8687Annual Dividend 10.8431 Annual Dividend -
LOAD STRUCTURE (FOR ALL PLANS)
NIL
• For redemption/switch out -of up to 10% of the initial units allotted - within 1 year from the date of allotment: “NIL”.
• Any redemption/switch out-in excess of the above mentioned limit would be subject to an exit load of 1%, if the units are switched out within 1 year from the date of allotment of units.
• If the units are redeemed/switched out after 1 year from the date of allotment of units :
For Dividend History please refer page no. 14.
For Scheme Performance please refer page no. 15 to 20.
Regular Plan: Eco Plan: Direct Plan:
Regular Plan Eco Plan
Direct Plan
Entry Load
Exit Load
Growth 20.6065Monthly Dividend 10.5380Quarterly Dividend 11.6785Annual Dividend 10.8932
“NIL”.
14.34%
Equity & equity related securities Commercial Paper
Cash & Cash Equivalent Bonds & NCDs Government Bond
23.49%
18.01%
0.21%0.28%0.30%0.33%
0.64%0.74%0.77%0.83%0.83%0.86%0.86%0.88%0.91%0.97%
1.10%1.73%
2.76%3.01%
Construction ProjectConsumer Non Durables
SoftwareMedia & Entertainment
Non - Ferrous MetalsCement
Consumer DurablesPharmaceuticals
AutoHealthcare Services
Industrial Capital GoodsChemicals
RetailingAuto AncillariesFerrous Metals
BanksFinance
Industrial Products
BOI AXA Regular Return Fund
Crossed$
`100 crores
An Open Ended Income SchemeAll data as on August 31, 2017 (Unless indicated otherwise)

10
COMPOSITION BY ASSETS
BOI Corporate CreditSpectrum Fund
AXA Equity Fund Debt Fund Liquid FundHybrid FundEquity Fund
D
E
B
T
S
C
H
E
M
E
PORTFOLIO DETAILSPortfolio Holdings Industry/ % to Net
Rating Assets
BONDS & NCDs
Listed / awaiting listing on the stock exchanges
Dewan Housing Finance Corporation Limited CARE AAA 8.87
Karuna Healthcare Private Limited IVR A(SO) 8.66
Halcyon Finance and Capital Advisors UNRATED 7.75
Accelarating Education and Development BWR A-(SO) 6.57
Indiabulls Housing Finance Limited CARE AAA 5.87
Piramal Enterprises Limited ICRA AA 5.26
Kwality Limited BWR A+ 5.16
Coffee Day Natural Resources Private Limited BWR A-(SO) 5.02
Tyche Technologies Private Limited UNRATED/BWR A(SO) 4.19
Liquid Investment And Trading Co. Pvt. Ltd. BWR A(SO) 4.19
LIC Housing Finance Limited CRISIL AAA 4.03
Resync Auto Solutions Private Limited BWR A-(SO) 3.65
RKV Enterprise Private Limited UNRATED 3.50
IDFC Bank Limited ICRA AAA 3.40
Bacchus Hospitality Services & BWR A(SO) 3.35
Enzen Global Solutions Pvt Limited CRISIL A- 3.17
Housing Development Finance CRISIL AAA 3.14
Avantha Holdings Limited UNRATED 2.55
DRSR Logistics Private Limited UNRATED 2.20
Bhavya Cements Limited IND BBB- 0.86
Dinram Holdings Private Limited UNRATED 0.37
Indian Railway Finance Corporation Limited CRISIL AAA 0.04
Total 91.79
MONEY MARKET INSTRUMENTS
Certificate of Deposit**
Total 0.41
Cash & Cash Equivalent
Net Receivables/Payables 1.51
CBLO / Reverse Repo / Liquid Fund Investments 6.31
Total 7.82
Pvt Limited
Private Limited
Real Estate Pvt Limited
Corporation Limited
Piramal Enterprises Limited ICRA A1+ 0.39
All corporate ratings are assigned by rating agencies like CRISIL, CARE, ICRA, India Rating,
Brickwork.
**Thinly traded/Non traded securities and illiquid securities as defined in SEBI
Regulations and Guidelines.
GRAND TOTAL 100.00
CREDIT PROFILE
CREDIT QUALITY
High Medium Low
Low
Medium
High
Inte
rest
Rat
eSe
nsi
tivi
ty
An Open Ended Debt SchemeAll data as on August 31, 2017 (Unless indicated otherwise)
5.16%
THIS PRODUCT IS SUITABLE FOR INVESTORS WHO ARE SEEKING^:
• Long term capital appreciation
• Investment primarily in corporate debt securities with medium to long term maturities across the credit spectrum within the universe of investment grade rating.
25.34%
15.24%
7.82%
18.30%
18.46%
10
^For details, refer Page 2.
91.79%
0.39%
INVESTMENT OBJECTIVE
The Scheme’s investment objective is to generate capital appreciation over the long term by
investing predominantly in corporate debt across the credit spectrum within the universe of
investment grade rating. To achieve this objective, the Scheme will seek to make investments
in rated, unrated instruments and structured obligations of public and private companies.
BENCHMARK
CRISIL Composite Bond Fund Index
DATE OF ALLOTMENT
February 27, 2015
FUND MANAGER
Alok Singh: (w.e.f. February 27, 2015) Around 17 years of experience, including 10 years in
mutual fund industry
AVERAGE AUM
` 1,248.40 Crs.
$LATEST AUM
` 1,284.99 Crs.
MINIMUM APPLICATION AMOUNT (LUMPSUM)
Regular/ Direct Plan ` 5,000 and in multiples of ̀ 5,000
ADDITIONAL PURCHASE AMOUNT
Regular/ Direct Plan ` 5,000 and in multiples of ̀ 5,000
TOTAL EXPENSE RATIO
1.85% 1.75%
Average Expense Ratio excludes Goods & Services Tax on Management Fee
OTHER PARAMETERS
Average Maturity: 2.32 Years
Modified Duration: 1.69
Portfolio Yield: 10.29%
NAV NAV (`)
LOAD STRUCTURE (FOR ALL PLANS)
NIL
• 4% if redeemed within 12 months from the date of allotment
• 3% if redeemed after 12 months but within 24 months from the date
of allotment
• 2% if redeemed after 24 months but within 36 months from the date
of allotment
• Nil if redeemed after 36 months from the date of allotment
For Dividend History please refer page no. 14.
For Scheme Performance please refer page no. 15 to 20.
Regular Plan: Direct Plan:
Regular Plan: Direct Plan:
Entry Load
Exit Load
12.7943 12.8333
0.39%3.17%
7.82%
5.26%
Crossed $
`1000 crores
Bonds & NCDs Cash & Cash Equivalent Commercial PaperAAA Unrated A(SO)
BBB-A- A1+A-(SO) Cash & Cash Equivalent
A+AA
0.86%

Duration % of Assets
Upto 3 months 13.91
3 months to 6 months 27.62
6 months to 1 year 12.64
> 1 year 45.83
An Open Ended Income SchemeAll data as on August 31, 2017(Unless indicated otherwise)
BOI Short TermIncome Fund
AXA Equity Fund Hybrid Fund Liquid FundDebt Fund Liquid FundHybrid FundEquity Fund
I
N
C
O
M
E
S
C
H
E
M
E
PORTFOLIO DETAILS
Portfolio Holdings Industry/ % to Net
Rating Assets
BONDS & NCDs
Listed / awaiting listing on the stock exchanges
Dewan Housing Finance Corporation Limited CARE AAA 10.27
Housing Development Finance Corporation Limited CRISIL AAA 8.46
Cox & Kings Limited CARE AA 7.65
Piramal Enterprises Limited ICRA AA 7.44
IDFC Bank Limited ICRA AAA 6.16
Piramal Finance Limited ICRA AA 5.62
Power Finance Corporation Limited CRISIL AAA 5.26
Janalakshmi Financial Services Limited ICRA A 3.81
LIC Housing Finance Limited CRISIL AAA 2.56
IndoStar Capital Finance Limited CARE AA- 2.30
Coffee Day Natural Resources Private Limited BWR A-(SO) 2.12
Indiabulls Housing Finance Limited CARE AAA 0.13
Indian Railway Finance Corporation Limited CRISIL AAA 0.05
Total 61.83
MONEY MARKET INSTRUMENTS
Commercial Paper**
Afcons Infrastructure Limited ICRA A1+ 9.23
Shapoorji Pallonji and Company Pvt Limited ICRA A1+ 7.38
Total 16.62
GOVERNMENT BOND
Government of India SOV 10.63
Total 10.63
Cash & Cash Equivalent
Net Receivables/Payables 2.20
CBLO / Reverse Repo Investments/ Liquid Fund Investments 8.73
Total 10.93
GRAND TOTAL 100.00
All corporate ratings are assigned by rating agencies like CRISIL, CARE, ICRA, India Rating.
**Thinly traded/Non traded securities and illiquid securities as defined in SEBI
Regulations and Guidelines.
THIS PRODUCT IS SUITABLE FOR INVESTORS WHO ARE SEEKING^:
• Regular income over short to medium term.
• Investment in Debt/ Money Market Instruments/ Govt. Securities with portfolio average maturity not exceeding 5 years.
11
CREDIT QUALITY
High Medium Low
Low
Medium
High
Inte
rest
Rat
eSe
nsi
tivi
ty
COMPOSITION BY ASSETSCREDIT PROFILE
^For details, refer Page 2.
INVESTMENT OBJECTIVE
The Scheme seeks to generate income and capital appreciation by investing in a diversified
portfolio of debt and money market securities. However, there can be no assurance that the
income can be generated, regular or otherwise, or the investment objectives of the Scheme
will be realized.
BENCHMARK
CRISIL Short Term Bond Fund Index
DATE OF ALLOTMENT
December 18, 2008
FUND MANAGER
Alok Singh: (w.e.f. May 1, 2014) Around 17 years of experience, including 10 years in mutual
fund industry.
Piyush Baranwal: (w.e.f. July 18, 2016) Over 9 years’ experience in Portfolio Management and
trading in Fixed Income securities.
AVERAGE AUM
` 393.63 Crs.$LATEST AUM
` 392.70 Crs.
MINIMUM APPLICATION AMOUNT (LUMPSUM)
Regular/ Direct Plan ` 5,000 and in multiples of ̀ 1
ADDITIONAL PURCHASE AMOUNT
Regular/ Direct Plan ` 1,000 and in multiples of ̀ 1
TOTAL EXPENSE RATIO
1.25%
0.50%
Average Expense Ratio excludes Goods & Services Tax on Management Fee
OTHER PARAMETERS
Average Maturity: 1.88 Years
Modified Duration: 1.46
Portfolio Yield: 7.49%
NAV NAV (`)
LOAD STRUCTURE (FOR ALL PLANS)
NIL
• For redemption/switch out - of upto10% of the initial-units allotted
within 6 months from the date of allotment : “NIL”.
• Any redemption/switch out - in excess of the above mentioned limit
would be subject to an exit load of 1%, if the units are switched out
within 6 months from the date of allotment of units.
• If the units are switched out after 6 months from the date of
allotment of units: “NIL”.
For Dividend History please refer page no. 14.
For Scheme Performance please refer page no. 15 to 20.
Regular Plan:
Direct Plan:
Regular Plan Direct Plan
Entry Load
Exit Load
Growth 18.5036 Growth 19.3313
Monthly Dividend 10.3914 Monthly Dividend 10.4087
Quarterly Dividend 10.3298 Quarterly Dividend 10.5124
3.81%
32.88%10.63%
20.71%
2.12%
10.93%
2.30%
Crossed$
`375 crores
16.62%
A-(SO)AAA AA A1+
AA-ASovereign
Cash & Cash Equivalent

BOI TreasuryAdvantage Fund
AXA Equity Fund Debt Fund Liquid FundHybrid FundEquity Fund
I
N
C
O
M
E
S
C
H
E
M
E
12
PORTFOLIO DETAILSPortfolio Holdings Industry/ % to Net
Rating Assets
BONDS & NCDs
Listed / awaiting listing on the stock exchanges
Dewan Housing Finance Corporation Limited CARE AAA 8.97
IDFC Bank Limited ICRA AAA 8.84
Cox & Kings Limited CARE AA 8.08
Piramal Enterprises Limited ICRA AA 7.93
Janalakshmi Financial Services Limited ICRA A 6.26
Coffee Day Natural Resources Private Limited BWR A-(SO) 5.60
Piramal Finance Limited ICRA AA 5.04
Aadhar Housing Finance Limited CARE AA+(SO) 4.50
Indiabulls Housing Finance Limited CARE AAA 2.79
Liquid Investment And Trading Co. Pvt. Ltd. BWR A(SO) 2.41
Manappuram Finance Limited CRISIL AA- 0.90
Total 61.33
MONEY MARKET INSTRUMENTS
Commercial Paper**
Shapoorji Pallonji and Company Pvt Limited ICRA A1+ 7.86
Afcons Infrastructure Limited ICRA A1+ 4.97
Sterling and Wilson Pvt Limited IND A1+ 4.46
National Bank For Agriculture and Rural Development CRISIL A1+ 3.57
Raymond Limited CRISIL A1+ 2.66
Manappuram Finance Limited CRISIL A1+ 2.47
Forbes & Company Limited ICRA A1+ 1.79
Reliance Jio Infocomm Limited CARE A1+ 0.89
Coromandel International Limited CRISIL A1+ 0.89
Total 29.58
Cash & Cash Equivalent
Net Receivables/Payables 1.62
CBLO / Reverse Repo Investments 7.47
Total 9.09
GRAND TOTAL 100.00
All corporate ratings are assigned by rating agencies like CRISIL, CARE, ICRA, India Rating.
**Thinly traded/Non traded securities and illiquid securities as defined in SEBI
Regulations and Guidelines.
CREDIT QUALITY
High Medium Low
Low
Medium
High
Inte
rest
Rat
eSe
nsi
tivi
ty
An Open Ended Income SchemeAll data as on August 31, 2017 (Unless indicated otherwise) ^For details, refer Page 2.
INVESTMENT OBJECTIVE
The Scheme seeks to deliver reasonable market related returns with lower risk and higher liquidity through portfolio of debt and money market instruments. The Scheme is not providing any assured or guaranteed returns.
BENCHMARK
CRISIL Liquid Fund Index
DATE OF ALLOTMENT
July 16, 2008
FUND MANAGER
Piyush Baranwal: Over 9 years’ experience in Portfolio Management and trading in Fixed Income securities.
AVERAGE AUM
` 553.51 Crs.
$LATEST AUM
` 557.68 Crs.
MINIMUM APPLICATION AMOUNT (LUMPSUM)
Regular/ Direct Plan ` 5,000 and in multiples of ̀ 1
ADDITIONAL PURCHASE AMOUNT
Regular/ Direct Plan ` 1,000 and in multiples of ̀ 1
TOTAL EXPENSE RATIO
0.55%
0.44%
Average Expense Ratio excludes Goods & Services Tax on Management Fee
OTHER PARAMETERS
Average Maturity: 7.94 MonthsModified Duration: 0.58Portfolio Yield: 7.86%
NAV NAV (`)
LOAD STRUCTURE (FOR ALL PLANS)
NIL
NIL
For Dividend History please refer page no. 14.
For Scheme Performance please refer page no. 15 to 20.
(w.e.f July 18, 2016)
Growth 2,017.6055 Growth 2,040.8078Bonus - Bonus 2,032.9309Daily Dividend 1,007.4498 Daily Dividend 1,006.9034Weekly Dividend 1,008.3466 Weekly Dividend 1,007.8134
Regular Plan:
Direct Plan:
Regular Plan Direct Plan
Entry Load
Exit Load
COMPOSITION BY ASSETSCREDIT PROFILE
A(SO)A1+ AA AAA Cash & Cash Equivalent
A AA-AA+(SO)A-(SO)
61.33%
9.09%
29.58%
4.50%
29.58%6.26%
21.05%
5.60%
0.90%
9.09%
2.41%
20.60%
PORTFOLIO DETAILS
Cash & Cash EquivalentBonds & NCDs Commercial Paper
Crossed$
`550 crores
THIS PRODUCT IS SUITABLE FOR INVESTORS WHO ARE SEEKING^:
• Regular income over short term.
• Investment in Debt and Money Market Instruments

An Open Ended Liquid SchemeAll data as on August 31, 2017(Unless indicated otherwise)
BOI Liquid Fund
AXA
Debt FundHybrid FundEquity Fund Liquid Fund
L
I
Q
U
I
D
S
C
H
E
M
E
THIS PRODUCT IS SUITABLE FOR INVESTORS WHO ARE SEEKING^:
• Income over short term.
• Investment in Debt and Money Market Instruments.
# Disclaimer for CRISIL AAAmfs: The assigned rating AAAmfs is valid only for “BOI AXA Liquid Fund”. The rating of CRISIL is not an opinion of the Asset Management Company’s willingness or ability to make timely payments to the investor. The rating is also not an opinion on the stability of the NAV of the Fund, which could vary with market developments.The rating indicates that the funds' portfolios will provide 'very strong' protection against losses from credit default. CRISIL's assessment of a rated fund's credit quality is based on the creditworthiness of the fund's portfolio. CRISIL reserves the right to suspend, withdraw or revise the ratings assigned to the scheme at any time on the basis of new information, or unavailability of information or other circumstances, which CRISIL believes, may have an impact on the rating. For detail methodology, please visit CRISIL's website www.crisil.com. Past performance is no guarantee of the future results.$Disclaimer for ICRA AAAmfs: Schemes with this rating are considered to have the highest degree of safety regarding timely receipt of payments from the investments that they have made. This rating should however, not be construed as an indication of the performance of the Mutual Fund scheme or of volatility in its returns. The rating should not be treated as a recommendation to buy, sell or hold units issued by the Mutual Fund.
PORTFOLIO DETAILSPortfolio Holdings Industry/ % to Net
Rating Assets
MONEY MARKET INSTRUMENTSCertificate of Deposit**RBL Bank Limited ICRA A1+ 8.09HDFC Bank Limited CARE A1+ 2.04Total 10.13
Commercial Paper**Piramal Enterprises Limited ICRA A1+ 9.41Manappuram Finance Limited CRISIL A1+ 8.97Dewan Housing Finance Corporation Limited CRISIL A1+ 8.20Sterling and Wilson Pvt Limited IND A1+ 6.13PTC India Financial Services Limited CRISIL A1+ 5.73Raymond Limited CRISIL A1+ 4.87Edelweiss Commodities Services Limited CRISIL A1+ 4.48APL Apollo Tubes Limited (SBLC with Banks) ICRA A1+(SO) 4.08Piramal Finance Limited ICRA A1+ 4.05Afcons Infrastructure Limited ICRA A1+ 4.05National Bank For Agriculture and Rural Development CRISIL A1+ 2.45Blue Star Limited CARE A1+ 2.04Surya Roshni Limited (SBLC with Banks) ICRA A1+(SO) 2.04IndoStar Capital Finance Limited CARE A1+ 2.02RSPL Limited CRISIL A1+ 2.02Housing Development Finance Corporation Limited ICRA A1+ 1.63Reliance Jio Infocomm Limited CARE A1+ 0.41Total 72.61
Treasury BillGovernment of India SOV 12.27Total 12.27
Cash & Cash EquivalentNet Receivables/Payables (3.55)CBLO / Reverse Repo Investments 0.00Total (3.55)
BONDS & NCDsListed / awaiting listing on the stock exchangesIDFC Bank Limited ICRA AAA 8.54Total 8.54
All corporate ratings are assigned by rating agencies like CRISIL, CARE, ICRA, India Rating.
**Thinly traded/Non traded securities and illiquid securities as defined in SEBI Regulations and Guidelines.
GRAND TOTAL 100.00
13
CREDIT QUALITY
High Medium Low
Low
Medium
High
Inte
rest
Rat
eSe
nsi
tivi
ty
COMPOSITION BY ASSETSCREDIT PROFILE
^For details, refer Page 2.
INVESTMENT OBJECTIVE
The Scheme seeks to deliver reasonable market related returns with lower risk and higher liquidity through portfolio of debt and money market instruments. The Scheme is not providing any assured or guaranteed returns. There is no assurance that the investment objective of the scheme will be achieved.
BENCHMARK
CRISIL Liquid Fund Index
DATE OF ALLOTMENT
July 16, 2008
FUND MANAGER
Piyush Baranwal: (w.e.f. July 18, 2016) Over 9 years’ experience in Portfolio Management and trading in Fixed Income securities.
AVERAGE AUM
` 1,240.43 Crs.
LATEST AUM
` 1,219.52 Crs.
MINIMUM APPLICATION AMOUNT (LUMPSUM)
Regular/ Direct Plan ` 5,000 and in multiples of ̀ 1
ADDITIONAL PURCHASE AMOUNT
Regular/ Direct Plan ` 1,000 and in multiples of ̀ 1
TOTAL EXPENSE RATIO
0.18% 0.10%
Average Expense Ratio excludes Goods & Services Tax on Management Fee
OTHER PARAMETERS
Average Maturity: 1.20 MonthsModified Duration: 0.09Portfolio Yield: 6.51%
NAV NAV (`)
LOAD STRUCTURE (FOR ALL PLANS)
NILNIL
For Dividend History please refer page no. 14.
For Scheme Performance please refer page no. 15 to 20.
Regular Plan:Direct Plan:
Regular Plan Direct Plan
Entry LoadExit Load
Growth Growth 1,925.9616Daily Dividend 1,002.1069 Daily Dividend 1,002.6483Weekly Dividend 1,001.8317 Weekly Dividend 1,062.1106
1,917.0401
Sovereign AAAA1+ Cash & Cash Equivalent Bonds & NCDs Cash & Cash Equivalent
Commercial Paper Treasury Bills Certificate of DepositA1+(SO)
72.61%
12.27% 10.13% 8.54%
-3.55%-10.00%0.00%
10.00%20.00%30.00%40.00%50.00%60.00%70.00%80.00%
76.62%
12.27% 8.54% 6.12%
-3.55%-10.00%0.00%
10.00%20.00%30.00%40.00%50.00%60.00%70.00%80.00%90.00%

Dividend History$EQUITY FUNDS
Record Date Dividend/ Unit NAV^ as on
Declared (in `) Record Date
BOI AXA Equity Fund
Regular Plan - Regular Dividend
Regular Plan - Quarterly Dividend
Eco Plan - Regular Dividend
Eco Plan - Quarterly Dividend
Eco Plan - Annual Dividend
Institutional Plan - #Regular Dividend
Institutional Plan - #Quarterly Dividend
Direct Plan - Regular Dividend
Direct Plan - Quarterly Dividend
18-December-2014 7.00 19.0828-March-2016 1.00 10.2827-March-2017 0.50 11.74
25-March-2014 0.50 12.8825-June-2014 0.30 15.2225-March-2015 6.40 11.11
25-March-2015 5.00 14.4128-March-2016 1.00 11.9027-March-2017 1.00 13.27
25-March-2014 0.10 12.4725-June-2014 0.30 14.7025-March-2015 6.30 10.67
25-November-2009 1.00 - 29-March-2010 1.00 - 29-April-2010 1.00 -
28-March-2016 1.00 11.9927-June-2016 0.10 10.8327-March-2017 1.00 13.42
27-September-2016 0.20 11.7326-December-2016 0.19 10.2127-March-2017 0.15 11.57
18-December-2014 5.00 18.59
15-October-2009 1.00 - 25-November-2009 1.00 - 29-April-2010 1.00 -
$Face Value - ̀ 10/-
^Pursuant to payment of dividend, NAV of the Dividend Option of the Plan/ Scheme falls to the extent of such dividend payment and applicable statutory levy (taxes, levies, cess etc.), if any. #Since there are no investors in BOI AXA Equity Fund - Institutional Plan - Regular Dividend and Institutional Plan - Quarterly Dividend the data of NAV as on record date is not provideda bIndividual/ HUFs. Others. Past performance may or may no be sustained in the future.
**Name of the fund has been changed from BOI AXA Focused Infrastructure Fund to BOI AXA Manufacturing & Infrastructure Fund w.e.f. January 19, 2016.For complete Dividend History please visit www.boiaxa-im.com
DEBT / INCOME FUNDS
Record Date Dividend/ Unit NAV^ as onDeclared (in `) Record Date
$BOI AXA Short Term Income Fund
Institutional Monthly Dividend
Institutional Quarterly Dividend
Regular Monthly Dividend
Regular Quarterly Dividend
Direct Monthly Dividend
Direct Quarterly Dividend
a27-December-2010 0.043921 10.1575b27-December-2010 0.040935 10.1575a25-January-2011 0.043921 10.1704b25-January-2011 0.040935 10.1704a25-February-2011 0.052705 10.1881b25-February-2011 0.049122 10.1881
a29-December-2009 0.1751890 10.2708b29-December-2009 0.1630520 10.2708
a27-June-2017 0.04333573 10.4159b27-June-2017 0.04014988 10.4159a25-July-2017 0.06500385 10.3938b25-July-2017 0.06022484 10.3938a28-August-2017 0.05055850 10.3805b28-August-2017 0.04684154 10.3805
a26-December-2016 0.14445314 10.2869a27-March-2017 0.18056634 10.2312a27-June-2017 0.18056625 10.1965
a27-June-2017 0.04333605 10.4359b27-June-2017 0.04014987 10.4359a25-July-2017 0.06500306 10.4216b25-July-2017 0.06022487 10.4216a28-August-2017 0.06500381 10.3970b28-August-2017 0.06022487 10.3970
a26-December-2016 0.14453089 10.3965a27-March-2017 0.18060659 10.3671a27-June-2017 0.18057644 10.5399
$HYBRID FUND
Record Date Dividend/ Unit NAV^ as onDeclared (in `) Record Date
BOI AXA Regular Return Fund
Regular Monthly Dividend
Regular Quarterly Dividend
Regular Annual Dividend
Regular Plan Regular Dividend
Direct Monthly Dividend
Direct Quarterly Dividend
Direct Annual Dividend
Eco Monthly Dividend
Eco Quarterly Dividend
Eco Plan Regular Dividend
b27-June-2017 0.06687980 12.3666a25-July-2017 0.07222660 12.5322b25-July-2017 0.06687980 12.5322a28-August-2017 0.07222650 12.4696b28-August-2017 0.06687980 12.4696
a26-December-2016 0.18056628 10.7926a27-March-2017 0.18056586 11.0034a27-June-2017 0.10833958 11.2140
a26-December-2016 0.18056394 10.1674a27-March-2017 0.18056840 10.3515a27-June-2017 0.10834057 10.5403
a27-May-2013 0.105113 12.1665b27-May-2013 0.089559 12.1665a25-June-2013 0.389636 12.0556b25-June-2013 0.373162 12.0556a25-March-2014 0.389636 10.9004b25-March-2014 0.373162 10.9004
a27-June-2017 0.07222960 10.4089a25-July-2017 0.07222955 10.5374a28-August-2017 0.05778002 10.4944
a26-December-2016 0.18061465 10.8798a27-March-2017 0.18061465 11.1104a27-June-2017 0.10827704 11.3404
a18-December-2014 0.0181466 11.0972b18-December-2014 0.0168285 11.0972
a27-June-2017 0.07221602 17.6645a25-July-2017 0.07221602 17.9482a28-August-2017 0.07221602 17.9064
a26-December-2016 0.18060867 10.1705a27-March-2017 0.18060867 10.3625a27-June-2017 0.10824564 10.5594
a26-December-2012 0.440456 13.1164b26-December-2012 0.377515 13.1164a25-March-2013 0.440456 12.5487b25-March-2013 0.377515 12.5487a25-March-2014 0.779271 11.5826b25-March-2014 0.746324 11.5826
a27-June-2017 0.07222642 12.3666
14
$HYBRID FUND
Record Date Dividend/ Unit NAV^ as onDeclared (in `) Record Date
BOI AXA Equity Debt Rebalancer Fund
Regular Plan - Regular Dividend
Direct Plan - Regular Dividend
a25-March-2015 0.18146626 10.9382a29-June-2015 0.18056668 10.738b29-June-2015 0.16728022 10.738
a28-September-2015 0.1444532 10.6123a28-December-2015 0.1444529 10.511b28-December-2015 0.13383191 10.511a28-March-2016 0.14445300 10.2233b28-March-2016 0.1338327 10.2233a27-June-2016 0.13982874 10.3600b27-June-2016 0.12954882 10.3600a27-September-2016 0.16484636 10.7315b27-September-2016 0.16484636 10.7315a26-December-2016 0.19900249 10.0711b26-December-2016 0.19900249 10.0711a27-March-2017 0.20000000 10.5979a27-June-2017 0.20000000 10.7374
a28-December-2015 0.14445591 11.6869a28-March-2016 0.14445587 11.3988a27-June-2016 0.14445289 11.5754b27-June-2016 0.13383290 11.5754a27-September-2016 0.20000000 11.9897b27-September-2016 0.20000000 11.9897a26-December-2016 0.20000000 11.2902b26-December-2016 0.20000000 11.2902a27-March-2017 0.20000000 11.9222a27-June-2017 0.20000000 12.1220
BOI AXA Tax Advantage Fund
BOI AXA Manufacturing & Infrastructure Fund**
BOI AXA Mid Cap Equity & Debt Fund
Regular Plan
Eco Plan
Direct Plan
Regular Plan - Regular Dividend
Regular Plan - Quarterly Dividend
Direct Plan - Regular Dividend
Regular Plan - Regular Dividend
Direct Plan - Regular Dividend
25-March-2015 2.00 18.2028-March-2016 2.00 14.1927-March-2017 4.00 13.26
25-March-2015 2.00 17.9428-March-2016 2.00 14.0727-March-2017 4.00 13.24
27-March-2017 1.00 12.60
26-December-2016 0.20 10.8327-March-2017 0.25 12.2727-June-2017 0.25 12.92
27-March-2017 0.50 13.57
27-June-2017 0.74 11.05
27-June-2017 0.80 11.06
25-March-2015 0.77 20.61

15
Fund - Manager wise Scheme PerformanceAll data as on August 31, 2017 (Unless indicated otherwise)
@Period Scheme Returns
(%) ^
Benchmark Returns
(Nifty 50)(%)
^ Past performance may or may not be sustained in the future. *Date of Allotment - October 21, 2008.@ In case, the start date or the end date of the concerned period is a non-business day, the NAV of the previous business day is considered for computation of returns.1. Mr. Alok Singh has been managing the Scheme since February 16, 2017. In addition to this scheme, He manages 3 open ended schemes and co-manages 3 open
ended schemes of BOI AXA Mutual Fund.2. This Scheme has been in existence for more than 5 years 3. Period for which scheme’s performance has been provided is computed basis on last day of the Month-end preceding the date of publication.4. Different plans shall have a different expense structure. The performance details provided herein are of Regular plan.
BOI AXA Equity Fund - Regular Plan - Growth Option - PERFORMANCE (as on August 31, 2017)
PERFORMANCE CHART
BOI AXA Equity Fund - Regular Plan - Growth Option
Nifty 50
0
50
100
150
200
250
300
350
400
Additional Benchmark
Returns(%)
Scheme Returns
(`)
Benchmark Returns
(Nifty 50)(`)
Additional Benchmark
Returns(`)
1 year 16.57% 12.88% NA 11,657 11,288 NA
3 years 9.98% 7.60% NA 13,318 12,469 NA
5 years 15.61% 13.52% NA 20,661 18,861 NA
Since inception* 14.95% 13.47% NA 34,400 30,659 NA
Current Value of Standard Investment of 10000 in the`
@Period Scheme Returns
(%) ^
Benchmark Returns S&P BSE Infrastructure
Index (50%) & S&P BSE Manufacturing
Index (50%) (%)
^ Past performance may or may not be sustained in the future. *Date of Allotment - March 5, 2010. **BOI AXA Focused Infrastructure Fund was launched on March 5, 2010. Subsequently the key features of the Scheme have been changed w.e.f January 19, 2016. @ In case, the start date or the end date of the concerned period is a non-business day, the NAV of the previous business day is considered for computation of returns.1. Mr. Alok Singh has been managing the Scheme since February 16, 2017. In addition to this scheme, He manages 3 open ended schemes and also co-manages 3 open
ended schemes of BOI AXA Mutual Fund.2. This Scheme has been in existence for more than 5 years 3. Period for which scheme’s performance has been provided is computed basis on last day of the Month-end preceding the date of publication.4. Different plans shall have a different expense structure. The performance details provided herein are of Regular plan.5. Fundamental Attributes and Name of the fund have been changed from BOI AXA Focused Infrastructure Fund to BOI AXA Manufacturing & Infrastructure Fund w.e.f.
January 19, 2016.
BOI AXA Manufacturing & Infrastructure Fund** - Regular Plan - Growth Option - PERFORMANCE (as on August 31, 2017)
Additional Benchmark
Returns (Nifty 50)
(%)
Scheme Returns
(`)
Benchmark Returns S&P BSE Infrastructure
Index (50%) & S&PBSE Manufacturing
Index (50%) (`)
Additional Benchmark
Returns (Nifty 50)(`)
1 year 20.66% 15.85% 12.88% 12,066 11,585 11,288
3 years 11.70% 3.77% 7.60% 13,955 11,178 12,469
5 years 14.78% 9.26% 13.52% 19,930 15,576 18,861
Since inception* 5.89% 0.33% 9.31% 15,360 10,250 19,490
Current Value of Standard Investment of 10000 in the`
Notes
1. The details & returns for close ended schemes have not been disclosed as these are not comparable with other schemes.
2. Returns of only those schemes that have completed one year have been given.
PERFORMANCE CHART
BOI Manufacturing & InfrastructureFund** - Regular Plan - Growth Option
Fund Benchmark*
0
20
40
60
80
100
120
160
140
* Fund Benchmark: Since inception to Jan 18, 2016: Nifty Infrastructure Index; Jan 19, 2016 to current: S&P BSE Infrastructure Index (50%) & S&P BSE Manufacturing Index (50%)
Fund Manager - Alok Singh
Fund Manager - Alok Singh
29
-Oct
-08
24
-Jan
-09
21
-Ap
r-0
91
7-J
ul-
09
12
-Oct
-09
7-J
an-1
04
-Ap
r-1
03
0-J
un
-10
25
-Sep
-10
21
-Dec
-10
18
-Mar
-11
13
-Ju
n-1
18
-Sep
-11
4-D
ec-1
12
9-F
eb-1
22
6-M
ay-1
22
1-A
ug-
12
16
-No
v-1
21
1-F
eb-1
39
-May
-13
4-A
ug-
13
30
-Oct
-13
25
-Jan
-14
22
-Ap
r-1
41
8-J
ul-
14
13
-Oct
-14
8-J
an-1
55
-Ap
r-1
51
-Ju
l-1
52
6-S
ep-1
52
2-D
ec-1
51
8-M
ar-1
61
3-J
un
-16
8-S
ep-1
64
-Dec
-16
1-M
ar-1
72
7-M
ay-1
72
2-A
ug-
17
10
-Mar
-10
14
-May
-10
18
-Ju
l-1
02
1-S
ep-1
02
5-N
ov-
10
29
-Jan
-11
4-A
pr-
11
8-J
un
-11
12
-Au
g-1
11
6-O
ct-1
12
0-D
ec-1
12
3-F
eb-1
22
8-A
pr-
12
2-J
ul-
12
5-S
ep-1
29
-No
v-1
21
3-J
an-1
31
9-M
ar-1
32
3-M
ay-1
32
7-J
ul-
13
30
-Sep
-13
4-D
ec-1
37
-Feb
-14
13
-Ap
r-1
41
7-J
un
-14
21
-Au
g-1
42
5-O
ct-1
42
9-D
ec-1
44
-Mar
-15
8-M
ay-1
51
2-J
ul-
15
15
-Sep
-15
19
-No
v-1
52
3-J
an-1
62
8-M
ar-1
61
-Ju
n-1
65
-Au
g-1
69
-Oct
-16
13
-Dec
-16
16
-Feb
-17
22
-Ap
r-1
72
6-J
un
-17
30
-Au
g-1
7

16
Fund - Manager wise Scheme PerformanceAll data as on August 31, 2017 (Unless indicated otherwise)
@Period Scheme Returns
(%) ^
Benchmark Returns(CRISIL MIP
Blended Index) (%)
^ Past performance may or may not be sustained in the future. *Date of Allotment - March 18, 2009.@ In case, the start date or the end date of the concerned period is a non-business day, the NAV of the previous business day is considered for computation of returns.1. Mr. Alok Singh has been managing the Scheme since May 21, 2012. In addition to this scheme, He manages 3 open ended schemes and also co-manages 3 open ended
schemes of BOI AXA Mutual Fund2. This Scheme has been in existence for more than 5 years 3. Period for which scheme’s performance has been provided is computed basis on last day of the Month-end preceding the date of publication.4. Different plans shall have a different expense structure. The performance details provided herein are of Regular plan.
BOI AXA Regular Return Fund - Regular Plan - Growth Option - PERFORMANCE (as on August 31, 2017)
Additional Benchmark
Returns(%)
Scheme Returns
(`)
Benchmark Returns(CRISIL MIP
Blended Index) (`)
Additional Benchmark
Returns(`)
1 year 10.25% 9.93% NA 11,025 10,993 NA
3 years 10.25% 10.63% NA 13,414 13,554 NA
5 years 10.38% 10.30% NA 16,387 16,334 NA
Since inception* 8.68% 9.62% NA 20,221 21,763 NA
Current Value of Standard Investment of 10000 in the`
Notes
1. The details & returns for close ended schemes have not been disclosed as these are not comparable with other schemes.
2. Returns of only those schemes that have completed one year have been given.
PERFORMANCE CHART
BOI AXA Regular Return Fund -Regular Plan - Growth Option
CRISIL MIP Blended Index
0
50
100
150
200
250
Fund Manager - Alok Singh
@Period Scheme Returns
(%) ^
Benchmark Returns(CRISIL Composite Bond Fund Index)
(%)
^ Past performance may or may not be sustained in the future. *Date of Allotment - February 27, 2015. @ In case, the start date or the end date of the concerned period is a non-business day, the NAV of the previous business day is considered for computation of returns.1. Mr. Alok Singh has been managing the Scheme since February 27, 2015. In addition to this scheme, He manages 3 open ended schemes and also co-manages 3 open
ended schemes of BOI AXA Mutual Fund2. This Scheme has been in existence for more than 1 year but less than 3 years hence performance data for 3 years and more is not provided. 3. Period for which scheme’s performance has been provided is computed basis on last day of the Month-end preceding the date of publication.4. Different plans shall have a different expense structure. The performance details provided herein are of Regular plan.
BOI AXA Corporate Credit Spectrum Fund - Regular Plan - Growth Option - PERFORMANCE (as on August 31, 2017)
Additional Benchmark
Returns(%)
Scheme Returns
(`)
Benchmark Returns(CRISIL Composite Bond Fund Index)
(`)
Additional Benchmark
Returns(`)
1 year 10.49% 9.31% NA 11,049 10,931 NA
3 years NA NA NA NA NA NA
5 years NA NA NA NA NA NA
Since inception* 10.31% 9.77% NA 12,794 12,640 NA
Current Value of Standard Investment of 10000 in the`Fund Manager - Alok Singh
BOI AXA Corporate Credit Spectrum Fund - Regular Plan - Growth Option
CRISIL Composite BondFund Index
PERFORMANCE CHART
0
20
40
60
80
100
120
140
27
-Feb
-15
24
-Mar
-15
18
-Ap
r-1
51
3-M
ay-1
57
-Ju
n-1
52
-Ju
l-1
52
7-J
ul-
15
21
-Au
g-1
51
5-S
ep-1
51
0-O
ct-1
54
-No
v-1
52
9-N
ov-
15
24
-Dec
-15
18
-Jan
-16
12
-Feb
-16
8-M
ar-1
62
-Ap
r-1
62
7-A
pr-
16
22
-May
-16
16
-Ju
n-1
61
1-J
ul-
16
5-A
ug-
16
30
-Au
g-1
62
4-S
ep-1
61
9-O
ct-1
61
3-N
ov-
16
8-D
ec-1
62
-Jan
-17
27
-Jan
-17
21
-Feb
-17
18
-Mar
-17
12
-Ap
r-1
77
-May
-17
1-J
un
-17
26
-Ju
n-1
72
1-J
ul-
17
15
-Au
g-1
7
20
-Mar
-09
7-J
un
-09
25
-Au
g-0
91
2-N
ov-
09
30
-Jan
-10
19
-Ap
r-1
07
-Ju
l-1
02
4-S
ep-1
01
2-D
ec-1
01
-Mar
-11
19
-May
-11
6-A
ug-
11
24
-Oct
-11
11
-Jan
-12
30
-Mar
-12
17
-Ju
n-1
24
-Sep
-12
22
-No
v-1
29
-Feb
-13
29
-Ap
r-1
31
7-J
ul-
13
4-O
ct-1
32
2-D
ec-1
31
1-M
ar-1
42
9-M
ay-1
41
6-A
ug-
14
3-N
ov-
14
21
-Jan
-15
10
-Ap
r-1
52
8-J
un
-15
15
-Sep
-15
3-D
ec-1
52
0-F
eb-1
69
-May
-16
27
-Ju
l-1
61
4-O
ct-1
61
-Jan
-17
21
-Mar
-17
8-J
un
-17
26
-Au
g-1
7

17
Fund - Manager wise Scheme PerformanceAll data as on August 31, 2017 (Unless indicated otherwise)
@Period Scheme Returns
(%) ^
Benchmark Returns(CRISIL Short Term
Bond Fund Index and S&P Nifty 50) (%)
^ Past performance may or may not be sustained in the future. *Date of Allotment - March 14, 2014. @ In case, the start date or the end date of the concerned period is a non-business day, the NAV of the previous business day is considered for computation of returns.1. Mr. Alok Singh & Mr. Saurabh Kataria have been managing the Scheme as co fund managers since July 18, 2016 and September 11, 2014 respectively. In addition to this
scheme, Mr. Alok Singh manages 4 open ended schemes and also co-manages 2 open ended schemes of BOI AXA Mutual Fund. Mr. Saurabh Kataria, In addition to this scheme, manages 1 open ended scheme and also co-manages 4 close ended schemes of BOI AXA Mutual Fund
2. This Scheme has been in existence for more than3 year but less than 5 years hence performance data for 5 years is not provided.3. Period for which scheme’s performance has been provided is computed basis on last day of the Month-end preceding the date of publication.4. Different plans shall have a different expense structure. The performance details provided herein are of Regular plan.
BOI AXA Equity Debt Rebalancer Fund - Regular Plan - Growth Option - PERFORMANCE (as on August 31, 2017)
Additional Benchmark
Returns(%)
Scheme Returns
(`)
Benchmark Returns(CRISIL Short Term
Bond Fund Index and S&P Nifty 50) (`)
Additional Benchmark
Returns(`)
1 year 9.67% 10.52% NA 10,967 11,052 NA
3 years 9.49% 8.35% NA 13,140 12,732 NA
5 years NA NA NA NA NA NA
Since inception* 11.82% 11.08% NA 14,736 14,402 NA
Current Value of Standard Investment of 10000 in the`
Notes
1. The details & returns for close ended schemes have not been disclosed as these are not comparable with other schemes.
2. Returns of only those schemes that have completed one year have been given.
BOI AXA Equity Debt Rebalancer Fund - Regular Plan - Growth Option
Nifty 50 (50%) & CRISIL Short Term Bond Fund Index (50%)
PERFORMANCE CHART
0
20
40
60
80
100
120
160
Co-Fund Manager - Alok Singh & Saurabh Kataria
@Period Scheme Returns
(%) ^
Benchmark Returns
(Nifty 50)(%)
^ Past performance may or may not be sustained in the future. *Date of Allotment - February 25, 2009. @ In case, the start date or the end date of the concerned period is a non-business day, the NAV of the previous business day is considered for computation of returns.1. Mr. Saurabh Kataria has been managing the Scheme since June 29, 2013. In addition to this scheme, He co-manages 1 open ended scheme and 4 close ended schemes
of BOI AXA Mutual Fund2. This Scheme has been in existence for more than 5 years 3. Period for which scheme’s performance has been provided is computed basis on last day of the Month-end preceding the date of publication.4. Different plans shall have a different expense structure. The performance details provided herein are of Regular plan.
BOI AXA Tax Advantage Fund - Regular Plan - Growth Option - PERFORMANCE (as on August 31, 2017)
Additional Benchmark
Returns(%)
Scheme Returns
(`)
Benchmark Returns
(Nifty 50)(`)
Additional Benchmark
Returns(`)
1 year 21.18% 12.88% NA 12,118 11,288 NA
3 years 14.36% 7.60% NA 14,977 12,469 NA
5 years 18.64% 13.52% NA 23,515 18,861 NA
Since inception* 20.65% 16.19% NA 49,500 35,902 NA
Current Value of Standard Investment of 10000 in the`Fund Manager - Saurabh Kataria
BOI AXA Tax Advantage Fund - Regular Plan - Growth Option
Nifty 50
0
100
200
300
400
600
PERFORMANCE CHART
500140
24
-Mar
-14
11
-May
-14
28
-Ju
n-1
41
5-A
ug-
14
2-O
ct-1
41
9-N
ov-
14
6-J
an-1
5
23
-Feb
-15
12
-Ap
r-1
5
30
-May
-15
17
-Ju
l-1
53
-Sep
-15
21
-Oct
-15
8-D
ec-1
52
5-J
an-1
61
3-M
ar-1
63
0-A
pr-
16
17
-Ju
n-1
64
-Au
g-1
6
21
-Sep
-16
8-N
ov-
16
26
-Dec
-16
12
-Feb
-17
1-A
pr-
17
19
-May
-17
6-J
ul-
17
23
-Au
g-1
7
27
-Feb
-09
24
-May
-09
18
-Au
g-0
91
2-N
ov-
09
6-F
eb-1
03
-May
-10
28
-Ju
l-1
02
2-O
ct-1
01
6-J
an-1
11
2-A
pr-
11
7-J
ul-
11
1-O
ct-1
12
6-D
ec-1
12
1-M
ar-1
21
5-J
un
-12
9-S
ep-1
24
-Dec
-12
28
-Feb
-13
25
-May
-13
19
-Au
g-1
31
3-N
ov-
13
7-F
eb-1
44
-May
-14
29
-Ju
l-1
42
3-O
ct-1
41
7-J
an-1
51
3-A
pr-
15
8-J
ul-
15
2-O
ct-1
52
7-D
ec-1
52
2-M
ar-1
61
6-J
un
-16
10
-Sep
-16
5-D
ec-1
61
-Mar
-17
26
-May
-17
20
-Au
g-1
7

18
Fund - Manager wise Scheme PerformanceAll data as on August 31, 2017 (Unless indicated otherwise)
@Period Scheme Returns
(%) ^
Benchmark Returns(CRISIL Short Term Bond Fund Index)
(%)
^ Past performance may or may not be sustained in the future. *Date of Allotment - December 18, 2008. @ In case, the start date or the end date of the concerned period is a non-business day, the NAV of the previous business day is considered for computation of returns.1. Mr. Alok Singh & Mr. Piyush Baranwal have been managing the Scheme as co fund managers since May 2014 and July 11, 2014 respectively. In addition to this scheme,
Mr. Alok Singh manages 4 open ended schemes and also co-manages 2 open ended schemes of BOI AXA Mutual Fund. Mr. Piyush Baranwal, In addition to this scheme, manages 2 open ended schemes and also co-manages 1 open ended and 4 close ended schemes of BOI AXA Mutual Fund.
2. This Scheme has been in existence for more than 5 years 3. Period for which scheme’s performance has been provided is computed basis on last day of the Month-end preceding the date of publication.4. Different plans shall have a different expense structure. The performance details provided herein are of Regular plan.
BOI AXA Short Term Income Fund - Regular Plan - Growth Option - PERFORMANCE (as on August 31, 2017)
Additional Benchmark Returns
(CRISIL 1 Year T-Bill Index) (%)
Scheme Returns
(`)
Benchmark Returns(CRISIL Short Term Bond Fund Index)
(`)
Additional Benchmark Returns
(CRISIL 1 Year T-Bill Index) (`)
1 year 8.70% 8.16% 6.24% 10,870 10,816 10,624
3 years 9.26% 9.10% 7.48% 13,057 13,000 12,426
5 years 8.63% 9.04% 7.30% 15,129 15,418 14,229
Since inception* 7.32% 8.17% 6.27% 18,504 19,812 16,983
Current Value of Standard Investment of 10000 in the`
Notes
1. The details & returns for close ended schemes have not been disclosed as these are not comparable with other schemes.
2. Returns of only those schemes that have completed one year have been given.
Co-Fund Manager - Alok Singh & Piyush Baranwal
BOI AXA Treasury Advantage Fund - Regular Plan - Growth Option
CRISIL Liquid Fund Index
PERFORMANCE CHART
0
50
100
150
200
250
@Period Scheme Returns
(%) ^
Benchmark Returns #
(%)
^ Past performance may or may not be sustained in the future. *Date of Allotment - July 16, 2008. #CRISIL Liquid Fund Index ##CRISIL91 Day T-Bill Index@ In case, the start date or the end date of the concerned period is a non-business day, the NAV of the previous business day is considered for computation of returns.1. Mr. Piyush Baranwal has been managing the Scheme since July 18, 2016. In addition to this scheme, He manages 1 open ended scheme and also co-manages 2 open
ended and 4 close ended schemes of BOI AXA Mutual Fund.2. This Scheme has been in existence for more than 5 years 3. Period for which scheme’s performance has been provided is computed basis on last day of the Month-end preceding the date of publication.4. Different plans shall have a different expense structure. The performance details provided herein are of Regular plan.
BOI AXA Treasury Advantage Fund - Regular Plan - Growth Option - PERFORMANCE (as on August 31, 2017)
Additional Benchmark Returns ##
(%)
Scheme Returns
(`)
Benchmark Returns #
(`)
Additional Benchmark Returns ##
(`)
1 year 8.65% 6.76% 6.39% 10,865 10,676 10,639
3 years 8.90% 7.72% 7.41% 12,927 12,508 12,403
5 years 9.00% 8.21% 7.87% 15,387 14,838 14,611
Since inception* 7.99% 7.61% 6.65% 20,176 19,547 18,003
Current Value of Standard Investment of 10000 in the`Fund Manager - Piyush Baranwal
PERFORMANCE CHART
BOI AXA Short Term Income Fund - Regular Plan - Growth Option
CRISIL Short Term Bond Fund Index
0
50
100
150
250
200
22
-Dec
-08
15
-Mar
-09
6-J
un
-09
28
-Au
g-0
91
9-N
ov-
09
10
-Feb
-10
4-M
ay-1
02
6-J
ul-
10
17
-Oct
-10
8-J
an-1
11
-Ap
r-1
12
3-J
un
-11
14
-Sep
-11
6-D
ec-1
12
7-F
eb-1
22
0-M
ay-1
21
1-A
ug-
12
2-N
ov-
12
24
-Jan
-13
17
-Ap
r-1
39
-Ju
l-1
33
0-S
ep-1
32
2-D
ec-1
31
5-M
ar-1
46
-Ju
n-1
42
8-A
ug-
14
19
-No
v-1
41
0-F
eb-1
54
-May
-15
26
-Ju
l-1
51
7-O
ct-1
58
-Jan
-16
31
-Mar
-16
22
-Ju
n-1
61
3-S
ep-1
65
-Dec
-16
26
-Feb
-17
20
-May
-17
11
-Au
g-1
7
18
-Ju
l-0
81
8-O
ct-0
81
8-J
an-0
92
0-A
pr-
09
21
-Ju
l-0
92
1-O
ct-0
92
1-J
an-1
02
3-A
pr-
10
24
-Ju
l-1
02
4-O
ct-1
02
4-J
an-1
12
6-A
pr-
11
27
-Ju
l-1
12
7-O
ct-1
12
7-J
an-1
22
8-A
pr-
12
29
-Ju
l-1
22
9-O
ct-1
22
9-J
an-1
31
-May
-13
1-A
ug-
13
1-N
ov-
13
1-F
eb-1
44
-May
-14
4-A
ug-
14
4-N
ov-
14
4-F
eb-1
57
-May
-15
7-A
ug-
15
7-N
ov-
15
7-F
eb-1
69
-May
-16
9-A
ug-
16
9-N
ov-
16
9-F
eb-1
71
2-M
ay-1
71
2-A
ug-
17

Fund - Manager wise Scheme PerformanceAll data as on August 31, 2017 (Unless indicated otherwise)
19
@Period Scheme Returns
(%) ^
Benchmark Returns(CRISIL Liquid Fund Index)
(%)
^ Past performance may or may not be sustained in the future. *Date of Allotment - July 16, 2008.@ In case, the start date or the end date of the concerned period is a non-business day, the NAV of the previous business day is considered for computation of returns.1. Mr. Piyush Baranwal has been managing the Scheme since July 18, 2016. In addition to this scheme, He manages 1 open ended scheme and also co-manages 2 open
ended and 4 close ended schemes of BOI AXA Mutual Fund.2. This Scheme has been in existence for more than 5 years 3. Period for which scheme’s performance has been provided is computed basis on last day of the Month-end preceding the date of publication.4. Different plans shall have a different expense structure. The performance details provided herein are of Regular plan.
BOI AXA Liquid Fund - Regular Plan - Growth Option - PERFORMANCE (as on August 31, 2017)
Additional Benchmark Returns
(CRISIL91 Day T-Bill Index) (%)
Scheme Returns
(`)
Benchmark Returns (CRISIL Liquid Fund Index)
(`)
Additional Benchmark Returns
(CRISIL91 Day T-Bill Index) (`)
Current Value of Standard Investment of 10000 in the`
Notes
1. The details & returns for close ended schemes have not been disclosed as these are not comparable with other schemes.
2. Returns of only those schemes that have completed one year have been given.
Co-Fund Manager - Alok Singh & Piyush Baranwal
@Period Scheme Returns
(%) ^
Benchmark Returns #
(%)
^ Past performance may or may not be sustained in the future. *Date of Allotment - July 20, 2016. # Nifty Midcap 100 Index: 70% and CRISIL Short Term Bond Fund Index: 30% # # Nifty 50@ In case, the start date or the end date of the concerned period is a non-business day, the NAV of the previous business day is considered for computation of returns.1. Mr. Alok Singh & Mr. Piyush Baranwal have been managing the Scheme as co fund managers since February 16, 2017 and July 20, 2016 respectively. In addition to this
scheme, Mr. Alok Singh manages 4 open ended schemes and also co-manages 2 open ended schemes of BOI AXA Mutual Fund. Mr. Piyush Baranwal, In addition to this scheme, manages 2 open ended schemes and also co-manages 1 open ended and 4 close ended schemes of BOI AXA Mutual Fund.
2. This Scheme has been in existence for more than 1year but less than 3years hence performance data for 3 years and more is not provided.3. Period for which scheme’s performance has been provided is computed basis on last day of the Month-end preceding the date of publication.4. Different plans shall have a different expense structure. The performance details provided herein are of Regular plan.
BOI AXA Mid Cap Equity & Debt Fund - Regular Plan - Growth Option - PERFORMANCE (as on August 31, 2017)
Additional Benchmark Returns ##
(%)
Scheme Returns
(`)
Benchmark Returns #
(`)
Additional Benchmark Returns ##
(`)
1 year 20.17% 15.69% 12.88% 12,017 11,569 11,288
3 years NA NA NA NA NA NA
5 years NA NA NA NA NA NA
Since inception* 23.23% 19.33% 14.01% 12,630 12,184 11,578
Current Value of Standard Investment of 10000 in the`Co-Fund Manager - Alok Singh & Piyush Baranwal
BOI AXA Mid Cap Equity & Debt Fund - Regular Plan - Growth Option
Nifty Midcap 100 Index: 70% and CRISIL Short Term Bond Fund Index: 30%
PERFORMANCE CHARTPERFORMANCE CHART
BOI AXA Liquid Fund - Regular Plan - Growth Option
CRISIL Liquid Fund Index
0
50
100
150
200
250
7 Days 6.29% 6.24% 6.20%
15 Days 6.31% 6.15% 6.12% Not Applicable
30 Days 6.44% 6.40% 6.17%
1 year 6.78% 6.76% 6.39% 10,678 10,676 10,639
3 years 7.77% 7.71% 7.41% 12,521 12,500 12,395
5 years 8.31% 8.21% 7.87% 14,910 14,838 14,611
Since inception* 7.38% 7.61% 6.65% 19,170 19,547 18,003
0
20
40
60
80
100
120
140
18
-Ju
l-0
8
9-J
an-0
9
3-J
ul-
09
25
-Dec
-09
18
-Ju
n-1
0
10
-Dec
-10
3-J
un
-11
25
-No
v-1
1
18
-May
-12
9-N
ov-
12
3-M
ay-1
3
25
-Oct
-13
18
-Ap
r-1
4
10
-Oct
-14
3-A
pr-
15
25
-Sep
-15
18
-Mar
-16
9-S
ep-1
6
3-M
ar-1
7
25
-Au
g-1
7
20
-Ju
l-1
6
14
-Au
g-1
6
08
-Sep
-16
03
-Oct
-16
28
-Oct
-16
22
-No
v-1
6
17
-Dec
-16
11
-Jan
-17
05
-Feb
-17
02
-Mar
-17
27
-Mar
-17
21
-Ap
r-1
7
16
-May
-17
10
-Ju
n-1
7
05
-Ju
l-1
7
30
-Ju
l-1
7
24
-Au
g-1
7

Fund - Manager wise Scheme PerformanceAll data as on August 31, 2017 (Unless indicated otherwise)
20
Schemes managed by Fund Manager
1. Mr. Alok Singh
2. Mr. Piyush Baranwal
Fund Manager:
Co-Fund Manager:
Fund Manager:
Co-Fund Manager:
BOI AXA Equity Fund - An Open Ended Equity Growth Fund
BOI AXA Manufacturing & Infrastructure Fund - An Open Ended Sector Scheme
BOI AXA Regular Return Fund - An Open Ended Income Scheme
BOI AXA Corporate Credit Spectrum Fund - An Open Ended Debt Scheme
BOI AXA Short Term Income Fund - An Open Ended Income Scheme
BOI AXA Mid Cap Equity & Debt Fund - An Open-Ended Equity Fund
BOI AXA Equity Debt Rebalancer Fund - An Open Ended Dynamic Fund
BOI AXA Liquid Fund - An Open Ended Liquid Scheme
BOI AXA Treasury Advantage Fund - An Open Ended Income Scheme
BOI AXA Short Term Income Fund - An Open Ended Income Scheme
BOI AXA Mid Cap Equity & Debt Fund - An Open-Ended Equity Fund
BOI AXA Capital Protection Oriented Fund - Series 2 - A close ended capital protection
oriented scheme
BOI AXA Capital Protection Oriented Fund - Series 3 - A close ended capital protection
oriented scheme
BOI AXA Capital Protection Oriented Fund - Series 4 - A close ended capital protection
oriented scheme
BOI AXA Capital Protection Oriented Fund - Series 5 - A close ended capital protection
oriented scheme
BOI AXA Tax Advantage Fund - An Open-Ended Equity Linked Savings Scheme
BOI AXA Equity Debt Rebalancer Fund - An Open Ended Dynamic Fund
BOI AXA Capital Protection Oriented Fund - Series 2 - A close ended capital protection
oriented scheme
BOI AXA Capital Protection Oriented Fund - Series 3 - A close ended capital protection
oriented scheme
BOI AXA Capital Protection Oriented Fund - Series 4 - A close ended capital protection
oriented scheme
BOI AXA Capital Protection Oriented Fund - Series 5 - A close ended capital protection
oriented scheme
3. Mr. Saurabh Kataria
Fund Manager:
Co-Fund Manager:

21
SIP Returns of SchemesAll data as on August 31, 2017 (Unless indicated otherwise)
Date of First Installment: 03-Nov-2008 & Scheme Inception Date: October 21, 2008. Past Performance may or may not be sustained in future.
# Scheme Benchmark
SIP Performance for BOI AXA Equity Fund - Regular Plan - Growth Option (assuming SIP of ` 10,000 per month)
Particulars Since last 5 last 3 last 1 Inception years years year
Total Amount Invested ( ) 1,060,000 600,000 360,000 120,000
Market Value of amount Invested 1,916,729 878,314 439,782 135,950
Scheme Returns (CAGR) 12.98% 15.23% 13.44% 25.59%
Nifty 50 Index returns# (CAGR) 11.53% 12.16% 10.96% 20.18%
`
Date of First Installment: 02-Mar-2009 & Scheme Inception Date: February 25, 2009. Past Performance may or may not be sustained in future.
# Scheme Benchmark
SIP Performance for BOI AXA Tax Advantage Fund - RegularPlan - Growth Option (assuming SIP of ` 10,000 per month)
Particulars Since last 5 last 3 last 1 Inception years years year
Total Amount Invested ( ) 1,020,000 600,000 360,000 120,000
Market Value of amount Invested 1,998,798 954,023 463,147 141,468
Scheme Returns (CAGR) 15.33% 18.61% 17.06% 34.84%
Nifty 50 Index returns# (CAGR) 11.06% 12.16% 10.96% 20.18%
`
SIP Performance for BOI AXA Mid Cap Equity & Debt -Growth Option - Regular Plan (assuming SIP of ` 10,000per month)
Date of First Installment: 20-July-2016 & Scheme Inception Date: July 20, 2016. Past Performance may or may not be sustained in future.
# Scheme Benchmark
For SIP calculations above, the data assumes the investment of ̀ 10,000/- on 1st day of every month or the subsequent working day. Load & Taxes are not considered for
computation of returns. Performance for dividend option would assume reinvestment of tax free dividends declared at the then prevailing NAV.
CAGR returns are computed after accounting for the cash flow by using XIRR method (investment internal rate of return). Where Benchmark returns are not available,
they have not been shown.
Past performance may or may not be sustained in future. Returns greater than 1 year period are compounded annualized. Dividends are assumed to be reinvested and
bonus is adjusted. Load is not taken into consideration. For SIP returns, monthly investment of equal amounts invested on the 1st day of every month has been
considered.
Note: For Fund Manager details please refer respective Scheme pages.
Date of First Installment: 01-Apr-2010 & Scheme Inception Date: March 5, 2010. Past Performance may or may not be sustained in future.
# Scheme Benchmark: Since inception to Jan 18, 2016: CNX Infrastructure Index; Jan 19, 2016 to current: S&P BSE Infrastructure Index (50%) & S&P BSE Manufacturing Index (50%)
## Additional Benchmark
SIP Performance for BOI AXA Manufacturing & Infrastructure Fund** - Regular Plan - Growth Option (assuming SIP of ` 10,000 per month)
Particulars Since last 5 last 3 last 1 Inception years years year
Total Amount Invested ( ) 890,000 600,000 360,000 120,000
Market Value of amount Invested 1,399,284 909,731 446,353 135,387
Scheme Returns (CAGR) 11.95% 16.66% 14.47% 24.66%
Benchmark returns# (CAGR) 5.82% 9.24% 9.82% 18.98%
Nifty 50 Index returns## (CAGR) 11.01% 12.16% 10.96% 20.18%
`
**Name of the fund has been changed from BOI AXA Focused Infrastructure Fund to BOI AXA Manufacturing & Infrastructure Fund w.e.f. January 19, 2016.
Particulars Since last 5 last 3 last 1 Inception years years year
Total Amount Invested ( ) 140,000 NA NA 120,000
Market Value of amount Invested 162,569 NA NA 137,641
Scheme Returns (CAGR) 26.71% NA NA 28.40%
Nifty Free Float Midcap 100 (70%)& CRISIL Short Term Bond FundIndex (30%) #(CAGR)
Nifty 50 Index returns## (CAGR) 18.49% NA NA 20.18%
`
17.88% NA NA 17.70%

How to read Factsheet
Fund Manager
Application Amount for Fresh Subscription
Minimum Additional Amount
Yield to Maturity
SIP
NAV
Benchmark
Entry Load
Exit Load
An employee of the asset management company such as a mutual
fund or life insurer, who manages investments of the scheme. He is
usually part of a larger team of fund managers and research analysts.
This is the minimum investment amount for a new investor in a mutual
fund scheme.
This is the minimum investment amount for an existing investor in a
mutual fund scheme.
The Yield to Maturity or the YTM is the rate of return anticipated on a
bond if held until maturity. YTM is expressed as an annual rate. The
YTM factors in the bond's current market price, par value, coupon
interest rate and time to maturity.
SIP or systematic investment plan works on the principle of making
periodic investments of a fixed sum. It works similar to a recurring
bank deposit. For instance, an investor may opt for an SIP that invests
Rs 500 every 15th of the month in an equity fund for a period of three
years.
The NAV or the net asset value is the total asset value per unit of the
mutual fund after deducting all related and permissible expenses. The
NAV is calculated at the end of every business day. It is the value at
which the investor enters or exits the mutual fund.
A group of securities, usually a market index, whose performance is
used as a standard or benchmark to measure investment performance
of mutual funds, among other investments. Some typical benchmarks
include the Nifty, Sensex, BSE200, BSE500, 10-Year Gsec.
A mutual fund may have a sales charge or load at the time of entry
and/or exit to compensate the distributor/agent. Entry load is charged
at the time an investor purchases the units of a mutual fund. The entry
load is added to the prevailing NAV at the time of investment. For
instance, if the NAV is Rs. 100 and the entry load is 1%, the investor will
enter the fund at Rs. 101.
Note: SEBI, vide circular dated June 30, 2009 has abolished entry load
and mandated that the upfront commission to distributors will be paid
by the investor directly to the distributor, based on his assessment of
various factors including the service rendered by the distributor.
Exit load is charged at the time an investor redeems the units of a
mutual fund. The exit load is deducted from the prevailing NAV at the
time of redemption. For instance, if the NAV is Rs. 100 and the exit
load is 1%, the redemption price would be Rs.99 per unit.
Modified Duration
Standard Deviation
Sharpe Ratio
Beta
AUM
Holdings
Nature of Scheme
Rating Profile
Modified duration is the price sensitivity and the percentage change in
price for a unit change in yield.
Standard deviation is a statistical measure of the range of an
investment’s performance. When a mutual fund has a high standard
deviation, its means its range of performance is wide, implying greater
volatility.
The Sharpe Ratio, named after its founder, the Nobel Laureate William
Sharpe, is a measure of risk-adjusted returns. It is calculated using
standard deviation and excess return to determine reward per unit of
risk.
Beta is a measure of an investment’s volatility vis-à-vis the market.
Beta of less than 1 means that the security will be less volatile than the
market. A beta of greater than 1 implies that the security's price will be
more volatile than the market.
AUM or assets under management refers to the recent / updated
cumulative market value of investments managed by a mutual fund or
any investment firm.
The holdings or the portfolio is a mutual fund’s latest or updated
reported statement of investments/securities. These are usually
displayed in terms of percentage to net assets or the rupee value or
both. The objective is to give investors an idea of where their money is
being invested by the fund manager.
The investment objective and underlying investments determine the
nature of the mutual fund scheme. For instance, a mutual fund that
aims at generating capital appreciation by investing in stock markets is
an equity fund or growth fund. Likewise, a mutual fund that aims at
capital preservation by investing in debt markets is a debt fund or
income fund. Each of these categories may have sub-categories.
Mutual funds invest in securities after evaluating their
creditworthiness as disclosed by the ratings. A depiction of the mutual
fund in various investments based on their ratings becomes the rating
profile of the fund. Typically, this is a feature of debt funds.
22

23
Disclaimer/Statutory DetailsStatements relating to outlook and forecast are the opinions of the Author. The views expressed by the author are personal and are not necessarily that of BOI AXA Investment Managers Private Limited (AMC). This report is for information purpose only and is not intended to be any investment advice. Please make independent research/ obtain professional help before taking any decision of investment/ sale. AMC makes no representation as to the quality, liquidity or market perception of any securities/ issuer/ borrower, if described in the report above, nor does it provide any guarantee whatsoever. Information and material used in this report are believed to be from reliable sources. However, AMC does not warrant the accuracy, reasonableness and/or completeness of any information. AMC does not undertake to update any information or material in this report. Decisions taken by you based on the information provided in this report are to your own account and risk. AMC and any of its officers, directors and employees shall not be liable for any loss or damage of any nature, as also any loss of profit in any way arising from the use of this material in any manner. AMC or its directors, officers and employees, including author of this report/ persons involved in the preparation or issuance of this report may, from time to time, have long or short positions in, and buy or sell the securities, if any, mentioned herein or have other potential conflict of interest with respect to any recommendation and related information and opinions given in the report/ report. This report, or any part of it, should not be duplicated, or contents altered/ modified, in whole or in part in any form and or re-distributed without AMC’s prior written consent. © BOI AXA Investment Managers Private Limited 2017.
Mutual Fund investments are subject to market risks, read all scheme related documents carefully.
AMC Website: www.boiaxa-im.com is also an Investor Service Centre (for online transactions)
B/204, Tower 1, Peninsula Corporate Park, Ganpatrao Kadam Marg, Lower Parel, Mumbai - 400 013.
Toll free number : 1800-103-2263 & 1800-266-2676 • Alternate number : 020-4011 2300 & 020-6685 4100 • Website : www.boiaxa-im.com • Email : [email protected]
BOI AXA Investment Managers Pvt. Ltd.(Investment Manager for BOI AXA Mutual Fund)
BOI AXA Investment Managers’ Branches - Investor Service Centers (ISC's)
• Ahmedabad - Shop No.:- 405, 4th Floor, Zodiac Plaza, H. L. College Road, Navrangpura, Ahmedabad - 380 009. • Bangalore - 957, Regus Business Centre, Bangalore Pvt. Ltd., Level 9, Raheja Towers, 26 - 27, Mahatma Gandhi Road, Bangalore - 560 001. • Bhopal - F. F. 16, Part B, Mansarover Complex, Near Habibganj Railway Station, Bhopal - 462 016. • Chandigarh - 205, Megabyte Business Centre, SCO-333-334, Ist Floor, Sec-35B Chandigarh - 160 022. • Chennai - Cabin No. 203, Apeejay Business Center No: 39/12, Haddows Road, Nungambakkam, Chennai - 600 034. • Hyderabad - Cabin No. 23, Apeejay Business Centre, Tresorie, The Park, 22 Rajbhavan Road, Somajiguda, Hyderabad - 500 082. • Jaipur - Office no.154, 1st Floor, Ganpati Plaza,M I Road, Jaipur - 302 001. • Kolkata - Cabin 06, Block - A, 8th Floor, Apeejay House, 15 Park Street, Kolkata - 700 016. • Lucknow - Office No-504, 5th Floor, Sriram Tower, 13 Ashok Marg, Hazratganj, Lucknow - 226 001. • Mumbai B/204, Tower 1, Peninsula Corporate Park, Ganpatrao Kadam Marg, Lower Parel, Mumbai - 400 013. • New Delhi - Room No. 610, Avanta Business Center, 4th Floor, Statesman House, Barakhamba Road, Connaught Place, New Delhi - 110 001. • Pune - Apeejay Business Centre, 1st Floor, Pride House, S.No. 108/7, Shivajinagar, University Road, Pune - 411 016. • Vadodara - 118, 1st Floor, Siddharth Complex, R C Dutt Road, Alkapuri, Vadodara - 390 005.
• Agra: F-1, Ist Floor, Deepak Wasan Plaza, Above HDFC Bank, Sanjay Place, Agra - 282 002. • Ahmedabad: 201,Shail Building, Opp : Madhusudhan House, Nr. Navrangpura Telephone Exchange; Navrangpura Ahmedabad - 380 006. • Allahabad: Rsa Towers, 2nd Floor, Above Sony TV Showroom, 57, S P Marg, Civil Lines, Allahabad - 211001. • Amritsar: 72-A, Taylor'S Road, Aga Heritage Gandhi Ground, Amritsar - 143 001. • Anand: B/ 42, Vaibhav Commercial Center, Nr TVS Down Town Shrow Room, Grid Char Rasta, Anand - 388 001. • Asansol: 114/71, G.T. Road, Near Sony Centre, Bhanga Pachil, Asansol - 713 303. • Aurangabad: Ramkunj Niwas, Railway Station Road Near Osmanpura Circle Aurangabad- 431005. • Bangalore: 59, ‘Skanda’ Puttanna Road, Basavanagudi, Bangalore - 560 004. • Belgaum: CTS No 3939/ A2 A1, Above Raymonds Show Room, Beside Harsha Appliances, Club Road, Belgaum - 590 001. • Bhagalpur: 2nd Floor, Chandralok Complex, Ghantaghar, Radha Rani Sinha Road, Bhagalpur - 812 001. • Bhopal: Kay Kay Business Centre, 133, Zone I, M P Nagar, Bhopal - 462 011. • Bhubaneswar: 2nd & 3rd Floor, Janardan, House, A 181, Saheed Nagar, Bhubaneswar - 751 007. • Bokaro: B-1, 1st Floor, City Centre, Sector- 4, Near Sona Chandi-Jewellers, Bokaro - 827 004. • Calicut: 2nd Floor Soubhagya Shopping Complex Arayidathpalam, Mavoor Road Calicut- 673004. • Chandigarh: SCO-2423-2424 1ST Floor, Above TVS showroom, Sec 22C Chandigarh - 160 022. • Chennai: Flat No F11, First Floor, Akshya Plaza,(Erstwhile Harris Road), Opp Chief City Metropolitan Court, #108, Adhithanar Salai, Egmore, Chennai - 600 002. • Cochin: Building Nos.39 Ali Arcade, 1st Floor, Near Atlantis Junction, Kizhvana Road, Panampili Nagar, Cochin - 682 036. Ernakulum District. • Coimbatore: 3rd Floor,Jaya Enclave, 1056-1057, Avinashi Road, Coimbatore - 641 018. • Dehradun: Kaulagarh Road, Near Sirmour Marg, Above Reliance Webworld, Dehradun - 248 001. • Dhanbad: 208, New Market, 2Nd Floor, Katras Road, Bank More, Dhanbad - 826 001. • Gandhinagar: Plot No. - 945/2, Sector - 7/C, Gandhinagar - 382 007. • Ghaziabad: 1st Floor, C-7, Lohia Nagar, Ghaziabad - 201 001. • Gorakhpur: Above V.I.P. House, Ajdacent A.D. Girls Inter College, Bank Road Gorakpur - 273 001. • Gurgaon: Shop No. 18, Ground Floor, Sector – 14 Opp. Akd Tower, Near Huda Office Gurgaon- 122001. • Guwahati: 1st Floor, Bajrangbali Building, Near Bora Service Station, GS Road, Guwahati - 781 007. • Gwalior: 2nd Floor- Rajeev Plaza, Jayendra Ganj, Lashkar, Gwalior, M.P.- 474 009. • Hubli: CTS 483/A1/A2, Gr floor, Sri Ram Plaza, Club Road, Behind Kotak Mahindra Bank, Hubli - 580 023. • Hyderabad: 8-2-596 Karvy Plaza, Avenue 4, Street No.1, Banjara Hills, Hyderabad - 500 034. • Indore: 19/1, New Palasia, Balaji Corporate-203, 204 & 205, 2nd Floor, Above ICICI Bank, Near Curewell Hospital, Janjeerwala Square, Indore, Madhya Pradesh - 452 001. • Jabalpur: 43, Naya Bazar, Opposite shyam talkies Jabalpur (M.P.) 482 001. • Jaipur: S-16 A, 3Rd Floor Land Mark, Opposite Jaipur Club Mahavir Marg, C- Scheme Jaipur - 302 001. • Jalandhar: 1st Floor, Shanti Towers, SCO No. 37, PUDA Complex, Opposite Tehsil Complex, Jalandhar - 144001. • Jamshedpur: 2nd Floor, R R Square, SB Shop Area, Near Reliance Foot Print & Hotel - BS Park Plaza, Main Road, Bistpur, Jamshedpur 831001. • Jodhpur: 203, Modi Arcade; Chupasni Road, Jodhpur - 342 001. • Kanpur: 15/46,Ground Floor, Opp: Muir Mills, Civil Lines, Kanpur - 208 001. • Kolhapur: 605/1/4 E Ward, Near Sultane Chambers, Shahupuri 2nd Lane Kolhapur - 416 001. • Kolkata: Apeejay House (Beside Park Hotel), 15 Park Street, C Block, 3rd Floor, Kolkata - 700 016. • Lucknow: 1st Floor, A. A. Complex, Thaper House, 5 Park Road, Hazratganj, Lucknow - 226 001. • Ludhiana: SCO - 136, First Floor Above Airtel Show Room, Feroze Gandhi Market, Ludhiana - 141 001. • Madurai: Rakesh Towers, 30-C, Bye Pass Road Ist Floor, Opp Nagappa Motors, Madurai - 625 010. • Moradabad: Om Arcade, Parker Road, Above Syndicate Bank, Chowk Tari Khana, Moradabad - 244001. • Mumbai (Andheri): 6 & 7, 131 Andheri Industrial Estate Veera Desai Road, Andheri (West) Mumbai- 400053. • Mumbai (Borivali): Karvy Computershare Pvt. Ltd. Gomati Smuti, Ground Floor, Jambli Gully, Near Railway Station, Borivali (West), Mumbai - 400 092 • Mumbai (Chembur): Shop No 4 , Ground Floor, Shram Saflya Bldg N G Acharya Marg, Chembur Mumbai - 400071. • Mumbai (Fort): Office number: 01/04 24/B, Raja Bahadur Compound Ambalal Doshi Marg, Behind Bombay Stock Exchange, Fort Mumbai - 400 001. • Mumbai (Thane): 101, Yashwant Tower, Ram Maruti Road, Opp. Pooja Hotel, Naupada, Thane, Mumbai - 400 602. • Mumbai (Vashi): Shop No. 43-A, Ground Floor, Vashi Plaza Sector-17 Near Apna Bazar, Vashi, Mumbai-400705. • Mumbai (Vile Parle): 104, Sangam Arcade, V P Road, Opposite Railway Station, Above Axis Bank ATM, Vile Parle (West), Mumbai - 400 056. • Muzaffarpur: 1st Floor, Shukla Complex, Near ICICI Bank, Civil Court Branch, Company Bagh, Muzaffarpur - 842 001. • Nagpur: Plot No.2/1, House no. 102/1, Mangaldeep Apartment, Mata Mandir Road, Opp. Khandelwal Jewellers, Dharampeth, Nagpur - 440 010. • Nasik: S-12, Second Floor, Suyojit Sankul, Sharanpur Road Nasik - 422 002. • New Delhi: 305, 3rd Floor New Delhi House, Bara Khamba Road Connaught Place New Delhi - 110 001. • Noida: 307 Jaipuria Plaza; D 68 A, 2nd Floor Opp Delhi Public School, Sector 26 Noida - 201 301. • Panipat: 1st Floor, Krishna Tower Above Amertex, G.T. Road, Panipat - 132 103. • Panjim: Flat No.1-A, H. No. 13/70, Timotio Bldg, Heliodoro Salgado Road, Next to Navhind Bhavan (Market Area) Panjim - 403 001. • Patna: 3A, 3rd floor, Anand Tower, Beside Chankya Cinema Hall; Exhibition Road, Patna - 800 001. • Pune: Mozaic Bldg, CTS No.1216/1, Final Plot No.576/1 TP, Scheme No.1, F C Road, Bhamburda, Shivaji Nagar, Pune - 411 004. • Raipur: Office No - S-13, 2nd Floor, Raheja Tower, Fafadih Chowk, G E Road, Raipur - 492 001. • Rajkot: 302, Metro Plaza, Near Moti Tanki Chowk, Rajkot - 360 001. • Ranchi: Room No. 307, 3Rd Floor, Commerce Towers, Beside Mahabir Towers, Main Road, Ranchi - 834 001. • Shillong: Mani Bhawan, Lower Thana Road, Police Bazar, Shillong - 793 001. • Siliguri: Nanak Complex, Near Church Road, Sevoke Road, Siliguri - 734 001. • Solapur: Block No. 06, Vaman Nagar, Opp. D-Mart, Jule Solapur, Solapur, Maharashtra - 413004. • Surat: G-6 Empire State Building, Near Parag House,Udhna Darwaja Ring Road Surat - 395 002. • Udaipur: 201-202, Madhav Chambers, Opp G P O, Chetak Circle, Udaipur - 313001. • Ujjain: 101, Aastha Tower, 13/1, Dhanwantri Marg, Free Gunj Ujjain - 456 010. • Vadodara: 203, Corner point, Jetalpur Road, Vadodara - 390 007. • Varanasi: D-64/132, KA 1st Floor, Anant Complex, Sigra, Varanasi - 221 010. • Vijayawada: 39-10-7, Opposite Municipal Water Tank, Labbipet, Vijayawada - 520 010. • Visakhapatnam: Door No: 48-8-7, Dwaraka Dimond, Ground Floor, Srinagar, Visakhapatnam - 530016.
-
Karvy Computershare Private Limited Branches - Investor Service Centers (ISC's)
Date of Publication: 7/9/17
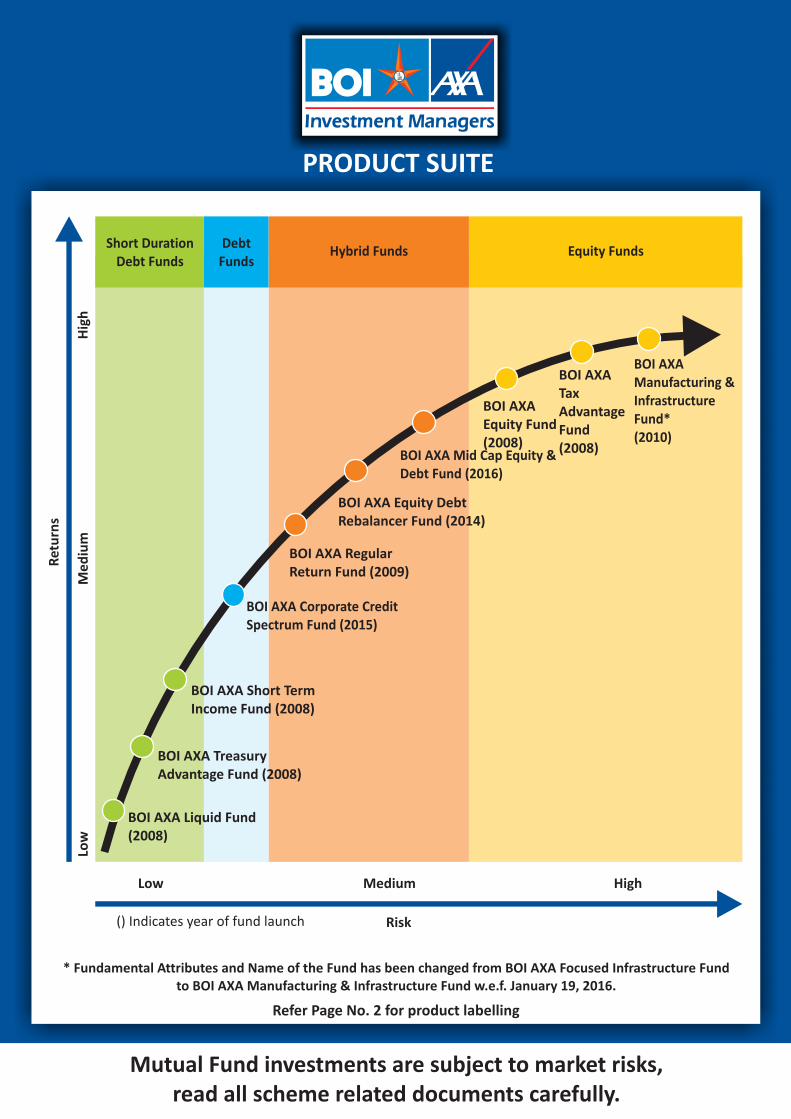
PRODUCT SUITE
Mutual Fund investments are subject to market risks, read all scheme related documents carefully.
Refer Page No. 2 for product labelling
* Fundamental Attributes and Name of the Fund has been changed from BOI AXA Focused Infrastructure Fund to BOI AXA Manufacturing & Infrastructure Fund w.e.f. January 19, 2016.
Risk
Low Medium High
() Indicates year of fund launch
Equity FundsHybrid FundsDebt
Funds
Low
Short DurationDebt Funds
Me
diu
mH
igh
Ret
urn
s
BOI AXA Regular Return Fund (2009)
BOI AXA Corporate Credit Spectrum Fund (2015)
BOI AXA Manufacturing & Infrastructure Fund*(2010)
BOI AXA Tax Advantage Fund (2008)
BOI AXAEquity Fund (2008)
BOI AXA Mid Cap Equity & Debt Fund (2016)
BOI AXA Equity Debt Rebalancer Fund (2014)
BOI AXA Short Term Income Fund (2008)
BOI AXA Treasury Advantage Fund (2008)
BOI AXA Liquid Fund (2008)