
Behind the Curtain of IT Cost Transparency - By: Carl Stumpf Managing Director, Technology...
44
© 2014 CME Group. All rights reserved. Behind the Curtain of IT Cost Transparency Carl Stumpf, Managing Director, Technology Controller and Head of Purchasing
-
Upload
melissa-luongo -
Category
Economy & Finance
-
view
42 -
download
0
Transcript of Behind the Curtain of IT Cost Transparency - By: Carl Stumpf Managing Director, Technology...

© 2014 CME Group. All rights reserved.
Behind the Curtain of IT Cost Transparency
Carl Stumpf, Managing Director, Technology Controller and Head of Purchasing

© 2014 CME Group. All rights reserved.
Key Discussion Points:• Best practices in IT cost allocation• Insights into how to use cost allocation to engage business partners• Implications of Agile, Cloud and other industry trends
The Goal:• Insights that can help influence how IT engages with business partners
to influence business decisions
2
Objectives of Today’s Discussion

© 2014 CME Group. All rights reserved.
CME Group Overview

© 2014 CME Group. All rights reserved. 4
CME Group offers the widest range of benchmark futures and options products, covering all major asset classes – and all kinds of risk.
© 2014 CME Group. All rights reserved.
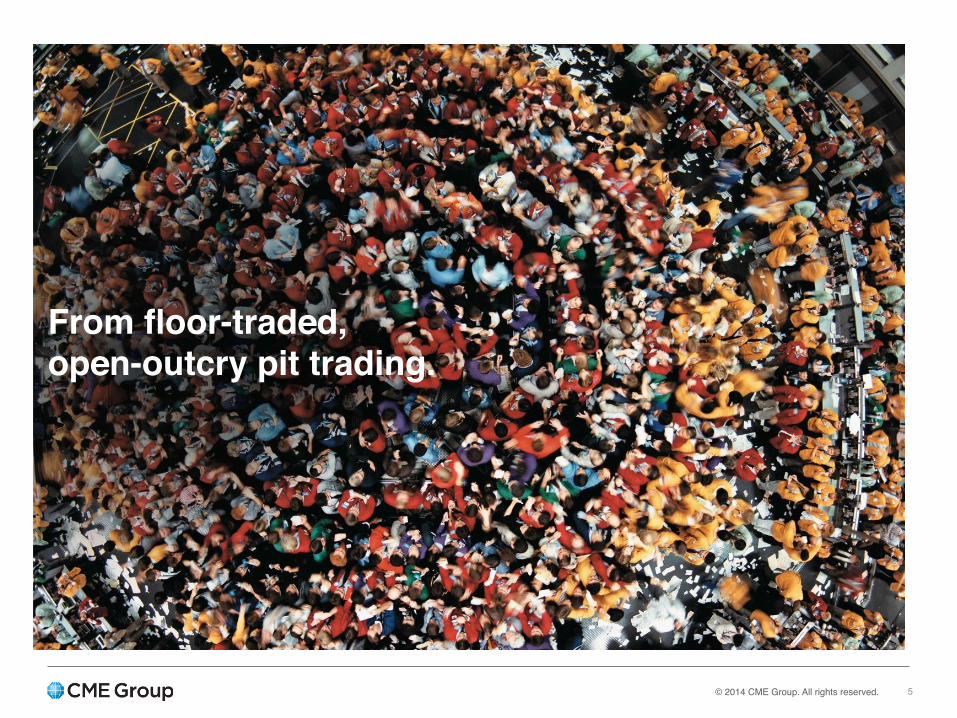
From floor-traded, open-outcry pit trading.
5

© 2014 CME Group. All rights reserved.
To electronically transmitted and matched computer-driven systems.
6
© 2014 CME Group. All rights reserved.
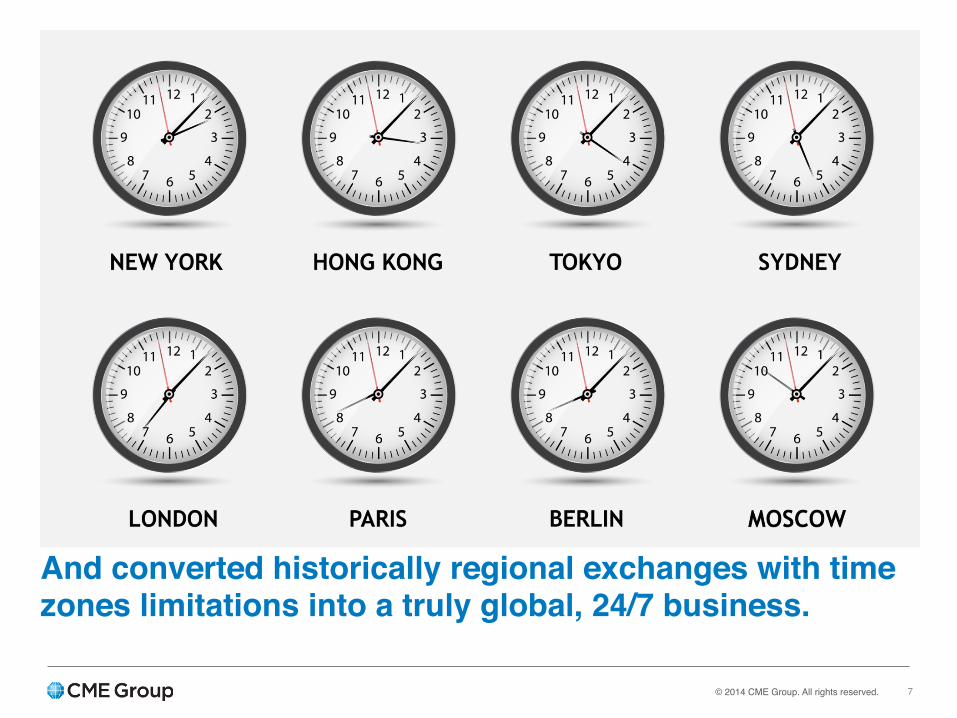
And converted historically regional exchanges with time zones limitations into a truly global, 24/7 business.
7

© 2014 CME Group. All rights reserved.
We work around the world, around the clock.
CME Europe
8

© 2014 CME Group. All rights reserved.
Best Practices in IT Cost Allocation
© 2014 CME Group. All rights reserved.
• Understand how the CFO views the business• Solid “building blocks” of accurate data• Implement service costing to align with the business
10
Best Practices in IT Cost Allocation
© 2014 CME Group. All rights reserved. 11
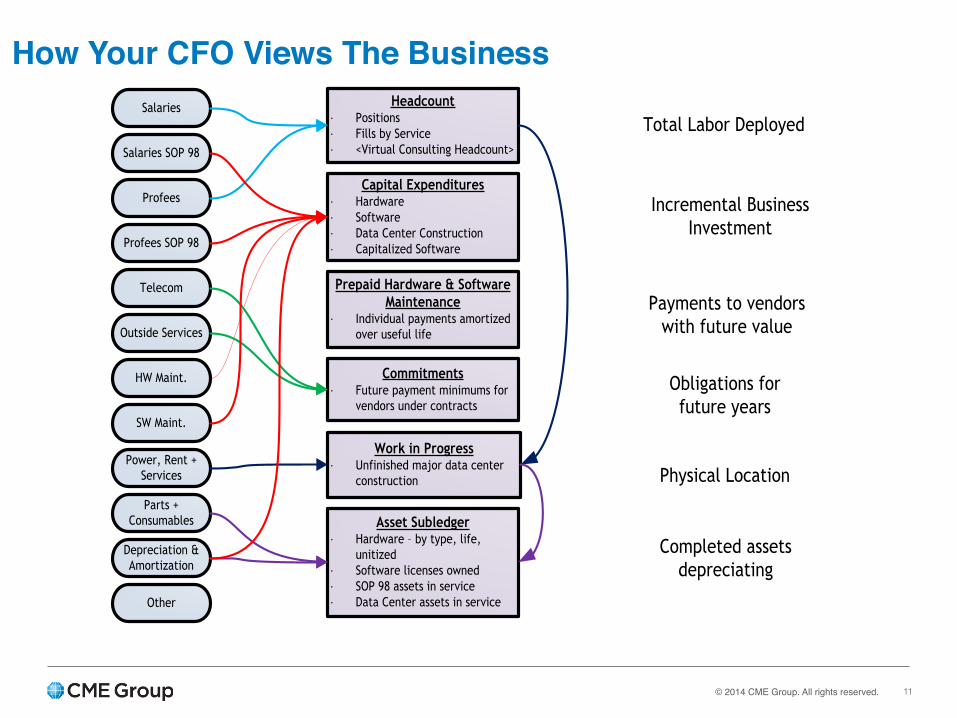
How Your CFO Views The Business Salaries
Salaries SOP 98
Depreciation & Amortization
Parts + Consumables
Profees SOP 98
Profees
Power, Rent + Services
SW Maint.
HW Maint.
Outside Services
Telecom
Headcount·∙ Positions·∙ Fills by Service·∙ <Virtual Consulting Headcount>
Capital Expenditures·∙ Hardware·∙ Software·∙ Data Center Construction·∙ Capitalized Software
Prepaid Hardware & Software Maintenance
·∙ Individual payments amortized over useful life
Commitments·∙ Future payment minimums for
vendors under contracts
Asset Subledger·∙ Hardware – by type, life,
unitized·∙ Software licenses owned·∙ SOP 98 assets in service·∙ Data Center assets in service
Work in Progress·∙ Unfinished major data center
construction
Other
Total Labor Deployed
Incremental Business Investment
Payments to vendors with future value
Obligations for future years
Completed assets depreciating
Physical Location

© 2014 CME Group. All rights reserved. 12
A Revenue and Expense P&L for TechnologyRevenue
• View 1 – “Real” revenue (cash reimbursements, asset sales)• View 2 – “Cost Plus” (tech division costs plus markup, needed for transfer pricing)• View 3 – “Unit and Service Based” (Rate*Value = Revenue, internal view not real cash)
Expenses• Salaries and Benefits (all staff, loaded with insurance and taxes)
• <SOP 98> (offset to salaries and benefits for capitalized software development)• Professional Fees (all consultants at actual costs)
• <SOP 98> (offset for capitalized software development)• Telecommunication Expenses (all circuits to telecom providers, wireless, international)• Outside services (third party expenses i.e. cloud applications, hosting, etc.)• Hardware and Software Maintenance (payments to vendors based on servers/gear and licenses)• Power, Rent, and Services (operating expenses tied to data centers owned by the company)• Depreciation and Amortization (depreciation on hardware, data centers; amortization on software and
SOP 98, measured by useful life)• Other (training, travel, meals, entertainment)• Parts and Consumables (may include: PC’s, tablets, phones, parts for repair of gear of building racks,
all items not capitalized in the general ledger)

© 2014 CME Group. All rights reserved. 13
“The Building Blocks”
• Telecom and circuits, training, travel, overtimes, parts and misc. other expenses
• Optimally capture staff time, consulting spend, and open positions on an “apples to apples” basis
• Properly capture hardware, software, data center costs, and capitalized software development. Includes maintenance and depreciation
• Logical configuration for department, project, and account
Chart of Accounts
Capital Asset
Process
Other Expenses
Staff & Consulting
Mgmt

© 2014 CME Group. All rights reserved.
Implementing Service Costing
Applications and costs are categorized into Services• This organization creates terms that make sense to the end user. Items such
as “gigabytes of storage” or “data center sq. ft.” or “number of servers” are eliminated and replaced with “email services” or “trading services”
• These “services” are defined in a manner that they can be compared in an “apples to apples” manner with external options (i.e. if you outsource email services, what are the total costs in staff, consultants, software, services, data center, and telecom that would be affected by this migration? How do you determine the transition was valuable?)
For us this is a multi step process consisting of:• Defining the services• Putting the costs in the service
14
© 2014 CME Group. All rights reserved.
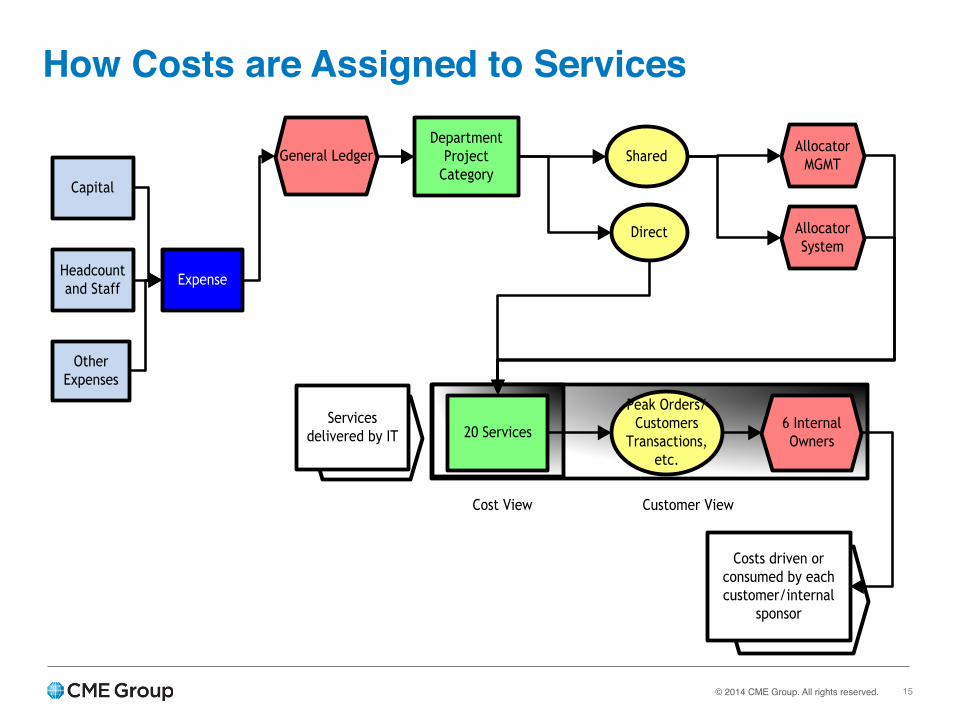
How Costs are Assigned to Services
General LedgerDepartment
ProjectCategory
Allocator MGMT
Allocator System
Services delivered by IT 20 Services 6 Internal
Owners
Costs driven or consumed by each customer/internal
sponsor
Cost View Customer View
Direct
Shared
Peak Orders/Customers
Transactions, etc.
Expense
Capital
Headcount and Staff
Other Expenses
15

© 2014 CME Group. All rights reserved. 16
Service Income Statement
Base Income Statement Revenues
Determine Units or costing, or agree on
service level and price
Expenses
Direct
Some labor and consulting, some third party services, some
hardware and software
Indirect
Most hardware and software, data centers, monitoring and support
staff, etc.
Allocation and assignment methodology (servers, units, studies, time estimation, etc.)
Service Income Statement
Service 1 (Billing
Services)
Service 2 (Customer Support)
Service 3 (ERP
Financials)Service 4
(etc.)
*Services must be understandable to business line managers, cannot be “components” like servers, PC’s data center space, etc.
© 2014 CME Group. All rights reserved. 17
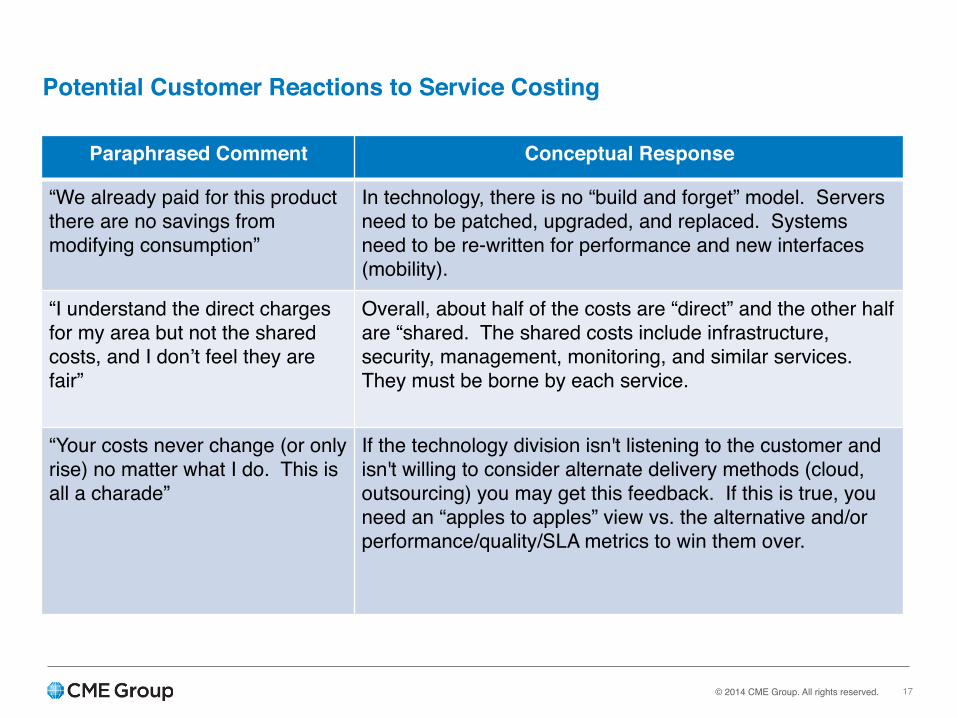
Potential Customer Reactions to Service Costing
Paraphrased Comment Conceptual Response
“We already paid for this product there are no savings from modifying consumption”
In technology, there is no “build and forget” model. Servers need to be patched, upgraded, and replaced. Systems need to be re-written for performance and new interfaces (mobility).
“I understand the direct charges for my area but not the shared costs, and I don’t feel they are fair”
Overall, about half of the costs are “direct” and the other half are “shared. The shared costs include infrastructure, security, management, monitoring, and similar services. They must be borne by each service.
“Your costs never change (or only rise) no matter what I do. This is all a charade”
If the technology division isn't listening to the customer and isn't willing to consider alternate delivery methods (cloud, outsourcing) you may get this feedback. If this is true, you need an “apples to apples” view vs. the alternative and/or performance/quality/SLA metrics to win them over.

© 2014 CME Group. All rights reserved. 18
Potential Customer Reactions to Service Costing
Paraphrased Comment Conceptual Response
“If you are charging me for these costs, then I want to control the service”
This is the “dark side” of a charge back model. Is the customer qualified to act as a technology leader and make balanced decisions on risk security, disaster recovery, etc.? Probably not. You need to educate them on what is involved, but you must anticipate this question.
“Even if I reduce my consumption I get charged back the same money because of the “unallocated” cost pool”
This is due to an excessive reliance on financial accounting measures. You must use standard costs and not charge unallocated costs back to customers, else there are no incentives to change behavior.
“Your systems are more expensive and lag what I have at home”
This can be caused by relying too much on “enterprise” technology and not trying to push towards consumer technology adoption. Showing high costs (i.e. fully loaded PC costs plus support) when the capabilities lag (Apple products) makes it worse.

© 2014 CME Group. All rights reserved.
How to Engage Your Business Partners?
© 2014 CME Group. All rights reserved.
Build a dialog that goes beyond costing• Show productivity of staff, consultants, and regional offices• Implement demand management• Track internal and external customer satisfaction• Track incidents and align to applications and impact• Align service costing with satisfaction and incidents to compare against
market based alternatives• Provide accurate project costing and implement earned value• Explain productivity linked to the structure of your staff “pyramid”
20
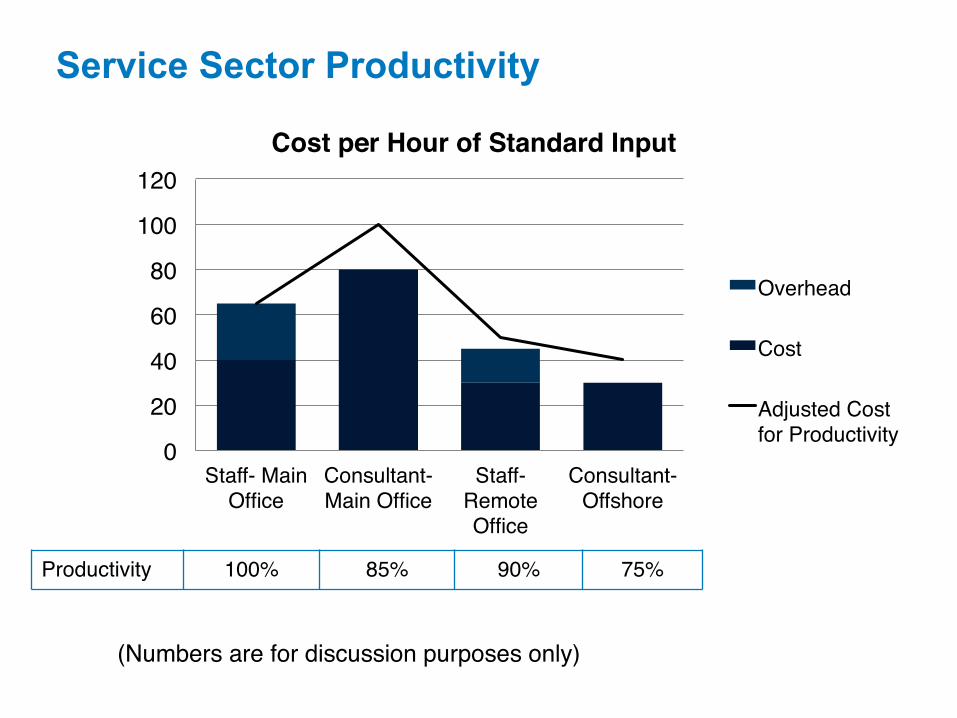
How to Engage Your Business Partners?
0
20
40
60
80
100
120
Staff- Main Office
Consultant- Main Office
Staff- Remote Office
Consultant- Offshore
Cost per Hour of Standard Input
Overhead
Cost
Adjusted Cost for Productivity
Service Sector Productivity
Productivity 100% 85% 90% 75%
(Numbers are for discussion purposes only)
© 2014 CME Group. All rights reserved.
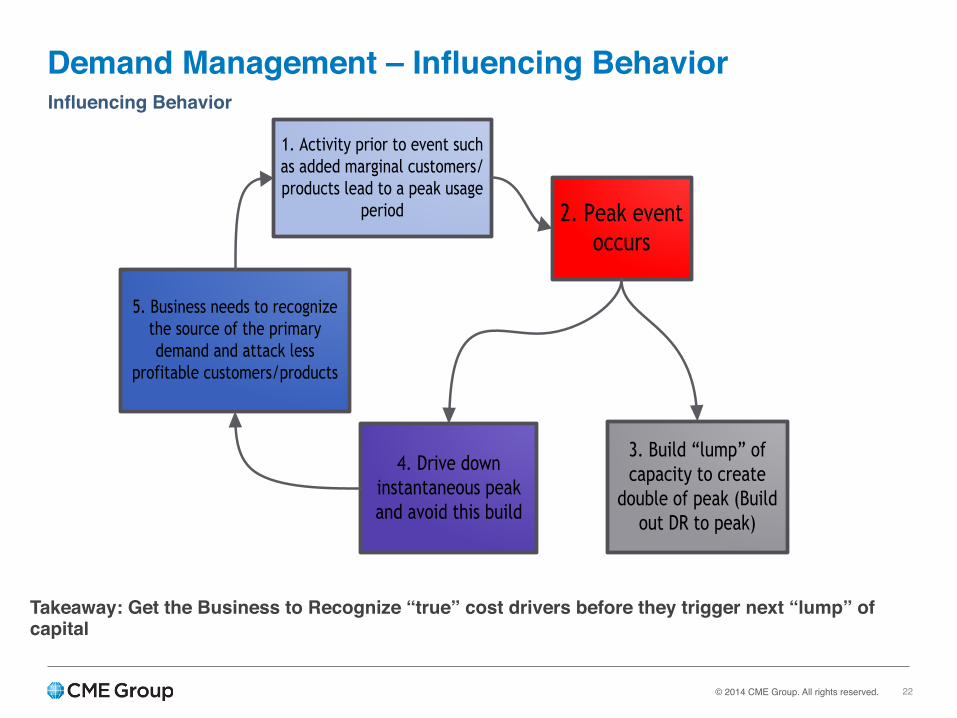
5. Business needs to recognize the source of the primary demand and attack less
profitable customers/products
4. Drive down instantaneous peak and avoid this build
3. Build “lump” of capacity to create
double of peak (Build out DR to peak)
1. Activity prior to event such as added marginal customers/products lead to a peak usage
period 2. Peak event occurs
Demand Management – Influencing BehaviorInfluencing Behavior
Takeaway: Get the Business to Recognize “true” cost drivers before they trigger next “lump” of capital
22

© 2014 CME Group. All rights reserved.
• Bandwidth Peaks• Transaction / Messaging Peaks• Capacity Available as a Percent of Peaks (i.e. “2x capacity”)• Incidents / Severity of Incidents vs. a Baseline (prior year)• Application Counts / Cloud Applications vs. In House• % of Obsolete / EOL Gear (particularly on end user computing devices)• Security metrics (overall ratings, penetration testing results)• Self Service vs. Assisted Service Percentages• Targeted reductions in legacy platforms (servers, data center,
mainframe, etc…)• Service Level Performance vs. Expectations
23
Demand Management Units You May UseSample Demand Management Units
© 2014 CME Group. All rights reserved.
• Satisfaction is measured as “how an application enables the business”• If an application requires extensive manpower or work-around efforts,
likely it will receive a low customer satisfaction rating• Applications that do not contain the attributes that the customer is
seeking such as mobility, high performance, automation, and flexibility will receive poor marks
• Where possible seek external customer feedback (through mechanisms such as “sales calls”) on specific systems because these are often drivers’ of executive priorities
• Satisfaction scales should weight various components and receive input from internal and external stakeholders where possible
• Note that while satisfaction declines with poor reliability this is in fact a different metric
24
Internal and External Customer SatisfactionWithout Measuring Satisfaction It is Difficult to Fund Elimination of Poorly Performing and Low-Cost Applications

© 2014 CME Group. All rights reserved.
• Incident trends and severity by system are important metrics and very complimentary to satisfaction
• Often older systems with less investment perform poorly, thus incident metrics and trending can be used as a basis to justify investments in upgrades
• Many systems track incidents – for TBM the likely issue is how to organize and present this information in a manner that is “digestible” to non-technology executives
• Use the method 1) what happened 2) who was impacted 3) what was the negative outcome for customers – for major items to make them understandable
• It is critical to present information on a consistent basis so that trends can be understood; do not lose your historical information and adjust as needed to make it comparable
25
Incident Tracking and TrendingMany Systems Track Incidents in the Enterprise and Harvesting This Data Is Critical
© 2014 CME Group. All rights reserved. 26
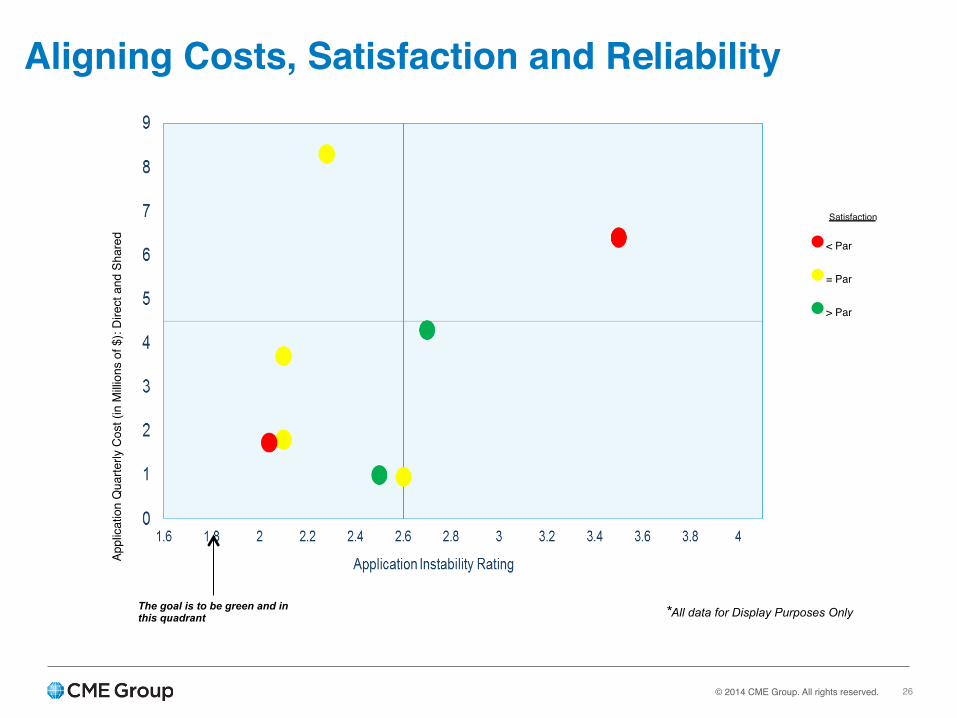
Aligning Costs, Satisfaction and ReliabilityAp
plic
atio
n Q
uarte
rly C
ost (
in M
illion
s of
$):
Dire
ct a
nd S
hare
d
The goal is to be green and in this quadrant *All data for Display Purposes Only
Satisfaction
●< Par
●= Par
●> Par
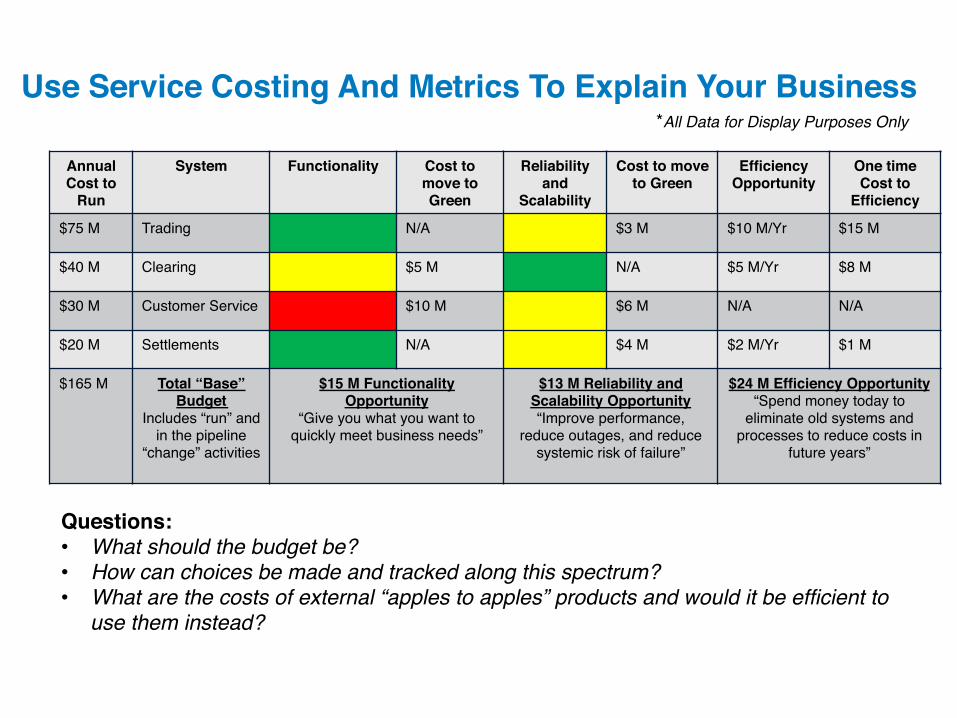
Use Service Costing And Metrics To Explain Your Business
Annual Cost to
Run
System Functionality Cost to move to Green
Reliability and
Scalability
Cost to move to Green
Efficiency Opportunity
One time Cost to
Efficiency
$75 M Trading N/A $3 M $10 M/Yr $15 M
$40 M Clearing $5 M N/A $5 M/Yr $8 M
$30 M Customer Service $10 M $6 M N/A N/A
$20 M Settlements N/A $4 M $2 M/Yr $1 M
$165 M Total “Base” Budget
Includes “run” and in the pipeline
“change” activities
$15 M Functionality Opportunity
“Give you what you want to quickly meet business needs”
$13 M Reliability and Scalability Opportunity“Improve performance,
reduce outages, and reduce systemic risk of failure”
$24 M Efficiency Opportunity“Spend money today to
eliminate old systems and processes to reduce costs in
future years”
Questions: • What should the budget be? • How can choices be made and tracked along this spectrum?• What are the costs of external “apples to apples” products and would it be efficient to
use them instead?
*All Data for Display Purposes Only
© 2014 CME Group. All rights reserved.
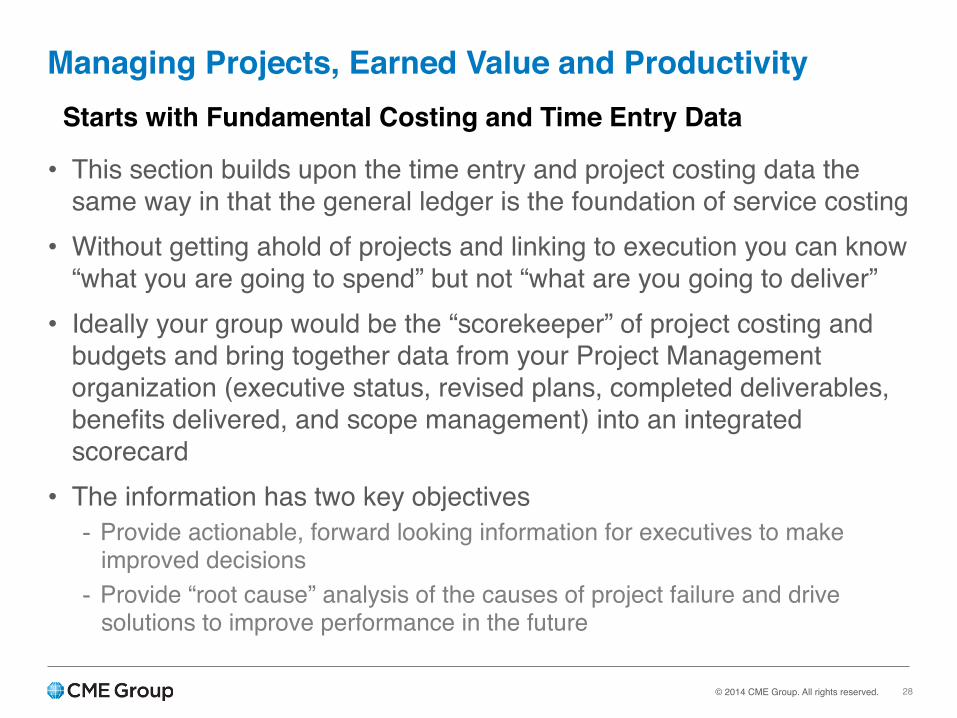
• This section builds upon the time entry and project costing data the same way in that the general ledger is the foundation of service costing
• Without getting ahold of projects and linking to execution you can know “what you are going to spend” but not “what are you going to deliver”
• Ideally your group would be the “scorekeeper” of project costing and budgets and bring together data from your Project Management organization (executive status, revised plans, completed deliverables, benefits delivered, and scope management) into an integrated scorecard
• The information has two key objectives- Provide actionable, forward looking information for executives to make
improved decisions- Provide “root cause” analysis of the causes of project failure and drive
solutions to improve performance in the future
28
Managing Projects, Earned Value and ProductivityStarts with Fundamental Costing and Time Entry Data
© 2014 CME Group. All rights reserved.
Projects
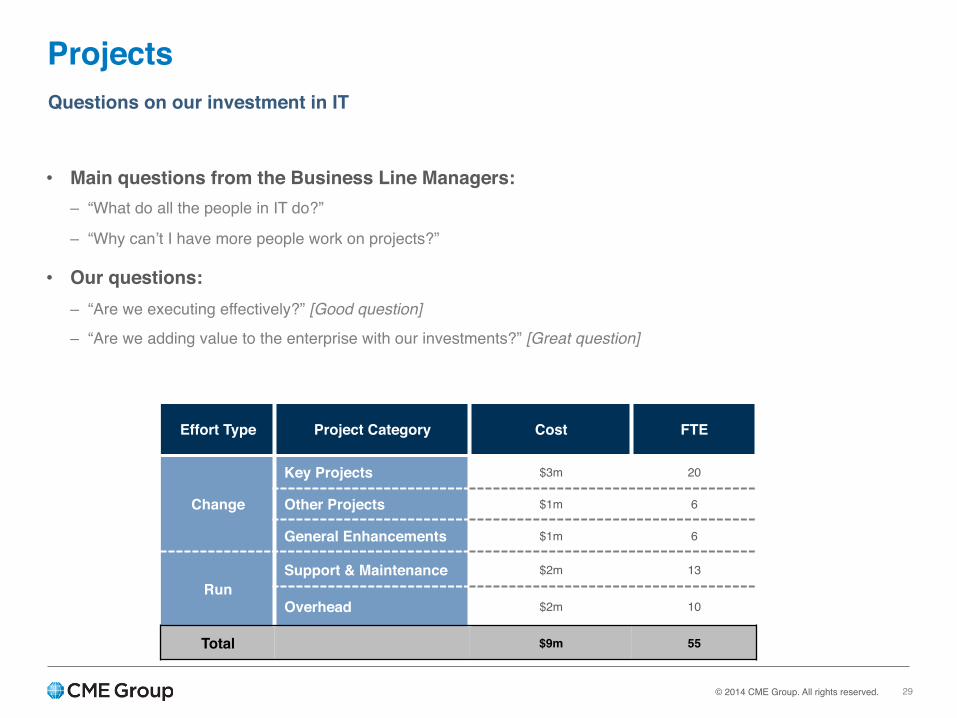
Effort Type Project Category Cost FTE
Change
Key Projects $3m 20
Other Projects $1m 6
General Enhancements $1m 6
RunSupport & Maintenance $2m 13
Overhead $2m 10
Total $9m 55
29
• Main questions from the Business Line Managers:– “What do all the people in IT do?”
– “Why can’t I have more people work on projects?”
• Our questions:– “Are we executing effectively?” [Good question]
– “Are we adding value to the enterprise with our investments?” [Great question]
Questions on our investment in IT

© 2014 CME Group. All rights reserved.
• There are a variety of ways to calculate “run vs. change”• The current method we are using- Major projects are considered “change”- Minor projects and enhancements (too small to budget and plan individually,
but large enough that they add up) are considered “change”- Support and maintenance is considered “run”- Overheads and management time are considered “run”
• The development departments should be heavily “change” and the infrastructure and management departments are mostly “change”
• High interest in ensuring that our professional fees are targeted on the most impactful “change” projects
• TBM tools can enable great analytics by area and there is high interest on groups with high “run” percentages
30
Run vs. ChangeRun vs. Change is a Ubiquitous Benchmark
© 2014 CME Group. All rights reserved.
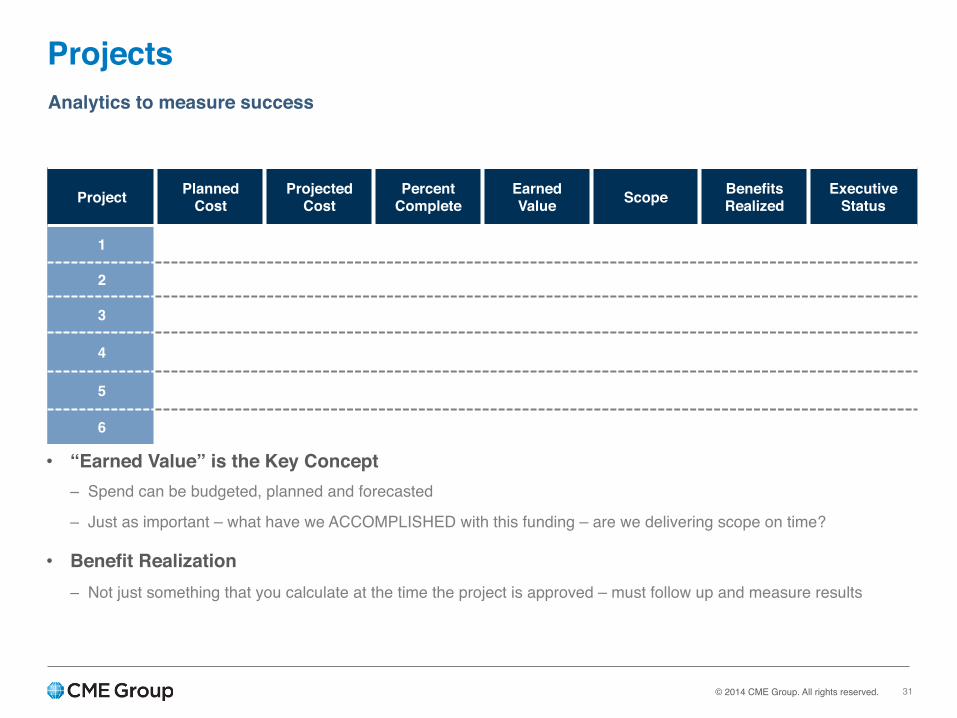
Projects
Project Planned Cost
Projected Cost
PercentComplete
Earned Value Scope Benefits
RealizedExecutive
Status
1
2
3
4
5
6
31
Analytics to measure success
• “Earned Value” is the Key Concept– Spend can be budgeted, planned and forecasted
– Just as important – what have we ACCOMPLISHED with this funding – are we delivering scope on time?
• Benefit Realization– Not just something that you calculate at the time the project is approved – must follow up and measure results
© 2014 CME Group. All rights reserved.
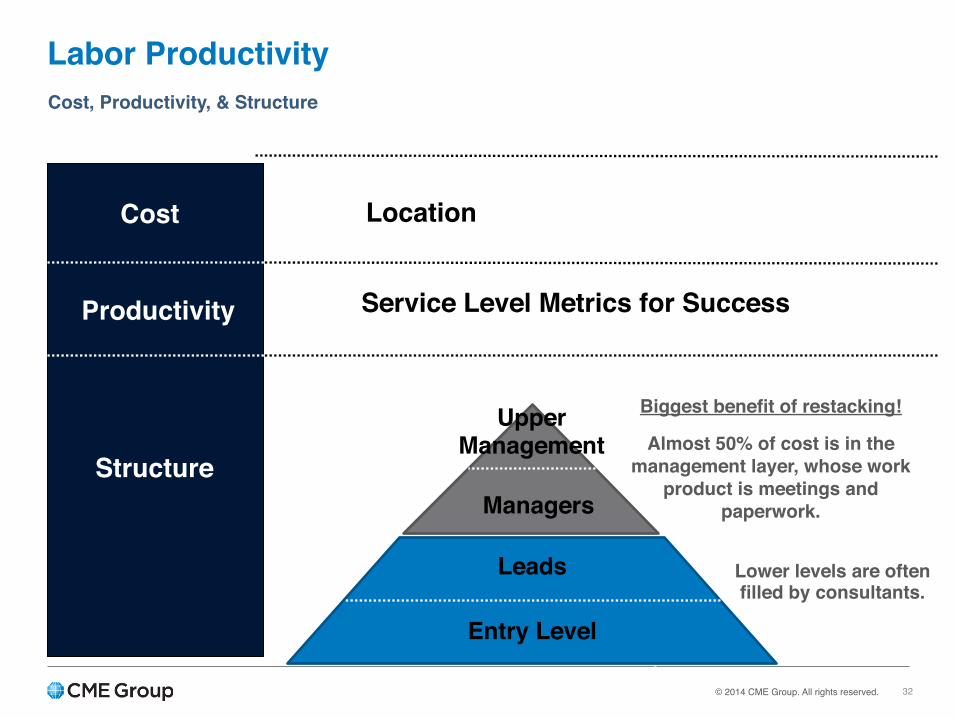
Labor Productivity
32
Cost, Productivity, & Structure
Cost
Productivity
Structure
Entry Level
Leads
Managers
UpperManagement
Biggest benefit of restacking!
Almost 50% of cost is in the management layer, whose work
product is meetings and paperwork.
Lower levels are often filled by consultants.
Location
Service Level Metrics for Success
© 2014 CME Group. All rights reserved.
Implication of Recent Technology Trends

© 2014 CME Group. All rights reserved.
• Capable IT financial leadership can support the transition• Recognize how change impacts the power of IT• Understand the common financial dilemmas of IT• Specific areas of risk- Data centers- Mainframes and other legacy systems- Custom built capitalized software
• The move from “balance sheet” to “income statement” and impact on P&L in the short term
• Plan for your model to “scale backwards” as in house demand declines
34
Implications of Recent Technology Trends

© 2014 CME Group. All rights reserved.
Two Key Components of Driving Value
• Provide actionable, forward-looking recommendations to top management- “This service is not competitive and we need to outsource it”- “We must de-emphasize on premise software and implement a cloud
strategy”- Our cost / unit in this domain is not efficient and we must find a solution”
• Deliver root-cause analysis of failure and present solutions to solve them- “We over-built our data center footprint and will should lease going forward”- “Our customers are not satisfied with our services and we need to take
corrective actions”
35
Obtain and Support IT Financial Leadership

© 2014 CME Group. All rights reserved.
• Drive to reduce the cost / unit of all you encounter (“buying smarter”)• Reduce capital requirements by retiring systems and data centers and
not replacing these expenditures elsewhere in the system (“reducing capacity”)
• Enable the “build vs. buy” discussion and insert market-based comparable data. Ensure that “buy” decisions are continually followed up on since they often are filled with optimistic assumptions (“reducing demand”)
• Ask the business if they think the value is commensurate with the spend and drive hard questions and change if there are real gaps
• Remember – if nothing changes and you are just re-packaging the same information in a “prettier package” nothing is really being accomplished
36
Actions Supported by Strong IT Financial teams

© 2014 CME Group. All rights reserved.
Finance
TechnologyThe Business
37
The Balance of Power
“Old” Way “Middle” Way “Future” WayA “Black Box” Transparency IT RestructuredUnsatisfied Customers
Cloud vendors, “consumerization”
Third parties Ascendant
No Real Choice Balance of Power shifting
True Customer Choice
© 2014 CME Group. All rights reserved.
• Keep budget flat• Reduce spending on “run” but keep systems running• Find a way to invest in innovation (cloud, mobile, productivity)• Continually advancing “commercial” IT raises users expectations
38
The Common Technology Finance DilemmaAfter working with dozens of executives specializing in Technology Finance here is a typical situation:
© 2014 CME Group. All rights reserved.
• 5-10 years ago many / most large firms were building their own data centers
• Now many of these same firms are turning to third parties to own, operate and provide key services rather than doing it themselves
• Unless you have sufficient scale to compete with the giants it seems impractical to remain with the build / operate model
• Third parties can manage demand much better than in-house providers which increases utilization and decreases per-unit costs
• If you have an existing data center footprint you likely need to assess the value of the assets on the books and begin to consider alternatives
• It is possible that on a cash-flow basis (ignoring depreciation) you may be better off with an efficiently re-factored footprint at a third party center than running your own center if it is sufficiently under capacity
39
Data Centers

© 2014 CME Group. All rights reserved.
• New technologies (AWS and open source) offer vast scale and price competitiveness
• Even if you are getting “value” from your legacy systems and technologies few would “build it from scratch” on those platforms today
• Staff with the skills to maintain and improve these systems are becoming harder to find
• The firms that provide these tools and systems are not being valued in the marketplace; cloud companies with negative income but growth often have vastly higher valuations
• Many of these systems and investments have long lives on the books and this must be considered; is it really practical to run one of these systems five years out?
40
Mainframes and Other Legacy Systems

© 2014 CME Group. All rights reserved.
• Accounting rules require capitalization of internally developed software• The amounts that have been capitalized over the years and decades
are quite substantial• These applications may have very long lives (varies by company and
system)• You may be forced to 1) stop capitalizing new work on legacy systems
2) accelerate the lives of existing systems 3) write off existing systems completely
• These decisions will be pushed by your future strategy for meeting the business objectives that these systems currently serve
• This is something to think about today if your software lives are long since you are betting on what happens many years from today
41
Custom Built (Capitalized) Software

© 2014 CME Group. All rights reserved.
• A large portion of your “run” costs may be tied to prior investments including data centers, software licensing and maintenance on legacy technologies, legacy hardware and amortization of custom built software
• For many years you likely capitalized more than you “depreciated” so that this level of investment was an overall positive in your income statement
• When the situation “flips” you may be looking at a large portion of your “run” cost tied up in prior investments which limits your ability to fix the situation (and doesn’t align with cash flow)
• While any sort of “one time” write down is a difficult discussion all parties may be interested especially if it can be combined with a business M&A transaction or other type of restructuring
• These sorts of situations are more unstable than you might realize and change may come faster than you anticipate
42
Viewing the Income Statement and Balance Sheet

© 2014 CME Group. All rights reserved. 43
Plan For Your Model to “Scale Backwards”• You have specialized teams for IT management, security, deployments, monitoring,
architecture, and other groups• As customers leave (going to cloud applications) and more services move into the
cloud (storage) these teams have less "applications" to meet their "fixed costs”• You also may have difficulty with applications that you’ve traditionally built in-house
and “capitalized” under software development if you plan to phase them out in favor of cloud or third party applications in the future
• As you dis-invest, you will face limits and "stranded assets" such as data centers, servers, networking, and other items with "book lives" longer than their actual "useful lives” (including software, as noted above)
• As you need to "write off" these assets, your total expenses will increase, even as you "do less". Few companies have a "reserve" for these sorts of events
• And while you are still spending on the legacy systems (or receiving expense allocations form the past), you need to find funds to invest in innovative technologies that overlap these systems and you may have a “dual burn” of expenses

© 2014 CME Group. All rights reserved.
• Your “steady” budget becomes more variable and filled with surprises• On premise vendors may take more aggressive action to push you to
the cloud or charge “legacy” customers more to fund their cloud transition
• Your in house assets may become “stranded” or you may need to shrink their useful lives to prepare for the cloud migration
44
Beware of Financial TrapsIssues that you may Encounter
YOUR CFO TYPICALLY DOES NOT LIKE SURPRISES


![FLAMENCO - exercise - etude - [GUITARSCHOOL -] · werner stumpf Arranger, Composer, Interpreter, Publisher, Teacher Germany , ReiskirchenGiessen About the artist Werner Stumpf - born](https://static.fdocuments.in/doc/165x107/5e3714f062550236900c0020/flamenco-exercise-etude-guitarschool-werner-stumpf-arranger-composer.jpg)