
Behind Smoke and Mirrors. On the alleged recapitalization ...
72
DIIS REPORT 2013:10 1 BEHIND SMOKE AND MIRRORS ON THE ALLEGED RECAPITALIZATION OF EUROPE’S BANKS Jakob Vestergaard and María Retana DIIS REPORT 2013:10 DIIS REPORT DIIS REPORT DIIS . DANISH INSTITUTE FOR INTERNATIONAL STUDIES
Transcript of Behind Smoke and Mirrors. On the alleged recapitalization ...

DIIS REPORT 2013:10
1
BEHIND SMOKE AND MIRRORSON THE ALLEGED RECAPITALIZATION OF EUROPE’S BANKS
Jakob Vestergaard and María Retana
DIIS REPORT 2013:10
DIIS REPORT
DIIS
REP
ORT
DIIS . DANISH INSTITUTE FOR INTERNATIONAL STUDIES

DIIS REPORT 2013:10
2
© Copenhagen 2013, the authors and DIISDanish Institute for International Studies, DIIS
Strandgade 56, DK-1401 Copenhagen, DenmarkPh: +45 32 69 87 87Fax: +45 32 69 87 00E-mail: [email protected]: www.diis.dk
Cover photo: © John Lund/Getty ImagesLayout: Allan Lind JørgensenPrinted in Denmark by Vesterkopi AS
ISBN 978-87-7605-563-9 (print)ISBN 978-87-7605-564-6 (pdf )
Price: DKK 50.00 (VAT included) DIIS publications can be downloaded free of charge from www.diis.dkHardcopies can be ordered at www.diis.dk
Jakob Vestergaard, Senior [email protected]
María Retana, Research [email protected]

DIIS REPORT 2013:10
3
Preface
This study was partially funded under the World Bank’s Knowledge for Change Program (KCP) as part of a larger ongoing study on the international banking system. On behalf of DIIS, we would like to thank Mansoor Dailami of the Devel-opment Prospects Group at the World Bank for useful interaction in the course of the project.
We would also like to thank our colleagues Ismail Ertürk, Peter Gibbon, Tomas Lauridsen, Photis Lysandrou, Anastasia Nesvetailova, Grahame Thompson and Robert Wade for comments on an earlier version of this work. Further, our study benefited from valuable interactions that took place during the Central Banking at a Crossroads conference, organized by the Danish Institute of International Studies (DIIS) in late January 2013.
The study is based on desk research, combining scrutiny of data released by the Eu-ropean Banking Authority with a review of the relevant literature. In assessing the recapitalization of European banks, we have drawn extensively on the bank capital regulation literature, but took particular inspiration from two sources. First, our views on capital ratios based on risk-weighted assets draw upon the work of Dr. Adrian Blundell-Wignall and colleagues at the OECD. Secondly, in assessing the equity funding of European banks, we have been particularly inspired by the work of Anat Admati (Professor of Finance and Economics at Stanford Graduate School of Business) and Martin Hellwig (Director of Research at the Max Planck Institute). It goes without saying that remaining errors, of judgment or otherwise, are ours entirely. The report reflects the views of its authors alone, not those of the World Bank or the Danish Institute of International Studies.
Copenhagen, 12 April 2013Jakob Vestergaard and María Retana

DIIS REPORT 2013:10
4
Contents
Preface 3Executive Summary 61. Introduction 92. Assessing the capitalization and resilience of European banking 11 The 2011 stress tests 12 The Basel 3 monitoring exercise 15 The EU Capital Exercise 17 Results of the recapitalization exercise 20 Discussion 22
3. Shortcomings of the European bank recapitalization EXERCISE 27 Asset shrinking instead of actual recapitalization was allowed 27 Capital requirements were based on unreliable ‘risk-weighting’ methodology 29 Capital requirements weaker than Basel 3, though presented as tougher 32 Equity capital requirements far too low to enhance resilience significantly 36
4. The continued undercapitalization of European banking 39 Methodology 39 Overall results 40 The core of the problem is in the core of the Eurozone: German and French banks 42 Discussion: Eurozone compared to US banking 45
5. The CRD4: institutionalizing the reluctance to recapitalize? 47 Controversies 47 The CRD4 is a major setback compared to Basel 3 48 Discussion 49
6. Discussion: The political economy of recapitalization reluctance 51 Arguments against higher capital requirements and brief rebuttals 51 Policy options 55
7. Concluding remarks 57Annex A. International bank capital regulation 60Annex B. Alternative results of the 2011 EBA stress test 66Bibliography 68

DIIS REPORT 2013:10
5
Tables and boxesTable 1 Assessments of capital in Europe’s banks 11Table 2 Results of the 2011 EU-wide stress test 14Table 3 Assessment of bank capital in European banks 16Table 4 Compliance with Basel 3 minimum requirements for capital and liquidity 16Table 5 Evolution of CT1 ratio for selected banks 23Table 6 Number of banks that would have failed 2011 stress test according to three different benchmarks 25Table 7 Results of the stress-test exercise: average Core Tier 1 capital ratio by country 26Box 1 Would leverage ratios have been a better predictor of resilience in the EBA stress test? 34Box 2 Questioning the reliability of the risk-weighting methodology 35Table 8 The scale of Basel 3 inadequacy (for large international banks) 38Table 9 The failed European recapitalization exercise 41Table 10 Average capital adequacy ratios by country for largest banks 43Table 11 Capital vs. liquidity requirements 52Table 12 From Basel 1 to Basel 3 62Table 13 Capital requirements (%), Basel 2 vs. Basel 3 63Table 14 The main elements of the Basel 3 agreement 64Table 15 Three alternative benchmarks for the 2011 European Stress Test Exercise 66
FiguresFigure 1 Undercapitalization of European banks by country 18Figure 2 Capital shortfall as of September 2011 for selected European banks 19Figure 3 EBA presentation of recapitalization results 21Figure 4 Strategies to comply with increased capital ratio requirements 28Figure 5 The decline of risk-weighted assets relative to total assets (%) 30Figure 6 Evolution of average leverage ratios for the largest Banks in Spain, Germany, Italy, France and the UK 42Figure 7 Average Core Tier 1 ratios versus leverage ratios, for core Eurozone countries, December 2011 44Figure 8 Capitalization Ratios for the Top 5 banks in Selected EU countries and US 45Figure 9 Banks assets to GDP for selected countries, 2005-2011 46
DIIS REPORT 2013:10
6
Executive summary
1. In response to concerns over the health and resilience of its banking sector, European authorities assessed the capitalization and solvency of European banks in three dif-ferent ways in the period from early 2011 to mid-2012. First, a stress test exercise examined the resilience of European banking to an adverse macroeconomic sce-nario. Secondly, a Basel 3 monitoring exercise assessed capital levels in European banks under current rules vis-à-vis the rules that will apply once Basel 3 standards are fully implemented. Thirdly, the EU capital exercise assessed the capitalization of a large sample of European banks against a temporary 9% requirement for Core Tier 1 capital ratio (CT1).
2. The results of the stress test and the Basel 3 monitoring exercise revealed that Eu-ropean Banks were dangerously undercapitalized and far from meeting the future international requirements for equity capital. While only 8 banks officially failed the stress-test by falling below the 5% Core Tier 1 capital threshold, 16 had a Core Tier 1 capital ratio just above the threshold, between 5% and 6%. Only 18 of the 91 banks included in the stress test were able to maintain a ratio of Core Tier 1 capital to risk-weighted assets of over 10% in the stressed scenario. Furthermore, the Basel 3 monitoring exercise showed that, as of June 2011, nearly sixty per cent of internationally active, big European banks did not meet a modest 3% ratio of equity capital to total assets.
3. In light of the deteriorating macroeconomic environment and increasing risks associated with debt holdings of distressed sovereigns, these results led the Euro-pean Banking Authority to launch the EU capital exercise as a key component in bolstering European banks. In an initial assessment against a benchmark of 9% Core Tier 1 capital to risk-weighted assets, shortfalls amounting to a total of 76 bn EUR were identified in 27 large European banks. These banks were then required by national supervisors to recapitalize and meet the benchmark by June 2012. According to EBA results, all of these banks met the target, with the total recapitalization reaching 115 bn EUR. However, only 38% of this amount was due to increases in the core capital of banks.
4. Altogether, the EBA’s response to the European banking crisis is plagued with shortcomings which lead us to question the validity of both its capital assessments and its claims that recapitalization has been a success.
5. The 2011 stress tests contributed (misleadingly) to making the crisis seem mainly a southern European one by choosing a ‘tailor-made’ capitalization measure. Among the small group of eight banks officially failing the stress tests, all but one were

DIIS REPORT 2013:10
7
southern European. However, a comparison of standard capitalization measures such as the leverage ratio or Tier 1 ratio would have singled out large and im-portant German and French banks as being undercapitalized. Furthermore, a cross-country comparison of average levels of capitalization shows that southern European banks fare just as well or significantly better than German and French banks (depending on what criteria are applied).
6. The EU capital exercise suffered from four key limitations in its specification of capital requirements.
7. First, the recapitalization requirements were expressed in ratio terms instead of absolute amounts of new capital to be raised. This opened the door for adjustment strategies emphasizing asset liquidation and risk-weighted asset optimization, as opposed to actual recapitalization and/or asset expansion. Thus, in this light, it should have come as no great surprise that only 38% of the reported ‘recapitaliza-tion’ took the form of actual new equity capital raised.
8. Secondly, capital requirements were based exclusively on risk-weighted capital ratios, despite increasing evidence of the unreliability of these measures. Our analysis shows that a leverage ratio (common equity to total assets) of just 4.5% as a benchmark for the stress test would have been enough to identify all the banks that would later fail, although only 20 out of 70 banks would have passed the test. More importantly, there was no corresponding level of Core Tier 1 capital ratio that would have caught all failing banks while at the same time passing some banks. Given the inability of the CT1 ratio to discriminate between more or less healthy banks, the choice of the CT1 ratio as the key benchmark for the EU Capital exercise seems misguided.
9. Thirdly, although the capital requirements for the recapitalization exercise were presented as tougher than Basel 3 standards, they were in fact weaker. Core Tier 1 capital was broader than the standard definition of high-quality capital, namely equity capital. In addition, contrary to Basel 3, the EBA made no explicit provi-sion for equity capital in the European recapitalization exercise. Our analysis shows that the effective, ‘implied’ equity capital requirement of the European recapitalization exercise was around 2.7% for large international banks, and hence lower than the equity requirement in the Basel 3 agreement of 3%.
10. Lastly, the implied equity capital requirements were far too low to enhance the re-silience of Europe’s Banks significantly. Research by first-class scholars and central bank analysts suggests that Basel 3 equity capital requirements would have to be quintupled, from 3 to 15%, to ensure the stability of the banking sector.
11. An assessment of the capitalization of the German, French, Italian and Spanish banks in terms of leverage ratios leads to diametrically opposed conclusions than

DIIS REPORT 2013:10
8
those reached by the European Banking Authority. While most banks improved their Core Tier 1 capital ratio positions concurrently with the EU capital exer-cise, the leverage ratio of a majority of banks deteriorated in the same period. Moreover, German and French banks fare significantly worse than their Italian and Spanish counterparts, remaining below the Basel III recommendation of a 3% leverage ratio for most of the 2005-2011 period.
12. A further sign of the undercapitalization of European Banking can be found by comparing it with the US banking sector. The average leverage ratio for the top 5 German banks by assets was just above 4% in 2011, which is dwarfed by the average of 8.4% for the top 5 US banks.
13. The persistent levels of undercapitalization of European Banks are being institution-alized through the European adoption of Basel 3. The fourth European Capital Requirement Directive will most likely result in a de facto ceiling on bank capital requirements by making it cumbersome for any EU country to require its banks to have equity capital in excess of 6% of total assets, a figure that is way below the 15% leverage ratio recommended in the bank capital regulation literature.
14. The reluctance to recapitalize banks seriously through higher equity capital require-ments is shaped by strong lobbying from the banking sector and a series of flawed arguments about the detrimental effects that such higher requirements would have on the real economy. These arguments are based on the incorrect notion that the cost of equity funding for banks is fixed and always higher than the cost of debt funding and that therefore higher equity requirements would lead to an inescap-able cut-back on lending, a decrease in banks’ profitability, and the migration of banking activity to the shadow sector.
15. Policy action to eliminate implicit government subsidies for debt financing and to move away from remuneration practices based on banks’ returns on equity could pave the way for bank regulation based on higher equity requirements.
16. Although it is unclear whether the total lending volume in the economy would decline if banks were required to fund themselves with more equity, it is clear that the loans made would be more valuable because risk would be properly accounted for and because banks would be less likely to reduce their lending because of prob-lems of debt overhang. Contrary to the arguments mentioned above, this would be unambiguously beneficial for the stability of the banking sector and the real economy as a whole.
DIIS REPORT 2013:10
9
1. Introduction
When publishing the results of the recapitalization exercise, the European Banking Authority reported that European banking had been successfully recapitalized and was now in a much stronger position, with a much strengthened capital base and overall resilience. ‘European banks have made significant progress in boosting their capital positions and in strengthening the overall resilience of the European banking system’, said Andrea Enria, Chairman of the European Banking Authority. ‘More than €200bn has been injected into the European banking system’, he continued, and European banks ‘are now in a better shape to finance the real economy’ (EBA 2012c: 1).
Our analysis questions this assessment. The recapitalization orchestrated by the European Banking Authority was based on a capital assessment methodology that has been subject to considerable scholarly criticism.1 The methodology of basing regulatory capital requirements on risk-weighted assets is a less reliable indicator of banks’ soundness and resilience than much simpler ratios of capital to total assets (Acharya et al. 2011). The paper therefore compares the assessments undertaken by EBA – all of which are based on risk-weighted assets – with data on leverage ratios, defined as equity capital to total assets.
The key findings are as follows. First, by equity capital criteria, the recapitalization of European banks was insufficient at best and little but a smokescreen in many cases. Only 7 out of 24 banks actually increased their ratio of equity capital to total assets. Secondly, the least well-capitalized banking sector among the larger Eurozone countries is not in Spain or Italy, but Germany, closely followed by France. The banking sectors of Spain and Italy have equity to total assets roughly double the size of those of Germany and France, contrary to what one might have expected.2 Thirdly, European banking remains several quantum leaps away from the levels of equity capital recommended by scholars – and hence also remains vulnerable to shocks and dependent on various forms of state subsidies, guarantees and bailouts.
1 For key references in the bank capital regulation literature, see Admati et al. (2011); Admati and Hellwig (2013); Blundell-Wignall and Atkinson (2010); Blundell-Wignall and Roulet (2012), Brealey (2006); Goodhart (2010); Haldane (2011; 2012); Harrison (2004); Hellwig (2010); Hanson et al (2010); Miles et al. (2012); Slovik 2011; Turner (2010).2 In debates about the European banking and sovereign crisis, references to the Southern European ‘problem countries’ (Greece, Spain, Portugal, Italy) are frequent and often imply, more or less explicitly, that problems are less severe in core Eurozone countries such as Germany and France.

DIIS REPORT 2013:10
10
Finally, the EU’s new capital requirement regulation and directive, the CRD4, will institutionalize the European reluctance to recapitalize its banks, and hence impede rather than improve the resilience of European banks.
Our finding that equity capital levels in European banking are far below the 15% of total assets recommended in the bank capital regulation literature is not surprising. What is more surprising, however, is that large parts of European banking are undercapitalized even when the internationally agreed minimum requirement of 3% equity capital relative to total assets is used as benchmark.3 Although this minimum equity capital requirement is not yet legally binding on banks, it is quite troubling that a large part of European banking is undercapitalized even by a minimum standard that is widely agreed to be far too low.
The paper is structured as follows. Section 2 reviews three different approaches taken by the European Banking Authority in assessing the capitalization and resilience of European banks; Section 3 discusses key limitations of the European recapitalization exercise; Section 4 presents new empirical material, demonstrating that European banking remains dangerously undercapitalized; Section 5 reviews Europe’s implementation of Basel 3 in Europe in the fourth Capital Regulation Directive (CRD4), noting that this legislation is likely to institutionalize further the observed reluctance to recapitalize Europe’s banks seriously by imposing a de facto ceiling on capital requirements; Section 6 discusses the political economy of the observed reluctance to recapitalize and suggests some policy options; and finally we offer a few concluding remarks in section 7.
3 For a brief introduction to international standards for bank capital regulation, including the so-called Basel 1, Basel 2 and Basel 3 agreements, see Annex 1.

DIIS REPORT 2013:10
11
2. Assessing the capitalization and resilience of European banking
In response to concerns over the health and resilience of its banking industry, European authorities assessed the capitalization and solvency of European banks in three different ways in the period from early 2011 to mid-2012. First, a stress test exercise examined the resilience of European banking to an adverse macroeconomic scenario. Secondly, a Basel 3 monitoring exercise assessed capital levels in European banks in terms of both current rules and the rules that would apply when Basel 3 standards are fully implemented. Thirdly, the EU capital exercise calculated which banks would need to recapitalize by what amounts of new capital if they were to meet a temporary 9% requirement for Core Tier 1 capital ratio (CT1).
In this section we briefly review each of these three efforts, the chronology of which is schematically summarized in Table 1. The 2011 stress test exercise was launched in January 2011, and results were published in July. The stress tests were much criticized and not well-received by markets. In the course of the next few months the European Banking Authority launched two additional initiatives to assess the capitalization of Europe’s banks: the Basel 3 monitoring exercise and the EU capital exercise.
Table 1. Assessments of capital in Europe’s banks
�����������������������
������������������
�����������������������������������������������
������������
������������
�������������������������������
���������������������������������
���
��������������
����������������������
������������������������
�����������������
���������������������������
������������
���������
����
��������������
������������������������
�����������������������

DIIS REPORT 2013:10
12
The 2011 stress tests During the months of March and April 2011, a stress test exercise was conducted by the European Banking Authority (EBA) on 91 European Banks.4 The goal was to assess the resilience of European Banks to an adverse but plausible scenario (compared to a baseline forecast), which included the deterioration of macroeconomic variables and sovereign stress. More specifically, the total effect of the envisaged shock was a fall in EU real GDP by 0.4% in 2011 and zero growth in 2012. Average unemployment in the EU was projected to reach 10% in 2011 and 10.5% in 2012.5
The sample of 91 banks covered more than 65% of the assets of the EU banking system, and at least 50% of the national banking sectors in each member state, as expressed in terms of total consolidated assets as of the end of 2010. Banks were included in the exercise in descending order of market share by total assets in each member state.
The scenario was applied to consolidated year-end data for 2010 and spanned a two-year period (2011 and 2012). Bank resilience was assessed against a benchmark of 5% Core Tier 1 capital (CT1) to risk weighted assets. This definition of capital comprises common equity and hybrid instruments provided by governments.6 This meant that contingent convertible bonds (known as CoCos) – a kind of hybrid between debt and equity, which are issued as debt but convert automatically into equity under certain pre-specified conditions – were counted as high-quality capital in the stress test exercise.
The exercise was conducted assuming a static balance sheet, meaning that there was no modeling of bank reactions to the initial shock. However, banks were allowed to strengthen their capital positions ahead of the stress test; changes in capital positions achieved in the first four months of 2011 were taken into account in the stress test exercise.
The EBA released the stress test exercise results in July 2011, and these were used as a backdrop for the recapitalization plan that started in the fall of 2011. By end-2010
4 Stress tests had also been carried out by the EBA in 2009 and 2010 as part of its official mandate.5 Further assumptions included that yields on German 10-year bonds were to remain at the baseline level, whereas EU long-term interest rates would go up by 66 basis points (on average); that short-term inter-bank interest rates in the European money markets would increase by 125 basis points; and that stock prices in the EU would suffer a negative shock of 14% on average.6 According to the methodological note released by the EBA, ‘this definition is based on existing EU legislation in the Capital Requirements Directive (CRD). It takes the existing EU definition of Tier 1 net of deductions of participations in financial institutions and it strips out hybrid instruments including existing preference shares. It recognises existing government support measures’ (EBA, 2011).

DIIS REPORT 2013:10
13
data, the 90 banks assessed (1 bank dropped out of the exercise) had an average Core Tier 1 capital ratio of 8.9% of risk-weighted assets. The baseline scenario assumed a continuation of economic recovery and forecast that the average Core Tier 1 capital ratio for the end of 2012 would be 9.8% of risk-weighted assets. The adverse scenario, on the other hand, would imply a fall of average Core Tier 1 capital ratio to 7.7% for the 90 banks in the final sample.
According to the EBA, the biggest driver behind this fall was impairment charges, which included provisions against sovereign exposures and accounted for a (negative) 3.6 percentage point impact on Core Tier 1 capital. Other variables such as pre-impairment income and increased equity had a positive impact on the Core Tier 1 capital ratio, so that the total difference between the baseline and adverse scenario amounted to 2.1 percentage points.
Under the stressed scenario, 20 banks fell below the 5% Core Tier 1 capital benchmark over the two-year period. The results changed slightly when the capital increases of the first months of 2011 were taken into account. While only 8 banks officially failed the stress test by falling below the 5% Core Tier 1 capital threshold (5 Spanish,7 2 Greek8 and 1 Austrian9), 16 had a Core Tier 1 capital ratio of just above the threshold, between 5% and 6%. Only 18 of the 91 banks included in the stress test were able to maintain a ratio of Core Tier 1 capital to risk-weighted assets of over 10% in the stressed scenario. Thus, in the event of just a moderately stressful scenario, only 1 in 5 European banks would maintain a reasonably solid capital base. Only a relatively small proportion of European banks seemed to be well capitalized, judged by the stress test exercise.
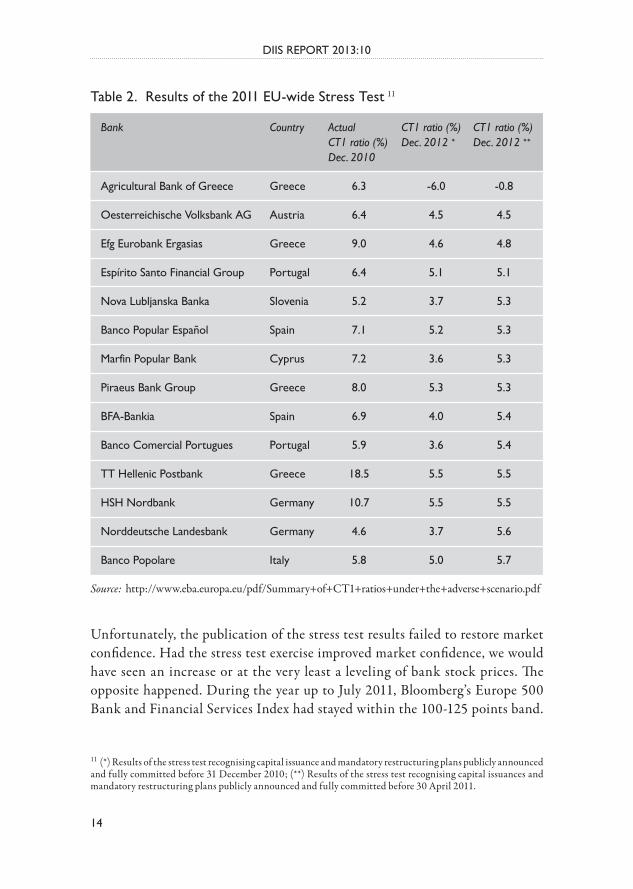
Table 2 shows the details for the banks with a Core Tier 1 capital lower than 6% under the adverse scenario.10 It is based on the sample of banks that excludes the 20 Spanish institutions whose participation in the stress test was not required by the EBA.
7 Of the 90 banks included in the final results, 25 were Spanish. Although the inclusion of just the 5 largest banks (Banco Santander, BBVA, BFA-Bankia, Caja de Ahorros y Pensiones de Barcelona and Banco Popular Español) would have been enough to cover 50% of the Spanish banking sector, the Spanish authorities required all savings banks and all listed banks to participate in the stress test. None of the 5 large Spanish banks fell short of the 5% CT1 ratio. BFA-Bankia and Banco Popular Español are among those banks with a CT1 ratio between 5 and 6%.8 Agricultural Bank of Greece, Efg Eurobank Ergasias.9 Oesterreichische Volksbank AG. 10 This list is based on the 70 banks whose participation in the stress tests was mandatory, not on the full 90-bank sample that included the 20 volunteering Spanish banks (this would distort the picture).
DIIS REPORT 2013:10
14
Table 2. Results of the 2011 EU-wide Stress Test 11
Source: http://www.eba.europa.eu/pdf/Summary+of+CT1+ratios+under+the+adverse+scenario.pdf
11 (*) Results of the stress test recognising capital issuance and mandatory restructuring plans publicly announced and fully committed before 31 December 2010; (**) Results of the stress test recognising capital issuances and mandatory restructuring plans publicly announced and fully committed before 30 April 2011.
Unfortunately, the publication of the stress test results failed to restore market confidence. Had the stress test exercise improved market confidence, we would have seen an increase or at the very least a leveling of bank stock prices. The opposite happened. During the year up to July 2011, Bloomberg’s Europe 500 Bank and Financial Services Index had stayed within the 100-125 points band.
CT1 ratio (%)Dec. 2012 ��
-0.8
4.5
4.8
5.1
5.3
5.3
5.3
5.3
5.4
5.4
5.5
5.5
5.6
5.7
CT1 ratio (%)Dec. 2012 �
-6.0
4.5
4.6
5.1
3.7
5.2
3.6
5.3
4.0
3.6
5.5
5.5
3.7
5.0
Country
Greece
Austria
Greece
Portugal
Slovenia
Spain
Cyprus
Greece
Spain
Portugal
Greece
Germany
Germany
Italy
Bank
Agricultural Bank of Greece
Oesterreichische Volksbank AG
Efg Eurobank Ergasias
Espírito Santo Financial Group
Nova Lubljanska Banka
Banco Popular Español
Marfin Popular Bank
Piraeus Bank Group
BFA-Bankia
Banco Comercial Portugues
TT Hellenic Postbank
HSH Nordbank
Norddeutsche Landesbank
Banco Popolare
Actual CT1 ratio (%) Dec. 2010
6.3
6.4
9.0
6.4
5.2
7.1
7.2
8.0
6.9
5.9
18.5
10.7
4.6
5.8

DIIS REPORT 2013:10
15
Starting in mid-July, right after the publication of the stress test results, bank stock prices suffered a dramatic dip that left the index at a new level, around 75 points, where it continued to meander for a full year before starting a slow recovery in the last months of 2012.12 As Onado (2011) points out, for the bulk of Europe, a large part of the annual drop in bank stock prices as of mid-August 2011 could be accounted for by the drop in the month following the release of the stress test results.13
Observers argued that there were several reasons why the stress tests failed to restore market confidence: the adverse scenario was too mild,14 the assessments relied too much on self-reporting by banks,15 and they were too narrowly focused on capital at the expense of liquidity concerns.
The Basel 3 monitoring exerciseIn the autumn of 2011, the European Banking Authority initiated a monitoring exercise to assess the capitalization of European banks from the (hypothetical) perspective of fully implemented Basel 3 rules. The assessment was to be undertaken continuously, on a semi-annual basis. So far, results have been published twice, in April and September 2012 (EBA 2012a).
The Basel 3 monitoring exercise assesses the capitalization of a broader sample of European banks according to two different sets of criteria: currently prevailing rules, and the Basel 3 rules that are formalized and would be made legally binding on European banks through the fourth European Capital Requirements Directive.16 The analysis was based on consolidated data as of 31 June 2011, submitted by 158 European banks on a voluntary and confidential basis. While the data are thus already old, the results of the exercise are nevertheless revealing.
12 http://www.bloomberg.com/quote/BEBANKS:IND/chart13 Critics have argued that the limited range of criteria deployed by the EBA in its stress tests caused markets to conduct their own stress tests, based on a wider range of individual bank data, including banks’ net profits, funding costs and access to capital markets. Measured by such additional criteria, many more banks were in trouble than the small set of banks singled out by the EBA. 14 Recent reports suggest that Europe has been in recession since the third quarter of 2011, with dismal prospects of substantial recovery any time soon.15 Relying on self-reporting gave banks little incentive to report truthfully, especially in the face of the potential new capital requirements arising from the stress tests. Partly in response to this criticism, bank reporting for the 2011 stress test was subject to peer review by EBA experts, but critics remained wary of a process relying first and foremost on banks’ own self-reporting.16 For more on the adoption of Basel 3 into European legislation, see section 5.

DIIS REPORT 2013:10
16
The main result of the assessment is that, by adopting a more narrow definition of what counts as capital and by making the risk-weighting system more conservative, Basel 3 capital requirements are stricter than the currently prevailing rules for all categories of capital. The capital held by banks is significantly smaller if assessed in terms of the new Basel 3 rules than if measured in terms of the currently prevailing rules (see Table 3). The Basel 3 rules will hence make it more difficult than is currently the case for a bank to meet a given capital requirement.
The European Banking Authority gives a twofold explanation for these results. First, bank capital ratios decline because the definition of what counts as capital (in each of the three categories) is narrower, excluding, for instance, goodwill, deferred tax assets (DTAs) and other ‘intangibles’.18 Secondly, the assessment of total risk-weighted assets is more conservative, especially in its treatment of counterparty and market
Table 3. Assessment of bank capital in European banks (% of risk-weighted assets)17
Source: EBA (2012a: 12).
Table 4. Compliance with Basel 3 minimum requirements for capital and liquidity
Source: EBA (2012).
17 These are averages for Group 1 banks, defined as banks that have Tier 1 capital in excess of 3 bn euros and are internationally active. There are 45 and 41 Group 1 banks included in the June and December 2011 data respectively. All other banks are categorized as Group 2 banks (EBA 2012a). 18 For financial press coverage, see (Pollack 2012). 19 This data refer to the Liquidity Coverage Ratio (LCR), which measures ‘short-term resilience to potential liquidity disruptions’ (EBA 2012a: 19) Another key liquidity indicator is the Net Stable Funding Ratio (NSFR), which measures longer-term liquidity mismatches (EBA 2012a: 23). The EBA reported that 37% of European banks met the NSFR and 63% did not (ibid.).
���������������
����
�
������
��
���
�������������
����
���
�������������
�������
Above target
49%
51%
37%
Below target
51%
59%
63%
Target
Equity to risk-weighted assets (7%)
Equity to total assets (3%)
Liquidity coverage (100%)��

DIIS REPORT 2013:10
17
risks, causing the denominator to increase. In the case of common equity, these two factors are more or less of equal order: common equity capital declines by 20.5%, while risk-weighted assets increase by 18.4%, resulting in the combined effect of a decline of the common equity ratio from 10.3 to 6.9% (EBA 2012: 11). The data from the monitoring exercise allow decomposition into banks that meet the Basel 3 targets for capital, leverage and liquidity, and banks that do not (see Table 4). The data shows that almost six out of ten internationally active, big European banks do not meet the minimum ratio for equity capital to total assets, and half of them do not meet the minimum ratio for equity to risk-weighted assets.
These low capitalization levels are not a problem in a legal sense, since the Basel 3 agreement will only be adopted in EU legislation in the course of 2013, and many provisions will only become legally binding after a phase-in period, with deadlines between 2016 and 2019. But they are troubling from a regulatory perspective. The data show that, judged by mid-2011 data, capitalization levels in European banking remain considerably far from the minimum requirements for capital and liquidity. Four years after the onset of the crisis, European banking still seemed undercapitalized and vulnerable.
The EU Capital Exercise In October 2011, the European Council launched what it described as a ‘comprehensive package aimed at addressing the deterioration of macroeconomic and market conditions’, including a ‘capital exercise’ for major European banks (Bisio et al. 2011). The capital exercise was presented as a key component in bolstering European banks in a deteriorating macroeconomic environment, with increasing risks associated with the debt holdings of distressed sovereigns (ECOFIN and EBA 2011).
Initial assessment of the capitalization level of European banksAs a first step, the EBA undertook an assessment of the capitalization of a sample of 70 European banks. These were all the banks that participated in the 2011 stress-test exercise, excluding the 20 Spanish banks that had participated voluntarily in that test. Banks’ capitalization levels were assessed against a benchmark of 9% Core Tier 1 capital ratio, using data from banks’ balance sheet positions as of 30 September 2011. Core Tier 1 capital was defined in the same way as for the 2011 EBA stress test exercise, that is, common equity plus hybrid instruments provided by governments. The 9% requirement was framed as an ‘exceptional and temporary capital buffer’ and was explicitly aimed to ‘provide reassurance to markets about the bank’s ability to withstand a range of shocks and still maintain adequate capital’ (EBA 2011C).

DIIS REPORT 2013:10
18
There were two situations in which capital shortfalls could arise. First, if a bank was below the 9% CT1 ratio threshold, and secondly, if a bank had to value its sovereign exposures towards European Economic Area countries more conservatively (Bisio et al. 2011). Thirty-seven banks were identified as having capital shortfalls, amounting to a total 115.7 bn euros. Thirty bn euros of the capital shortfall was related to the six Greek banks included in the sample, which were being monitored under the IMF-supported Greek Program and thus were not included in the subsequent EBA recapitalization plan. An additional 4 banks identified as undercapitalized were undergoing significant restructuring at the time the results of the capital assessment were made public. The capital shortfall for the remaining 27 undercapitalized banks added up to 76 bn euros. These were the 27 banks that were later subject to the recapitalization plan. Capital shortfalls were particularly large in Spanish, Italian and German banks (see Figure 1).
Figure 1. Undercapitalization of European banks by country
Source: EBA (http://www.eba.europa.eu/capitalexercise2012/RECAP_2012_dataset.zip).
ES
IT
DE
PT
FR
CY
AT
NO
SI
MT
LU
PL
HU
FI
BE
DK
NL
IE
SE
GB
Overall Capital Shortfall (+) / Surplus (-) after including sovereign capitalbuffer and additional impairments on sovereign exposures (bn EUR)
-25 -15 -5-10-20 50 1510 2520
DIIS REPORT 2013:10
19
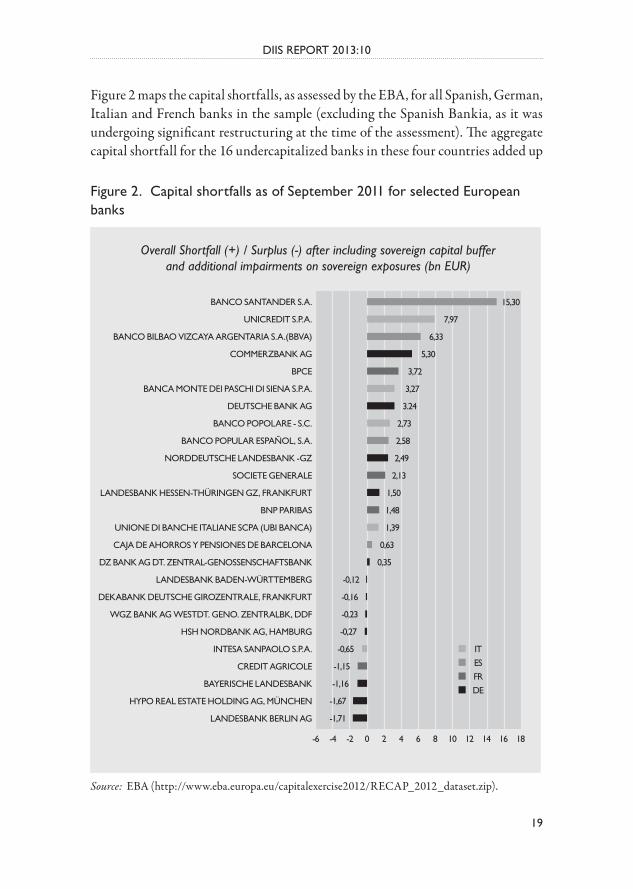
Figure 2. Capital shortfalls as of September 2011 for selected European banks
Source: EBA (http://www.eba.europa.eu/capitalexercise2012/RECAP_2012_dataset.zip).
Figure 2 maps the capital shortfalls, as assessed by the EBA, for all Spanish, German, Italian and French banks in the sample (excluding the Spanish Bankia, as it was undergoing significant restructuring at the time of the assessment). The aggregate capital shortfall for the 16 undercapitalized banks in these four countries added up
BANCO SANTANDER S.A.
UNICREDIT S.P.A.
BANCO BILBAO VIZCAYA ARGENTARIA S.A.(BBVA)
COMMERZBANK AG
BPCE
BANCA MONTE DEI PASCHI DI SIENA S.P.A.
DEUTSCHE BANK AG
BANCO POPOLARE - S.C.
BANCO POPULAR ESPAÑOL, S.A.
NORDDEUTSCHE LANDESBANK -GZ
SOCIETE GENERALE
LANDESBANK HESSEN-THÜRINGEN GZ, FRANKFURT
BNP PARIBAS
UNIONE DI BANCHE ITALIANE SCPA (UBI BANCA)
CAJA DE AHORROS Y PENSIONES DE BARCELONA
DZ BANK AG DT. ZENTRAL-GENOSSENSCHAFTSBANK
LANDESBANK BADEN-WÜRTTEMBERG
DEKABANK DEUTSCHE GIROZENTRALE, FRANKFURT
WGZ BANK AG WESTDT. GENO. ZENTRALBK, DDF
HSH NORDBANK AG, HAMBURG
INTESA SANPAOLO S.P.A.
CREDIT AGRICOLE
BAYERISCHE LANDESBANK
HYPO REAL ESTATE HOLDING AG, MÜNCHEN
LANDESBANK BERLIN AG
Overall Shortfall (+) / Surplus (-) after including sovereign capital bufferand additional impairments on sovereign exposures (bn EUR)
15,30
7,97
6,33
5,30
3,72
3,27
3.24
2,73
2,58
2,49
2,13
1,50
1,48
1,39
0,63
0,35
-0,16
-0,12
-0,23
IT
ES
FR
DE
-0,27
-0,65
-1,15
-1,16
-1,67
-1,71
-2 0 2 4 6 8 10 12 14 16 18-4-6

DIIS REPORT 2013:10
20
to 60 bn euros, compared to only 7 bn euros of ‘surplus’ capital for the 9 banks from these same four countries that had sufficient capital according to the 9% Core Tier 1 capital ratio.
Having estimated the capital shortfalls of its sample of European banks, the EBA encouraged national supervisors to task all undercapitalized banks with devising plans for their speedy recapitalization, a process that the EBA itself offered to supervise. The recommendation by the EBA was for national authorities to require banks to strengthen their capital positions so as to meet a new 9% requirement for Core Tier 1 capital as a share of risk-weighted assets by June 2012.
Banks submitted their plans for recapitalization in mid-January 2012, and by 9 February the Board of the EBA had made an aggregate assessment of the plans. National authorities were then expected to engage in continuous dialogue until the 30 June recapitalization deadline, to ensure full enforcement.
Results of the recapitalization exercise
Aggregate resultsOn 11 July 2012, EBA published an overview report on the final results of the EU recapitalization exercise, followed by a full report providing data for each of the banks involved, released on 3 October 2012. The recapitalization efforts focused on the sample of European banks identified as undercapitalized in December 2011 (excluding Greek banks and banks subject to restructuring). All in all, EBA found that the recapitalization exercise had been successful. ‘The vast majority of banks in the sample meet the required ratio of 9%’, and for those banks that did not meet the 9% CT1 ratio, the EBA reported that ‘backstop measures’ were being implemented (EBA 2012b). While the market environments remained challenging, the EBA contended, the recapitalization had strengthened the capital base of the European banking system and increased its overall resilience without any significant adverse impact on lending into the real economy (EBA 2012b: 4).
The total recapitalization amounted to 115.7 bn euros for the 27 banks involved. This was, in the view of EBA, in considerable excess of the 76 bn euros capital shortfall initially identified for these banks. However, what is interesting is the composition of the recapitalization.

DIIS REPORT 2013:10
21
Figu
re 3
. EB
A p
rese
ntat
ion
of r
ecap
ital
izat
ion
resu
lts
Sour
ce: E
BA 2
012b
: 10.
����
����
����
�����
����
����
����
����
�����
���
����
����
���
����
���
����
����
����
����
���
���
����
����
�����
�����
����
���
����
�����
����
����
����
���
���
����
�����
�����
���
����
����
�
���
����
����
����
����
����
�����
����
����
����
����
����
����
����
�
���
���
����
�����
���
����
����
���
���
���
���
����
������
����
����
����
����
����
����
����
����
����
���
����
����
���
����
����
���
����
�����
����
����
����
����
��
����
����
���
����
������
����
����
����
�
���
����
����
����
�����
����
����
����
����
����
�
����
����
����
����
����
����
���
�����
����
����
��
����
���
���
�
���
�����
����
����
����
���
����
���
���
���
�����
����
����
����
���
����
���
���
�����
����
����
��
����
���
���
�
DIIS REPORT 2013:10
22
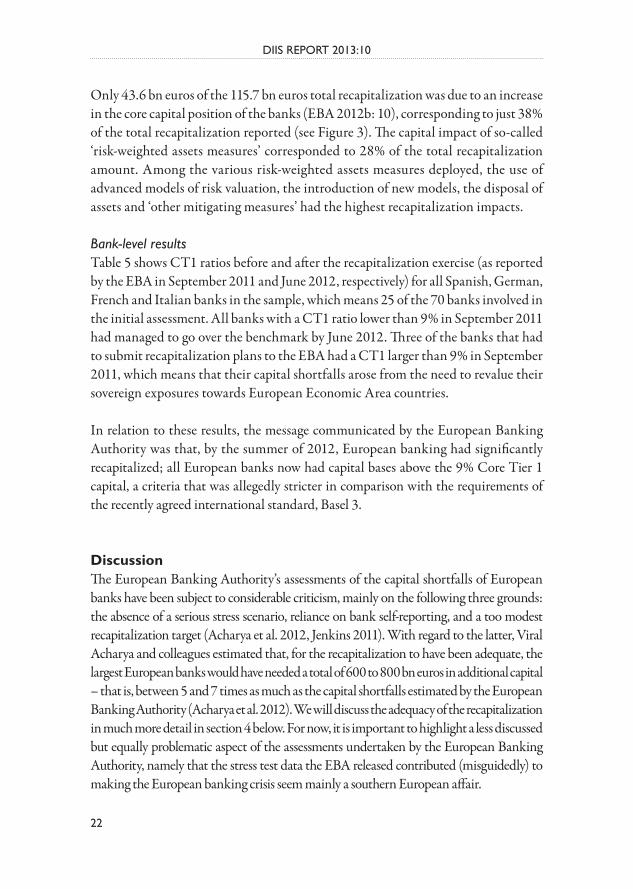
Only 43.6 bn euros of the 115.7 bn euros total recapitalization was due to an increase in the core capital position of the banks (EBA 2012b: 10), corresponding to just 38% of the total recapitalization reported (see Figure 3). The capital impact of so-called ‘risk-weighted assets measures’ corresponded to 28% of the total recapitalization amount. Among the various risk-weighted assets measures deployed, the use of advanced models of risk valuation, the introduction of new models, the disposal of assets and ‘other mitigating measures’ had the highest recapitalization impacts.
Bank-level resultsTable 5 shows CT1 ratios before and after the recapitalization exercise (as reported by the EBA in September 2011 and June 2012, respectively) for all Spanish, German, French and Italian banks in the sample, which means 25 of the 70 banks involved in the initial assessment. All banks with a CT1 ratio lower than 9% in September 2011 had managed to go over the benchmark by June 2012. Three of the banks that had to submit recapitalization plans to the EBA had a CT1 larger than 9% in September 2011, which means that their capital shortfalls arose from the need to revalue their sovereign exposures towards European Economic Area countries.
In relation to these results, the message communicated by the European Banking Authority was that, by the summer of 2012, European banking had significantly recapitalized; all European banks now had capital bases above the 9% Core Tier 1 capital, a criteria that was allegedly stricter in comparison with the requirements of the recently agreed international standard, Basel 3.
Discussion The European Banking Authority’s assessments of the capital shortfalls of European banks have been subject to considerable criticism, mainly on the following three grounds: the absence of a serious stress scenario, reliance on bank self-reporting, and a too modest recapitalization target (Acharya et al. 2012, Jenkins 2011). With regard to the latter, Viral Acharya and colleagues estimated that, for the recapitalization to have been adequate, the largest European banks would have needed a total of 600 to 800 bn euros in additional capital – that is, between 5 and 7 times as much as the capital shortfalls estimated by the European Banking Authority (Acharya et al. 2012). We will discuss the adequacy of the recapitalization in much more detail in section 4 below. For now, it is important to highlight a less discussed but equally problematic aspect of the assessments undertaken by the European Banking Authority, namely that the stress test data the EBA released contributed (misguidedly) to making the European banking crisis seem mainly a southern European affair.

DIIS REPORT 2013:10
23
Among the small group of eight banks officially failing the stress tests, all but one were southern European. Of course, these 8 banks were the ones that caught the attention of the media.20 For those who wanted to dig deeper, what was offered additionally by
20 See, for instance, FT 2011.21 (*) Banks undercapitalized according to the EBA assessment, which had to submit recapitalization plans.
Table 5. Evolution of CT1 ratio for selected banks21
Source: EBA (http://www.eba.europa.eu/capitalexercise2012/RECAP_2012_dataset.zip).
Jun-12
9.5%
9.8%
10.2%
9.5%
10.3%
10.4%
9.9%
10.2%
10.0%
9.9%
10.4%
11.1%
12.2%
9.9%
10.9%
10.8%
11.6%
10.7%
10.0%
11.7%
10.3%
10.9%
10.4%
12.7%
21.6%
Sep-11
6.0%
6.3%
6.5%
6.8%
7.1%
7.8%
7.8%
8.3%
8.3%
8.4%
8.4%
8.8%
8.8%
9.1%
9.2%
9.2%
9.2%
9.2%
9.6%
9.6%
10.0%
10.0%
10.2%
13.8%
27.9%
Bank
Norddeutsche Landesbank -GZ�
Landesbank Hessen-Thüringen GZ, Frankfurt*
Banco Popolare - S.C.�
Banco Santander S.A.�
Banco Popular Espanol, S.A.�
Unicredit S.p.A�
Banco Bilbao Viscaya Argentaria S.A. (BBVA)�
Deutsche Bank AG�
BPCE�
Societe Generale�
Unione di Banche Italiane SCPA (UBI BANCA)�
Caja de Ahorros y Pensiones de Barcelona�
Commerzbank AG�
Landesbank Baden-Württemberg
BNP PARIBAS�
Banca Monte dei Paschi di Siena S.p.A�
DZ Bank AG Dt. Zentral-Genossenschaftsbank�
Credit Agricole
HSH Nordbank AG, Hamburg
DekaBank Deutsche Girozentrale, Frankfurt
Bayerische Landesbank
Intesa SanPaolo S.p.A
WGZ Bank AG Westdt. Geno. Zentralbk, Ddf
Landesbank Berlin AG
Hypo Real Estate Holding AG, München
Country
Germany
Germany
Italy
Spain
Spain
Italy
Spain
Germany
France
France
Italy
Spain
Germany
Germany
France
Italy
Germany
France
Germany
Germany
Germany
Italy
Germany
Germany
Germany

DIIS REPORT 2013:10
24
the EBA was a list of 20 banks that had less than 6% Core Tier 1 Capital (see Table 2). Although this list included two German and one Austrian bank, it still seemed to suggest that the undercapitalization of banks was mainly a southern European problem. Two rather serious qualifications must be noted here, however. First, the failure of a small set of southern European banks had more to do with dubious methodological choices than with banking realities. Secondly, if average levels of the capitalization of banking sectors are compared, southern European banks fare just as well or significantly better than German and French banks, depending on the criteria applied.
In carrying out its 2011 stress tests, the EBA chose to deploy a new capital category, instead of utilizing the standard capital categories of the international Basel 3 framework, as it had done the year before. In a situation where it was widely believed that the stress test would need to be tougher than in earlier years, the EBA could have adopted a simple ratio of equity capital to total assets, it could have raised the Tier 1 ratio that it had used the year before (from 6% to, say, 9 or 10%), or it could have done both, stipulating that to pass the stress tests banks would need to have equity capital above 3% of total assets and Tier 1 capital above 9% of risk-weighted assets. This would have been in line with recent developments in the context of the Basel 3 accord, endorsed by G20 leaders just months before the European stress test exercise was set in motion. Instead, the EBA invented a new capital category: Core Tier 1 capital. In other words, the toughening of the stress tests consisted in the adoption of a stricter definition of capital than Tier 1. But this fell far short of adopting the criterion of the highest quality capital, as would have been the case if the leverage ratio had been chosen. Further, the tightening of the capital definition in comparison with the 2010 stress tests was compromised by a lowering of the ratio itself. The 6% Tier 1 capital requirement was replaced with a 5% Core Tier 1 capital requirement, making the net differences very small, to say the least. Why did the EBA pretend to toughen the stress tests rather than actually toughening them? To answer this question, consider what would have happened otherwise.
Table 6 shows what the results would have been if the stress tests had operated with higher ratios of capital to risk-weighted assets or a leverage ratio of 3% (equity capital to total assets). In each of these three scenarios, which would have been natural candidates in light of the recent Basel 3 agreement, quite a few large German and French banks would have failed, including Deutsche Bank, Commerzbank, BNP

DIIS REPORT 2013:10
25
Paribas and Société Générale. 22 In fact, these results would have made it apparent to markets, as well as the general public, that the European banking problem is not so much a southern European problem, but one that strikes at the heart of the Eurozone.
So the answer to the question, we argue, is twofold. First, the EBA wanted only a few banks to fail the stress test, and second it wanted these to be relatively small banks from countries on the periphery of the Eurozone. The criteria of a 5% Core Tier 1 capital ratio made it possible to argue that the criteria were now tougher than before, while at the time pointing the finger towards southern Europe: after all, seven out of eight failed banks were southern European.
This preliminary finding that some German and French banks at this lower end of the spectrum are at least as badly off as their southern European peers in terms of capitalization levels is confirmed for the whole of these countries’ banking sectors by broader data on average levels of capitalization.
Table 7 shows that, while Spanish and Italian banks had lower levels of Core Tier 1 capital than German banks as of December 2010, all four countries had quite similar
Table 6. Number of banks that would have failed the 2011 stress test according to 3 different benchmarks
22 BNP Paribas passes on the 9% Tier 1 ratio but fails the other two, while Deutsche Bank, Commerzbank and Société Générale fail on all three. For a full list of the banks that would have failed the stress test according to the 4 different criteria, see Annex B.
Source: EBA data released with the final results of the stress test exercise.
����������������������������������������������������������������������������������������������������������������������������������������������������������
�������������������������������
�
�
�
�
�
�����������������������������
�
�
�
�
�
�������������������������
�
�
�
�
�
�������
�������
������
���������������
�����
������

DIIS REPORT 2013:10
26
levels of capitalization in the adverse scenario, with Core Tier 1 ratios varying only between 6.9% and 7.5%. Against this background, portraying the banking crisis as mainly southern European seems misleading. However, the EBA did not publish any such country-level data.
More importantly perhaps, the picture is reversed when the ratio of equity capital to total assets – a more reliable indicator of banking health – is used instead of various risk-weighted measures. By the criterion of equity capital to total assets, German and French banks are by far the least well-capitalized of this group, as we shall see in section 5.
Table 7. Results of the stress test exercise: average Core Tier 1 capital ratio by country23
Source: Authors’ calculations based on EBA data, http://www.eba.europa.eu/EU-wide-stress-testing/2011/2011-EU-wide-stress-test-results.aspx
23 (*) Results of the stress test recognizing capital issuance and mandatory restructuring plans publicly announced and fully committed before 31 December 2010; (**) results of the stress test recognizing capital issuances and mandatory restructuring plans publicly announced and fully committed before 30 April 2011; (***) including only the 5 largest Spanish banks.
December 2012��
7.4%
7.5%
7.0%
6.9%
December 2012�
7.4%
7.5%
6.0%
6.5%
December 2010
8.3%
11.3%
6.8%
7.2%
Country
France
Germany
Italy
Spain���
Adverse Scenarios

DIIS REPORT 2013:10
27
3. Shortcomings of the European bank recapitalization EXERCISE
The European bank recapitalization suffered from four key limitations:
(i) capital requirements were specified in ratio terms instead of absolute terms (ii) capital requirements continued to be based on risk-weighted assets instead of
total assets (iii) capital requirements were weaker than the key Basel 3 minimum standards (iv) the implied requirement for equity capital was far too low
Asset shrinking instead of actual recapitalization was allowed Since capital requirements are often specified as a ratio of capital to assets, responses to increased capital requirements may involve adjustments on both sides of the balance sheet: new capital funding may be mobilized and/or assets may be reduced.24 Overall, one may distinguish between three overall types of responses to increased capital requirements: (i) asset liquidation, (ii) recapitalization, and (iii) asset expansion (Admati et al. 2011; 2012). In the latter two types of response, the bank actually raises more equity capital, whereas in the former equity is held constant but assets are sold, as illustrated in Figure 4.
In other words, a mode of banking regulation that is predicated upon the specification of a minimum ratio between capital and assets is a blunt one: regulated entities may comply by reducing assets instead of increasing capital. This mode of ‘indirect’ regulation is not very useful in a recession and often inconsequential in a boom. Although asset shrinkage may be seen as a natural part of the process of restoring banking health, critics argue that this strategy may have damaging effects on providing credit to the economy, especially if pursued simultaneously by many banks. In its latest Global Financial Stability Report, the IMF specifically warned that ‘a synchronized, large-scale, and aggressive shedding of bank assets could have severe consequences for the real economy in the euro area and beyond’ (IMF 2012: 54).
24 In accounting terms, equity equals assets minus liabilities. The implication is that a bank is insolvent when its liabilities exceed its assets (implying negative equity). This further implies that the higher the level of equity capital relative to total assets, the more resilient the bank will be to a macroeconomic shock that reduces the value of its assets (and/or increases its liabilities).

DIIS REPORT 2013:10
28
Figu
re 4
. St
rate
gies
to
com
ply
with
incr
ease
d ca
pita
l rat
io r
equi
rem
ents
Sour
ce: A
dmat
i et a
l. (2
011)
.
Loan
s: 10
0
Loan
s: 50
Equi
ty: 1
0
Equi
ty: 1
0
Equi
ty: 2
0
Equi
ty:
22.5
Dep
osits
&O
ther
Liab
ilitie
s:90
Dep
osits
&O
ther
Liab
ilitie
s:80
Dep
osits
&O
ther
Liab
ilitie
s:90
Loan
s: 10
0Lo
ans:
100
Dep
osits
&O
ther
Liab
ilitie
s:40
Initi
al B
alan
ce S
heet
Revis
ed B
alan
ce S
heet
with
Incr
ease
d Ca
pita
l Req
uire
men
ts
A: A
sset
Liq
uida
tion
B: R
ecap
italiz
atio
nC
: Ass
et E
xpan
sion
New
Ass
ets:
12.5

DIIS REPORT 2013:10
29
Therefore, only by insisting on actual recapitalization (scenarios B or C in Figure 4) may the desired regulatory objectives be achieved with certainty. But such actions by regulatory authorities would violate an ingrained tradition of bank self-regulation (Ozgercin 2011; Young 2012) and hence not be welcomed by the banking industry.25
By specifying the recapitalization requirement in terms of a ratio instead of absolute amounts of new capital to be raised, the EBA opened the door to adjustment strategies emphasizing asset liquidation and risk-weighted asset optimization, as opposed to actual recapitalization and/or asset expansion.
Thus, it should come as no great surprise that only 38% of the reported ‘recapitalization’ took the form of actual new equity capital raised, as noted above. The value of the rest of the recapitalization exercise is disputable. One should not forget, in this context, that processes of asset liquidation always come with the risk of creating a negative spiral of asset shedding and asset price deflation, as well as a (further) contraction of credit provision for profitable business ventures.
Capital requirements were based on unreliable ‘risk-weighting’ methodology Although many argued that the recapitalization exercise ought to be based on requirements for equity capital relative to total assets, it was decided to use risk-weighted assets instead. This decision was taken despite the fact that the effectiveness of capital ratios based on risk-weighted assets as predictors of bank resilience have been disputed by a number of studies, while the simple leverage ratio has proved to be more transparent and reliable, especially in times of crisis.26
To appreciate further the significance of calculating capital requirements relative to risk-weighted assets rather than to total assets, consider the results of a recent OECD study (Slovik 2011). The study documents how the share of risk-weighted assets to total assets for global systemically important banks (G-SIBs) decreased from roughly 70% in the early 1990s to less than 35% at the onset of the global financial crisis (see Figure 5):
25 Christine Lagarde, Director of the IMF, was among the first in the political establishment to argue that mandatory recapitalization of Europe’s banks – if necessary with public funds – was absolutely crucial in dealing with Europe’s banking and sovereign debt crises. Her remarks were not well-received in Europe at the time (Lagarde 2011, Financial Times 2011). 26 See, for example, Blundell-Wignall and Roulet (2013), Haldane (2012), Mariathasan and Merrouche (2012), Demirguc-Kunt, et al. (2010).

DIIS REPORT 2013:10
30
Figure 5. The decline of risk-weighted assets relative to total assets (%)
Source: Slovik (2011: 6).
These data suggest that Core Tier 1 capital requirements for G-SIBs are calculated on the basis of only roughly a third of their total exposure. Other studies have reached similar results. Admati et al. (2011) find that in critical cases the fraction of risk-weighted assets to total assets may even be ‘as low as one tenth’.
Taken at face value, this fall in the ratio of risk-weighted assets to total assets would seem to indicate that the asset portfolios of global banks have become drastically less risky over this 20-year period. It is difficult to believe, however, that the asset portfolios of large international banks had become half as risky in the mid-2000s, just before the global financial crisis, as compared to the early 1990s. A more likely interpretation of the data is that the risk-weighting methodology had gradually omitted a still larger proportion of ‘the actual risk exposures of systemically important banks’ (Slovik 2011: 5).
The risk-weighting approach effectively reduced the minimum capital required by reducing the asset measure against which regulatory capital was calculated. Risk-weighting was de facto capital-reducing. It is important to note, however, that conceptually this didn’t have to be the case: the risk-sensitivity could have been scaled upwards instead of downwards. In terms of risk calibration, assets could
70%
65%
60%
55%
50%
45%
40%
35%
30%
1991
1992
1993
1994
1995
1996
1997
1998
1999
2000
2001
2002
2003
2004
2005
2006
2007
2008
2009
2010
R2 = 97%

DIIS REPORT 2013:10
31
have carried risk-weighting in a range from 80 to 160% (corresponding to five risk buckets with 80% being the lowest and 160% the highest) instead of between 0 and 100%, so that only the lowest category of risk implied a lower capital requirement than the 8% baseline. The problem is not risk-weighting in itself, in other words, but the fact that the various risk-weighting frameworks were designed in a way that enabled and encouraged increased leverage by reducing minimum capital requirements.
That said, one should also stress that, with advanced financial innovation, it may prove difficult in reality to devise a system of risk-weighting that would not be ‘gamed’ in various ways by banks so as to keep their capital requirements as low as possible.27 But even if regulators were in fact to succeed in establishing an upward-scaling risk-weighting approach that effectively put a ceiling on leverage (implying equity capital to total assets at, say, 6 or 7%), there would still remain the problem that risk-weighting disincentivizes certain practices that are of benefit to society, such as loans to business, relative to other, more speculative practices. There is no simple relationship between risk and social benefits: some banking activities are relatively high risk but are nevertheless to be encouraged, while others are not. The risk-weighting-cum-capital-reducing regulatory framework of the Basel 3 agreements encouraged increased leverage in the pursuit of high ratios of return on equity, at the expense of lending to the corporate sector and of the stability of banking and the wider financial system.28
The Dexia case provides a good illustration of the limitations of relying on risk-weighted capital ratios when assessing the soundness and resilience of banks. In July 2011, Dexia reported a 10.4% Core Tier 1 capital ratio of risk-weighted assets, more than double what was required to pass EBA’s stress test criteria of 5%. Only a few months later, Dexia found itself in such deep trouble that the French and Belgian governments had to nationalize the bank in order to rescue it. Viral Acharya and colleagues noted that had the stress test exercise been based on leverage ratios instead – that is, on equity capital to total, non-risk weighted assets – the authorities would have been alerted to the trouble ahead: Dexia had a leverage ratio of just 1.3% in the summer of 2011 (Acharya et al. 2012).
27 For an illustration of how banks have lowered their capital requirements by reconfiguring credits as capital market instruments, see Blundell-Wignall and Atkinson (2010: 12-13). In this example, two banks reduce the aggregated required capital on a given asset from 8% to 1.86% by trading the asset in ways that lower its risk-weighting.28 For further reflections on the relation between Basel 3, leverage and the pursuit of high returns on equity in banking, see section 6.
70%
65%
60%
55%
50%
45%
40%
35%
30%
1991
1992
1993
1994
1995
1996
1997
1998
1999
2000
2001
2002
2003
2004
2005
2006
2007
2008
2009
2010
R2 = 97%

DIIS REPORT 2013:10
32
In Box 1, using data released by the EBA on its 2011 stress tests, we make a simple exercise to test whether, in this particular situation, a leverage ratio based on total assets would have been a better predictor of bank vulnerability than the ratio based on risk-weighted assets. This seems indeed to be the case.
Most important for our concerns here, however, is the question of what benchmark to use for recapitalization. The agreement that was reached on Basel 3 in late 2010, less than a year before the European recapitalization exercise was launched, did not abandon risk-weighting of assets as a key methodology in calculating regulatory capital. However, it did introduce a double criterion for minimum equity capital by introducing a leverage ratio, defined as equity capital to total asset set at 3%. The introduction of a leverage ratio was seen by the Basel committee as a necessary means to rebuild the resilience of the banking system because, in the absence of such non-risk-based capital requirements, banks ‘had built up excessive leverage while still showing strong risk based capital ratios’ (BCBS 2010: 61). The result was that banks were to have equity capital funding of at least 4.5% of risk-weighted assets and at least 3% of total assets. For large international banks, it would typically be the latter criterion that was binding, while for smaller banks it could often be the former. In any case, Basel 3 abandoned its exclusive reliance on regulatory capital based on risk-weighted assets. Unfortunately, this positive trend was reversed in the European recapitalization exercise: no separate requirement for the ratio of equity capital to total assets was stipulated.
Capital requirements weaker than Basel 3, though presented as tougher Taken at face value, it seemed that the European requirement of a 9% Core Tier 1 capital ratio was considerably stricter than Basel 3 requirements. The 9% threshold was higher than what Basel 3 required for Tier 1 and Tier 2 capital in aggregate (namely 8% of risk-weighted assets). Moreover, since the European Core Tier 1 capital category was narrower than Tier 1 capital as defined in Basel 3, the EBA requirement of 9% Core Tier 1 capital was also significantly stricter than the Basel 3 requirement of a minimum of 6% Tier 1 capital. Yet in reality, we argue, the capital requirements of the European recapitalization exercise were weaker than the recent internationally agreed minimum requirements of the Basel 3 accord.
Two key trends in the recent Basel 3 revisions of international standards for bank capital regulation were to adopt stricter definitions of capital, not least of what

DIIS REPORT 2013:10
33
counted as high quality capital, and to adopt a double-criterion for minimum capital by adding a leverage ratio requirement. On both counts, the European recapitalization exercise marks a significant setback.
In defining high-quality capital, the degree to which a certain form of capital could be used to absorb losses was the key criterion in Basel 3. In the European recapitalization exercise, a similar approach was signaled. The category of Core Tier 1 capital was launched, indicating a capital measure comprised of high-quality capital with high loss-absorbency characteristics. However, closer scrutiny showed that there were major problems with this story.
First, Core Tier 1 capital was broader than the standard definition of high-quality capital, namely equity capital. The decision not to deploy the capital categories of the Basel 3 framework but instead invent new ones specifically for the European recapitalization exercise did not facilitate clarity and comparison. This decision lent itself to the interpretation that the bar was being lowered, although of course this was not the official line.
Secondly and most importantly, however, whereas Basel 3 requires a minimum of 4.5% equity capital relative to risk-weighted assets, there was no explicit provision for equity capital in the European recapitalization exercise. It was left to the discretion of European banks to decide how much of the 9% Core Tier 1 ratio should be met by equity capital and how much by various hybrid instruments considered to be high quality. To compare the capital requirements of the European recapitalization exercise and those of the Basel 3 agreement, consider an estimate of the ‘implied leverage ratio’ of the European recapitalization exercise.
What is the leverage ratio implied by the 9% ratio for Core Tier 1 capital? In arriving at our estimate of the implied leverage ratio, we assume that total assets are roughly (and on average) three times greater than risk-weighted assets, in agreement with recent empirical evidence for large international banks (see above). This means that the 9% requirement for Core Tier 1 capital relative to risk-weighted assets corresponds roughly to a 3% requirement for Core Tier 1 capital relative to total assets. Since Core Tier 1 capital is a broader category than equity capital, we can conclude that, for large international banks, the 3% requirement for Core Tier 1 capital relative to total assets implies a requirement for equity capital relative to total assets lower than 3%. If we further assume that Core Tier 1 capital is, on average, 10% higher than equity capital, then we can impute an implied requirement of 2.7% equity capital

DIIS REPORT 2013:10
34
�����������������
�������������
�����������������
��������������������
�������������
����������������������������������������
����
������
�����
�����
���������������������������������������������������
����
����
�����
�����
Box 1. Would leverage ratios have been a better predictor of resilience in the EBA stress test?
Was the Dexia story an isolated case, or does the data released by the EBA in relation to the stress test results support the claim that the leverage ratio is a better predictor of bank resil-ience than ratios based on risk-weighted assets? Would the results of the stress test have been a better prediction of bank failure if the pass/fail parameter had been based on the leverage ratio instead of Core Tier 1 capital ratio?
To answer these questions, we first found information on failing European banks between December 2010 and December 2012. Given the lack of an official list of bank failures in Europe, we used the ‘Failed Bank Tracker’ from Open Economics*. According to this list, 11 out of the 70 banks in our sample had failed in the two-year period starting December 2010. Only one of the 3 banks that failed the EBA’s stress test with a Core Tier 1 ratio lower than 5% appears in the Failed Bank Tracker.
Using EBA data, we then calculated the leverage ratios in the stressed scenario for the 70 banks participating in the stress test. Next, we assigned a failing grade to banks with a leverage ratio lower than 3% by December 2012, which corresponds to the Basel 3 equity requirements, which will have been phased in by 2019. By this standard, 26 out of 70 banks would have failed the stress test. Six of these 26 banks went on to fail in reality.
We then searched for the leverage ratio and Core Tier 1 ratio that would have caught all the 11 bank failures in the 2 years comprised by the stress test. The results lend some support to the claim that leverage ratios area better indicator of bank resilience than risk-weighted measures. A leverage ratio of just 4.5%, which is by all means lower than the 15% recom-mended by scholars (Admati et al. 2010), would have been enough to identify all the banks that would later fail. However, this indicator would also have identified a further 39 banks as undercapitalized. If the passing grade for the stress test had been a 4.5% leverage ratio, only 20 out of 70 banks would have passed the test.
More importantly, there was no corresponding level of Core Tier 1 capital ratio that would have caught all failing banks while at the same time giving a passing grade to some banks. In fact, the bank with the highest Core Tier 1 ratio (20.4%) in the stressed scenario (Irish Life and Permanent) went into a government restructuring plan in 2012.
* In the USA, the Federal Deposit Insurance Company has put together a list of bank failures, defined as the clos-ing of a bank by a federal or state banking regulatory agency generally due to its inability to meet its obligations to depositors and others. No official institution provides a similar list for the Eurozone.The failed bank tracker includes a broad range of bank crisis measures beyond bankruptcy filing in its definition of a failed bank, such as bank nationalizations and government bailouts, some bank mergers and several cases of temporary closure.

DIIS REPORT 2013:10
35
to total assets.29 When taking into account the fact that the Basel 3 requirement of 3% equity capital to total assets is itself widely criticized for being far too low (as we shall describe in more detail below), the European recapitalization exercise appears anything but ‘tough’.
In sum, the Core Tier 1 capital category, invented by European authorities for the purposes of the stress test and recapitalization exercises, creates more confusion than clarity. Most importantly, it makes the European recapitalization exercise appear more progressive than it is, while at the same time obscuring whether European banks in fact have sufficient levels of (loss-absorbing) equity capital.
The suspicion lingers that this leniency with respect to the (implied) requirements for the ratio of equity capital to total assets could well have resulted from lobbying pressure on behalf of the European banking sector. Many European banks had ratios of equity capital to total assets that were dangerously low, as will be demonstrated in later sections.
Box 2. Questioning the reliability of the risk-weighting methodology
Numerous studies have questioned the risk-weighted assets methodology, and there is an increasing consensus that it obscures rather than illuminates the risk positions of banks. This recently led the Basel Committee to launch an analysis of risk-weighted assets for market risk (mRWAs) as part of its regulatory consistency assessment program (RCAP). The stated purpose of this study was ‘to obtain a preliminary estimate of the potential for variation in mRWAs across banks and to highlight aspects of the Basel standards that contribute to this variation’ (BCBS, 2013: 3).
The study analyzed publicly available data on large globally active banks with significant trading operations and asked 15 large banks to calculate mRWAs for the same hypothetical portfolios. The implied capital requirements calculated by the 15 banks for the main portfolio ranged between 13.5 and 34 million Euros. The study found that the two key sources of varia-tion in the calculation of mRWAs and implied capital requirements are: (a) modeling choices made by banks, and (b) supervisory decisions applied either to all banks in a jurisdiction or to individual banks (ibid.).
The extent of variation in banks’ use of mRWA found by this study puts the current use of risk-weighted asset methodology in negative light and is likely to undermine its credibility further. The Basel Committee is currently considering a proposal that will curb banks’ discre-tion in the use of models for calculating risk-weighted assets.
29 The Basel 3 monitoring exercise found that under current rules and definitions Tier 1 capital funding in European banks was 16.5% higher than equity capital (see Table 4). Since Tier 1 capital is a broader measure of Core Tier 1 capital, we have assumed that Core Tier 1 capital is roughly 10% lower than equity capital in European banks, while acknowledging that this will vary considerably from bank to bank.

DIIS REPORT 2013:10
36
Equity capital requirements far too low to enhance resilience significantlyIn the previous section, we noted that the effective, ‘implied’ equity capital requirement of the European recapitalization exercise was around 2.7% of total assets for large international banks and hence lower than the equity requirements of the Basel 3 agreement. Needless to say, it is disappointing that the European recapitalization exercise did not specify a threshold for minimum equity capital funding and that the level of equity capital implicitly required (through the CT1 requirement) was lower than the recently agreed international standard of at least 3% of total assets. But the problem goes much deeper than just ‘undercutting’ Basel 3. If Europe wants a healthy and resilient banking sector, Basel 3 is a poor benchmark. The European recapitalization exercise should have been much more ambitious. Although the Basel Committee sees its minimum capital requirements as essential means ‘to transform the global regulatory framework and promote a more resilient banking sector’ (BCBS, 2010: 2), it is disputable, to say the least, whether capital requirements as low as those of Basel 3 will in fact contribute to increasing the sector’s resilience. Scholars and central bank analysts alike have questioned the adequacy of Basel 3 equity capital requirements. Consider two brief examples.
If a number of the largest banks managed to report capital levels well in excess of regulatory capital requirements very quickly after the global financial crisis, does this not suggests almost by definition that these capital requirements are too low and too easy for the banks to comply with? Researchers based at Harvard University found that as soon as early 2010 the four largest US banks had average capital ratios well above those required for banks to be considered well-capitalized. ‘Even as we emerge from a deep financial crisis, the regulatory constraint is manifestly non-binding’, they noted (Hanson et al. 2011: 8). More specifically, the study found that, for the four US banks in question, the ratio of Tier 1 capital to risk-weighted assets was 10.7% and their ratio of equity capital to RWA ratio 8.2%, comfortably in excess of the capital ratios of 6% (Tier 1) and 4.5% (equity) ratios they would be required to achieve by the Basel 3 standards. If large banks remain well above minimum capital requirements even in the stressful scenarios, then most probably such minimum capital requirements only very rarely constrain bank capital, and hence they fail to constitute a relevant and effective regulatory tool.
Other critics have focused on the loss resilience implied by a given capital ratio requirement. Although Andrew Haldane noted that Basel 3, if fully adopted, would cause the minimum equity capital ratio to ‘quintuple over the next decade, rising

DIIS REPORT 2013:10
37
from 2% to close to 10% of risk-weighted assets for the largest global banks’,30 he nevertheless stressed that even a loss in the value of a bank’s assets of only 4% ‘will be enough to render it insolvent’ (Haldane 2011: 14). This observation is of course particularly troubling when one recalls that many banks experienced losses well above this 4% threshold during the global financial crisis.31
In late 2010, concerns such as these caused a group of 20 finance professors to take the unusual step of publishing a joint letter in the Financial Times, voicing a scathing critique of internationally agreed capital requirements:
Banks’ high leverage and the resulting fragility and systemic risk contributed to the near collapse of the financial system. Basel III is far from sufficient to protect the system from recurring crises. If a much larger fraction, at least 15 per cent, of banks’ total, non-risk-weighted, assets were funded by equity, the social benefits would be substantial. And the social costs would be minimal, if any. (Admati et al 2010)32
The Basel 3 ratios for equity capital may seem large at first, judged by the five-fold increase in this ratio, noted by Haldane. But rather than be impressed with this increase of requirements for equity capital, we should be astonished that the requirements have previously been so low that even a quintupling is far from adequate.
If for a moment we focus only on large international banks – estimated to have a risk-weighted to total assets ratio of 1 to 3 (as in the OECD study cited above) – the recommendation of 15% equity capital to total assets would translate into a Tier 1 capital ratio to risk-weighted assets of 45%. The current requirement of Basel 3 that banks have 4.5% equity capital relative to their risk-weighted assets corresponds to a requirement to have 1.5% equity capital relative to their total assets.
30 This figure refers to the equity capital requirements that will apply to G-SIBs by 2019, including the G-SIBs capital surcharge and the capital conservation buffer.31 The IMF estimated, for instance, that the cumulative credit losses of US banks in the period from 2007 to 2010 were on the order of 7% of assets (IMF 2010).32 Signatories included Prof Anat Admati (Stanford University), Prof Franklin Allen (University of Pennsylvania), Prof (Emeritus) Richard Brealey (London Business School)Prof (Emeritus) Michael Brennan (UCLA), Prof Arnoud Boot, (University of Amsterdam), Prof Markus Brunnermeier (Princeton University), Prof John Cochrane (University of Chicago), Prof Peter DeMarzo (Stanford University),Prof Eugene Fama ( University of Chicago), Prof Michael Fishman (Northwestern University), Prof Charles Goodhart (LSE), Prof Martin Hellwig (Max Planck Institute for Research on Collective Goods), Prof Hayne Leland (University of California Berkeley), Prof Stewart Myers (MIT), Prof Paul Pfleiderer (Stanford University), Prof Jean-Charles Rochet (University of Zurich), Prof Stephen Ross (MIT), Prof (Emeritus) William Sharpe (Nobel Laureate 1990, Stanford University), Prof Chester Spatt (Carnegie Mellon University), Prof Anjan Thakor (Washington University).

DIIS REPORT 2013:10
38
Even if we consider two hypothetical scenarios following fully phased-in Basel 3 equity capital requirements, where both the counter-cyclical buffer and the G-SIBs surcharges are applied close to its maximum levels, the results are far below the levels recommended by scholars. Table 8 illustrates a scenario (Basel 3, 2019*) where a 2% countercyclical buffer is imposed on top of the minimum equity capital requirement (4.5) and the capital conservation buffer (2.5), resulting in a ratio of 9% equity capital to risk-weighted assets. This translates roughly into a 3% equity capital to total assets ratio (based on the assumption that the ratio of risk-weighted assets to total assets will remain roughly one third for large, global banks). Further, for a G-SIB with the highest possible systemic importance, an equity capital surcharge of 2.5% may be added on top of this, and we could reach a total level of 12% of risk-weighted assets, corresponding roughly to 4% of total assets (Basel 3, 2019**).33
What emerges from these considerations is that equity capital requirements would have to be quintupled to reach levels recommended by scholars, whether calculated relative to total assets (from 3 to 15% equity capital) or relative to risk-weighted assets (from 9 to 45%). Thus, although Basel 3, when fully implemented in 2019, will have quintupled equity capital requirements from 2% to almost 10%, a further quintupling will be needed: if equity capital requirements are to be adequate by criteria identified across a range of studies, they should be increased not almost 5-fold but almost 25-fold (from 2 to 45% of risk-weighted assets).
Table 8. The scale of Basel 3 inadequacy (for large international banks)
Source: Authors’ calculations based on BCBS (2010) and Admati et al. (2010).
33 In this scenario, the counter-cyclical buffer has been raised to its maximum level of 2.5%, so that we reach a total of 12% of risk-weighted assets (4.5+2.5+2.5+2.5).
Optimal equity capital
45
15
Basel 3, 2019 ��
12
4
Basel 3, 2019 �
9
3
Basel 3, 2013
4.5
1.5
Basel 2
2
0.67
Equitycapital
In% of risk-weighted assets
In% of total assets

DIIS REPORT 2013:10
39
4. The continued undercapitalization of European banking
A clear finding of recent studies in the bank capital regulation literature is that the regulatory focus should put more emphasis on equity capital relative to total assets than on broader measures of capital relative to risk-weighted assets. When reporting the results of the recapitalization exercise, the EBA not only focused on the least informative capital ratio, the Core Tier 1 capital ratio, it did not report leverage ratios, nor released data for total assets so that analysts could calculate non-risk-weighted ratios themselves.
In this section, we estimate leverage ratios for 25 out of the 70 banks included in the recapitalization exercise, as well as aggregate estimates for the four key Eurozone countries: Germany, France, Italy and Spain. We also report the data for those banks in the United Kingdom that account for 50% of total assets of the country’s banking sector as a point of reference. Before discussing the results, a brief comment on our methodology in arriving at the data is warranted.
MethodologyOur main interest is in estimating leverage ratios (equity to total assets) for all German, French, Italian and Spanish banks involved in the recapitalization exercise as of June 2012, so as to be able to compare this more solid measure of capitalization with the Core Tier 1 capital relative to risk-weighted assets deployed by the European Banking Authority. More specifically, we make three such comparative assessments:
• What is the trend in bank capitalization from December 2011 to June 2012 (as assessed by these two different capital ratios)?
• What are the main bank-by-bank differences in capitalization levels (as assessed by these two different capital ratios), both before and after the recapitalization?
• What are the main differences across the four countries in terms of the average level of capitalization of their banking sector (as assessed by these two different capital ratios), both before and after the recapitalization, and over the period from 2005 to 2011?

DIIS REPORT 2013:10
40
The two main sources of data are the results released by the EBA and Bankscope, respectively.34 From the data released by the EBA we have taken data on Core Tier 1 capital, common equity and risk-weighted assets, whereas leverage ratio data are from Bankscope. However, given that the EBA did not release data on total assets as of June 2012 and that these data are not available in Bankscope either, we have had to estimate this part of the dataset ourselves.
We arrived at this admittedly rough estimate of total assets by assuming that the ratio of risk-weighted assets to total assets was the same in June 2012 as it was in December 2011, and then imputing total assets from the figures for risk-weighted assets given by the EBA. While this may seem a somewhat crude assumption, we would like to stress that – more to the point – it is most likely a conservative assumption. Considering the continuous downward trend of the ratio of risk-weighted to total assets, it is more than difficult to imagine a substantial reversal of that trend over the six-month period in question. In other words, our estimate is more likely to underestimate than overestimate total assets – and hence by implication more likely overestimate than underestimate leverage ratios.
Finally, we arrived at country-level data by aggregating data for all banks that participated in the stress test exercise. Given that this set of banks covered over 65% of the EU banking system’s total assets and at least 50% of the national banking sectors in each of the member states – and also included all the largest banks for each country – we find it reasonable to assume that this procedure provides a good and probably slightly conservative characterization of the European banking sector as a whole.35
Overall results The first question we set out to answer in our critical assessment of the European recapitalization plan was the following: did the recapitalization plan have a significant impact on the leverage ratios of banks in these key Eurozone countries?
Table 9 shows the evolution of CT1 ratios and leverage ratios between December 2011 and June 2012 for the Spanish, German, French and Italian banks that participated in the recapitalization exercise. The results are telling. All but 2 banks in the sample increased
34 Bankscope is a database containing financial information on banks worldwide.35 In general, small banks are unlikely to have lower capital levels than large banks for a number of reasons, including lower competitive pressure on this particular parameter and less reliance on ‘risk-weighted asset-optimization’ strategies.

DIIS REPORT 2013:10
41
Table 9. The failed European recapitalization exercise 36
Source: Bankscope and EBA; http://www.eba.europa.eu/capitalexercise2012/ RECAP_2012_dataset.zip. Spanish Bankia SA and Portuguese Portigon AG are excluded from the table, since both were under restructuring at the time.
36 (*) Estimated using the RWA figure from the EBA and the Total Assets figure from Bankscope. (**) Authors’ estimate.
RWA/ Total
assets�
0.31
0.49
0.30
0.30
0.38
0.36
0.19
0.18
0.25
0.34
0.08
0.29
0.28
0.37
0.20
0.55
0.68
0.45
0.53
0.44
0.67
0.50
0.50
0.70
Bank Name
BNP Paribas
BPCE SA
Crédit Agricole S.A.
Société Générale
Bayerische Landesbank
Commerzbank AG
DekaBank Deutsche Girozentrale
Deutsche Bank AG
DZ Bank AG-Deutsche Zentral-Genossenschaftsbank
HSH Nordbank AG
Hypo Real Estate Holding AG
Landesbank Baden-Wuerttemberg
Landesbank Berlin AG
Norddeutsche Landesbank
WGZ-Bank AG
Banco Bilbao Vizcaya Argentaria SA
Banco Popular Espanol SA
Banco Santander SA
Caja de Ahorros y Pensiones de Barcelona-LA CAIXA
Banca Monte dei Paschi di Siena
Banco Popolare
Intesa Sanpaolo
UniCredit SpA
Unione di Banche Italiane Scpa-UBI Banca
Country
France
France
France
France
Germany
Germany
Germany
Germany
Germany
Germany
Germany
Germany
Germany
Germany
Germany
Spain
Spain
Spain
Spain
Italy
Italy
Italy
Italy
Italy
CT1 ratio
9.6%
9.1%
9.6%
9.0%
9.7%
9.9%
11.0%
9.6%
9.5%
10.3%
24.2%
9.2%
12.3%
7.3%
10.1%
9.4%
7.4%
9.4%
9.2%
9.5%
7.1%
10.2%
8.3%
8.6%
Leverage ratio
3.56%
2.78%
2.48%
3.59%
3.47%
3.79%
2.50%
2.56%
1.85%
3.75%
2.02%
2.85%
1.21%
3.08%
3.06%
6.85%
6.45%
5.77%
6.24%
5.28%
6.08%
7.87%
5.97%
7.90%
CT1 ratio
10.9%
10.0%
10.7%
9.9%
10.3%
12.2%
11.7%
10.2%
11.6%
10.0%
21.6%
9.9%
12.7%
9.5%
10.4%
9.9%
10.3%
9.5%
11.1%
10.8%
10.2%
10.9%
10.4%
10.4%
Increase/de-
crease
+
+
+
+
+
+
+
+
+
-
-
+
+
+
+
+
+
+
+
+
+
+
+
+
Leverage ratio��
3.42%
4.90%
3.25%
2.92%
3.02%
4.09%
2.19%
1.80%
2.84%
3.37%
1.68%
2.85%
3.49%
3.30%
2.07%
5.26%
5.58%
3.79%
5.39%
3.87%
6.88%
5.52%
5.14%
7.28%
Increase/de-
crease
-
+
+
-
-
+
-
-
+
-
-
=
+
+
-
-
-
-
-
-
+
-
-
-
June 2012December 2011

DIIS REPORT 2013:10
42
their CT1 ratio in the period analyzed. On the other hand, when it comes to leverage ratios, only seven of the 24 banks in the sample improved their positions: 16 banks suffered a drop, and one bank did not experience any change. No bank was even remotely close to the 15% leverage ratio recommended in the bank regulation literature – and seven banks were below the modest 3% minimum requirement for equity capital to total assets stipulated by Basel 3 (six of these were German banks and one was French).
These data do not lend themselves easily to as optimistic an assessment as the one given by the EBA in its report. On the contrary, it should give rise to considerable concern that for two out of three banks involved in the European recapitalization exercise the ratio of equity to total assets actually fell.
The core of the problem is in the core of the Eurozone: German and French banksThis somewhat gloomy picture, based on bank-by-bank data, is further reinforced when country-level data are considered. Figure 6 plots the average leverage ratios
Figure 6. Evolution of average leverage ratios for the largest Banks in Spain, Germany, Italy, France and the UK37
Source: authors’ calculations using Bankscope data.
37 For all countries, including the UK; the average is calculated from individual bank data for all banks whose participation in the stress-test was mandatory. The 4 UK banks that participated in the stress tests were Barclays plc, The Royal Bank of Scotland Group plc, Lloyds Banking Group plc and HSBC Holdings plc.
8%
7%
6%
5%
4%
3%
2%
1%
0%2005 2006 2007 2008 2009 2010 2011
IT ES UK FR DE

DIIS REPORT 2013:10
43
by country for the period from 2005 to 2011. As is immediately evident, the banking systems in the four countries analyzed have been severely undercapitalized throughout the period when assessed against the 15% equity capital to total assets benchmark.
What is more surprising perhaps is that German and French banks, which seemed healthier than the Spanish and Italian ones when assessed in terms of risk-weighted capital ratios, fared significantly worse in terms of leverage ratios throughout this period. In fact, while Spanish and Italian banks have consistently been above the Basel recommendation of a 3% leverage ratio, the German and French banking sectors remained below this threshold for most of the period.
To illustrate further the geographical composition of the European undercapitalization of its banks, consider a comparison of average leverage ratios with average Core Tier 1 and average Tier 1 ratios for the same set of banks (Table 10):
38 (*) As reported by Bankscope, 2011-data. Data is missing for 14 banks. (**) This measure of capital adequacy measures Tier 1 capital. That is shareholder funds plus perpetual non cumulative preference shares as a percentage of risk weighted assets and off balance sheet risks measured under the Basel rules (Bankscope definition). The data refers to the same banks included in Figure 6.
Table 10. Average capital adequacy ratios by country for largest banks 38
Source: authors’ calculations using Bankscope data.
Tier 1 Capital/RWAs ��
13.13%
11.17%
12.49%
10.55%
9.86%
Core Tier 1 Capital/RWAs �
9.70%
9.30%
10.63%
9.90%
9.34%
Common Equity/
Total Assets
2.57%
3.10%
5.13%
5.92%
6.62%
Country
Germany
France
UK
Spain
Italy

DIIS REPORT 2013:10
44
German banks have a significantly higher level of capitalization than Spanish, Italian and French banks when Core Tier 1 and Tier 1 ratios are used as a benchmark. But when the benchmark is the leverage ratio, these same German and French Banks are significantly undercapitalized as compared to Italian and Spanish banks. This result is not driven by outliers. None of the German and French banks included in the sample had a leverage ratio above 3.6%, while no Spanish or Italian bank had a leverage ratio below 4.5% or 6.3% respectively.39 In brief, the data make it abundantly clear that, when equity capital to total assets is used instead of data on Core Tier 1 capital to risk-weighted assets, German and French banks are in far deeper trouble than Spanish and Italian banks.40
In sum, our results reveal that the devil really is in the detail: by using capital ratios based on risk-weighted assets, banks characterized by low and precarious levels of capital can be made to look healthy and strong. In fact, Figure 7 illustrates that the
Figure 7. Average Core Tier 1 ratios versus leverage ratios for core Eurozone countries, December 2011
Source: Bankscope and EBA.39 In terms of quantitative analysis, a means-difference test leads us to reject the null hypothesis that the difference in the mean leverage ratio of German and French banks on one hand and Spanish and Italian banks on the other is equal to zero. 40 On average, the levels of leverage of German banks are not much higher than that of Dexia just before it collapsed.
12%
10%
8%
6%
4%
2%
0%
3%
DE FR UK ES IT
Common Equity/Total Assets Core Tier 1 Regulatory Capital Ratio

DIIS REPORT 2013:10
45
cross-country pattern of Core Tier 1 capital data is fundamentally different from that of leverage ratios. All four banking sectors neatly meet the minimum Core Tier 1 capital ratio, with only minor cross-country differences, but when it comes to equity capital to total assets, Spanish and Italian banks have leverage ratios that are (roughly) twice as high as those of Germany and France.
The conclusion is, inevitably, that the Core Tier 1 capital data released by the EBA obscures rather than illuminates relative levels of undercapitalization in the core Eurozone countries.
Discussion: Eurozone compared to US bankingComparing the status of European banking with that of US banking is instructive in several ways (see Figure 8). First, it highlights that European banking operates at levels of equity capital substantially lower than its American peers. Secondly, even five years into the global financial crisis, the largest banks in the three largest
Figure 8. Capitalization Ratios for the Top 5 banks in Selected EU countries and the US
Source: Bankscope data. The data are for the top 5 banks in each country according to total assets.
��
��
��
�
�
�
�
��� �� �� �� �� ��
�������������������������
������������������������
������������������������
�

DIIS REPORT 2013:10
46
Eurozone countries have less than half as much equity capital as is the case for the largest American banks. Dailami and Adams-Kane (2012) analyze loan–deposit ratios and point out that up to 2011 US banks had made significantly more progress in deleveraging than EU banks. Thirdly, the largest banks in Spain and Italy have lost much in terms of equity capital after several years of banking and sovereign debt crisis when compared to the situation before the crisis, but they nevertheless remain well ahead of Germany, France and the UK. Lastly, the Tier 1 capital ratios do little other than obscure and render invisible these important differences and trends.
This comparatively lower equity capital base in the largest European banks is all the more troubling when one takes account of the fact that the economies of these European countries are much more exposed to their banking sectors than are the US economy. Figure 9 shows the total assets of money deposit-taking banks relative to GDP.
Figure 9. Banks assets to GDP for selected countries, 2005-2011
Source: Global Financial Development Database, the World Bank.
���
���
���
���
���
���
���
��
��
��
���
�����
���
����
����
����
������
��
�
���� ���� ���� ���� ���� ����
������
�������������
�����
������
�������
������������
DIIS REPORT 2013:10
47
5. The CRD4: institutionalizing the reluctance to recapitalize?
The Basel 3 agreement is currently being implemented in Europe in the form of a regulation and a directive: a Capital Requirement Regulation (CRR) and a Capital Requirement Directive (CRD), together known as CRD4. The European Commission presented its first proposal for the CRD4 in July 2011, and originally all member states were expected to have adopted the directive into national law by the end of 2012. However, meeting this deadline soon looked unlikely. At a meeting of ECOFIN, the Economic and Financial Affairs Council, in early March 2013, the Council for the European Union officially endorsed a compromise reached in negotiations between the European Parliament and the European Commission. The Council mandated the Permanent Representatives Committee to finalize negotiations with the European Parliament on outstanding technical issues. The final package was passed by the EU Parliament on April 16, 2013 and the CRD4 will take full effect by 1 January 2014, subject to approval by the Council of Ministers.
ControversiesOver the past year, the proposed legislation has been subject to debate and negotiation, both in the European Parliament and in ECOFIN. This reflects the fact that although the Basel 3 accord has been finalized, its adoption into EU law is not set in stone. Since much of Basel 3 has been formulated as a series of minimum requirements, the EU may – at least in principle – decide to adopt stricter rules if it so wishes.
A key controversy has been whether some countries should be allowed to set higher capital requirements than others, in line with the notion that Basel standards are minimum capital requirements, or be explicitly disallowed from doing so, with reference to the principle of having a single European market in financial services. Another important debate has focused on whether the EU legislation should ‘give the leverage ratio a much more central role’ than proposed in the Basel 3 agreement and in the original European Commission proposal (Lannoo 2012, Masters 2012). Thirdly, there has been considerable controversy over the issue of whether Basel 3 restrictions on what can be counted as ‘high-quality capital’ should be adopted rigorously in the CRD4 or whether certain exemptions could be made. Finally, some have argued that the CRD4 should discontinue the practice of allowing government bonds to be classified as ‘risk free’ in calculations of banks’ total risk-weighted assets.

DIIS REPORT 2013:10
48
The CRD4 is a major setback compared to Basel 3Overall, the CRD4 was expected to replicate the Basel 3 agreement substantially: the minimum capital requirement would be the same, and the new capital buffers and the leverage ratio would be adopted more or less as outlined in Basel 3. However, there are substantial deviations from Basel 3, most of which go in the wrong direction and hence render the CRD4 a highly backward step relative to Basel 3.
Diluting the capital definitions of Basel 3 First, the stricter definitions of capital agreed in Basel 3 will most likely be softened in the CRD4 as a result of pressure from German and French banks. More specifically, exceptions have been made for the so-called ‘silent participation’ of German banks and minority stakes of French banks in insurance companies, both of which have somewhat questionable loss-absorbency qualities (Goldstein 2012). It will be difficult to assess this fully before all the technical deals have been negotiated and released.
Watering down the leverage ratioWhereas the Basel 3 agreement stipulates the leverage ratio in terms of the highest quality of capital, namely equity capital, relative to total assets, the CRD4 waters it down by defining it in terms of Tier 1 capital relative to total assets (Council of the EU 2013: 3). This most probably means that the exceptions mentioned above made for German and French banks will count towards meeting the leverage ratio requirement. Note that in specifying its leverage ratio, the CRD4 adopts a capital category that is not only weaker than that of Basel 3, but also weaker than the capital category it used for its 2011 stress test and the recapitalization exercise, namely the Core Tier 1 ratio.
New systemic risk buffersThe CRD4 adopts the capital conservation buffer and the counter-cyclical buffers as specified in the Basel 3 agreement, but replaces the capital surcharge for global systemically important institutions (G-SIBs) with a broader ‘systemic risk buffer’. The systemic risk buffer will be mandatory for G-SIBs but voluntary for other systemically important institutions (O-SIIS). Member states will be able to apply this systemic risk buffer in the range from 1 to 3% of all exposures, and up to 5% for domestic and third-country exposures. This corresponds roughly to the range defined in the FSB capital surcharge for G-SIBs (1-3.5%), but makes possible some further capital tightening with respect to domestic exposures.

DIIS REPORT 2013:10
49
Introducing maximum capital requirements?Fourth, and finally, most likely the CRD4 will effectively entail a de facto ceiling on capital requirements in the Eurozone. The CRD4 will ‘enable members to impose, for up to two years (extendable), stricter macroprudential requirements for domestically authorized financial institutions in order to address increased risks to financial stability’. However, such measures, including capital requirements above the levels stipulated in the CRD4, will be subject to approval by the Council of the European Union.41 It will be difficult for any member state to transgress this line, not least because of the signal this would send to markets and the heavy costs that would be associated with it, both politically in the EU and through higher funding costs in the market. Whereas the capital requirements of the Basel 3 agreements were always minimum requirements – allowing all countries to set their capital requirements at whatever higher levels they wanted – now, in the Eurozone, they seem more and more like maximum capital requirements.
DiscussionA European-wide de facto ceiling on capital ratios is bad news in itself, but all the more so given that it is set at far too low a level relative to what is needed to ensure the resilience of European banking. In more concrete terms, the implications of the new rules are as follows.
The systemic risk buffer can be imposed at different levels for different exposures, but assume for simplicity that banks have significantly higher domestic and third-party exposures than EU exposures, such that the regulator can set the systemic risk buffer close to its maximum level, say, at 4.5%. In this case, an EU member state may impose a systemic risk buffer of 4.5% equity capital relative to risk-weighted assets. This will be in addition to the standard minimum capital requirement of 4.5% equity capital relative to risk-weighted assets which was stipulated in Basel 3 and adopted in CRD4. In other words, the systemic risk buffer allows a member state to raise requirements for equity capital relative to risk-weighted assets from 4.5 to 9%. This corresponds, roughly, to a ratio of equity capital to total assets of 3%.
Obviously the calculation changes if we add to the capital requirement the two additional capital buffers, to be phased in gradually from 2016 to 2019, namely the
41 More specifically, the ‘Council can reject, by qualified majority, stricter national measures proposed by a member state’ (Council of the EU 2013: 3).

DIIS REPORT 2013:10
50
capital conservation buffer (2.5%) and the counter-cyclical buffer (0-2.5%). At their maximum levels these buffers allow an additional 5% of capital to risk-weighted assets, such that the total is 14%. This in turn corresponds to a maximum ratio of equity capital to total assets of less than 5%, far below the 15% ratio recommended in the bank capital regulation literature.
If the CRD4 is adopted in EU legislation along the lines currently discussed, it will make it difficult for any EU member country to recapitalize its banks in a substantive and serious way. By making recapitalization above the levels discussed above contingent on the approval of other member states, these new rules will limit the ability of individual member states to insist that their banks recapitalize on such a scale that capital buffers large enough to ensure solvency even in adverse scenarios may be created. In so doing, it will further institutionalize Europe’s reluctance to recapitalize its banks seriously.

DIIS REPORT 2013:10
51
6. Discussion: The political economy of recapitalization reluctance
On the basis of the analysis presented in this paper, one is bound to wonder why equity capital requirements remain so low, even in the wake of the global financial crisis which had its roots in the US and European banking sectors. Why have regulators not significantly increased equity capital requirements in line with the consensus of leading scholars working on bank capital regulation issues? The answer to this question is twofold. First, bank managers as well as bank shareholders have ‘strong incentives to maintain high leverage for banks and to resist increased equity capital requirements’ (Admati et al. 2011: 56). Secondly, a number of arguments about the detrimental effects of higher equity capital requirements on the real economy in terms of negative impacts on economic growth and increased unemployment have been circulating and seem to have convinced, or at least frightened, politicians sufficiently to cause them not to insist.
In the following, we briefly review some of the key arguments often voiced against the case for imposing higher equity capital requirements on banks, as well as the main responses made to each of these arguments in the bank capital regulation literature.42
Arguments against higher capital requirements and brief rebuttals
Conceptual confusion in the debate about capital requirementsIn debates on higher equity capital requirements, it is often argued that they would be costly to banks and to society at large because they would cause capital to be idle, as opposed to being deployed for productive and profitable purposes. In this regard, it is necessary to point out the difference between capital requirements and liquidity requirements, also known as reserve requirements. There is widespread confusion regarding these two concepts. Acknowledging the difference between the two concepts is crucial for a productive debate about capital regulation. Table 11 briefly summarizes the differences between capital and liquidity requirements, but perhaps the most important point to get across is that capital requirements do not refer to resources that the bank must hold at all times and refrain from using for lending or
42 In so doing, we are drawing extensively on the work of Admati el al. (2011, 2012).

DIIS REPORT 2013:10
52
other business activities. Capital requirements simply specify the proportion of bank funding that should come from equity capital relative to debt and do not in any way imply that capital is somehow ‘idle’.
Equity is expensive for banks, and costs will be passed on to consumersAnother more sophisticated variant of the same argument – that equity is expensive for banks and eventually for society too – holds that banks’ funding costs will increase because equity requires a higher return than debt, and hence increasing the share of the former at the expense of the latter will increase a bank’s total funding costs. The problem with this line of reasoning is that it holds constant the required return on equity, despite the fact that a better capitalized bank will inevitably require a lower return on equity because by definition the risk premium will be lower. Indeed, one of the key theorems of corporate finance, the Modigliani-Miller theorem, implies that ‘an increase in the amount of equity financing lowers the required return on equity in a way that, absent subsidies to bank debt and other frictions, would leave the total funding costs of the bank the same’ (Admati et al. 2011: 18).
Furthermore, increasing the level of equity funding can also work to reduce the banks debt-financing costs. By reducing the risk of the bank’s bankruptcy, the risk to creditors decreases and hence lowers the interest rate on the bank’s debt.
Raising equity is particularly costly in a recessionYet another variation on the theme of equity capital being more expensive for banks than debt is that, when equity prices are declining, the costs of issuing new equity compared to borrowing become very high. This argument refers to situations when
Table 11. Capital vs. liquidity requirements
������������������������������
�����������
�������������
���������������������������������������������������������
����������������������������������������������������
��������������������
���������������
����������������
��������������������������������
���������������������������������
���������������������������������
����������
��������������������
������

DIIS REPORT 2013:10
53
the market value of bank stock is declining relative to its book value. Bankers often argue that it is information asymmetries that create this discrepancy: the market has incomplete information about the value of the bank’s assets. Moreover, issuing equity often unchains a negative reaction in the market, the new equity being read as a sign of bank undercapitalization. Three qualifications should be made, however. First, banks may go a long way in enhancing their capital base without issuing new equity by simply retaining their earnings (Acharya et al. 2011: 10; Admati et al. 2011: 37). Secondly, regulators can mitigate the issuance costs associated with asymmetric information by ‘removing banks’ discretion over payout and issuance decisions’ (ibid.). Thirdly, one should be cautious about assuming that higher levels of equity in banking indicate a scarcity of funds: the current trend is towards ‘capital super-abundance’, not capital scarcity (Bain & Co 2013; Gapper 2013).
The profitability and value of banks will decreaseThe various arguments that a higher level of equity funding would be expensive for banks are often accompanied by the related claim that banks’ profitability will suffer. More specifically, opponents argue that higher equity capital requirements will lower banks’ returns on equity (RoE), which in turn implies a loss of value for the banks. However, the widespread use of RoE as a measure of shareholder value is flawed, as it does not adjust for risk. Once risks are taken into account, shareholder value may very well increase as the bank becomes better capitalized and more resilient. More fundamentally, the focus on RoE is at the core of current problems, not an indicator that should make us hesitate about otherwise sensible policies. Andrew Haldane observes that RoE equals return on assets multiplied by leverage and observes that in the banking industry leverage has long been the driver of RoE, not return on assets (Haldane 2009). Return on assets, he notes, is ‘a measure of management skill in extracting profits from a pool of assets’, whereas ‘leverage is a measure of a gambler’s luck in gearing up those assets’ (ibid.).43
During the golden era, competition simultaneously drove down return on assets and drove up target returns on equity. Caught in this cross-fire, higher leverage became banks’ only means of keeping up with the Jones’s. [They] resorted to the roulette wheel… [W]hen evaluating banks and their management, there is a need for greater focus on returns on assets rather than on equity. Good luck and good management need to be better distinguished. (Haldane 2009: 2)
43 See also the discussion in Engelen et al. (2011).

DIIS REPORT 2013:10
54
Banks will cut back on lending The fear that increasing capital requirements will cause a new credit crunch is no doubt a key factor in explaining why regulators have abstained from adopting proposals to require substantially higher levels of equity capital. Those who argue that banks would have to cut back on lending in the event of higher capital requirements explain it by saying that (a) banks will be constrained by the new capital requirements and/or (b) that the new capital requirements will render unprofitable some loans that were profitable under the highly-leveraged funding scenario. Both these arguments are flawed, however.
First, as depicted in Figure 4, scaling back on loans is only one of three strategies that banks can use to meet higher equity capital requirements. The same deleveraging can be achieved either by ‘substituting equity for some liabilities or by expanding the balance sheet’ (Admati et al. 2011: 43). Secondly, although it is true that highly leveraged banks are likely to make different lending decisions than banks that are better capitalized, the highly leveraged bank is prone to making less socially optimal lending decisions:
First, equity holders in a leveraged bank, and managers working on their behalf or compensated on the basis of ROE, have incentives to make excessively risky investments, and this problem is exacerbated when the debt has government guarantees. Second, when banks are distressed, credit markets can freeze and certain loans will not be made due to a ‘debt overhang’ problem. Valuable loans that are not made as a result of debt overhang would be undertaken if the bank were better capitalized, since in that case the value created by the loans would be captured by those who would fund it. (Admati et al. 2011: 47)
In brief, although it is unclear whether the total lending volume in the economy would decline if banks were required to fund themselves with more equity, it is clear that the loans made would be more valuable because risk would be properly accounted for and because banks would be less likely to reduce their lending because of problems of debt overhang.
Banking activity will migrate to the shadow banking sectorAn argument often heard is that higher equity capital requirements will defeat the purpose because a much larger share of banking will then migrate to the (unregulated) shadow banking system. The key role and amplifying effect of the collapse of a number of shadow banking institutions in the early days of the global financial

DIIS REPORT 2013:10
55
crisis is frequently evoked to support this case further; the last thing we want, the argument goes, is again to cause a ballooning of the shadow banking system because of ill-designed regulation of the banking sector. However, there wasn’t then and isn’t today anything that prevents regulators from interfering with (and regulating) the phenomenon of shadow banking. ‘The fact that regulators saw fit not to interfere, raises questions about the political economy of financial regulation in the past decade, but not about the ability of regulation in principle to prevent or limit regulatory arbitrage’ (Admati et al. 2011: 60).
International competitiveness will decreaseA final argument often made is an application of the general argument made against a whole range of potential regulations and across a range of policy areas, namely that a given regulation will cause a given industry in a given country to lose its ability to compete internationally, with substantial costs incurred in terms of jobs lost, export revenues forgone etc. At the end of the day, this argument hinges on the first two issues raised above, which both boil down to the mistaken idea that higher equity capital is somehow costly to banks. In addition to the general rejection of the idea that equity increases banks’ funding costs, one should take into account the fact that significantly higher equity capital will reduce the need for implicit government guarantees and taxpayer bailouts, thus helping to align banking incentives better with market fundamentals.
Policy optionsOf course, a key issue when considering policy options is to appreciate why equity recapitalization is not favored by banking management. The answer to this question is twofold. First, typically the compensation schemes of bank managers are closely linked to how well the bank performs in terms of returns on equity, giving bank managers a strong financial interest in opposing higher equity requirements. Secondly, in most countries banks enjoy implicit government subsidies in terms of tax reductions for debt financing. Increased equity capital requirements will reduce the size of the tax deduction a bank can obtain through debt funding (as opposed to equity funding). In terms of the Modigliani-Miller theorem, the practice of the government subsidizing debt financing through the tax system is the distortion that makes equity capital de facto more expensive than debt funding.
This point leads directly to the first and most important policy recommendation, which is to change tax rules for banks so as to eliminate the government subsidy of

DIIS REPORT 2013:10
56
debt funding, thereby also eliminating the implicit encouragement of high leverage. Such new tax rules for banks could be accompanied by reduced corporate tax rates for them so as to compensate for the lost tax deductions.
A second important policy option is to change remuneration practices for bank managers. Here the issue is not so much whether bonuses are paid or not, but what the central performance evaluation criteria are. Basing bank compensation and bonuses on return on assets criteria, instead of on return on equity criteria, would be much healthier, both for the banks and the economies in which they operate.
DIIS REPORT 2013:10
57
7. Concluding remarks
This paper has reviewed the European banking recapitalization exercise of 2011-2012. Since spring 2011, the EBA has conducted three capitalization assessments: a stress test exercise to tests bank’s resilience to an adverse macroeconomic shock, a monitoring exercise to assess bank’s capitalization in terms of the recently agreed international standards (Basel 3), and a recapitalization exercise undertaken in collaboration with banks and in consultation with national regulators. The culmination of this process was the singling out of 27 banks that were required to raise a total of 76 bn euros between September 2011 and June 2012. When publishing the results of the recapitalization exercise in October 2012, the EBA reported that European banking had been successfully recapitalized and was now in a much stronger position, with a much strengthened capital base and overall resilience.
Our analysis must give rise to considerable skepticism with regard this conclusion. From the stress tests in 2011 to the recapitalization in 2012, the EBA relied more or less exclusively on capital data relative to risk-weighted assets and did not specify the requirements for minimum levels of equity capital funding. The literature on bank capital regulation regards the leverage ratio – equity capital to total assets – as a much more reliable indicator of banks’ soundness and resilience than ratios based on broader measures of capital measured relative to risk-weighted assets. Therefore, throughout the paper we compare the results of the various assessments reported by the EBA with data for leverage ratios, defined as the ratio of equity capital to total assets.
In terms of bank-by-bank data, we find that in many instances the recapitalization exercise in fact did not recapitalize a given bank when measured by the ratio of equity capital to total assets. Only seven out of 24 banks examined improved their leverage ratios, whereas 16 banks worsened their capital positions. In opposition to the EBA’s positive assessment of the results of the recapitalization exercise, we find strong reasons for concern about the resilience of European banking.
Our finding that equity capital levels in European banking are far below the 15% of total assets recommended by scholars (Admati et al. 2010) is troubling but not surprising. What is surprising, however, is that large parts of European banking are undercapitalized even when the Basel 3 minimum requirement of 3% equity capital to total assets is used as benchmark, despite the fact that this threshold is itself widely considered to be far too low.
DIIS REPORT 2013:10
58
This leads to the next key finding of the report – which may come as a surprise to many: the least well-capitalized banking sector among the larger Eurozone countries is not Spain or Italy, but Germany, closely followed by France. The banking sectors of Spain and Italy have equity to total asset ratios roughly double the size of those of Germany and France.
All in all, our results reveal that the devil really is in the detail and that by using ratios based on broader measures of capital than equity and measuring them relative to risk-weighted assets instead of relative to total assets, the EBA has obscured rather than illuminated the capitalization of European banks. The continued reliance on ratios of Core Tier capital relative to risk-weighted assets allows banks characterized by low and precarious levels of capital to appear healthy and strong. Little is achieved by this other than keeping a game going which will eventually come to an end, namely the game of avoiding a serious recapitalization of Europe’s banks.
Unfortunately, this ‘recapitalization reluctance’ has also shaped the European adoption of Basel 3. The flawed and reluctant European approach to bank capital regulation is now resulting in a European ceiling on bank capital requirements as part of a larger compromise on the fourth European Capital Requirement Directive, which is currently in the final stages of being adopted in EU legislation. If a ceiling on bank capital is indeed adopted in EU legislation at roughly the levels reported from the negotiations, it will make it more than difficult for any EU country to require its banks to have equity capital in excess of 6% of total assets. In this way, Europe is about to turn its reluctance to recapitalize its banks in to an institutionalized commitment to undercapitalized banking in a most unfortunate manner.
The European reluctance to restructure and recapitalize is costly for Europe in many ways. As Europe’s policymakers fail to deal adequately with its banking crisis, European banking is experiencing increasing problems in maintaining international competitiveness. Thus, as European banking limps along on the brink of insolvency, American banks and banks of the largest emerging economies are increasing their share of the global market at the expense of the Europeans (Dailami et al. 2012).
Of course, the difficulties that European banking experiences in retaining competitiveness globally is a complex phenomenon with multiple causes. The point we are making here is merely that weak capitalization and continuous existence on the brink of insolvency is of no advantage to European banks in their efforts to compete in global banking markets. Indeed, much of the Western critique of Japan
DIIS REPORT 2013:10
59
for not restructuring and reforming its banking sector after its financial crisis in the early 1990s may be said to apply to the European situation today: problems are dealt with only superficially and in mainly cosmetic ways, and as time passes the situation only gets worse.
In addition to gradual losses of market shares and subsequent economic losses for individual domestic banking sectors, the absence of a substantial recapitalization of Europe’s banks poses a significant systemic risk: a full-blown European banking crisis is likely to have enormous private and social costs for all European countries, not to mention global repercussions.
DIIS REPORT 2013:10
60
Annex A. International bank capital regulation
The so-called Basel standards of banking regulation are developed by the Basel Committee, named after the Swiss city that hosts its secretariat within the Bank of International Settlements. The Basel Committee was established in 1974 by the Central Bank governors of the G-10 countries in response to turbulence in international currency markets following the breakdown of the Bretton Woods system in the early 1970s.
At first, the main overall objective of the Committee was to ensure that no bank operating internationally could escape adequate supervision, but in the course of the 1980s the question of capital requirements became increasingly central to international deliberations on banking regulation and has remained so ever since.
The first Basel accord, known as Basel 1, was agreed in 1988. The capital requirements of Basel 1 focused exclusively on the type of risk considered particularly important for banks, namely credit risk, or the risk of a debtor defaulting on his loan. Banks were required to reserve capital of at least 8% of their risk-weighted assets. This reserved capital had to include core capital – Tier 1 capital – of at least 50%. The risk weighting of assets was a way to make capital requirements sensitive to the different levels of risk associated with different types of assets. Basel 1 introduced five categories of risk, so-called risk-buckets, each carrying a weight of 0, 10, 20, 50 or 100%. Cash and OECD government bonds, for example, had a 0% risk weighting and did not require a capital reserve, while traditional corporate loans had a 100% risk weighting and required the full 8% in reserve.
In the beginning of the 1990s, as the financial institutions began to expand their businesses into new geographical and economic spaces, Basel 1 came to be seen as too crude. The realities of the financial sector were thought to have outdated the Basel 1 accord (Alexander et al. 2006: 38). Two main problems were identified. First, the crudeness of the ‘risk-bucket approach’ inadvertently incentivized high-risk investment behavior. The same risk weighting applied to all corporate loans, for example, and this created incentives for banks to invest in the most risky assets, which did not require a higher capital reserve but produced a higher yield. Secondly, Basel 1 was criticized for its exclusive focus on credit risk. Why focus so narrowly on credit risk when banks were increasingly active in capital markets and thus were becoming more and

DIIS REPORT 2013:10
61
more exposed to market risk, that is, to the risk of losses in a portfolio due to movements in market prices?
In parallel, the notion was spreading in the banking sector, and amongst regulators and policy-makers, that governments were not well equipped to regulate banks. Given the increasing complexity and sophistication of risk management in large banks, many saw it as preferable to rely as much as possible on bank self-regulation. Alan Greenspan, for instance, then Chairman of the Federal Reserve, asserted that banks as well as other financial institutions would have to be increasingly self-regulated ‘largely because government regulators cannot do that job’ (cited in Tarullo 2008: 15-16).
The first major step in the direction of increased bank self-regulation was taken in 1996 with the Market Risk Amendment to the Basel 1 agreement, which introduced capital requirements for market risk. Banks were permitted to use their internal quantitative risk management models to produce estimates of their so-called value-at-risk as a basis for measuring their market risk capital requirements. Soon after the implementation of the Market Risk Amendment, however, along with a couple of other amendments, it was decided that a more radical revision of Basel 1 was necessary. An important impetus for this contention came from the financial crisis in Asia in 1997-1998 and the near-collapse of the US-based Long-Term Capital Management hedge fund in the immediate wake of the Asian crisis. In June 1999, the Basel Committee released the first set of proposals for a new framework for banking regulation. In June 2004, after five years of negotiations, consultations and impact studies, the Basel 2 accord was published.
First, the Basel 2 agreement introduced a three-pillar regulatory framework. Secondly, a differentiated approach was introduced, by which several distinct approaches for the calculation of capital reserve requirements are sanctioned for the same type of risk.
The three pillars of the Basel 2 accord are (i) minimum capital requirements; (ii) guidelines on regulatory intervention by national supervisors; and (iii) guidelines on disclosure standards for banks. The gradual integration of market risk which began with the market risk amendment in 1996 was completed with the full integration of market risk in Pillar 1. Further, the Basel 2 accord integrates a third type of risk, operational risk – the risk of losses resulting from inadequate

DIIS REPORT 2013:10
62
or failed internal processes, people and systems, or from external events (Power 2005) – in its core provisions defined in Pillar 1 While credit, market and operational risk were now addressed in and through the capital requirements of Pillar 1, a host of other risks – including reputational risk, liquidity risk, pension risk, systemic risk and concentration risk – were relegated to Pillar 2 and hence rendered non-binding.
The required amount of capital that banks had to put aside under Basel 2 was maintained at 8% of their risk-weighted assets. One might therefore have the impression that, with respect to minimal capital requirements, the Basel 2 accord resulted in little substantial change. The methodologies promoted for the calculation of capital reserves changed the capital adequacy practices of banks rather significantly, however. The new methodologies aimed to make capital adequacy requirements as ‘risk-sensitive’ as possible; that is, to enable banks to put aside an amount of capital that reflected as accurately as possible the specific risk characteristics of their portfolios. The new methodologies constituted an appealing improvement not only from the perspective of the banks, who stood to enhance their profitability, but also from the perspective of the politicians, who envisioned increased economic growth through more efficient resource allocation and enhanced credit creation.
The Basel 3 agreement was drafted and negotiated in response to the global financial crisis and was endorsed by G20 Leaders at their summit in Seoul in November 2010. Overall, two main trends mark the evolution of the Basel standards: an increasing ‘sophistication’ of the risk-weighting approach, and a continuous expansion or the types of risk covered by the Basel capital regulation framework:
Table 12. From Basel 1 to Basel 3
�������
����������������������������������������������������
������
���������������������������������
�������
����������������������������������������������������
������
���������������������������������
�������
�����������������������������
���������
�����������
�����������������������
���������������������������

DIIS REPORT 2013:10
63
The Basel 3 agreement on bank capital regulation The capital bases of many banks were insufficient to absorb the losses incurred in the course of the global financial crisis. In response to this, the Basel Committee raised minimum capital requirements, adopted stricter definitions of different categories of capital, enhanced risk coverage and introduced two new capital buffers, two liquidity ratios and a leverage ratio.44
Minimum capital requirementsThe minimum capital requirement of Basel 3 remains at an aggregate 8% of risk-weighted assets, as in Basel 1 and 2. However, the new agreement strengthens the requirements in terms of the quality of capital. Capital is divided into two categories: Tier 1 and Tier 2 Capital, the former being comprised of higher quality types of capital than the latter. Tier 1 Capital is split into two sub-categories: Common Equity (CET1) and Additional Tier 1 Capital (AT1), the former being regarded as the more loss-absorbing form of capital.
The two main changes are that Tier 1 capital as a share of total capital is raised from 50% to 75% (from 4 out of 8% to 6 out 8%) and that the share of common equity in Tier 1 capital is also raised from 50% to 75% (from 2 out of 4% to 4.5 out of 6%). The requirement for common equity, as a share of total capital requirements, has been more than doubled, from 25% to 56% (from 2 out of 8% to 4.5 out of 8%):
Table 13. Capital requirements (%), Basel 2 vs. Basel 3
44 The two liquidity ratios introduced with Basel 3, the Liquidity Coverage Ratio (LCR) and the Net Stable Funding Ratio (NFSR), focus on short-term (one-month) and longer term (one-year) liquidity, respectively. These Basel 3 provisions for liquidity are beyond the scope of this report.
�������
��������������������������������������������������������
������
���������������������
�������
��
�
�
�
�������
������
�
�
�

DIIS REPORT 2013:10
64
The new capital buffers and the leverage ratioBasel 3 introduces three new capital buffers: the capital conservation buffer, the counter-cyclical buffer and a capital surcharge for Global Systemically Important Banks (G-SIBs).45 The objective of the capital conservation buffer is to help avoid a situation where banks need an injection of public funds, whereas the counter-cyclical buffer is intended to moderate the supply of credit by banks over the economic cycle. As an addendum to the Basel 3 agreement, a special capital surcharge for G-SIBs has been launched, in recognition of the fact that the policy measures of the Basel 3 agreement are not ‘sufficient to address the negative externalities’ posed by global systemically important banks, nor ‘adequate to protect the system from the wider spill-over risks of G-SIBs’ (BCBS 2011c: 1).
Excessive leverage by banks is widely seen as having been a key contributing factor to the global financial crisis. As noted by the Basel Committee, in many cases ‘banks built up excessive leverage while still showing strong risk based capital ratios’ (BCBS 2010: 61). Capital ratios had not been a binding constraint on leverage. Against this background, the leverage ratio was introduced as a non-risk weighted backstop measure to constrain leverage in the banking sector.46
45 Formally, the G-SIBs surcharge was proposed by the Financial Stability Board, not by the Basel Committee, but for reasons of simplicity it is discussed here as part of the Basel 3 package.46 Leverage ratios had been in place for many years in the US and Canada, but not in Europe. The inclusion of a leverage ratio in the Basel 3 agreement was achieved only after heated debate and considerable controversy.47 All capital requirements in the table, except the leverage ratio, represent capital relative to risk-weighted assets. The leverage ratio is equity capital to total assets.
Table 14. The main elements of the Basel 3 agreement 47
������������������������������������������������
�����������������������������
������������������������������
��������������
�����������������
���������
��������������������������������������������
����
������
��
������
����������������
��������������������
��������������������
������������������������������������������������
��������������������
���������������������
�����
���������
���������
���������
����
���������

DIIS REPORT 2013:10
65
The Basel 3 accord stipulated that these new regulatory instruments were to be gradually phased in, with deadlines varying from 2015 to 2019. Table 14 summarizes the main features of each of the instruments in terms of ratios, types of capital eligible and implementation schedules.
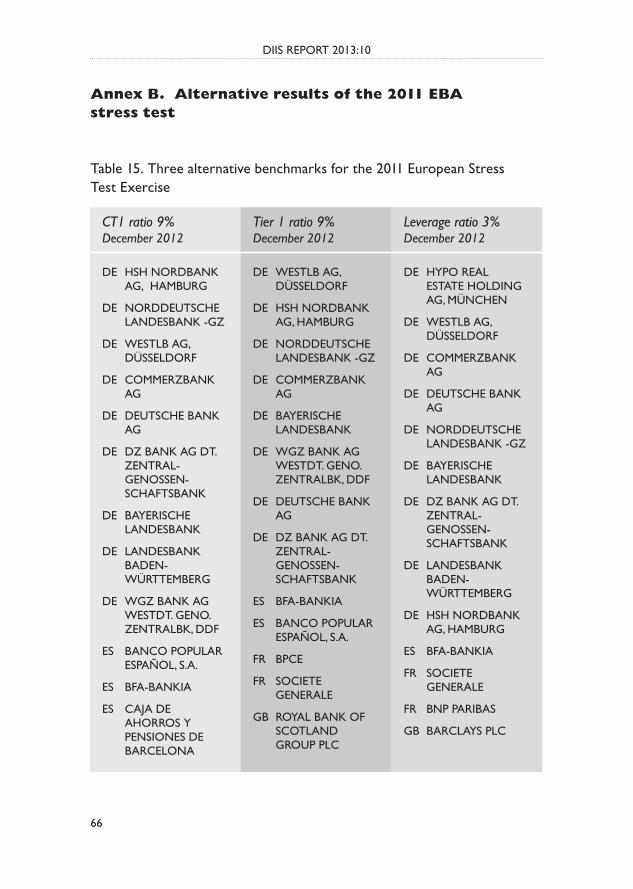
DIIS REPORT 2013:10
66
Annex B. Alternative results of the 2011 EBA stress test
Table 15. Three alternative benchmarks for the 2011 European Stress Test Exercise
��������������������������
�����������������������������
��������������������������������
��� ��������������� ������������
��� ��������������� ��������������
��� ������������ �� ����������
��� �������������� ��
��� ���������������� ��
��� ����������������� ��������� �� ���������� �� �����������
��� �������������� ����������
��� ������������� ������� �� �����������
��� �������������� ���������������� ��������������
��� ���������������� �������������
��� ����������
��� ��������� ������������� ��������������� ���������
��� ������������ �� ����������
��� ��������������� �����������
��� ��������������� ��������������
��� �������������� ��
��� �������������� ����������
��� �������������� ���������������� ��������������
��� ���������������� ��
��� ����������������� ��������� �� ���������� �� �����������
��� ����������
��� ���������������� �������������
��� ����
��� ��������� �� ��������
��� ���������������� ���������� �� ���������
��� ����������� �� ����������������� �����������
��� ������������ �� ����������
��� �������������� ��
��� ���������������� ��
��� ��������������� ��������������
��� �������������� ����������
��� ����������������� ��������� �� ���������� �� �����������
��� ������������� ������� �� �����������
��� ��������������� �����������
��� ����������
��� ��������� �� ��������
��� �����������
��� ������������
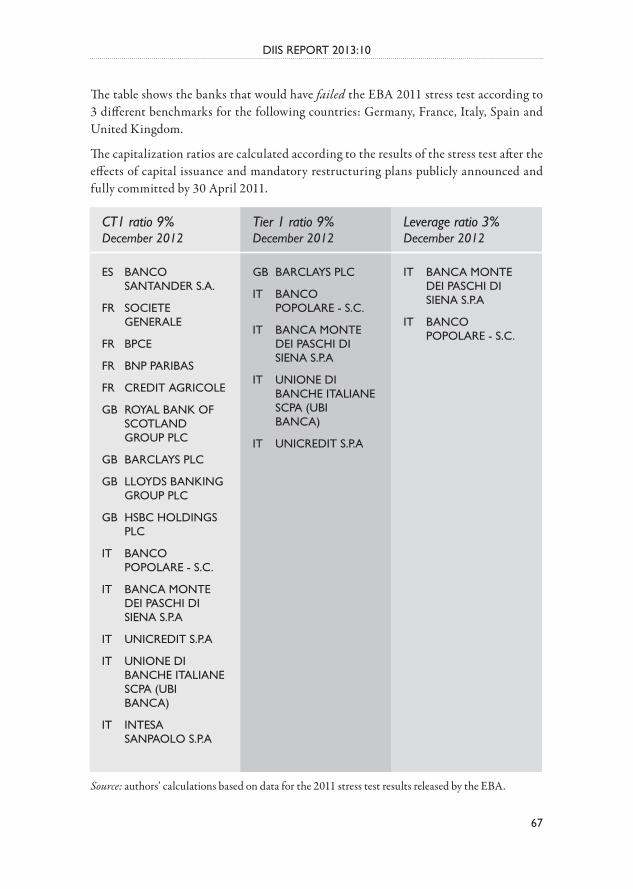
DIIS REPORT 2013:10
67
Source: authors’ calculations based on data for the 2011 stress test results released by the EBA.
The table shows the banks that would have failed the EBA 2011 stress test according to 3 different benchmarks for the following countries: Germany, France, Italy, Spain and United Kingdom.
The capitalization ratios are calculated according to the results of the stress test after the effects of capital issuance and mandatory restructuring plans publicly announced and fully committed by 30 April 2011.
��������������������������
�����������������������������
��������������������������������
��� ������� �� ��������������
��� ��������� �� ��������
��� ����
��� �����������
��� ���������������
��� ���������������� ���������� �� ���������
��� ������������
��� ����������������� ���������
��� ���������������� ���
��� ������� ���������������
��� �������������� ���������������� �����������
��� ���������������
��� ����������� �� ������������������ ����������� �� ������
��� �������� �� ��������������
��� ������������
��� ������� ���������������
��� �������������� ���������������� �����������
��� ����������� �� ������������������ ����������� �� ������
��� ���������������
��� �������������� ���������������� �����������
��� ������� ���������������

DIIS REPORT 2013:10
68
Bibliography
Acharya, V., Mehran, H., Schuermann, T. and Thakor, A. 2012. ‘Robust Capital Regulation’. CEPR Discussion Paper no. 8792. London, Centre for Economic Policy Research.
Admati, A. R., and Hellwig, M. (2013). The Bankers’ New Clothes: What’s Wrong With Banking and What to Do About It. Princeton: Princeton University Press.
Admati, A. R., DeMarzo, P., Hellwig, M.F., Pfeiderer, P. (2011). Fallacies, irrel-evant facts, and myths in the discussion of capital regulation: why bank equity is not expensive. Stanford GSB Research Paper No. 2063, Stanford: Stanford Graduate School of Business.
Admati, A., DeMarzo, P., Hellwig, M., & Pfleiderer, P. (2012). Debt overhang and capital regulation.
Admati, A., et al. (2010) Healthy Banking System is the Goal, not Profitable Banks. Letter published in Financial Times, November 9, 2010.
Alexander, K., Dhumale, R., and Eatwell, J. (2005). Global governance of financial systems: the international regulation of systemic risk. Oxford University Press, USA.
Bain & Co. (2012). A world awash in money: Capital trends through 2020. http://www.bain.com/Images/BAIN_REPORT_A_world_awash_in_money.pdf
Basel Committee on Banking Supervision (BCBS) (2010). Basel III: A global regu-latory framework for more resilient banks and banking systems. Original version, December 2010. Bank of International Settlements, Basel.
Basel Committee on Banking Supervision (BCBS) (2011c). Global systemically important banks: assessment methodology and the additional loss absorbsency re-quirement. Bank of International Settlements, Basel.
Basel Committee on Banking Supervision (BCBS) (2013) Regulatory consistency assessment programme (RCAP) – Analysis of risk-weighted assets for market risk. January 2013. Bank of International Settlements, Basel.
Bisio, P, Jurcevic, D., and Quagliriello, M. (2011). A short guide to the EBA’s re-capitalization results. VOX, 21 December 2011.
Blundell-Wignall, A., and Atkinson, P. (2010). Thinking Beyond Basel III: Nec-essary solutions for capital and liquidity. OECD Journal: Financial Market Trends, 2010(1), 5-6.
Blundell-Wignall, A., and Roulet, C. (2012). Business Models of Banks, Leverage and the Distance-to-Default. Financial Market Trends, 2012, 2.
DIIS REPORT 2013:10
69
Brealey, R. (2006). Basel II: The Route Ahead or Cul-de-Sac? Journal of Applied Corporate Finance, 18(4), 34-43.
Council of the European Union. (2013). Bank capital rules: Council endorses agreement with EP. Press Release. 5 march 2013
Dailami, M. (2012). Looking beyond the Euro area sovereign debt crisis. Economic Premise, No. 76, The World Bank.
Dailami, M. and Adams-Kane, J. (2012). What does the future hold for the Inter-national Banking System? Economic Premise, No. 94, The World Bank.
Das, S. and Sy, A.N.R. (2012). How Risky are Banks’ Risk Weighted Assets? Evi-dence from the Financial Crisis. IMF Working Papers No. 12/36, January.
Demirgüç-Kunt, A., Detragiache, E. and Merrouche, O. (2010). Bank Capital: Lessons from the Financial Crisis. IMF Working Papers, pp. 1-35, December.
Ecofin Presidency and EBA (2011), ‘Joint statement by the Presidency of the ECOFIN Council and the EBA’. http://www.eba.europa.eu/capitalexer-cise/2011%2012%2008-ECOFIN-EBA-Statement%20FINALv2.pdf
Engelen, E., Ertürk, I., Froud, J., Johal, S., Leaver, A., Moran, M., Nilsson, A., and Williams, K. (2011). After the great complacency: Financial crisis and the poli-tics of reform. OUP Oxford.
European Banking Authority. (2011a). 2011 EU-Wide Stress Test: Methodological Note - Additional guidance. 9 June 2011.
European Banking Authority. (2011b). 2011 EU-Wide Stress Test: Aggregate Re-port. 15 July 2011.
European Banking Authority. (2011c). Capital buffers for addressing market con-cerns over sovereign exposures. Methodological Note. 8 December 2011.
European Banking Authority. (2012a). Results of the Basel III monitoring exercise based on data as of 31 December 2011. September 2012.
European Banking Authority. (2012b). Final report on the implementation of Capital Plans following the EBA’s 2011 Recommendation on the creation of temporary capital buffers to restore market confidence. October 2012.
European Banking Authority. (2012c). EBA publishes final report on the recapital-isation of European banks and paves the way for the transition to the CRDIV framework. Press Release. 3 October 2012.
European Central Bank. (2011). Macroeconomic adverse scenario for the 2011 EU-wide stress-test: specification and results. 18 March 2011.
Financial Times (2011). Lagarde calls for urgent action on banks. FT. August 27, 2011
Financial Times (2013). Basel eyes set periods for banks’ risk models. FT. February 17, 2013.
DIIS REPORT 2013:10
70
Gapper, J. (2013). Wave of money eludes the real economy. Financial Times, 8 Feb-ruary 2013.
Goldstein, M. (2012). Stop coddling Europe’s banks. VOX, 11 January 2012.Goodhart, C. (2010), ‘How Should We Regulate the Financial Sector?’ Chapter 5
of The Future of Finance, LSE. Haldane, A. (2009). Small lessons from a big crisis. Remarks at the Federal Reserve
Bank of Chicago 45th Annual Conference ‘Reforming Financial Regulation’ 8 May 2009.
Haldane, A. (2011). Control rights (and wrongs). Wincott Annual Memorial Lec-ture, 24 October 2011, Westminster, London.
Haldane, A. G. (2012, August). The dog and the frisbee. In Federal Reserve Bank of Kansas City’s 36th Economic Policy Symposium,’The Changing Policy Land-scape’, Jackson Hole, WY (Vol. 31).
Hanson, S. G., Kashyap, A. K., and Stein, J. C. (2011). A macroprudential approach to financial regulation. The Journal of Economic Perspectives, 25(1), 3-28.
Harrison, I. (2004), ‘Banks, Capital and Regulation: Towards an Optimal Capi-tal Regime for a Small Open Economy,’ Working Paper, Reserve Bank of New Zealand.
Hellwig, M. (2010). Capital regulation after the crisis: Business as usual?. Max Planck Inst. for Research on Collective Goods.
IMF (2010). Global Financial Stability Report, April 2010. International Monetary Fund, Washington D.C.
IMF (2012). Global Financial Stability Report, April 2012: The Quest for Lasting Stability. International Monetary Fund, Washington D.C.
Jenkins, P. (2011) Europe stress tests undermined by indecision. Financial Times, 18 July 2011.
Lagarde, C. (2011) Global Risks Are Rising, But There Is a Path to Recovery. Remarks at Jackson Hole, August 27, 2011. http://www.imf.org/external/np/speeches/2011/082711.htm
Lannoo, K. (2012). Europe needs to flex its muscles with banks. Financial Times, 30 January 2012.
Linklaters (2011). CRD IV: the European response to Basel III and the impact on tier 1 and tier 2 bank capital. London.
Mariathasan, M., and Merrouche, O. (2012). The Manipulation of Basel Risk-Weights. Evidence from 2007-10. Department of Economics Discussion Paper Series No. 621. Oxford University.
Masters, B. (2012). Leverage cap has the power to reshape banking. Financial Times, 13 February 2012.
DIIS REPORT 2013:10
71
Miles, D., Yang, J., and Marcheggiano, G. (2012). Optimal Bank Capital*. The Eco-nomic Journal.
Onado, M. (2011). European stress tests: Good or bad news? VOX EU, 16 August 2011
Ozgercin, K. (2012). Seeing like the BIS on Capital Rules: Institutionalising Self-regulation in Global Finance. New Political Economy, 17(1), 97-116.
Pollack, L. (2012). Basel 3 study demonstrates impact of getting rid of BS capital. Financial Times Alphaville. 17 April 2012.
Power, M. (2005). The invention of operational risk. Review of International Politi-cal Economy, 12(4), 577-599.
Slovik, P. (2011). Systemically important banks and capital regulations challenges. OECD Economics Department Working Papers, No. 916. Paris: Organization of Economic Corporation and Development.
Tarullo, D. K. (2008). Banking on Basel: the future of international financial regu-lation. Peterson Institute for International Economics. Washington D.C.
Turner, A. (2010). What do banks do? Why do credit booms and busts occur and what can public policy do about it? The Future of Finance, 5
Young, K. L. (2012). ‘Transnational regulatory capture? An empirical examination of the transnational lobbying of the Basel Committee on Banking Supervision.’ Review of International Political Economy 19(4): 663-688.

DIIS REPORT 2013:10
72