Behaviour of Thin G550 Sheet Steel Bolted Connections
19
Missouri University of Science and Technology Missouri University of Science and Technology Scholars' Mine Scholars' Mine International Specialty Conference on Cold- Formed Steel Structures (1998) - 14th International Specialty Conference on Cold-Formed Steel Structures Oct 15th, 12:00 AM Behaviour of Thin G550 Sheet Steel Bolted Connections Behaviour of Thin G550 Sheet Steel Bolted Connections Colin A. Rogers Gregory J. Hancock Follow this and additional works at: https://scholarsmine.mst.edu/isccss Part of the Structural Engineering Commons Recommended Citation Recommended Citation Rogers, Colin A. and Hancock, Gregory J., "Behaviour of Thin G550 Sheet Steel Bolted Connections" (1998). International Specialty Conference on Cold-Formed Steel Structures. 1. https://scholarsmine.mst.edu/isccss/14iccfsss/14iccfsss-session10/1 This Article - Conference proceedings is brought to you for free and open access by Scholars' Mine. It has been accepted for inclusion in International Specialty Conference on Cold-Formed Steel Structures by an authorized administrator of Scholars' Mine. This work is protected by U. S. Copyright Law. Unauthorized use including reproduction for redistribution requires the permission of the copyright holder. For more information, please contact [email protected].
Transcript of Behaviour of Thin G550 Sheet Steel Bolted Connections
Missouri University of Science and Technology Missouri University of Science and Technology
Scholars' Mine Scholars' Mine
International Specialty Conference on Cold-Formed Steel Structures
(1998) - 14th International Specialty Conference on Cold-Formed Steel Structures
Oct 15th, 12:00 AM
Behaviour of Thin G550 Sheet Steel Bolted Connections Behaviour of Thin G550 Sheet Steel Bolted Connections
Colin A. Rogers
Gregory J. Hancock
Follow this and additional works at: https://scholarsmine.mst.edu/isccss
Part of the Structural Engineering Commons
Recommended Citation Recommended Citation Rogers, Colin A. and Hancock, Gregory J., "Behaviour of Thin G550 Sheet Steel Bolted Connections" (1998). International Specialty Conference on Cold-Formed Steel Structures. 1. https://scholarsmine.mst.edu/isccss/14iccfsss/14iccfsss-session10/1
This Article - Conference proceedings is brought to you for free and open access by Scholars' Mine. It has been accepted for inclusion in International Specialty Conference on Cold-Formed Steel Structures by an authorized administrator of Scholars' Mine. This work is protected by U. S. Copyright Law. Unauthorized use including reproduction for redistribution requires the permission of the copyright holder. For more information, please contact [email protected].
Fourteenth International Specialty Conference on Cold-Fonned Steel Structures St. Louis, Missouri U.S.A., October 15-16, 1998
BEHAVIOUR OF TmN G550 SHEET STEEL BOLTED CONNECTIONS
Colin A. Rogers! and Gregory J. Hancock2
SUMMARY
This paper provides a summary of results detailing the behaviour of bolted connections tested in shear, which were composed of 0.42 mm G550, 0.60 mm G550 and 0.60 mm G300 sheet steels (to the 1993 Australian Standard AS 1397). Recommendations concerning the adequacy of current design standards with respect to the design of thin sheet steel bolted connections are made, along with the calibration of applicable limit states resistance equations for the three observed modes of failure; end pull-out, bearing, and net section fracture.
1 INTRODUCTION
Cold fonned structural members are fabricated from sheet steels consisting of various material properties which must meet the requirements prescribed in applicable national design standards. The Australian / New Zealand Standard for cold-fonned steel structures ASINZS 4600 (SAlSNZ, 1996) allows for the use of thin (t < 0.9 mm (0.0354 in)), high strength (fy = 550 MPa (79.8 ksi)) sheet steels in all structural sections. However, due to the low ductility exhibited by sheet steels which are cold reduced to thickness, the engineer must use a yield stress and ultimate strength reduced to 75% of the minimum specified values. The American Iron and Steel Institute (AISI) Design Specification (AISl, 1997a) further limits the use of thin, high strength steels to roofing, siding and floor decking panels. Sheet steels are required to have a minimum elongation capability to ensure that members and connections can undergo small displacements without a loss in structural perfonnance, and to reduce the harmful effects of stress concentrations. The ductility criterion specified in the Australian / New Zealand and North American Design Standards (CSA, 1994; AISl, 1997a) is based on an investigation of sheet steels by Dhalla and Winter (1974a, b) which did not include the thin, high strength G550 sheet steels available today.
This paper reports on the testing of mainly concentrically loaded, single lap bolted shear connections fabricated from G550 and G300 sheet steels (see AS 1397 (1993)), as well as the calibration of applicable limit states resistance equations for use in cold formed steel design standards. Sheet steels which range in base metal thickness from 0.42-0.60 mm (0.0165-0.0236 in) were tested where specimen size and shape, as well as type and number of bolts, were varied to cause three distinct modes of failure; end pull-out, bearing, and net section fracture. Test specimens were milled from the longitudinal, transverse,. and diagonal directions of the sheet to determine the degree of anisotropy and its effect on connection resistance and failure type. Information obtained from Rogers and Hancock (1996, 1997b) on the tensile testing and elongation measurements of G550 sheet steels was used to aid in the analysis and calibration of connection resistance equations for use in limit states tensile design. A more detailed description of the results summarised in this paper can be found in Rogers and Hancock (1997 a).
I Ph.D. Res. Student, Dept. of Civ. Engrg., Univ. of Sydney, Australia. 2 BHP Steel Prof. of Steel Struct., Dept. ofCiv. Engrg., Univ. of Sydney, Australia.
531
532
2 COLD FORMED STEEL BOLTED CONNECTION DESIGN PROVISIONS
An overview of the design equations used for the prediction of connection resistance is provided in this section. Full details of the requirements contained in the Australian / New Zealand (SAlSNZ, 1996), North American (CSA, 1994; AlSl, 1997a) and European (Eurocode, 1996) Design Standards can be found in Rogers and Hancock (1997a).
The nominal cross-section tension resistance of a member which is not subject to shear lag and fails by material yielding of the gross cross-section is formulated for all of the design standards, except for the AlSI Specification (l997a), as follows,
Nt=Agfy (1)
where Ag is the gross cross-sectional area and i y is the 0.2% proof stress or yield stress. The nominal cross-section tension resistance of a member which is not subject to shear lag and fails by rupture of the net cross-section away from connections is represented for all of the design standards, except for the AlSI Specification (1997a), by the following equation,
(2)
where An is the net cross-sectional area and io is the ultimate strength. (Note: the formulae contained in (1) and (2) are under review for inclusion in the AlSI Specification (l997a) in AlSI Ballot C/S96-66D (1998).
The Australia / New Zealand (SAlSNZ, 1996), USA (AlS!, 1997a) and European (Eurocode, 1996) Design Standards all have separate requirements for the net cross-section tension resistance at connections where bolts with washers are used. The design equation for the AS/NZS 4600 and AlSI Design Standards is as follows,
( 3rd) N f = 1.0 - 0.9r + -s- AJu ~ AJu (3)
where r is the ratio of the force transmitted by the bolt(s) divided by the tensile force in the member at that section, d is the diameter of the bolt(s), and s is the spacing of the bolts perpendicular to the line of the force, or for a single bolt the width of the sheet. The design formulation for Eurocode 3 is similar to that presented in (3), however, d is defined as the nominal diameter of the bolt hole. The CSA-S 136 Design Standard does not contain a stress reduction factor based on the number and position of bolts in the cross-section. Net cross-section tension resistance at a connection is determined as found in (2), i.e., no stress reduction factor is used.
The design bearing resistance per bolt for connections regardless of the design standard used is as follows,
(4)
where d is the nominal diameter of the bolt, t is the thickness of the sheet steel and C is a variable bearing coefficient. The AustraiianlNew Zealand (SAlSNZ, 1996) and USA (AlS1, 1997a) Design Standards require that C = 3 for single lap shear connections where washers are used under both the bolt head and nut, whereas the European Design Standard (Eurocode, 1996) requires that C = 2.5. In the Canadian Design Standard (CSA, 1994), C represents the stability of the hole edge based on the ratio of bolt diameter to sheet thickness, as listed in Table 1.
Table 1 Factor C, for Bearing Resistance (CSA, 1994) d/t C
dlt 5.10 10 < dlt < 15
dlt> 15
3 30 tid
2

533
End pull-out resistance of a bolted connection is dependent on the length of two parallel lines which extend from the bolt hole in the direction of the applied force. This type of failure differs from block shear rupture because each bolt tears out along its own path. The nominal end pull-out resistance per bolt is given in (5) for the AustralianlNew Zealand (SA/SNZ, 1996) and USA (AlS1, 1997a) Design Standards.
Vf=teiu (5)
where e is the distance measured parallel to the direction of applied force from the centre of a standard hole to the nearest edge of an adjacent hole or to the end of the connected part. The end pull-out resistance determined using Eurocode 3 (1996) is reduced by a factor as shown in (6).
Vr=teju l1.2 (6)
The nominal end pull-out resistance per bolt of a connection designed using the CSA-S 136 Design Standard (1994) is determined as previously described for the net cross-section tension resistance in (2),where the net cross-sectional area used for each bolt is defined as An = 0.60·2 t (e - dh / 2); where dh is the diameter of the bolt hole.
3 BOLTED CONNECTION TESTS AND REsULTS
3.1 General
One hundred and fifty-eight single overlap bolted connection specimens were tested in the J.W. Roderick Laboratory for Materials and Structures at the University of Sydney. The main objectives of this experimental testing phase were to determine the governing modes of failure and to evaluate the existing design provisions for bolted connections fabricated from thin G550 sheet steels. All steels were cold reduced to thickness, with an aluminum/zinc alloy (zincalume-AZ) coating and obtained from standard coils during normal roIling operations. All specimens within a material and thickness type were cut from the same sheet, although similar specimens were cut from various locations to avoid localised material properties. The material properties of cold reduced steels have been shown to be anisotropic (Rogers and Hancock, 1996, 1997b), hence, specimens were cut from three directions within the sheet; longitudinal, transverse, and diagonal with respect to the roIling direction.
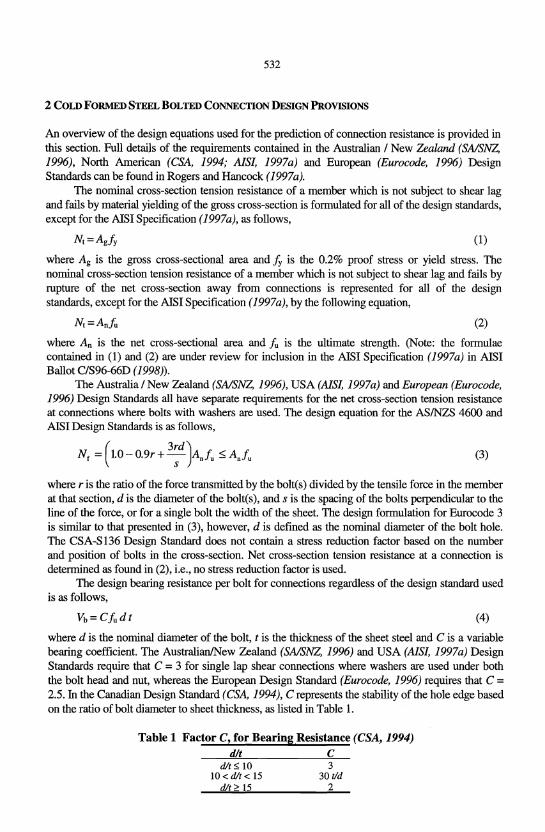
The single overlap connections were tested in shear with various size and shape specimens, as well as different types and number of bolts (see Fig. I and 2) to achieve three common modes of failure; end pull-out, bearing, and net section fracture. Both flat and winged specimens (90" bend), similar to those recommended by Zadanfarrokh and Bryan (1992), were used for the single bolt test specimens. The majority of flat test specimens had additional small metal clips attached to the ends of the connection to reduce out of plane curling of the sheet steel (see Fig. 2). The possibility of bolt shear failure was eliminated by using two types of MI2 Grade 8.8 galvanised bolts, both with a nominal diameter of 12 mm; I) a conventional bolt, nut and washer assembly (26.2 mm 0 washer with 8 threads/cm), and 2) a bolt and nut assembly with integral washers (29.5 mm 0 washer with 6 threads/cm). The shank threads extend up to the head of the conventional bolt, whereas a nonthreaded section of the shank occurs directly below the head of the integral bolt. The majority of tests consisted of concentrically loaded specimens with one, two or three bolts in line with the applied tensile force. A limited number of eccentrically loaded tests were completed to observe the effect of the line of action of the load on connection behaviour.
Due to the use of oversize bolt holes, a variation in the location of bolt(s) relative to the centre of the hole occurred. Test specimens were assembled so that initial beruing of the bolt(s) did not occur; rather a random amount of clearance on the sides of the drilled holes existed, as found in
534
typical construction. All bolts were tightened by hand to a torque of less than 10 Nm, which allowed for slip of the connection after minimal loading. Hence, it was possible for a range of slip to exist, e.g., from 0-4.6 mm, however, slip of the connection was normally in the range of 2-4 mm.
Grip Length 6S
r------1
400
12 to 60 r-1
14.3~}S
Slnglo Bolt Flat and WInged Test Specimen.
IS 48 to 96 1"1' 'I / I:::IIS
400 ,I
Single Bolt WInged Test SpecImen
Grip Length
~
440 Double Bolt Toot Spoeimen
Grip Length
H 14.3ID 0 0 I JSS
440 TrIple Bolt Toot Specimen
Fig. 1 Nominal Bolted Connection Specimen Dimensions (rom)
!
Mota1CliP~ (whcnUJCd)
Fig.2 Schematic Drawing of Bolted Connection Test Set-Up
535
Ultimate loads were obtained without the use of a deformation limit due to the initial slip of the connection and the extreme deformation of the sheet steel, in some instances between 10 mm and 30 mm. It was possible that the deformation limit of 3 mm specified in ECCS-TC7 (1983) would have been exceeded before the connection had fully slipped, and it was also possible that the deformation limit of 6.35 mm specified by the Research Council on Structural Connections (A1SC, 1988) and the American Institute of Steel Construction (1989, 1993) would not result in an accurate measurement of the full load carrying resistance of the bolted connection. However, the maximum load which occurred prior to, or at a connection displacement of 6.35 mm, measured from the point of initial bearing, was also recorded for all of the test specimens and is provided in Rogers and Hancock (1997 a).
3.2 Basic Material Properties
Static and dynamic material properties for each type of sheet steel, calculated using the base metal thickness are given in Table 2. The base metal thickness calculated yield stress and ultimate strength values for G550 sheet steels are significantly above the minimum specified 550 MPa. This is most evident for specimens obtained from the transverse direction where dynamic yield stresses are as high as 817 MPa. Dynamic yield stress results for specimens cut from the longitudinal and diagonal directions range from 703-731 MPa. The high measured material properties are mainly due to the cold reduction procedure used in the manufacture of G550 sheet steels.
Table 2 Material Properties of Sheet Steels (Mean Values) Specimen Direction tb Iya loa 10 I Iy a Type (mm) (MPa) (MPa)
0.42mm0550 Lon/?itudinal 0.41 7191703 7191703 1.00/1.00 Transverse 0.41 8171794 8171794 1.00/1.00 Dia/?onal 0.41 7311708 7311708 1.00/1.00
0.60 mm 0550 Lon/?itudinal 0.59 703/686 703/686 1.00/1.00 Transverse 0.59 7851767 7851767 1.00/1.00 Dia/?onal 0.59 707/690 707/690 1.00/1.00
0.60mm0300 Lon/?itudinal 0.58 368/348 4311411 1.1711.18 Transverse 0.58 381/360 428/408 1.1211.13 Dias.onal 0.58 376/356 437/417 1.1611.17
Note: Material properties were calculated using the base metal thickness. 'DynamidStatic values given. 1 in = 25.4 mm, 1 ksi = 6.895 MPa
3.3 Possible Modes of Failure
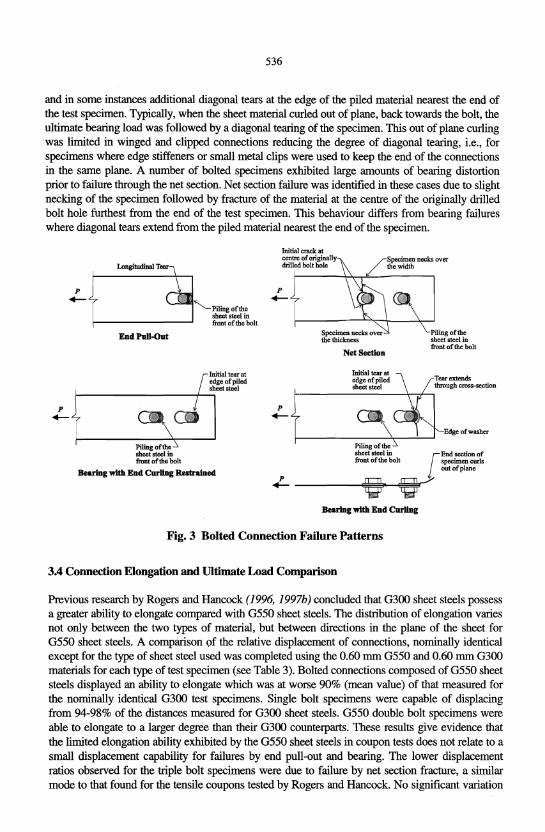
Winter (1956) categorised the failure of bolted connections into four separate modes, described in this report as; end pull-out, bearing, net section fracture, and bolt shear. All connections tested were designed such that bolt shear did not occur, hence, only failure of the sheet steel was considered. It was possible to observe the three remaining failure modes (see Fig. 3) by varying the size and shape of the test specimens, as well as the spacing and number.ofbolts.
End pull-out failure typically occurred for single bolt connections where the distance from the centre of the bolt hole to the end of the specimen was less than three times the diameter of the bolt. Some piling of the sheet steel occurred in front of the bolt with two near longitudinal tears extending from the piled material to the end of the specimen.
Connections which failed by bearing exhibited an initial pull out tear in the direction of load, with piling of the sheet steel in front of the bolt, similar to that observed for end pull-out failure,
536
and in some instances additional diagonal tears at the edge of the piled material nearest the end of the test specimen. Typically, when the sheet material curled out of plane, back towards the bolt, the ultimate bearing load was followed by a diagonal tearing of the specimen. This out of plane curling was limited in winged and clipped connections reducing the degree of diagonal tearing, i.e., for specimens where edge stiffeners or small metal clips were used to keep the end of the connections in the same plane. A number of bolted specimens exhibited large amounts of bearing distortion prior to failure through the net section. Net section failure was identified in these cases due to slight necking of the specimen followed by fracture of the material at the centre of the originally drilled bolt hole furthest from the end of the test specimen. This behaviour differs from bearing failures where diagonal tears extend from the piled material nearest the end ofthe specimen.
P O·tudinalTe&r +-
""'----Piling ofthe sheet steel in front of the bolt
p
+-
End Pull-Ont
Initial tear at edge of piled sheet steel
r--------------,~
Bearing with End CnrUog Restrained
Initial crack at centre of original1y drilled bolt hole
p
+-
p
+-
p +-
Specimen necks over the width
NetSeetion
Initial tear at edge of piled sheetsteet
Piling of the
Piling of the sheet steel in front of the bolt
Tear extendc:: through cross-section
Edge of washer
sheet steel in [End section of front of the bolt spccimen curls
out of plane
o OJ Bearing with End CnrUog
Fig. 3 Bolted Connection Failure Patterns
3.4 Connection Elongation and Ultimate Load Comparison
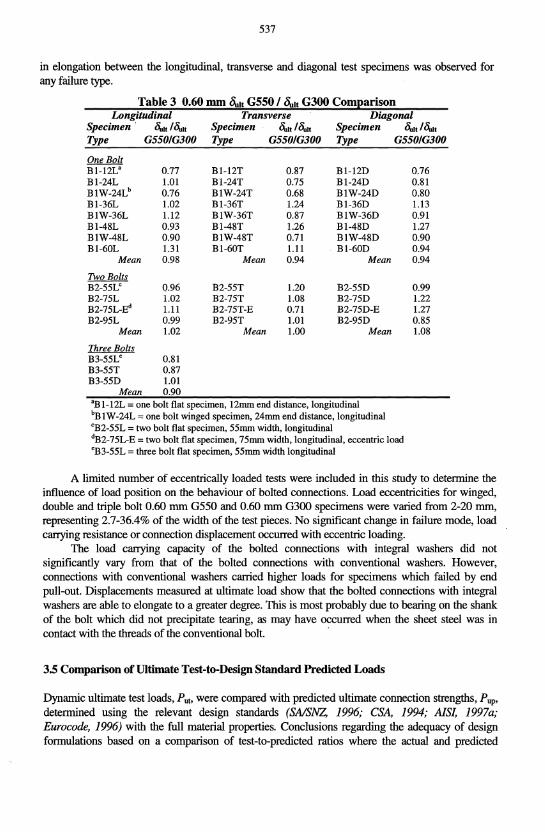
Previous research by Rogers and Hancock (1996, 1997b) concluded that G300 sheet steels possess a greater ability to elongate compared with G550 sheet steels. The distribution of elongation varies not only between the two types of material, but between directions in the plane of the sheet for G550 sheet steels. A comparison of the relative displacement of connections, nominally identical except for the type of sheet steel used was completed using the 0.60 mm G550 and 0.60 mm G300 materials for each type of test specimen (see Table 3). Bolted connections composed of G550 sheet steels displayed an ability to elongate which was at worse 90% (mean value) of that measured for the nominally identical G300 test specimens. Single bolt specimens were capable of displacing from 94-98% of the distances measured for G300 sheet steels. G550 double bolt specimens were able to elongate to a larger degree than their G300 counterparts. These results give evidence that the limited elongation ability exhibited by the G550 sheet steels in coupon tests does not relate to a small displacement capability for failures by end pull-out and bearing. The lower displacement ratios observed for the triple bolt specimens were due to failure by net section fracture, a similar mode to that found for the tensile coupons tested by Rogers and Hancock. No significant variation
537
in elongation between the longitudinal, transverse and diagonal test specimens was observed for any failure type.
Table 3 0.60 mm ~lt G550 I ~lt G300 Comparison Longitudinal Transverse Diagonal
Specimen ' ~lt/~lt Specimen ~"~lt Specimen ~t/~t Type G550lG300 Type G550lG300 Type G550lG300
One Bolt Bl-12L' 0.77 Bl-12T 0.87 Bl-12D 0.76 Bl-24L 1.01 Bl-24T 0.75 Bl-24D 0.81 B1W-24Lb 0.76 B1W-24T 0.68 B1W-24D 0.80 Bl-36L 1.02 Bl-36T 1.24 Bl-36D 1.13 B1W-36L 1.12 B1W-36T 0.87 B1W-36D 0.91 Bl-48L 0.93 Bl-48T 1.26 Bl-48D 1.27 B1W-48L 0.90 B1W-48T 0.71 B1W-48D 0.90 Bl-60L 1.31 Bl-60T 1.11 Bl-60D 0.94
Mean 0.98 Mean 0.94 Mean 0.94
Two Bolts B2-55L' 0.96 B2-55T 1.20 B2-55D 0.99 B2-75L 1.02 B2-75T 1.08 B2-75D 1.22 B2-75L-Ed 1.11 B2-75T-E 0.71 B2-75D-E 1.27 B2-95L 0.99 B2-95T 1.01 B2-95D 0.85
Mean 1.02 Mean 1.00 Mean 1.08
Three Bolts B3-55Le 0.81 B3-55T 0.87 B3-55D 1.01
Mean 0.90 'Bl-12L = one bolt flat specimen, 12mm end distance, longitudinal bBIW-24L = one bolt winged specimen, 24mm end distance, longitudinal 'B2-55L = two bolt flat specimen, 55mm width, longitudinal dB2-75L-E = two bolt flat specimen, 75mm width, longitudinal, eccentric load eB3-55L = three bolt flat specimen, 55mm width longitudinal
A limited number of eccentrically loaded tests were included in this study to determine the influence of load position on the behaviour of bolted connections. Load eccentricities for winged, double and triple bolt 0.60 mm G550 and 0.60 mm G300 specimens were varied from 2-20 mm, representing 2.7-36.4% of the width of the test pieces. No significant change in failure mode, load canying resistance or connection displacement occurred with eccentric loading.
The load canying capacity of the bolted connections with integral washers did not significantly vary from that of the bolted connections with conventional washers. However, connections with conventional washers carried higher loads for specimens which failed by end pull-out. Displacements measured at ultimate load show that the bolted connections with integral washers are able to elongate to a greater degree. This is most probably due to bearing on the shank of the bolt which did not precipitate tearing, as may have occurred when the sheet steel was in contact with the threads of the conventional bolt. '
3.5 Comparison of Ultimate Test-to-Design Standard Predicted Loads
Dynamic ultimate test loads, PUb were compared with predicted ultimate connection strengths, Pup, determined using the relevant design standards (SAlSNZ, 1996; CSA, 1994; AlSJ, 1997a; Eurocode, 1996) with the full material properties. Conclusions regarding the adequacy of design formulations based on a comparison of test-to-predicted ratios where the actual and predicted
538
failure modes do not match are invalid. Hence, statistical information of the test-to-predicted ratios for the various design standards is not provided in this paper. Only the CSA-S 136 Design Standard (1994) adequately predicts the failure modes of the different G550 test specimens. However, bolted connection test and predicted loads, as well as test-to-predicted loads according to the relevant design standards, for each individual specimen, can be found in Rogers and Hancock (1997a). The lowest calculated load from the various connection equations within anyone design standard is defined as the predicted mode of failure.
The ratio of correct-to-incorrect failure mode prediction for the AS/NZS 4600 (1996) and AlSI (1997a) Design Standards is 92:66, where the majority of incorrect predictions were defined as net section failure when bearing failure occurred in the test specimen. The error in predicted failure mode can be attributed to design equations which overestimate and underestimate the bearing and net section fracture resistance, respectively. Bearing resistance equations are based on a large array of data which does not include a significant number of specimens with thickness less than 0.60 rom. The lack of specimens in this range has allowed the AS/NZS 4600 and AlSI Design Standards to overlook the influence of thickness on bearing resistance. Test results from this report also show that it is not necessary to reduce the net section fracture resistance at connections as a function of the number of bolts and width of the specimen.
Use of the CSA-S136 Design Standard (1994) provides a ratio of correct-to-incorrect failure mode prediction of 152:6. The six incorrectly predicted specimens were double bolted G300 tests for which net section failure occurred instead of the predicted bearing failure. The coefficient of C = 2 used in the CSA-S136 bearing equation for connections where dlt ~ 15 (see Table 1) may be overly conservative for mild sheet steels. Use of the Eurocode Standard (1996) gives a ratio of correct-to-incorrect failure mode prediction of 131 :27. The large number of incorrect failure mode predictions is due to an overestimated bearing resistance and an underestimated net section fracture resistance, similar to that observed for the AS/NZS 4600 (1996) and AISI (1997a) Design Standards.
3.6 Comparison of Ultimate Test-to-Failure Criterion Predicted Loads
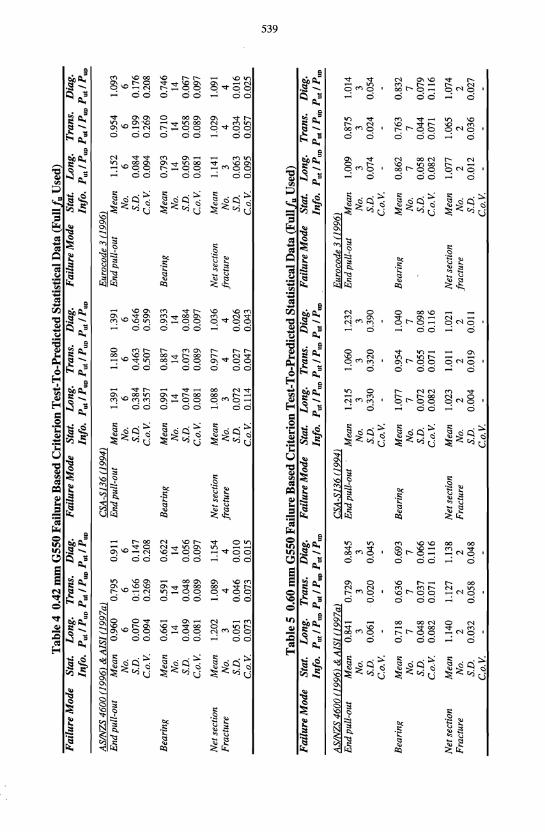
The bolted connections included in this paper were divided into separate categories according to the failure mode recorded during testing, i.e., end pull-out, bearing, and net section fracture. Thus, the predicted connection resistance used in comparison with the ultimate tensile load of a bolted connection was calculated using the design equation developed for that failure mode, e.g., all specimens which failed by bearing were compared with the predicted bearing resistance which was calculated using the full material properties. This type of failure based criterion comparison reveals the accuracy of each individual design equation by eliminating the influence of the remaining bolted connection design provisions. Statistical results for each material type, design standard and failure mode are provided for 0.42 rom G550, 0.60 rom G550 and 0.60 rom G300 sheet steels in Tables 4, 5 and 6, respectively.
The AS/NZS 4600 (1996) and AlSI (1997a) Design Standards can both be used to conservatively predict the net section failure loads of bolted connections. Calculated end pull-out loads are unconservative, especially for transverse specimens where mean test-to-predicted ratios of 0.795 and 0.729 occur for 0.42 rom G550 and 0.60 rom G550 sheet steel specimens, respectively. The resistance of 0.60 rom G300 test specimens which failed by end pull-out are more accurately predicted using these design standards. The connection resistance of bolted specimens which failed in bearing is inaccurately modelled by the existing AS/NZS 4600 and AlSI design provisions. The resulting mean test-to-predicted ratios are significantly unconservative, ranging from 0.591 in the transverse direction to 0.661 in the longitudinal direction for 0.42 rom G550
Tab
le 4
0.4
2 m
m G
550
Fai
lure
Bas
ed C
rite
rion
Tes
t-T
o-P
redi
cted
Sta
tist
ical
Dat
a (F
ull !
u U
sed)
F
ailu
re M
ode
Stat
. L
ong.
Tr
ans.
D
iag.
F
ailu
re M
ode
Stat
. L
ong.
Tr
ans.
D
iag.
F
ailu
re M
ode
Stat
. L
ong.
Tr
ans.
D
iag.
In
fo.
Put
! PuP
Put
I P
uP P
ut! P
uP
Info
. P
ut! P
uP P
ut! P
uP P
ut I
PuP
In
fo.
Put I
PuP
Put
I P
uP P
ut I
PuP
AS/
NZ
S 46
00 (1
996)
& A
lSI (
1997
a)
CSA
-SJ3
6 (1
994)
E
uroc
ode
3 (1
996)
E
nd
pul
l-ou
t M
ean
0.96
0 0.
795
0.91
1 E
nd p
ull-
out
Mea
n 1.
391
1.18
0 1.
391
End
pul
l-ou
t M
ean
1.15
2 0.
954
1.09
3 N
o.
6 6
6 N
o.
6 6
6 N
o.
6 6
6 S.
D.
0.07
0 0:
166
0.14
7 S.
D.
0.38
4 0.
463
0.64
6 S.
D.
0.08
4 0.
199
0.17
6 C
o.V
. 0.
094
0.26
9 0.
208
Co.
V.
0.35
7 0.
507
0.59
9 C
o.V
. 0.
094
0.26
9 0.
208
Bea
rinJ
? M
ean
0.66
1 0.
591
0.62
2 Be
arin
J?
Mea
n 0.
991
0.88
7 0.
933
Bea
rinf
!. M
ean
0.79
3 0.
7lD
0.
746
No.
14
14
14
N
o.
14
14
14
No.
14
14
14
S.
D.
0.04
9 0.
048
0.05
6 S.
D.
0.07
4 0.
073
0.08
4 S.
D.
0.05
9 0.
058
0.06
7 C
o.V
. 0.
081
0.08
9 0.
097
Co.
V.
0.08
1 0.
089
0.09
7 C
o.V
. 0.
081
0.08
9 0.
097
Net
sec
tion
M
ean
1.20
2 1.
089
1.15
4 N
et s
ecti
on
Mea
n 1.
088
0.97
7 1.
036
Net
sec
tion
M
ean
1.14
1 1.
029
1.09
1 F
ract
ure
No.
3
4 4
frac
ture
N
o.
3 4
4 fr
actu
re
No.
3
4 4
S.D
. 0.
051
0.04
6 O
.OlD
S.
D.
0.07
2 0.
027
0.02
6 S.
D.
0.06
3 0.
034
0.01
6 C
o.V
. 0.
073
0.07
3 0.
D15
C
o.V
. 0.
114
0.04
7 0.
043
Co.
V.
0.09
5 0.
057
0.02
5
Ul
Vol
'-
0
Tab
le 5
0.6
0 m
m G
550
Fai
lure
Bas
ed C
rite
rion
Tes
t-T
o-P
redi
cted
Sta
tist
ical
Dat
a (F
ull,!
u U
sed)
F
ailu
re M
ode
Stat
. L
ong.
Tr
ans.
D
iag.
F
ailu
re M
ode
Stat
. L
ong.
Tr
ans.
D
iag.
F
ailu
re M
ode
Stat
. L
ong.
Tr
ans.
D
iag.
In
fo.
Put I
PuP
Put
! PuP
Put
! PuP
In
fo.
Put I
PuP
Put
I P
uP P
ut I
PuP
In
fo.
Put I
PuP
Put
! PuP
Put
! PuP
ASI
NZ
S 46
00 (
1996
) &
AIS
I (1
997a
) C
SA-S
J36
(199
4)
Eur
ocod
e 3
(199
6)
En
d p
ull-
out
Mea
n 0.
841
0.72
9 0.
845
End
pul
l-ou
t M
ean
1.21
5 1.
060
1.23
2 E
nd p
ull-
out
Mea
n 1.
009
0.87
5 1.
014
No.
3
3 3
No.
3
3 3
No.
3
3 3
S.D
. 0.
061
0.02
0 0.
045
S.D
. 0.
330
0.32
0 0.
390
S.D
. 0.
074
0.02
4 0.
054
Co.
V.
Co.
V.
Co.
V.
Bea
rinJ
? M
ean
0.71
8 0.
636
0.69
3 B
eari
nJ?
Mea
n 1.
077
0.95
4 1.
040
Bea
rinJ
? M
ean
0.86
2 0.
763
0.83
2 N
o.
7 7
7 N
o.
7 7
7 N
o.
7 7
7 S.
D.
0.04
8 0.
037
0.06
6 S.
D.
0.07
2 0.
055
0.09
8 S.
D.
0.05
8 0.
044
0.07
9 C
o.V
. 0.
082
0.07
1 0.
116
Co.
V.
0.08
2 0.
071
0.11
6 C
o.V
. 0.
082
0.07
1 0.
116
Net
sec
tion
M
ean
1.14
0 1.
127
1.13
8 N
et s
ecti
on
Mea
n 1.
023
1.01
1 1.
021
Net
sec
tion
M
ean
1.07
7 1.
065
1.07
4 F
ract
ure
No.
2
2 2
Fra
ctur
e N
o.
2 2
2 fr
actu
re
No.
2
2 2
S.D
. 0.
032
0.05
8 0.
048
S.D
. 0.
004
0.01
9 0.
011
S.D
. 0.
012
0.03
6 0.
027
Co
.V.
Co.
V.
Co.
V.
540
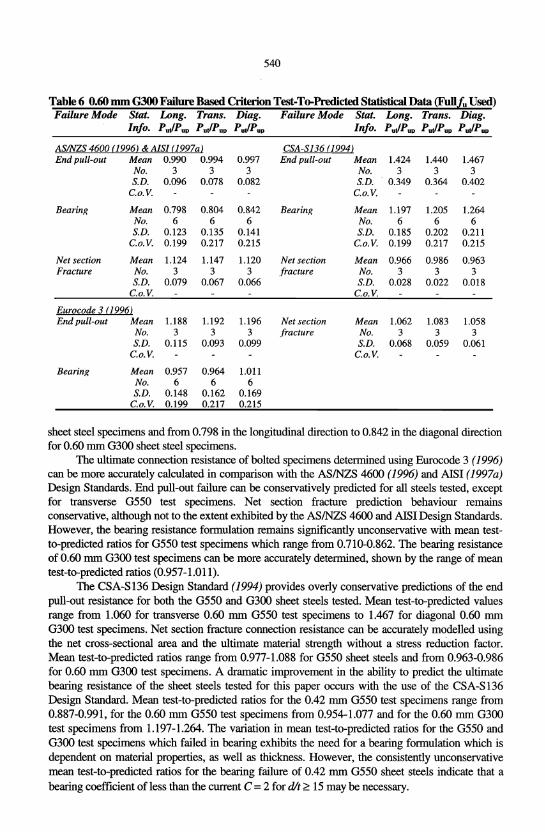
Table 6 0.60 nun G300 Failure Based Criterion Test-To-Predicted Statistical Data (Full,lu Used) Failure Mode Stat. Long. Trans. Diag. Failure Mode Stat. Long. Trans. Diag.
Info. p.tlP.P p.tlP.P p.\/p.P Info. p.tlP.P PutlPup PulPup
AS/NZS 4600 (1996) & AISI (1997a) CSA-S136 (1994) End pull-out Mean 0.990 0.994 0.997 End pull-out Mean 1.424 1.440 1.467
No. 3 3 3 No. 3 3 3 S.D. 0.096 0.078 0.082 S.D. . 0.349 0.364 0.402
c.o.V. c.o.V.
Bearin/? Mean 0.798 0.804 0.842 Bearin/? Mean 1.197 1.205 1.264 No. 6 6 6 No. 6 6 6 S.D. 0.123 0.135 0.141 S.D. 0.185 0.202 0.211
c.o.V. 0.199 0.217 0.215 c.o.V. 0.199 0.217 0.215
Net section Mean 1.124 1.147 1.120 Net section Mean 0.966 0.986 0.963 Fracture No. 3 3 3 fracture No. 3 3 3
S.D. 0.079 0.067 0.066 S.D. 0.028 0.022 0.D18 c.o.V. c.o.V.
Eurocode 3 (1996) End pull-out Mean 1.188 1.192 1.196 Net section Mean 1.062 1.083 1.058
No. 3 3 3 fracture No. 3 3 3 S.D. 0.115 0.093 0.099 S.D. 0.068 0.059 0.061
c.o.V. c.o.V.
Bearin/? Mean 0.957 0.964 1.011 No. 6 6 6 S.D. 0.148 0.162 0.169
c.o.v. 0.199 0.217 0.215
sheet steel specimens and from 0.798 in the longitudinal direction to 0.842 in the diagonal direction for 0.60 mm G300 sheet steel specimens.
The ultimate connection resistance of bolted specimens determined using Eurocode 3 (1996) can be more accurately calculated in comparison with the ASINZS 4600 (1996) and AlSI (1997a) Design Standards. End pull-out failure can be conservatively predicted for all steels tested, except for transverse G550 test specimens. Net section fracture prediction behaviour remains conservative, although not to the extent exhibited by the ASINZS 4600 and AlSI Design Standards. However, the bearing resistance formulation remains significantly unconservative with mean testto-predicted ratios for G550 test specimens which range from 0.710-0.862. The bearing resistance of 0.60 mm G300 test specimens can be more accurately determined, shown by the range of mean test-to-predicted ratios (0.957-1.011).
The CSA-S136 Design Standard (1994) provides overly conservative predictions of the end pull-out resistance for both the G550 and G300 sheet steels tested. Mean test-to-predicted values range from 1.060 for transverse 0.60 mm G550 test specimens to 1.467 for diagonal 0.60 mm G300 test specimens. Net section fracture connection resistance can be accurately modelled using the net cross-sectional area and the ultimate material strength without a stress reduction factor. Mean test-to-predicted ratios range from 0.977-1.088 for G550 sheet steels and from 0.963-0.986 for 0.60 mm G300 test specimens. A dramatic improvement in the ability to predict the ultimate beruing resistance of the sheet steels tested for this paper occurs with the use of the CSA-S136 Design Standard. Mean test-to-predicted ratios for the 0.42 mm G550 test specimens range from 0.887-0.991, for the 0.60 mm G550 test specimens from 0.954-1.077 and for the 0.60 mm G300 test specimens from 1.197-1.264. The variation in mean test-to-predicted ratios for the G550 and G300 test specimens which failed in bearing exhibits the need for a bearing formulation which is dependent on material properties, as well as thickness. However, the consistently unconservative mean test-to-predicted ratios for the bearing failure of 0.42 mm G550 sheet steels indicate that a bearing coefficient of less than the current C = 2 for dlt ~ 15 may be necessary.
541
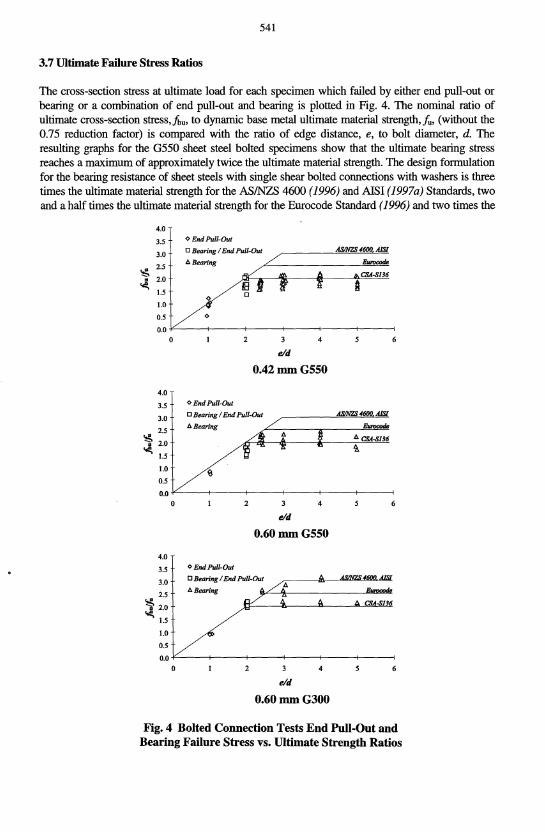
3.7 Ultimate Failure Stress Ratios
The cross-section stress at ultimate load for each specimen which failed by either end pull-out or bearing or a combination of end pull-out and bearing is plotted in Fig. 4. The nominal ratio of ultimate cross-section stress,fi,u, to dynamic base metal ultimate material strength,fu, (without the 0.75 reduction factor) is compared with the ratio of edge distance, e, to bolt diameter, d. The resulting graphs for the 0550 sheet steel bolted specimens show that the ultimate bearing stress reaches a maximum of approximately twice the ultimate material strength. The design formulation for the bearing resistance of sheet steels with single shear bolted connections with washers is three times the ultimate material strength for the ASINZS 4600 (1996) and AlSI (1997a) Standards, two and a half times the ultimate material strength for the Eurocode Standard (1996) and two times the
'.6 . ..e.
4.0
3.5
3.0
2.5
2.0
1.5
1.0
0.5
0.0
4.0
3.5
3.0
2.5
'i 2.0
..e. 1.5
1.0
0.5
~ End PuIl·Out
o Bearing / End Pull-Out ASINZS 4600 AISI
Il.Bearing Eumcode
C&I.o8136
lEI a ~
0
~
4
e/d
0.42 mm G550
~ End Pull-Out
o Bearing / End Pull-Out
1:J.Bearing Eumcode
a C&I.o8136
0.0 ¥_--f-----t----+----+------+----~
4.0
3.5
3.0
2.5
~ 2.0
..e. 1.5
1.0
0.5
2
~ End Pull-Out
4
e/d
0.60mmG550
o Bearing / End Pull-Out
A Bearing
0.0 ¥_--f-----j----t---t-----t----;
2
e/d
0.60 mm G300
Fig. 4 Bolted Connection Tests End Pull-Out and Bearing Failure Stress vs. Ultimate Strength Ratios
542
ultimate material strength for the CSA-SI36 Design Standard (1994), when the ratio of dlt ~ 15, as found for the thin steels tested for this paper. The ultimate cross-section stress of the specimens which failed by end pull-out is less than that observed for specimens which failed by bearing, and lies near the expected end pullcout stress if the CSA-S 136 design formulation is followed.
The 0.60 mm G300 test specimens which failed either by end pull-out or bearing or a combination of end pull-out and be.aring have a calculated cross-section stress with a lower bound of approximately twice the ultimate material strength. The ratio of ultimate bearing stress to ultimate material strength does extend up to and slightly past three for some test specimens, however, the majority lie closer to the values predicted using the CSA-S136 Design Standard (1994). The use of a gradated ultimate material strength multiplicative factor, which is dependent on the stability of the material at the edge of the fastener hole (see Table 1) is necessary for the accurate design of G550 and mild G300 sheet steels when the thickness is 0.60 mm or less.
1.6
1.4 ~1WoBolts
1.2 o Three Bolts
~ 1.0
" 0.8 ..:. 0.6
r~ 112 0.4
0.2 r=1
0.0 0.0 0.1 0.2 0.3 0.4 0.5 0.6
dis
0.42 mm G550
1.6
1.4 97WoBoits
1.2 o Three Bolts
'$ 1.0
J. 0.8
0.6 r~ 112
0.4
0.2 r=1
0.0 0.0 0.1 0.2 0.3 0.4 0.5 0.6
dis
0.60mmG550
1.6
1.4 <> Two Bolts
1.2 o Three Bolts.
1.0 '$
0.8 " ..:. 0.6 r~ 112
0.4
0.2 r~l
0.0 0.0 0.1 0.2 0.3 0.4 0.5 0.6
dis
0.60 mm G300
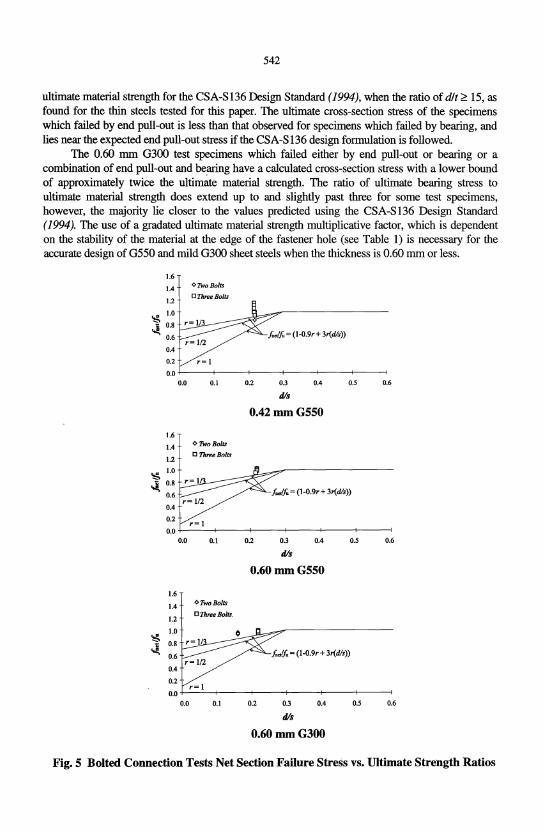
Fig. 5 Bolted Connection Tests Net Section Failure Stress vs. Ultimate Strength Ratios
543
The cross-section stress at ultimate load for each specimen where net section failure occurred is plotted in Fig. 5. The ratio of net section fracture stress at ultimate,jneb to dynamic base metal ultimate material strength,fu, (without the 0.75 reduction factor) versus the ratio of bolt diameter, d, to specimen width, s, is given, along with the predicted ratio offnerlfu determined using the ASINZS 4600 (1996) and AlSI (1997a) Design Standards. Test specimens joined with a single bolt did not fail by net section fracture due to the thinness of the material used, therefore, only a limited amount of data is available for the double and triple bolt connections. In most instances the ratio of net section fracture stress at ultimate to ultimate material strength is approximately unity, which indicates that the use of a stress reduction factor, which is dependent on r and the ratio of dis, is overly conservative for the design of thin G550 and G300 sheet steels. The reduction formulation used in the ASINZS 4600, AlSI and Eurocode Design Standards is not present in the CSA-S136 Design Standard (1994), where the net section fracture stress at a hole or at a connection are equal. The CSA-S 136 Design Standard can be used to predict the tensile resistance of a bolted connection which has failed in the net section fracture mode.
4 RELIABILITY STUDY
4.1 AISI Calibrated Resistance, tfJ, Factors
A reliability study was completed to establish the applicability of current bolted connection ultimate resistance design equations to G550 sheet steels. An AlSI Commentary (1997b) based calibration method is presented for the Australian / New Zealand (SAlSNZ, 1996), North American (CSA, 1994; AlSI, '997a), and European (Eurocode, 1996) Design Standards. Data from the bolted connection test specimen study presented in this paper is supplemented with material information on G550 sheet steels from a BHP G550 Commonisation Study (1996) (see Rogers and Hancock (1996)). The calibration procedure was completed for data based on the full ultimate strength,fu, as well as the reduced ultimate strength, 0.75fu.
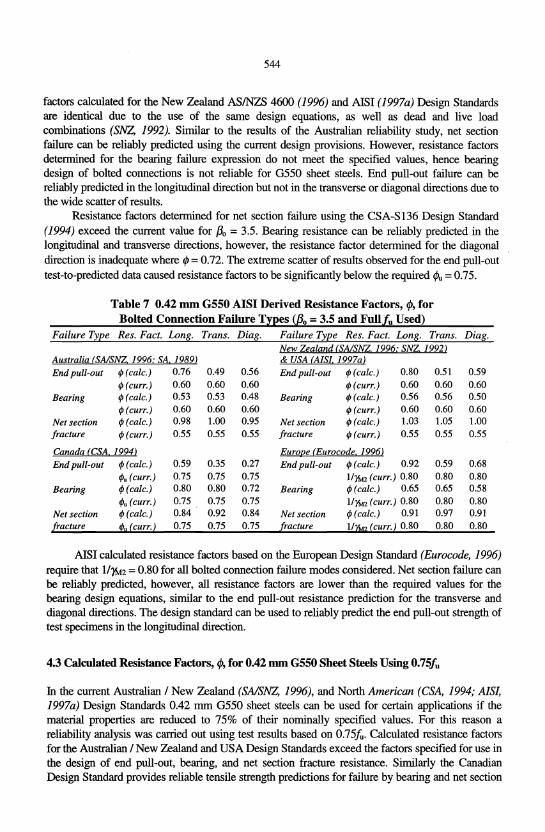
Results of the reliability study following the AlSI Commentary (1997b) recommended calibration procedure reveal that not all of the calculated resistance factors meet the requirements currently specified in the Australian / New Zealand (SAlSNZ, 1996), North American (CSA, 1994; AlSI, 1997a), and European (Eurocode, 1996) Design Standards. Table 7 lists the current and calculated resistance factors in the longitudinal, transverse and diagonal directions for the various target reliability indices and the three failure types, when the full material properties of the 0.42 mm G550 sheet steels are used. Table 8 provides the same information when the values of the material properties are limited to 75% of their nominal and measured values, i.e., the ultimate strengths used to determine required test-to-predicted ratios and the nominal value of 550 MPa used in the reliability analysis are modified. See Rogers and Hancock (1997a) for all pertinent statistical parameters necessary for the calculation of resistance factors.
4.2 Calculated Resistance Factors, I/J, for 0.42 mm G550 Sheet Steels Usingfu
Resistance factors determined for net section failure using the ASINZS 4600 Design Standard (1996) with Australian Standard AS 1170.1 (1988) dead and live load combinations exceed the current values in all directions for /30 = 3.5. The current equation for bearing specified in the ASINZS 4600 Design Standard is not reliable for use in the design of G550 sheet steel bolted connections when the full value offu is used. Resistance factors determined for end pull-out failure are adequate for test data in the longitudinal direction, but not the transverse or diagonal directions. This is due in part to the limited amount of data available and the large scatter of results. Resistance
544
factors calculated for the New Zealand ASINZS 4600 (1996) and AISI (1997a) Design Standards are identical due to the use of the same design equations, as well as dead and live load combinations (SNZ, 1992). Similar to the results of the Australian reliability study, net section failure can be reliably predicted using the current design provisions. However, resistance factors determined for the bearing failure expression do not meet the specified values, hence bearing design of bolted connections is not reliable for G550 sheet steels. End pull-out failure can be reliably predicted in the longitudinal direction but not in the transverse or diagonal directions due to the wide scatter of results.
Resistance factors determined for net section failure using the CSA-S136 Design Standard (1994) exceed the current value for {30 = 3.5. Bearing resistance can be reliably predicted in the longitudinal and transverse directions, however, the resistance factor determined for the diagonal direction is inadequate where I/> = 0.72. The extreme scatter of results observed for the end pull-out test -to-predicted data caused resistance factors to be significantly below the required t/Ju = 0.75.
Table 7 0.42 nun G550 AISI Derived Resistance Factors, 1/>, for Bolted Connection Failure Tl:l!es (I!.o = 3.5 and Fulllu Used)
Failure Type Res. Fact. Long. Trans. Diag. Failure Type Res. Fact. Long. Trans. Diag. New Zealand (SAlSNZ 1996' SNZ 19921
Australia (SAlSNZ, 1996; SA 19891 & USA (AIS1, 1997al End pull-out rp(calc.) 0.76 0.49 0.56 End pull-out rp (calc.) 0.80 0.51 0.59
rp(curr.) 0.60 0.60 0.60 rp (curr.) 0.60 0.60 0.60 Bearing rp (calc.) 0.53 0.53 0.48 Bearing rp (calc.) 0.56 0.56 0.50
rp (curr.) 0.60 0.60 0.60 rp (curr.) 0.60 0.60 0.60 Net section rp (calc.) 0.98 1.00 0.95 Net section rp(calc.) 1.03 1.05 1.00 fracture rp (curr.) 0.55 0.55 0.55 fracture rp (curr.) 0.55 0.55 0.55
Canada(CSA 19941 Eurol2.e (Eurocode 19961 End pull-out rp(calc.) 0.59 0.35 0.27 End pull-out rp (calc.) 0.92 0.59 0.68
rpu (curr.) 0.75 0.75 0.75 111M2 (curr.) 0.80 0.80 0.80 Bearing rp (calc.) 0.80 0.80 0.72 Bearing rp (calc.) 0.65 0.65 0.58
rp" (curr.) 0.75 0.75 0.75 111M2 (curr.) 0.80 0.80 0.80 Net section rp (calc.) 0.84 0.92 0.84 Net section rp (calc.) 0.91 0.97 0.91 f!:.acture ~1I (curr.! 0.75 0.75 0.75 fracture lIlW (curr.! 0.80 0.80 0.80
AISI calculated resistance factors based on the European Design Standard (Eurocode, 1996) require that 111M2 = 0.80 for all bolted connection failure modes considered. Net section failure can be reliably predicted, however, all resistance factors are lower than the required values for the bearing design equations, similar to the end pull-out resistance prediction for the transverse and diagonal directions. The design standard can be used to reliably predict the end pull-out strength of test specimens in the longitudinal direction.
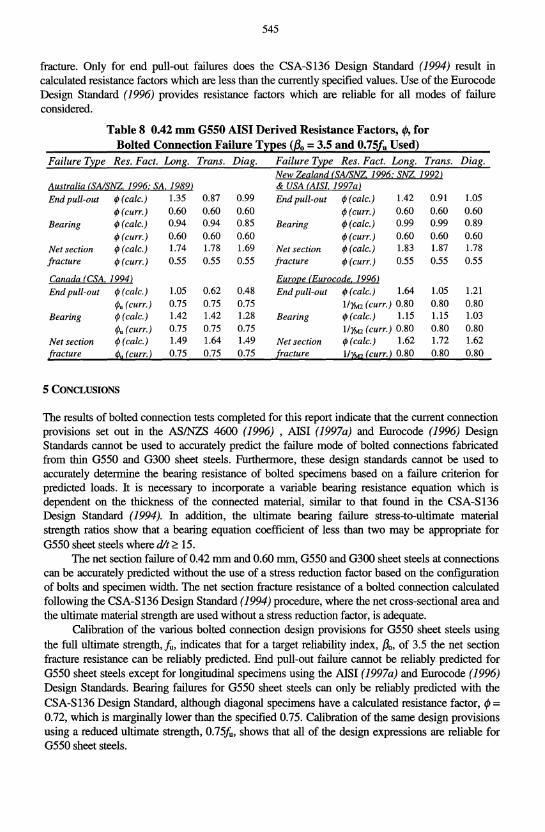
4.3 Calculated Resistance Factors, 1/>, for 0.42 nun G550 Sheet Steels Using 0.75/u
In the current Australian / New Zealand (SA/SNZ, 1996), and North American (CSA, 1994; AlSI, 1997a) Design Standards 0.42 mm G550 sheet steels can be used for certain applications if the material properties are reduced to 75% of their nominally specified values. For this reason a reliability analysis was carried out using test results based on 0.75fu. Calculated resistance factors for the Australian / New Zealand and USA Design Standards exceed the factors specified for use in the design of end pull-out, bearing, and net section fracture· resistance. Similarly the Canadian Design Standard provides reliable tensile strength predictions for failure by bearing and net section
545
fracture. Only for end pull-out failures does the CSA-S136 Design Standard (1994) result in calculated resistance factors which are less than the currently specified values. Use of the Eurocode Design Standard (1996) provides resistance factors which are reliable for all modes of failure considered.
Table 8 0.42 mm G550 AISI Derived Resistance Factors, I{J, for Bolted Connection Failure T~l!es (fl.o = 3.5 and 0.75[0 Used)
Failure Type Res. Fact. Long. Trans. Diag. Failure Type Res. Fact. Long. Trans. Diag. New Zealand (SAlSNZ, 1996; SNZ, 1992)
Australia (SAlSNZ 1996; SA, 1989) & USA (AlSI, 1997a)
End pull-out I/J(calc.} 1.35 0.87 0.99 End pull-out I/J(calc.} 1.42 0.91 1.05 I/J (curr.) 0.60 0.60 0.60 I/J (curr.) 0.60 0.60 0.60
Bearing I/J(calc.} 0.94 0.94 0.85 Bearing I/J (calc.) 0.99 0.99 0.89 I/J (curr.) 0.60 0.60 0.60 I/J (curr.) 0.60 0.60 0.60
Net section I/J(calc.} 1.74 1.78 1.69 Net section I/J (calc.) 1.83 1.87 1.78 fracture I/J (curr.) 0.55 0.55 0.55 fracture I/J (curr.) 0.55 0.55 0.55
Canada (CSA, 1994) Euro~e(Eurocode 1996)
End pull-out I/J(calc.} 1.05 0.62 0.48 End pull-out I/J (calc.) 1.64 1.05 1.21 I/Ju (curr.) 0.75 0.75 0.75 1I11>f2 (curr.) 0.80 0.80 0.80
Bearing I/J (calc.) 1.42 1.42 1.28 Bearing I/J (calc.) 1.15 1.15 1.03 I/Ju (curr.) 0.75 0.75 0.75 1/11>12 (curr.) 0.80 0.80 0.80
Net section I/J (calc.) 1.49 1.64 1.49 Net section I/J (calc.) 1.62 1.72 1.62 fracture PH (curr.) 0.75 0.75 0.75 fracture lIl1,g ( curr.! 0.80 0.80 0.80
5 CONCLUSIONS
The results of bolted connection tests completed for this report indicate that the current connection provisions set out in the ASINZS 4600 (1996) , AlSI (1997a) and Eurocode (1996) Design Standards cannot be used to accurately predict the failure mode of bolted connections fabricated from thin G550 and G300 sheet steels. Furthermore, these design standards cannot be used to accurately determine the bearing resistance of bolted specimens based on a failure criterion for predicted loads. It is necessary to incorporate a variable bearing resistance equation which is dependent on the thickness of the connected material, similar to that found in the CSA-S136 Design Standard (1994). In addition, the ultimate bearing failure stress-to-ultimate material strength ratios show that a bearing equation coefficient of less than two may be appropriate for G550 sheet steels where dlt;::: 15.
The net section failure of 0.42 mm and 0.60 mm, G550 and G300 sheet steels at connections can be accurately predicted without the use of a stress reduction factor based on the configuration of bolts and specimen width. The net section fracture resistance of a bolted connection calculated following the CSA-S136 Design Standard (1994) procedure, where the net cross-sectional area and the ultimate material strength are used without a stress reduction factor, is adequate.
Calibration of the various bolted connection design provisions for G550 sheet steels using the full ultimate strength, io, indicates that for a target reliability index, /30' of 3.5 the net section fracture resistance can be reliably predicted. End pull-out failure cannot be reliably. predicted for G550 sheet steels except for longitudinal specimens using the AlSI (1997a) and Eurocode (1996) Design Standards. Bearing failures for G550 sheet steels can only be reliably predicted with the CSA-S136 Design Standard, although diagonal specimens have a calculated resistance factor, I/J = 0.72, which is marginally lower than the specified 0.75. Calibration of the same design provisions using a reduced ultimate strength, 0.75!u, shows that all of the design expressions are reliable for G550 sheet steels.

546
Bolted connections composed of G550 sheet steels were able to elongate to at least 90% of the distance measured for the nominally identical G300 test specimens. The limited elongation ability exhibited by the G550 sheet steels in coupon tests (Rogers and Hancock, 1996, 1997b) did not translate into a small displacement capacity for bolted connection failures by end pull-out and bearing. The displacement of bolted connections, regardless of failure mode, is not dependent on the direction ofthe material in the plane of the sheet.
The scope of this paper has been limited to the investigation of the behaviour of bolted connections using G550 sheet steels, and particularly the 0.75 reduction factor for material properties. However, the results of test data obtained from this research indicate that a similar reduction in bearing capacity occurs for thin G300 sheet steels. Hence, the use of an unreduced iu value for the design of G300 sheet steel bolted connections in bearing may lead to unconservative estimates of the connection resistance. Further investigation of the resistance of connections involving thin G300 sheet steels is required.
A limited number of eccentrically loaded tests were included in this study to determine the influence of load position on the behaviour of bolted connections. No significant change in failure mode, load carrying resistance or connection displacement occurred with eccentric loading.
ACKNOWLEDGEMENTS
The authors would like to thank the Australian Research Council and BHP Steel Research for their financial support. The first author is supported by a joint Commonwealth of Australia and Centre for Advanced Structural Engineering Scholarship.
REFERENCES
American Institute of Steel Construction (AISC). (1989). "Specification for Structural Steel Buildings - Allowable Stress Design and Plastic Design", 1st Ed., Chicago, IL, USA.
American Institute of Steel Construction (AISC). (1993). "Load & Resistance Factor Design - Specification for Structural Steel Buildings", Chicago, IL, USA.
American Institute of Steel Construction Research Council on Structural Connections (AISC). (1988). "Load & Resistance Factor Design - Specification for Structural Joints Using ASTM A32S or A490 Bolts", Chicago, IL, USA.
American Iron and Steel Institute (AISI). (1998). "Changes to Specification and Commentary Sections C2, E2, E3.2, E3.3 and ES, Combined LRFD and ASD", Ballot C/S96-66D, Washington, DC, USA.
American Iron and Steel Institute (AIS!). (1997a). "1996 Edition of the Specification for the Design of Cold-Formed Steel Structural Members", Washington, DC, USA.
American Iron and Steel Institute (AIS!). (1997b). "Commentary on the 1996 Edition of the Specification for the Design of Cold-Formed Steel Structural Members", Washington, DC, USA.
BHP (1996). "0.42 GSSO Commonisation Study", BHP Research, Flat Products Division, BHP Steel, Port Kembla, NSW, Australia.
Canadian Standards Association (CSA) S 136. (1994). "Cold Formed Steel Structural Members", Etobicoke, Ont, Canada.
Dhalla, A. K., Winter, G. (1974a). "Steel Ductility Measurements", J. Strnct. Div., ASCE, 100(2),427-444. Dhalla, A. K., Winter, G. (1974b). "Suggested Steel Ductility Requirements", J. Strnct. Div., ASCE, 100(2),445-462. European Committee for Standardisation (1996). "Eurocode 3 - Design of steel structures, Part 1.3 General rules,
Supplementary rules for cold formed thin ge.uge members and sheeting", Brussels, Belgium. European Convention for Constructional Steelwork (1983). "ECCS-TC7 - The Design and Testing of Connections in
Steel Sheeting and Sections", Publication No. 21, Delft, The Netherlands. Rogers, C. A., Hancock, G. J. (1996). "Ductility of GSSO Sheet Steels in Tension - Elongation Measurements and
Perforated Tests", Res. Rep. No. R73S, Dept. ofCiv. Engrg., Univ. of Sydney, Sydney, NSW, Australia. Rogers, C. A., Hancock, G. J. (1997a). "Bolted Connection Tests of Thin GSSO and G300 Sheet Steels", Res. Rep. No.
R749, Dept. ofCiv. Engrg., Univ. of Sydney, Sydney, NSW, Australia.
547
Rogers, C. A., Hancock, G. 1. (1997b). "Ducti1ity of G550 Sheet Steels in Tension", J. Struct. Engrg., ASCE, 123(12), 1586-1594.
Standards Australia (SA). (1989). "SM Loading Code, Part 1: Dead and Live Loads and Load Combinations - AS 1170.1", Sydney, NSW, Australia.
Standards Australia (SA). (993). "Steel sheet and strip - Hot-dipped zinc-coated or aluminium/zinc coated - AS 1397", Sydney, NSW, Australia.
Standards Australia I Standards New Zealand (SAlSNZ). (1996). "Cold-formed steel structures - ASINZS 4600", Sydney, NSW, Australia.
Standards New Zealand (SNZ). (1992). "Code of Practice for General Structural Design and Design Loadings for Buildings - NZS 4203", Wellington, New Zealand.
Winter, G. (1956). "Tests on Bolted Connections in Light Gage Steel", J. Struct. Div., ASCE, 82(2), 920-1 - 920-25. Zadanfarrokh,F., Bryan, E. R. (1992). "Testing and Design of Bolted Connections in Cold Formed Steel Sections",
Proceedings of the 11 th International Speciality Conference on Cold-Formed Steel Structures, W. W. Yu, R. A. LaBoube, eds., University of Missouri-Rolla, Rolla, MO, USA, 625-662.