Behaviour of Self Compacting Concrete mixed with different...
12
Benzaid and Benmarce, JMES, 2017, 8 (9), pp. 3081-3092 3081 JMES, 2017 Volume 8, Issue 9, Page 3081-3092 http://www.jmaterenvironsci.com / 1. Introduction The main benefit of using Self-Compacting Concrete (SCC) stems from the fact that it has a high workability and can be placed into formwork without vibration [1]. SCC offers several advantages in technical, economical and environmental terms. When comparing traditional concrete or simply Vibrated Concrete (VC), SCC has larger paste volume, higher mineral admixtures content and ratio of coarse to fine aggregates close to 1 [2]. One of the disadvantages of SCCisits cost, associated to chemical admixtures and high volumes of Portland cement. One alternative to reduce the cost of SCCisthe use of mineral additives such as limestone powder, pozzolans and ground granulated blast furnace slag (GGBFS), which are finely ground materials added to concrete as separate ingredients either before or during mixing. Self compacting concrete (SCC) mixes always contain often a large quantity of powder materials and/or viscosity-modifying admixtures. However, these mineral admixtures can be efficiently utilized as viscosity enhancers particularly in powder-type SCC. According to many authors including [3,4], the successful utilization of lime powder or GGBFS in SCC could turn these materials into a precious resource. Moreover, it is well established that the mineral additives, such as GGBFS, may increase the workability, durability and long- term properties of concrete, reduce the heat of hydration and give slower strength development which can reduce thermal stresses. Most of the previous studies, where the partial replacement of clinker by pozzolanic or latent hydraulic industrial by-products such as ground granulated blast furnace slag (GGBFS) or non pozzolanic filler such as limestone powder was the main concern. Indeed, these materials lower the cost of cement by saving energy in the production process and also reduce CO 2 emissions from the cement plant and offer a low priced solution to the environmental problem of depositing industrial wastes [5-9]. However, just a few investigations have been reported on the properties of SCC when exposed to high temperatures [10]. When fire occur, concrete is exposed to high temperature that causes a material degradation: Journal of Materials and Environmental Sciences ISSN : 2028-2508 Copyright © 2017, University of Mohammed 1er Oujda Morocco Behaviour of Self Compacting Concrete mixed with different additions at high-temperature Mehdi Benzaid *, Abdelaziz Benmarce Laboratoire de Génie Civil et Hydraulique. Université du 8 Mai 1945, BP401, 24000 Guelma, Algérie Abstract The development of self-compacting concrete (SCC) has recently been one of the most important developments in building industry. SCC offers several advantages in technical, economical and environmental terms. SCC demands a large amount of powder content compared to conventional vibrated concrete (VC) to produce a homogeneous and cohesive mix. A large number of papers dealing with the subject has been published but very little has been done on SCC incorporating mineral admixtures, at high temperature. To this end, three groups of concrete were selected and analysed. The first group was a non-pozzolanic filler (limestone powder) while the second group was a pozzolanic filler (Ground granulated blast- furnace slag) to be compared with the third group of vibrated concrete. Mechanical and physical properties were studied before and after heating. Compressive strength, flexural tensile strength, dynamic elastic modulus, mass loss, porosity, Image analysis, air permeability and water penetration were studied. Specimens were subjected to various heating temperatures (20°C, 105°C, 250 °C, 400°C, 600°C and 800 °C) with a heating rate of 1°C/min. A stability phase varying from one hour to two hours (600°C and 800°C), was applied in order to spread the temperature all over the specimens, then a cooling phase until ambient temperature. The results indicated similar material behaviour of SCC and VC at high temperature when spalling did not occur. Received 27Jun 2016, Revised 21Sep 2016, Accepted 29Sep2016 Keywords Self-Compacting Concrete physical properties mechanical properties high-temperature [email protected] Tel: +213 (0)7 97 48 03 94
Transcript of Behaviour of Self Compacting Concrete mixed with different...

Benzaid and Benmarce, JMES, 2017, 8 (9), pp. 3081-3092 3081
JMES, 2017 Volume 8, Issue 9, Page 3081-3092
http://www.jmaterenvironsci.com/
1. Introduction The main benefit of using Self-Compacting Concrete (SCC) stems from the fact that it has a high workability
and can be placed into formwork without vibration [1]. SCC offers several advantages in technical, economical
and environmental terms. When comparing traditional concrete or simply Vibrated Concrete (VC), SCC has
larger paste volume, higher mineral admixtures content and ratio of coarse to fine aggregates close to 1 [2]. One
of the disadvantages of SCCisits cost, associated to chemical admixtures and high volumes of Portland cement.
One alternative to reduce the cost of SCCisthe use of mineral additives such as limestone powder, pozzolans and
ground granulated blast furnace slag (GGBFS), which are finely ground materials added to concrete as separate
ingredients either before or during mixing.
Self compacting concrete (SCC) mixes always contain often a large quantity of powder materials and/or
viscosity-modifying admixtures. However, these mineral admixtures can be efficiently utilized as viscosity
enhancers particularly in powder-type SCC. According to many authors including [3,4], the successful
utilization of lime powder or GGBFS in SCC could turn these materials into a precious resource. Moreover, it is
well established that the mineral additives, such as GGBFS, may increase the workability, durability and long-
term properties of concrete, reduce the heat of hydration and give slower strength development which can
reduce thermal stresses.
Most of the previous studies, where the partial replacement of clinker by pozzolanic or latent hydraulic
industrial by-products such as ground granulated blast furnace slag (GGBFS) or non pozzolanic filler such as
limestone powder was the main concern. Indeed, these materials lower the cost of cement by saving energy in
the production process and also reduce CO2 emissions from the cement plant and offer a low priced solution to
the environmental problem of depositing industrial wastes [5-9].
However, just a few investigations have been reported on the properties of SCC when exposed to high
temperatures [10]. When fire occur, concrete is exposed to high temperature that causes a material degradation:
Journal of Materials and Environmental Sciences ISSN : 2028-2508
Copyright © 2017,
University of Mohammed 1er
Oujda Morocco
Behaviour of Self Compacting Concrete mixed with different additions
at high-temperature
Mehdi Benzaid *, Abdelaziz Benmarce
Laboratoire de Génie Civil et Hydraulique. Université du 8 Mai 1945, BP401, 24000 Guelma, Algérie
Abstract
The development of self-compacting concrete (SCC) has recently been one of the most
important developments in building industry. SCC offers several advantages in technical,
economical and environmental terms. SCC demands a large amount of powder content
compared to conventional vibrated concrete (VC) to produce a homogeneous and cohesive
mix. A large number of papers dealing with the subject has been published but very little has
been done on SCC incorporating mineral admixtures, at high temperature. To this end, three
groups of concrete were selected and analysed. The first group was a non-pozzolanic filler
(limestone powder) while the second group was a pozzolanic filler (Ground granulated blast-
furnace slag) to be compared with the third group of vibrated concrete. Mechanical and
physical properties were studied before and after heating. Compressive strength, flexural
tensile strength, dynamic elastic modulus, mass loss, porosity, Image analysis, air
permeability and water penetration were studied. Specimens were subjected to various heating
temperatures (20°C, 105°C, 250 °C, 400°C, 600°C and 800 °C) with a heating rate of
1°C/min. A stability phase varying from one hour to two hours (600°C and 800°C), was
applied in order to spread the temperature all over the specimens, then a cooling phase until
ambient temperature. The results indicated similar material behaviour of SCC and VC at high
temperature when spalling did not occur.
Received 27Jun 2016,
Revised 21Sep 2016,
Accepted 29Sep2016
Keywords
Self-Compacting
Concrete
physical properties
mechanical properties
high-temperature
Tel: +213 (0)7 97 48 03 94

Benzaid and Benmarce, JMES, 2017, 8 (9), pp. 3081-3092 3082
strength decrease, cracking, and even spalling can occur [11]. To evaluating fire resistance of a structural
system, we need to have a good knowledge on high temperature properties of constituent materials [12].
This has motivated the authors to perform the present research work, taking into account the effect of
temperature on physical and mechanical behaviour using different additives in order to improve SCC when
exposed to fire. The objective of this paper is to report the main outcomes of a parametric experimental study on
the behaviour of SCC incorporating limestone filler (SCC1) and Granulated Ground Blast Furnace Slag
(GGBFS) designated as (SCC2). The research program included testing of more than 70 SCC specimens
subjected to a low heating rate. The detailed fabrication and testing program at civil engineering & hydraulics
laboratory in GuelmaUniversity, are reported herein. Three mixes were investigated, VC, and two SCC mixes
containing limestone filler and GGBFS respectively.
2. Experimental details 2.1. Materials and mix proportions
2.1.1 Cement
The cement used in this study was CPJ-CEM II/A 42.5 R, which comes from H'djar Essoud plant (North
Algeria). The physical properties and chemical composition of cement are given in table 1 and table 3
respectively.
Table 1 Physical properties of cement.
Physical properties
Blaine specific
surface
(m2/kg)
Absolutedensity
abs (g/cm3)
Bulk
density
blk (g/cm3)
Compressive strength at
28 days (Standard mortar)
(MPa)
CPJ CEM II/A 42.5
R 370 3.1 1.12 42.5
2.1.2. Aggregates
Crushed coarse sand-lime gravel (5/15) from Maouna quarry (Guelma) and fine quarry sand (0/5) from Oum Ali
quarry (Tebessa) were used. The physical characteristics of gravel and sand are represented in table 3. The
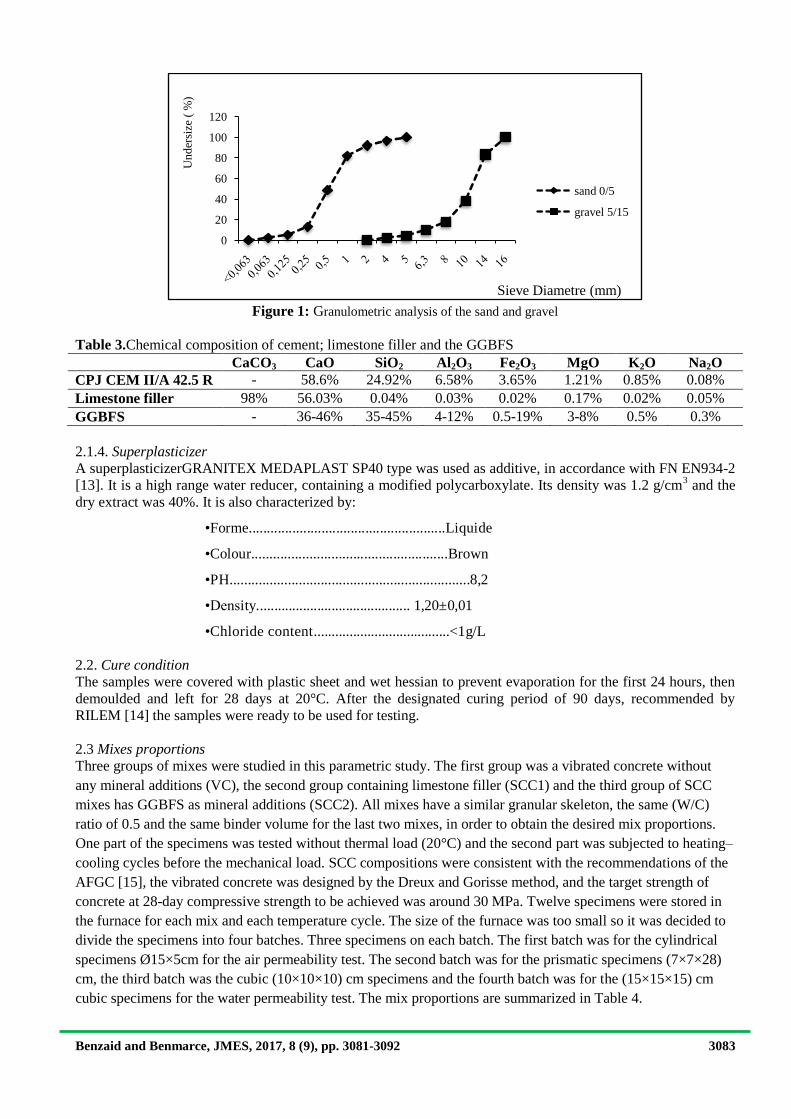
granulometric analysis of the sand and gravel are shown in figure 1.
Table 2Physical characteristics of aggregates
Tests Gravel Sand
Bulk Density blk (Kg/m3) 1440 1590
Absolute Density abs(Kg/m3) 2826 2500
Porosity E - 0.392
Cleanliness P (%) 0.6 -
Water content W (%) 2.5 16.13
Los Angeles test (%) 20.5 -
Water absorption (%) 2.59 -
Compactness C - 0.608
Sand equivalent (%) - 80
2.1.3 Mineral additions
a) Limestone filler
The limestone filler used was from the ENG quarry of El Khroub (Constantine). The loss on ignition is 43% and
its main characteristics are giving in table 3.
b) Ground granulated blast-furnace slag
GGBFS comes from Mittal steel plant of El Hadjar. Its main characteristics are giving in table 3.
Benzaid and Benmarce, JMES, 2017, 8 (9), pp. 3081-3092 3083
Figure 1: Granulometric analysis of the sand and gravel
Table 3.Chemical composition of cement; limestone filler and the GGBFS
CaCO3 CaO SiO2 Al2O3 Fe2O3 MgO K2O Na2O
CPJ CEM II/A 42.5 R - 58.6% 24.92% 6.58% 3.65% 1.21% 0.85% 0.08%
Limestone filler 98% 56.03% 0.04% 0.03% 0.02% 0.17% 0.02% 0.05%
GGBFS - 36-46% 35-45% 4-12% 0.5-19% 3-8% 0.5% 0.3%
2.1.4. Superplasticizer
A superplasticizerGRANITEX MEDAPLAST SP40 type was used as additive, in accordance with FN EN934-2
[13]. It is a high range water reducer, containing a modified polycarboxylate. Its density was 1.2 g/cm3 and the
dry extract was 40%. It is also characterized by:
•Forme......................................................Liquide
•Colour......................................................Brown
•PH..................................................................8,2
•Density........................................... 1,20±0,01
•Chloride content......................................<1g/L
2.2. Cure condition
The samples were covered with plastic sheet and wet hessian to prevent evaporation for the first 24 hours, then
demoulded and left for 28 days at 20°C. After the designated curing period of 90 days, recommended by
RILEM [14] the samples were ready to be used for testing.
2.3 Mixes proportions
Three groups of mixes were studied in this parametric study. The first group was a vibrated concrete without
any mineral additions (VC), the second group containing limestone filler (SCC1) and the third group of SCC
mixes has GGBFS as mineral additions (SCC2). All mixes have a similar granular skeleton, the same (W/C)
ratio of 0.5 and the same binder volume for the last two mixes, in order to obtain the desired mix proportions.
One part of the specimens was tested without thermal load (20°C) and the second part was subjected to heating–
cooling cycles before the mechanical load. SCC compositions were consistent with the recommendations of the
AFGC [15], the vibrated concrete was designed by the Dreux and Gorisse method, and the target strength of
concrete at 28-day compressive strength to be achieved was around 30 MPa. Twelve specimens were stored in
the furnace for each mix and each temperature cycle. The size of the furnace was too small so it was decided to
divide the specimens into four batches. Three specimens on each batch. The first batch was for the cylindrical
specimens Ø15×5cm for the air permeability test. The second batch was for the prismatic specimens (7×7×28)
cm, the third batch was the cubic (10×10×10) cm specimens and the fourth batch was for the (15×15×15) cm
cubic specimens for the water permeability test. The mix proportions are summarized in Table 4.
0
20
40
60
80
100
120
Un
der
size
( %
)
Sieve Diametre (mm)
sand 0/5
gravel 5/15
Benzaid and Benmarce, JMES, 2017, 8 (9), pp. 3081-3092 3084
Table 4.SSC mix proportions
Ingredients Quantity (kg/m
3)
VC SCC1 SCC2
Water 200 200 200
Cement 400 400 400
GGBFS - - 80
Limestone filler
80
Gravel 5/15 1100 865 865
Natural sand 640 765 765
Superplasticizer - 6.8 6.8
W/C 0.50 0.50 0.50
Slump test (cm) 13.83 68 70
L-Box test - 0.89 0.84
Sieve stability test (%) - 12.69 9.27
Compressive
Strength (MPa) at
room temperature*
7days 17.79 18.02 19.39
28days 28.18 30.5 34.57
90days 34.81 35.40 41.73
3. Experimental procedure
3.1 Heating–cooling cycles
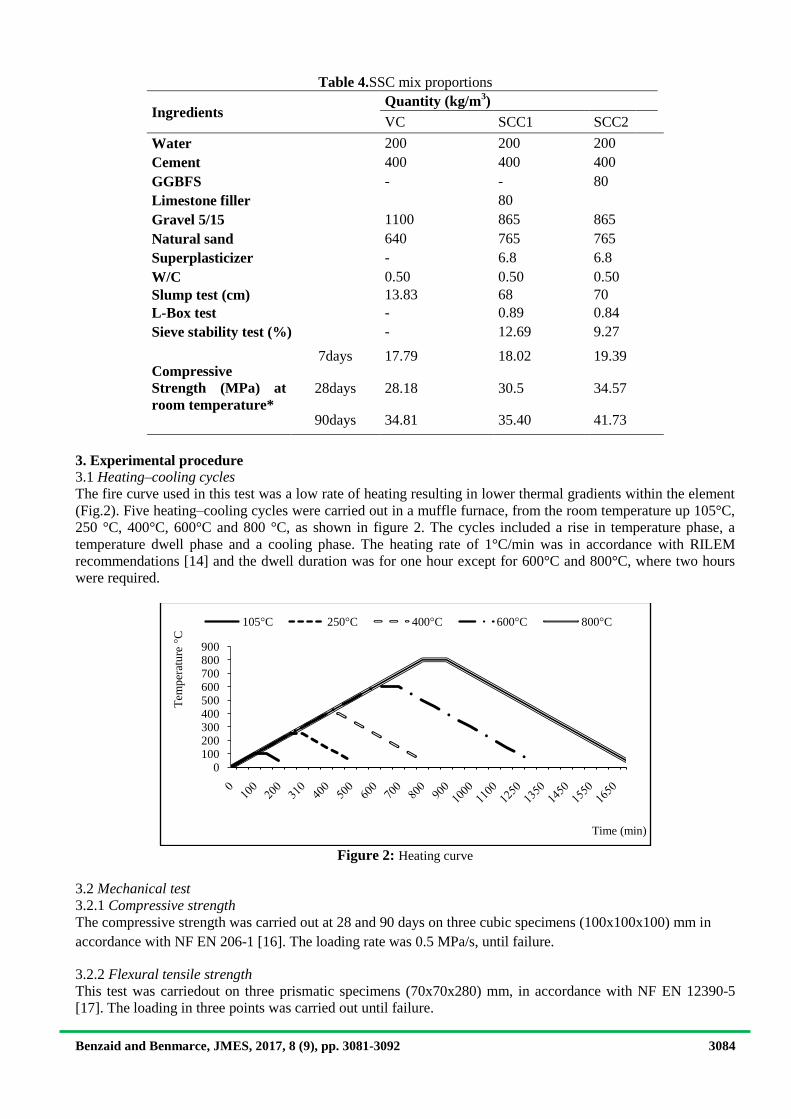
The fire curve used in this test was a low rate of heating resulting in lower thermal gradients within the element
(Fig.2). Five heating–cooling cycles were carried out in a muffle furnace, from the room temperature up 105°C,
250 °C, 400°C, 600°C and 800 °C, as shown in figure 2. The cycles included a rise in temperature phase, a
temperature dwell phase and a cooling phase. The heating rate of 1°C/min was in accordance with RILEM
recommendations [14] and the dwell duration was for one hour except for 600°C and 800°C, where two hours
were required.
Figure 2: Heating curve
3.2 Mechanical test
3.2.1 Compressive strength
The compressive strength was carried out at 28 and 90 days on three cubic specimens (100x100x100) mm in
accordance with NF EN 206-1 [16]. The loading rate was 0.5 MPa/s, until failure.
3.2.2 Flexural tensile strength
This test was carriedout on three prismatic specimens (70x70x280) mm, in accordance with NF EN 12390-5
[17]. The loading in three points was carried out until failure.
0100200300400500600700800900
Tem
per
atu
re °
C
Time (min)
105°C 250°C 400°C 600°C 800°C

Benzaid and Benmarce, JMES, 2017, 8 (9), pp. 3081-3092 3085
3.2.3 Modulus of elasticity
The modulus of elasticity was obtained on three cubic specimens (150x150x150) mm, using a non-destructive
test. Eq. (1) was used to calculate this modulus according to NF P 18-418 [18]:
1
11. 2VE
app (1)
Where E: dynamic elastic modulus (MPa); ρApp:Absolute volumetric mass of concrete (Kg/m3); V: Wave
propagation velocity (m/s); υ: Dynamic Poisson’s ratio and υ = 0.2
3.3. Physical properties
3.3.1 Mass loss
The specimens were weighed before and after each heating–cooling cycle in order to determine the mass loss
during this test. The concrete mass loss was obtained on three cubic specimens (150x150x150) mm.
3.3.2. Porosity and density
The density and the total porosity of different mixes were measured on three samples before and after each
temperature cycle and each mix then reported herein. The testing conditions were similar to the
recommendations of AFPC-AFREM [19].
3.3.3. Image analysis
For this experience, the cubic specimens (15x15x15) was split into 2 part then a picture of the inside of the
specimen was took. After that, we sketched the picture using Photoshop to eliminate the cement paste and turn it
into a white and black picture so we can see only the gravel and the pores. Finally, we analysed the pictures and
comment the changes in porosity and the liaisons between gravel and the cement paste.
3.3.4. Permeability
3.3.4.1. Permeability to air
Cylindrical specimens of Ø15×5 cm were used in order to measure the permeability to air. The permeability
obtained after each temperature cycle was determined and compared to that obtained with dried specimens
stored at 75 °C until constant mass [20]. A CEMBUREAU permeameterwas used to measure the permeability to
air [21]. In order to determine the intrinsic permeability, Klinkenberg correction equation [22] was used, since
the test of permeability gives the apparent permeability.The equation of Klinkenberg corrected permeability.
𝐾𝑎 = 𝐾𝑣 [1 +𝑏∗
𝑃] (2)
With:
Ka: apparent permeability (m2)
Kv: intrinsic permeability (m2)
b*: Klinkenberg coefficient
P: average pressure (Pa).
3.3.4.2. Water penetration test
The water penetration test was conducted as specified in European standard EN 12390-8 [23], squirting water
on to one of the faces of the specimen at a pressure of 500 ± 50 kPa for 72 hours. The specimen was then split
along a diametrical plane and the depth of water penetration measured.
4. Results and discussion Compressive strength, flexural tensile strength, dynamic modulus of elasticity and mass loss were studied as
function of the surface temperature of the heated specimens and shown in (Fig. 3, 4, 5 & 6 respectively). Table 4
shows the properties of the concretes at fresh state and also some initial mechanical properties obtained on
unheated specimens. For all groups of concretes, no explosive spallingwas observed. The only spalling
phenomenon observed after the various heating–cooling cycles was the aggregates splitting and corner
separation on prismatic specimen. The residual properties, measured after heating and cooling cycles, were
compared to the initial properties.

Benzaid and Benmarce, JMES, 2017, 8 (9), pp. 3081-3092 3086
4.1 Mechanical test
4.1.1 Residual compressive strength
The variation of the relative residual compressive strength against the heating temperature are represented in the
Figure 3 where we compare our result with the result of the Eurocode 4.1.2 Annex C, [24] representing the
relative residual compressive strength evolution with temperature on vibrated concretes.It can be noticed from
this figure that SCC1 shows similar resistance to those of the vibrated concrete VC at different temperatures
other than the temperature of 400 ° C, where there is a drop in resistance compared to VC. The SCC2 present a
different behaviour with greater resistance falls than in VC to 250 ° C and similar behaviour beyond this
temperature.
The compressive strength differed between the three concretes depending on the lime fines used in the mix:
After a slight decrease for SCC1 (containing limestone filler) and a sharp decrease for SCC2 (GGBFS), between
20°C and 250°C, a moderate increase (around 30%) was noticed for SCC1, whereas less than 6% increase for
SCC1, between 250°C and 400°C.
According to many authors, including [25-28] the increase in the compressive strength of SCC is, precisely at
this stage, due to a modification of the bonding properties of the hydrates of the cement paste. According to
Khoury [28], this increase is due to the silanol groups that lose a part of their bonds with water, which induces
the creation of shorter and stronger siloxane elements (Si–O–Si) with probably larger surface energies that
contribute to the increase in strength. A deeper study of the evolution of the concrete microstructure with
temperature is in progress in order to better understand this strength increase. The decrease in strength has
already been noticed in the literature [25-28]. Beyond 400 °C, a continuous decrease in compressive strength
was observed for all the mixes.
Figure 3: Relative residual compressive strength
4.1.2. Residual flexural strength
The variation of the residual flexural strength against the temperature is shown in Figure 4 . The flexural tensile
strength decreases gradually with the rise in temperature for all concrete groups. The general trend of the
residual flexural strength is that, a decrease of residual tension strength for all concretes. However, it cannot be
concluded that the evolution of residual flexural strength with temperature is the same for all the studied
concretes. These results agree with those showed by [11, 29] with micro hardness test on ordinary concrete.
Because of the many cracks (both micro and macro cracks) produced in the specimens due to the thermal
incompatibility between aggregates and cement paste the loss of tensile strength for SCC subjected to high
temperatures was clearly different from the loss of compressive strength, as reported by many authors including
[11, 28&30]. Nonetheless, although the discrepancies recorded were under 10% in all cases, flexural
performance differed between the three concretes depending on the lime fines used in the mix. In fact, adding
both GGBSF and limestone filler to SCC reduced the flexural strength.
4.1.3. Dynamic modulus of elasticity
Figure 5 shows the variation of the dynamic modulus of elasticity or each mix against the heating temperature.
The dynamic modulus of elasticity of the studied concretes decreases continuously regardless the type of
addition, as the heating temperature rises. The evolution of the residual modulus of elasticity is almost the same
for all the concretes groups.
0
0.2
0.4
0.6
0.8
1
1.2
1.4
20 105 250 400 600 800
FcT
/ F
c20
Temperature °C
VC SCC1 SCC2 EC4.1-2 ANNEXE C

Benzaid and Benmarce, JMES, 2017, 8 (9), pp. 3081-3092 3087
Figure 4: Residual flexural strength against temperature
It has to be noted that between 20°C and 250°C corresponding to a regular decrease in modulus of elasticity. At
this stage, all the SCC showed a modulus of elasticity higher than 50% of the initial modulus of elasticity, which
can be explained by the appearance of some hairy cracks (microcracks) in the specimens. Beyond 250°C, which
corresponds to a small modulus of elasticity (82% at 400°C). Further heating a lot of cracks were observed
which damage more the specimens and the dynamic modulus of elasticity. As reported by many authors
including [11, 31&32] noted a loss of modulus of elasticity about 70%-95% at 300°C. After 400°C and 600°C,
concretes do no longer possess stiffness and therefore, the modulus of elasticity can be considered negligible.
Figure 5:T he dynamic modulus of elasticity against the heating temperature
4.2. Physical and chemical properties
4.2.1. Concrete mass loss
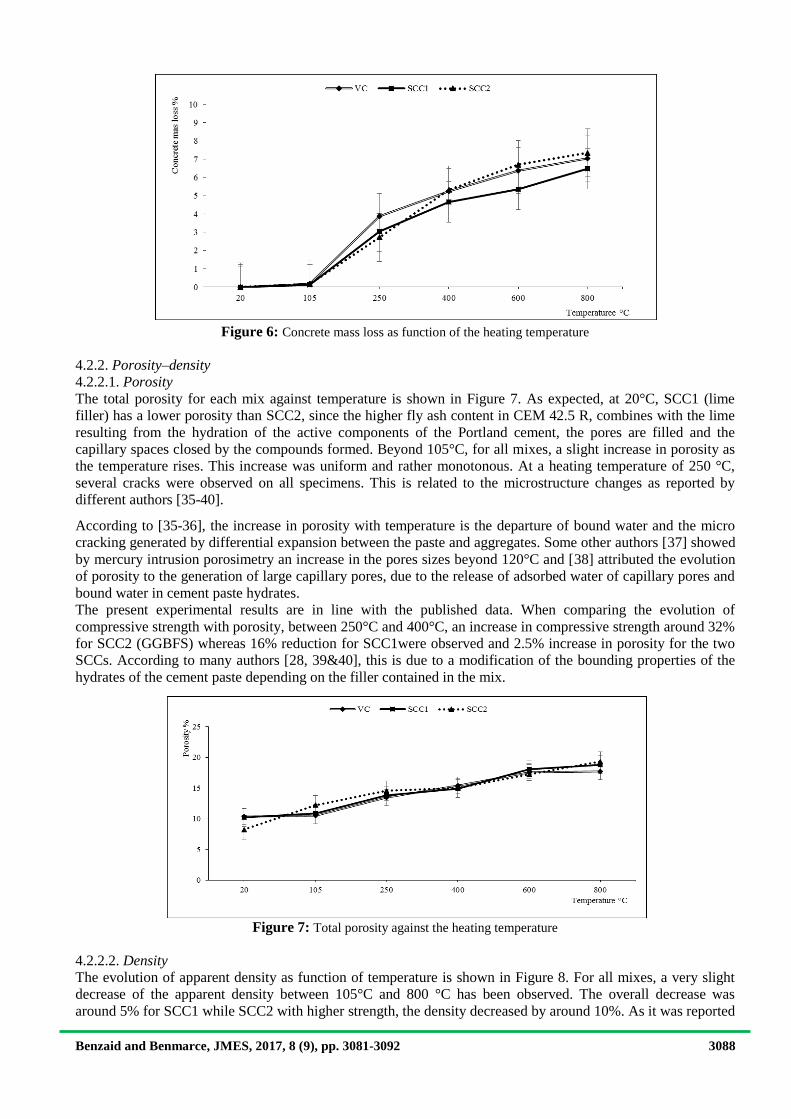
Figure 6 shows the mass loss as function of the heating temperature. The general trend of this graph is almost
the same for the three groups of concrete. Between 20°C and 250 °C, the variation of mass is weak. This mass
loss represents the departure of free water contained in the capillary pores. Between 250°C and 600 °C, an
increase in mass loss corresponding to 4% of the initial mass can be observed for all concretes except for SSC2
where the mass loss was less important than the other two specimens. More than 70% of all the water contained
in the concretes has been evaporated at 400 °C.
The mass loss curve for the two concretes is therefore very similar, except SCC1, which contained lime filler.
The present results are in line with the published data [11, 33 and 34]. It can be noted that an increase in mass
loss for all their concretes between 250 and 400 °C is around 2%.
0
0.2
0.4
0.6
0.8
1
1.2
1.4
20 105 250 400 600 800
FtT
/ Ft
20
Temperature (°C)
VC SCC1 SCC2 Eurocode
0
0.2
0.4
0.6
0.8
1
1.2
1.4
20 105 250 400 600 800
ET/
E20
Temperature (°C)
VC SCC1 SCC2 Eurocode
Benzaid and Benmarce, JMES, 2017, 8 (9), pp. 3081-3092 3088
Figure 6: Concrete mass loss as function of the heating temperature
4.2.2. Porosity–density
4.2.2.1. Porosity
The total porosity for each mix against temperature is shown in Figure 7. As expected, at 20°C, SCC1 (lime
filler) has a lower porosity than SCC2, since the higher fly ash content in CEM 42.5 R, combines with the lime
resulting from the hydration of the active components of the Portland cement, the pores are filled and the
capillary spaces closed by the compounds formed. Beyond 105°C, for all mixes, a slight increase in porosity as
the temperature rises. This increase was uniform and rather monotonous. At a heating temperature of 250 °C,
several cracks were observed on all specimens. This is related to the microstructure changes as reported by
different authors [35-40].
According to [35-36], the increase in porosity with temperature is the departure of bound water and the micro
cracking generated by differential expansion between the paste and aggregates. Some other authors [37] showed
by mercury intrusion porosimetry an increase in the pores sizes beyond 120°C and [38] attributed the evolution
of porosity to the generation of large capillary pores, due to the release of adsorbed water of capillary pores and
bound water in cement paste hydrates.
The present experimental results are in line with the published data. When comparing the evolution of
compressive strength with porosity, between 250°C and 400°C, an increase in compressive strength around 32%
for SCC2 (GGBFS) whereas 16% reduction for SCC1were observed and 2.5% increase in porosity for the two
SCCs. According to many authors [28, 39&40], this is due to a modification of the bounding properties of the
hydrates of the cement paste depending on the filler contained in the mix.
Figure 7: Total porosity against the heating temperature
4.2.2.2. Density
The evolution of apparent density as function of temperature is shown in Figure 8. For all mixes, a very slight
decrease of the apparent density between 105°C and 800 °C has been observed. The overall decrease was
around 5% for SCC1 while SCC2 with higher strength, the density decreased by around 10%. As it was reported
Benzaid and Benmarce, JMES, 2017, 8 (9), pp. 3081-3092 3089
by many authors including [41-43], the reduction in density is due to the departure of water during heating or
thermal expansion of concrete.
Figure 8: Evolution of apparent density as a function of temperature
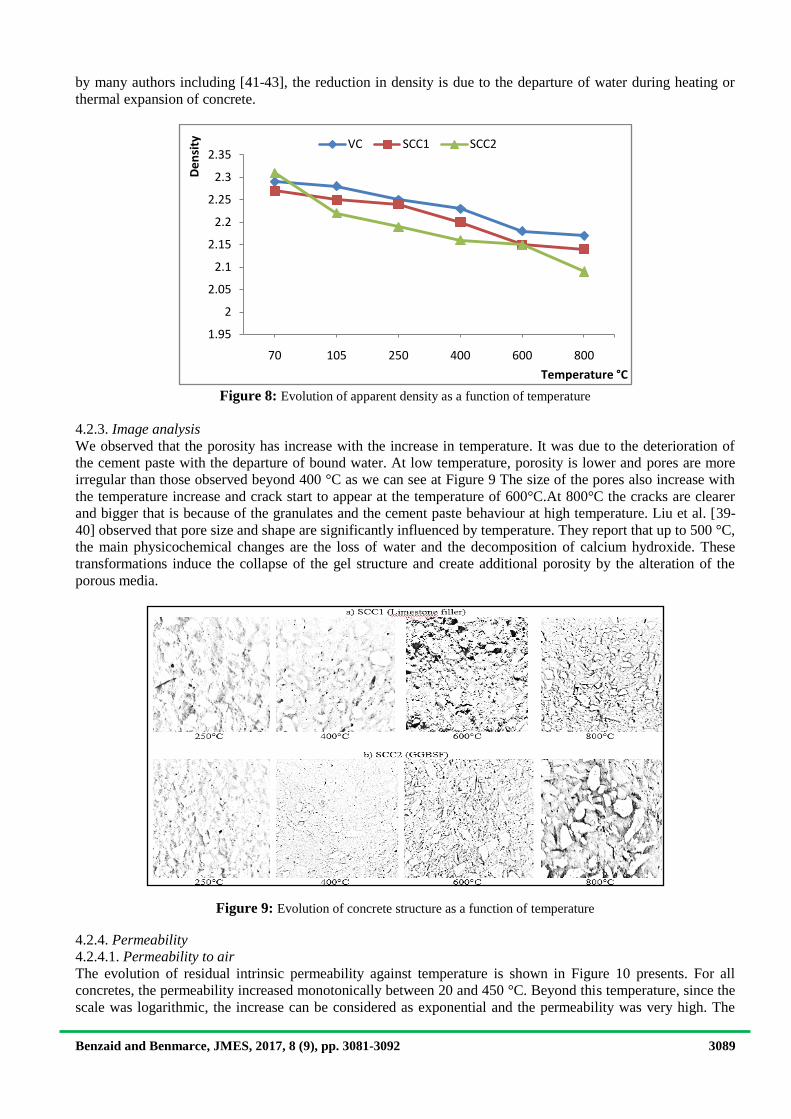
4.2.3. Image analysis
We observed that the porosity has increase with the increase in temperature. It was due to the deterioration of
the cement paste with the departure of bound water. At low temperature, porosity is lower and pores are more
irregular than those observed beyond 400 °C as we can see at Figure 9 The size of the pores also increase with
the temperature increase and crack start to appear at the temperature of 600°C.At 800°C the cracks are clearer
and bigger that is because of the granulates and the cement paste behaviour at high temperature. Liu et al. [39-
40] observed that pore size and shape are significantly influenced by temperature. They report that up to 500 °C,
the main physicochemical changes are the loss of water and the decomposition of calcium hydroxide. These
transformations induce the collapse of the gel structure and create additional porosity by the alteration of the
porous media.
Figure 9: Evolution of concrete structure as a function of temperature
4.2.4. Permeability
4.2.4.1. Permeability to air
The evolution of residual intrinsic permeability against temperature is shown in Figure 10 presents. For all
concretes, the permeability increased monotonically between 20 and 450 °C. Beyond this temperature, since the
scale was logarithmic, the increase can be considered as exponential and the permeability was very high. The
1.95
2
2.05
2.1
2.15
2.2
2.25
2.3
2.35
70 105 250 400 600 800
De
nsi
ty
Temperature °C
VC SCC1 SCC2

Benzaid and Benmarce, JMES, 2017, 8 (9), pp. 3081-3092 3090
specimens showed a dense network of open cracks. Thus, the values obtained at 600 and 800°C can include a
large error.
Between 20 and 105 °C, for all concretes, the permeability to air increased sharply with an average factor of 10,
for all specimens. Between 105 and 250 °C, the variation was almost constant for SCC1 and increased with a
factor of 1.5 for VC and 12 for SCC2. Between 250 and 400 °C, the variation was rather complex. Beyond 250
°C and up to 400°C, there was a high increase in permeability to air, after a small variation of the permeability
between 105 and 250°C, exactly the same behaviour as in the compressive strength. Hence, there were
similarities between permeability to air and compressive strength. As reported by many authors including [38,
39, 43&44], at these temperatures the creation of pores modify the connectivity of the porous network with the
expansion of the capillary pores and that lead to the evolution of permeability. These phenomena contribute to
the increase in capillary pores sizes and to the generation of fine cracks. Therefore, the connectivity of the pores
and micro cracks are the major factors, which determine the permeability of concrete subjected to high
temperature. Beyond 400°C, micro cracks become the major factor influencing the permeability.
Figure 10: Residual intrinsic permeability as a function of temperature
4.2.4.2. Water penetration test
Figure 11, shows the water penetration as a function of temperature. After 72 hours of testing, all specimens had
failed by splitting. As it can be seen from this figure that the water penetration into the concrete, after a small
increase or a stabilisation between 20°C and 105°C. Beyond this temperature, a monotonically increase of water
penetration between 105°C and 400°C, whatever the mix. Beyound 400°C the specimens spalled under the
pressure of the water because of the macro crack and the increase of the porosity and the degradation of the
specimens.
Figure 11: Water penetration as a function of temperature
1E-18
1E-17
1E-16
1E-15
1E-1420 105 250 400 600
Pe
rme
bili
ty (
m2
)
Temperature °CVC SCC1 SCC2
02468
101214161820
20 105 250 400
Wat
er
pe
ne
trat
ion
(cm
)
Temperature °C
VC SCC1 SCC2

Benzaid and Benmarce, JMES, 2017, 8 (9), pp. 3081-3092 3091
Conclusions The effect of filler types on physical and mechanical of self compacting concrete at high-temperature has been
analyzed and studied on three groups of concretes. The residual mechanical and physical properties were
determined after different heating cycles up to 105, 250, 400, 600 and 800°C. The heating rate of 1°C/min was
in accordance with RILEM recommendations [14] and the dwell duration was for one hour except for 600°C
and 800°C, where two hours were required. The following conclusions can be drawn from the experimental
results:
The mechanical properties (compressive strength, flexural tensile strength, dynamic modulus of
elasticity) of the tested concretes generally decreased with the rise in temperature.
Adding GGBFS to SCC had little effect on the relative residual compressive strength as well as on the
mass loss, when compared to SCC containing limestone filler and VC. In fact, adding GGBFS did
accelerate the reduction of flexural tensile strength between 105°C and 250°C. However, given the
dispersion of the results, it cannot be concluded that the evolution of residual flexural strength with
temperature is the same for all the studied concretes.
Between the ambient temperature and 250 °C, a small loss of strength was noted. This loss of strength
corresponds to the evaporation of free water contained in the capillary pores and it was associated to an
increase of total porosity for all tested concretes. This increase in porosity can be explained as an
expansion of the pore diameters, hence an increase in the permeability.
Between 250 and 400 °C, an important increase in compressive strength for SCC was observed,
whereas the other mechanical properties decreased as the temperature risen. The increase in the
compressive strength of SCC is due to a modification of the bonding properties of the cement paste.
Beyond 400 °C, the mechanical and physical properties of all groups of concrete decreased sharply. At a
heating temperature of 600°C all specimens showed some microcracks, but there was no spalling. An
increase in permeability and porosity of all tested concretes was observed which could be explained as a
change in the porous network.
Acknowledgments-The authors are pleased to acknowledge the Laboratory of Civil Engineering and Hydraulics of 8 Mai 1945
university. We are also pleased to acknowledge LNHC laboratory;Arcelormittal and the big carry in Khroub.
References 1. Assié S., Doc. Thes. (French), INSA. Toulouse. (2004)
2. Okamura H. & Ouchi M., J. Adv. Conc. Tech. 1 (2003) 5-15.
3. M. Sahmaran, H.A. Christianto, I.O. Yaman, Cem. Concr. Compos. 28 (2006) 432–440
4. Bilodeau A, Malhotra VM., ACI. Mater J. 97 (2000) 41–8.
5. TopcuIlker B, BogaAhmet R., Mater. Des. 31 (2010) 3358–65
6. Hafez E. Elyamany, AbdElmoaty M. AbdElmoaty, Basma Mohamed, Alex. Eng. J. 53 (2014) 295–307
7. Dinakar P., Kali PrasannaSethy, Umesh C. Sahoo, Mat. Design. 43 (2013) 161–169
8. Hirde S. and P. Gorse, Inter. J. Current Eng. Tech. 5 (2015) 1677-1682
9. Lamrani S., L. Ben allal, M. Ammari, A. Azmani, J. Mater. Environ. Sci. 5 (2) (2014) 450-455
10. Ye G., Liu X., De Schutter G., Taerwe L., Vandevelde P., Cem. Conc. Res. 37 (2007) 978–987.
11. Hana F. &Noumowe A., Cem. Conc. Res. 39 (2009) 1230–1238
12. Khaliq W. & W. Kodur, Cem. Conc. Res. 41 (2011) 1112–1122
13. NF EN934-2. AFNOR.(2012).
14. Rilem Technical Committees 129-MHT, Mater. Struc.28 (1995) 410–414.
15. AFGC, Sci. Tech. Doc. (2008).
16. NF EN 206-1. AFNOR. (2003).
17. NF EN 12390-5. AFNOR. (2001).
18. NF P 18-418. AFNOR. (1989).
19. AFPC-AFREM, INSA-LMDC, (1997) 11–12.
20. Choinska M., Doc. Thes (French), Ecole Centrale de Nantes (2006).
21. Kollek J.J., Mater. Struc.22 (1989) 225–230.
22. L.J. Klinkenberg, Amer. Petro. Ins. Drilling Prod. Practic. (1941) 200–214.
23. NF EN 12390-8.AFNOR. (2001).
24. Eurocode 4, NF EN 1994-1-2. AFNOR, (2005).
25. Kanema M., Doc. Thes (French), Univ. Cergy-Pontoise, (2007).
26. Phan L.T., Lawson J.R., Davis F.L., Mater. Struc. 34 (2001) 83–91

Benzaid and Benmarce, JMES, 2017, 8 (9), pp. 3081-3092 3092
27. Dias WPS, Khoury GA, Sullivan PJE; ACI. Mater. J. 87 (1990) 160–166.
28. Khoury G.A., Mag. Conc. Res. 44 (1992) 291–309.
29. Xu Y., Wong Y.L., Poon C.S., Anson M., Cem. Conc. Res. 31 (2001) 1065–1073.
30. Mehta P.K., Monteiro P.J.M., Conc. Stru. Prop. Mater. (1993).
31. Persson B., Mater. Struc. 37 (2004) 575–584
32. Bamonte P., Gambarova G., ACI Spr. Conv. (2010).
33. Pathak&Siddique, Cons. Buil. Mater. 30 (2012) 274–280.
34. Uysal M., Yilmaz K., Ipek M., Cons. Buil. Mater. 28 (2012) 321–326.
35. Kalifa P., Tsimbrovska M., Cahier du CSTB n°3078, (1998)
36. Noumowé N.A., Doc. Thes (French), INSA de Lyon (1995).
37. Noumowé A.N., Clasters P., Debicki G., Costaz J.L., Nuc. Eng. Des. 166 (1996) 99–108.
38. Gallé C., Sercombe J., Mater. Struc. 34 (2001) 619–628.
39. Liu X., Ye G., De Schutter G., Yuan Y., Taerwe L., Cem. Conc. Res. 38 (2008) 487–499.
40. Liu X., Ye G., De Schutter G., Yuan Y., CONMOD'08. RILEM. Pro. 58 (2008) 439–446.
41. Kalifa P., Menneteau F.D., Quenard D., Cem. Conc. Res. 30 (2000) 1915–1927.
42. Gaweska H.I., Doc. Thes (croatia), E.N.P.C et E. Polytec. Croatia (2004).
43. Bazant Z.P., Kaplan M.F., Pearson Education (1996) 196.
44. Tsimbrovska M., Kalifa P., Quenard D., SMIRT 14. (1997) 475–482.
(2017) ; http://www.jmaterenvironsci.com