Behaviour of Nionikral-70 in low-cycle...
13
Vujadin Aleksić 1 , Ljubica Milović 2 , Bojana Aleksić 3 , Srđan Bulatović 4 , Zijah Burzić 5 , Abubaker M. Hemer 3 BEHAVIOUR OF NIONIKRAL-70 IN LOW-CYCLE FATIGUE NISKOCIKLI ČNI ZAMOR UZORAKA ČELIKA NIONIKRAL 70 Originalni naučni rad / Original scientific paper UDK /UDC: 669.15:539.431 Rad primljen / Paper received: 24.03.2017 Adresa autora / Author's address: 1) Materials Testing Institute, Belgrade, Serbia, email: [email protected] 2) University of Belgrade, Faculty of Technology and Metallurgy, Belgrade, Serbia 3) University of Belgrade, Innovation Centre of the Faculty of Technology and Metallurgy, Belgrade, Serbia 4) Accreditation Body of Serbia (ATS), Belgrade, Serbia 5) Military-Technical Institute, Belgrade, Serbia Keywords • high strength low-alloyed steel (HSLA) • low-cycle fatigue (LCF) • simulated heat affected zone (SHAZ) • Nionikral 70 (NN-70) Abstract Experimental research on the behaviour of high-strength low-alloy steel (HSLA) exposed to low-cycle fatigue (LCF) with controlled and fully reversible strain (/2 = const, R = min / max = –1) has been analysed. LCF tests are performed on a series of smooth bar shaped specimens, 11 11 95 mm, parent metal (PM), welded joint (WJ) and simulated heat affected zone (SHAZ) of steel Nionikral 70 (NN-70) with semi-amplitude of controlled strain, /2 = 0.40-0.80. The results of the experimental investigation have given us important information on the understanding of fatigue behaviour of steel NN-70 and its welded joints. In this work the results of static and dynamic-, that is monoto- nous and fatigue behaviour of the material, are compared, which is a practical contribution to the assessment of the behaviour of PM and WJ of steel NN-70 exposed to effects of low cycle fatigue, i.e. monotonous and fatigue behaviour of the material. Ključne reči • niskolegirani čelik povišene čvrstoće (HSLA) • niskociklični zamor (LCF) • simulirana zona uticaja toplote (SHAZ) • Nionikral 70 (NN-70) Izvod Analizirano je eksperimentalno istraživanje ponašanja uzoraka od niskolegiranog čelika povišene čvrstoće (HSLA) u uslovima niskocikličnog zamora (LCF), sa kontrolisanom i potpuno reverzibilnom deformacijom (/2 = const, R = min / max = –1). LCF ispitivanja obavljena su na seriji glat- kih epruveta paralelopipednog oblika, 11 11 95 mm, osnovnog metala (PM), realno zavarenog spoja (WJ) i simulirane zone uticaja toplote (SHAZ) čelika Nionikral 70 (NN-70), sa poluamplitudom kontrolisane deformacije, /2 = 0.40-0.80. Rezultati eksperimentalnih ispitivanja su nam dali važne podatke o razumevanju zamornog ponaša- nja čelika NN-70 i zavarenih spojeva izrađenih od ove vrste čelika. U radu je izvršeno i poređenje rezultata statičkog i dinamičkog, odnosno, monotonog i zamornog ponašanja materijala, što predstavlja praktični doprinos oceni pona- šanja PM i WJ čelika NN-70 u uslovima delovanja nisko- cikličnog zamora. INTRODUCTION Most damages on steel structures that lead to cata- strophic failures occur due to fatigue loads. Damages of fatigue type represent between 50% and 90% of all damages over the operating life of the structure, thus representing an important structural problem. A large number of machines and plant structures during their operating life have a relatively small number of cycles that last for a long time: various turbojet engines, highly- strained parts of turbines, wave-stricken parts of ship struc- ture, high-pressure vessels, piping, steam lines, gas pipe- lines, reactor plants and process installations, chemical and food industries, so that one can say that during their exploi- tation life they are exposed to the effects of variable load of the start-stop-start type, i.e. low-cycle fatigue. For low- cycle fatigue of materials, the values of variable load in critical areas exceed the value of yield stress, R p0.2 , i.e. after a relatively small number of cycles at these locations, the plastically strained zone start to develop. The fatigue life of the elements of such steel structures can be assessed by analysing the behaviour that includes processing data on load, geometry and the selected material used for manufacturing the element or structure. Large contributions to this analysis are provided from indicators of material behaviour when affected by LCF, which are determined by LCF tests. The steel NN-70, selected in this study to investigate the experimental behaviour of PM, WJ and SHAZ affected by fatigue loads, among other things, is used in shipbuilding and for the manufacture of pressure vessels. Since these structures are produced mainly by welding, tests are conducted using smooth round specimens from the PM, WJ and SHAZ of steel NN-70. It is shown that the HAZ, because of its heterogeneous structure, is the most susceptive and weakest spot in the WJ of steel NN-70 /1-5/, and so it was simulated in this study. When selecting stabilized hysteresis as a representative of all stabilized INTEGRITET I VEK KONSTRUKCIJA Vol. 17, br. 1 (2017), str. 61–73 STRUCTURAL INTEGRITY AND LIFE Vol. 17, No 1 (2017), pp. 61–73 61
Transcript of Behaviour of Nionikral-70 in low-cycle...

Vujadin Aleksić1, Ljubica Milović2, Bojana Aleksić3, Srđan Bulatović4, Zijah Burzić5, Abubaker M. Hemer3
BEHAVIOUR OF NIONIKRAL-70 IN LOW-CYCLE FATIGUE
NISKOCIKLIČNI ZAMOR UZORAKA ČELIKA NIONIKRAL 70
Originalni naučni rad / Original scientific paper UDK /UDC: 669.15:539.431 Rad primljen / Paper received: 24.03.2017
Adresa autora / Author's address: 1) Materials Testing Institute, Belgrade, Serbia, email: [email protected] 2) University of Belgrade, Faculty of Technology and Metallurgy, Belgrade, Serbia 3) University of Belgrade, Innovation Centre of the Faculty of Technology and Metallurgy, Belgrade, Serbia 4) Accreditation Body of Serbia (ATS), Belgrade, Serbia 5) Military-Technical Institute, Belgrade, Serbia
Keywords • high strength low-alloyed steel (HSLA) • low-cycle fatigue (LCF) • simulated heat affected zone (SHAZ) • Nionikral 70 (NN-70)
Abstract
Experimental research on the behaviour of high-strength low-alloy steel (HSLA) exposed to low-cycle fatigue (LCF) with controlled and fully reversible strain (/2 = const, R = min/max = –1) has been analysed. LCF tests are performed on a series of smooth bar shaped specimens, 11 11 95 mm, parent metal (PM), welded joint (WJ) and simulated heat affected zone (SHAZ) of steel Nionikral 70 (NN-70) with semi-amplitude of controlled strain, /2 = 0.40-0.80. The results of the experimental investigation have given us important information on the understanding of fatigue behaviour of steel NN-70 and its welded joints. In this work the results of static and dynamic-, that is monoto-nous and fatigue behaviour of the material, are compared, which is a practical contribution to the assessment of the behaviour of PM and WJ of steel NN-70 exposed to effects of low cycle fatigue, i.e. monotonous and fatigue behaviour of the material.
Ključne reči • niskolegirani čelik povišene čvrstoće (HSLA) • niskociklični zamor (LCF) • simulirana zona uticaja toplote (SHAZ) • Nionikral 70 (NN-70)
Izvod
Analizirano je eksperimentalno istraživanje ponašanja uzoraka od niskolegiranog čelika povišene čvrstoće (HSLA) u uslovima niskocikličnog zamora (LCF), sa kontrolisanom i potpuno reverzibilnom deformacijom (/2 = const, R = min/max = –1). LCF ispitivanja obavljena su na seriji glat-kih epruveta paralelopipednog oblika, 11 11 95 mm, osnovnog metala (PM), realno zavarenog spoja (WJ) i simulirane zone uticaja toplote (SHAZ) čelika Nionikral 70 (NN-70), sa poluamplitudom kontrolisane deformacije, /2 = 0.40-0.80. Rezultati eksperimentalnih ispitivanja su nam dali važne podatke o razumevanju zamornog ponaša-nja čelika NN-70 i zavarenih spojeva izrađenih od ove vrste čelika. U radu je izvršeno i poređenje rezultata statičkog i dinamičkog, odnosno, monotonog i zamornog ponašanja materijala, što predstavlja praktični doprinos oceni pona-šanja PM i WJ čelika NN-70 u uslovima delovanja nisko-cikličnog zamora.
INTRODUCTION
Most damages on steel structures that lead to cata-strophic failures occur due to fatigue loads. Damages of fatigue type represent between 50% and 90% of all damages over the operating life of the structure, thus representing an important structural problem. A large number of machines and plant structures during their operating life have a relatively small number of cycles that last for a long time: various turbojet engines, highly-strained parts of turbines, wave-stricken parts of ship struc-ture, high-pressure vessels, piping, steam lines, gas pipe-lines, reactor plants and process installations, chemical and food industries, so that one can say that during their exploi-tation life they are exposed to the effects of variable load of the start-stop-start type, i.e. low-cycle fatigue. For low-cycle fatigue of materials, the values of variable load in critical areas exceed the value of yield stress, Rp0.2, i.e. after
a relatively small number of cycles at these locations, the plastically strained zone start to develop.
The fatigue life of the elements of such steel structures can be assessed by analysing the behaviour that includes processing data on load, geometry and the selected material used for manufacturing the element or structure. Large contributions to this analysis are provided from indicators of material behaviour when affected by LCF, which are determined by LCF tests. The steel NN-70, selected in this study to investigate the experimental behaviour of PM, WJ and SHAZ affected by fatigue loads, among other things, is used in shipbuilding and for the manufacture of pressure vessels. Since these structures are produced mainly by welding, tests are conducted using smooth round specimens from the PM, WJ and SHAZ of steel NN-70. It is shown that the HAZ, because of its heterogeneous structure, is the most susceptive and weakest spot in the WJ of steel NN-70 /1-5/, and so it was simulated in this study. When selecting stabilized hysteresis as a representative of all stabilized
INTEGRITET I VEK KONSTRUKCIJA Vol. 17, br. 1 (2017), str. 61–73
STRUCTURAL INTEGRITY AND LIFEVol. 17, No 1 (2017), pp. 61–73
61
Behaviour of Nionikral-70 in low-cycle fatigue Niskociklični zamor uzoraka čelika Nionikral 70
hystereses for one strain level, and for further processing of LCF test results, the recommendations and requirements of standards /6, 7/ are used as well as the methodology based on the linearity of the stabilization regions of LCF, that has been numerically determined, /8/.
CHARACTERISTICS OF NN-70
Steel NN-70 is the Yugoslav version of American steel HY-100 and is intended for manufacture of ship structures, submarines and pressure vessels by welding, where the required toughness, depending on the accumulated strain that ultimately turns into plastic strain /9-11/, is extremely important. The technology of manufacture and thermome-chanical processing, /12/, of Nionikral-70 steel is the result of joint research from the Military Technical Institute in Žarkovo (VTI) and ironworks ‘Jesenice’ from Jesenice, /1/, in the early 1990s. Steel is produced in the electric furnace, cast in plates, subsequently rolled into slabs and then into sheets of various thickness. Due to some of its characteris-tics, it is classified among fine-grained steels. The process of hardening is the combination of classical improvement (quenching and tempering) with grain refinement in accord-ance with selected chemical composition, by microalloying and appropriate deposition, /9/. In determining the limit values of carbon and other alloying elements for the analysis, bearing in mind the purpose of the steel, care is taken to meet the requirements for a combination of charac-
teristics such as: strength; ductility; resistance to crack initi-ation and propagation; the stability of these properties at low temperatures; good resistance to fatigue and stress corrosion; good workability and weldability, /13/. Steel NN-70 is intended to be shaped by welding, so that after it is successfully mastered, its suitability for welding is also subjected to assessment, /1/.
The starting material used to make test specimens of PM and SHAZ is a plate of dimensions 45 205 353 mm of low-alloyed high-strength steel NN-70 with properties shown in Fig. 1a and Tables 1 and 2.
To produce WJ, as a starting material, 4 plates from the same batch dimensions 20 158 208 mm are used. Due to the specific research of HAZ, during welding of WJ plates, the K-shape weld seam is made according to stand-ard SRPS EN ISO 9692-1: 2012, /14/. The mechanical properties of WJ are shown in Table 2 and in Fig.1b, /15-17/. A method of microstructural and mechanical character-ization of the heat affected zone (HAZ), /18/, is used to select the regime of simulation, thus establishing the indicator of the most approximate similarity of simulated- and real HAZ through surface microstructure (replica) and hardness, HV10, location spot of simulation, and impact tests after the preparation of specimens from simulated samples.
a)
b)
Monotonous stress-strain curves (MSSC)
Figure 1. Tensile testing results of NN-70: a) PM, /8/, and b) WJ, /15/.
Table 1. Chemical composition of NN-70 (%wt.), /8/. C Si Mn P S Cr Ni Mo V Al As Sn
0.106 0.209 0.220 0.005 0.0172 1.2575 2.361 0.305 0.052 0.007 0.017 0.014 Cu Ti Nb Ca B Pb W Sb Ta Co N /
0.246 0.002 0.007 0.0003 0 0.0009 0.0109 0.007 0.0009 0.0189 0.0096 /
Table 2. Mechanical properties of parent material NN-70. Properties PM, /8/ WJ, /15/
Ultimate tensile strength, Rm (MPa) 854.8 (Fig. 1a) 914 (Fig. 1b) Yield strength, ReH, Rp0.2 (MPa) 813.4 (Fig. 1a) 645 (Fig. 1b)
Elasticity modulus (GPa) 234.7,
static (Fig. 1a) 221.4,
dynamic, LCF (Fig.2) 193.7,
static (Fig. 1b) 216.5,
dynamic, LCF Elongation, A5 (%) 18.4 22.4 PM, at 20°C WM, at 20°C HAZ, 20°C Impact toughness (J) 96.83 81.62 111.58 Crack initiation energy (J) 39.60 25,88 29.81 Crack propagation energy (J) 57.23 55.74 81.77 HV30, plate of PM 245-269 HV10, LCF specimens, /15/ PM 252-262, WJ 288-294, HAZ 269-277
INTEGRITET I VEK KONSTRUKCIJA Vol. 17, br. 1 (2017), str. 61–73
STRUCTURAL INTEGRITY AND LIFEVol. 17, No 1 (2017), pp. 61–73
62

Behaviour of Nionikral-70 in low-cycle fatigue Niskociklični zamor uzoraka čelika Nionikral 70
Based on analysis of test results and comparing to results of previous studies, /1-5, 15/, the cooling time t8/5 = 40 s is chosen for samples 11 11 95 mm with HAZ simulation, and from which the LCF SHAZ specimens are made.
There are various methods for determining the modulus of elasticity for calculating the fatigue of structural elements, but the choice of methods does not significantly affect the final result, /19/. The modules of elasticity in this paper are determined analytically for each specimen from tensile testing data or LCF tests from cycle N1/4, Fig. 2, and so the mean value is calculated, /8, 15/.
a)
b)
Amplitude strain level /2 = 0.45, load rate 330 MPa/s
Figure 2. Modulus of elasticity from cycle N1/4.
LOW-CYCLE FATIGUE TESTING
The behaviour of materials in LCF is tested experimen-tally in accordance with ISO 12106: 2003 (E), /6/, and/or ASTM E 606-04, /7/. For this purpose, smooth specimens are used at multiple levels of regulated strains with a strain ratio R = min/max = –1 at ambient, elevated or reduced temperatures, and are exposed to LCF loading, /20, 21/. Stress-strain response at LCF has the shape of an ideal hysteresis loop /20-23/, shown in Fig. 3. The strain range corresponds to overall loop width, while the stress range corresponds to its overall height. The stress amplitude equals the stress half-range, /2.
a)
b)
c)
Figure 3. Ideal hysteresis loop: a) - loop of high stress-amplitude cycle after first application of max, /22/; b) - response, /20, 21/: c) positive part of loop and determining e/2 and p/2, /8/, y = mx–b; F = m–b; for F = 0; = b/m; p/2 = ; e/2 = /2–p/2.
INTEGRITET I VEK KONSTRUKCIJA Vol. 17, br. 1 (2017), str. 61–73
STRUCTURAL INTEGRITY AND LIFEVol. 17, No 1 (2017), pp. 61–73
63

Behaviour of Nionikral-70 in low-cycle fatigue Niskociklični zamor uzoraka čelika Nionikral 70
Most of the materials at LCF and at a certain level regu-lated strain achieve a so-called stabilized condition. It is a condition when the height of the hysteresis loop expressed through a range of force of loading, or stress, slightly changes and we call it region stabilization, Fig. 4. For the analysis at R = –1, it is sufficient to consider the positive part of the F-N curve, Fig. 4b.
Hysteresis for Ns cycle in the region of stabilization that is close or equal to half the number of cycles to crack initia-tion N is called stabilized hysteresis /20, 21, 23-25/. The choice of stabilized hysteresis from a wide range of stabi-lized hystereses that best characterizes material behaviour for a certain level of strain is very important. It represents all hystereses and is used to describe the complete process of low-cycle fatigue, i.e. it provides all necessary data to determine characteristic curves of low-cycle fatigue.
a) F-N curve, max and min
b) F-N curve, only max values
1–Adjustment of tearing machine; 2–Adaptation of tearing machine, tools and specimen; 3–Stabilized state; 3A–Crack formation up to threshold of NDT; 4–Force drop of 25% (ISO 12106:2003(E)) /7/; 5–Force drop of 50% (ASTM E 606-04) /6/; 6–Force drop to F = 0; 7–Stoppage of tearing machine; 8–Height of hysteresis loop; Nstart–Test start up, F = Fmax; Nbs–Beginning of stabilization; A0, mm; NtNDT–threshold of NDT; Af2, mm; Nes–End of stabilization; Af1, mm; Nestimation–Force-drop assessment of an operator; Nend–Test termination. A0–initial cross-section of the specimen (css); Af1–css at the end of stabilization; Af2–css at threshold of NDT.
Figure 4. Regions of low-cycle fatigue, PM, LCF, steel NN-70, specimen PM-10, /2 = 0.45.
For a full explanation of LCF behaviour of a real mate-rial it is necessary to take into account the closure of the crack, /26/, to predict the growth rate of a primary crack and appearance of small secondary damages, /27/, and to foresee a combination of thermal and mechanical loads and local residual stresses that can significantly affect the devel-opment of fatigue cracks /28, 29, 30/, using advanced tech-
niques such as scanning and transmission electron micros-copy that allow interpretation of measured physical data based on microstructural details, /26, 31/.
The most common methods for determining the number of cycles to crack initiation, Nf, are defined by standards /6, 7/. ISO 12106: 2003 (E) /6/ recommends that Nf(–25%), cycle of crack initiation, should be defined by drop of load tensile force by 25% after the end of stabilization, and Ns(–25%) = Nf(–25%)/2 to be the cycle of stabilized hysteresis, while the standard ASTM E 606-04, /7/, recommends that Nf(–50%), cycle of crack initiation, should be defined by the drop of maximum tensile force of load, Fmax, by 50% and Ns(–50%) = Nf(–50%)/2 to be the cycle of stabilized hysteresis.
The methodology /8, 32-34/ for determining the start and end of crack initiation and linear establishment of stabiliza-tion regions are based on experimental data by arbitrary selection of three cycles, based on which we can establish linearity that we maintain by filtering the data in EXCEL, toward the beginning and the end of the test. In this way we determine the initial, Nbs, and final, Nes, cycle of stabiliza-tion, i.e. the start and end of crack initiation, Fig. 5.
Stabilized hysteresis, Ns(ss), is located in the middle of region 3, Fig. 4b, and is determined by Ns(ss) = Nbs + (Nes – Nbs)/2. In a similar way, we can establish a cycle of crack appearance of 1 mm2 surface area (threshold NDT), which can be identified by NDT methods, and then the cycle of stabilized hysteresis Ns(tNDT), located in the middle of region 3A, Fig. 4b, so that Ns(tNDT) = Nbs + (NtNDT – Nbs)/2, /32/.
a)
b)
Figure 5. a) Region of stabilization, N = 210–1354, and b) stabi-lized hysteresis in cycles Ns(-25%) = 723 /6/, Ns(-50%) = 724 /7/ and
Ns(estimation) = 580 /8/.
The procedure for determining the stabilized hysteresis is conducted according to standard ISO 12106: 2003 (E), /6/, and the described methods for determining stabilization areas /8, 32, 33, 34/, are applied to all specimens, i.e. all strain levels /2 = 0.40 – 0.80, and after processing data from all determined stabilized hystereses, obtained using the methods described, the curves of low-cycle fatigue for BM, RWJ and SHAZ of steel NN-70, are defined.
INTEGRITET I VEK KONSTRUKCIJA Vol. 17, br. 1 (2017), str. 61–73
STRUCTURAL INTEGRITY AND LIFEVol. 17, No 1 (2017), pp. 61–73
64
Behaviour of Nionikral-70 in low-cycle fatigue Niskociklični zamor uzoraka čelika Nionikral 70
The ultimate goal of the LCF test is to construct charac-teristic low-cycle fatigue curves that are used in fatigue strength calculations. In order to define and describe the LCF process, it is necessary to determine a linearized step function stress amplitude–plastic-strain amplitude, cyclic stress-strain curve (Ramberg-Osgood), and the elastic and plastic components in the strain-life curve, and finally, the strain-life curve (Manson-Coffin-Basquin).
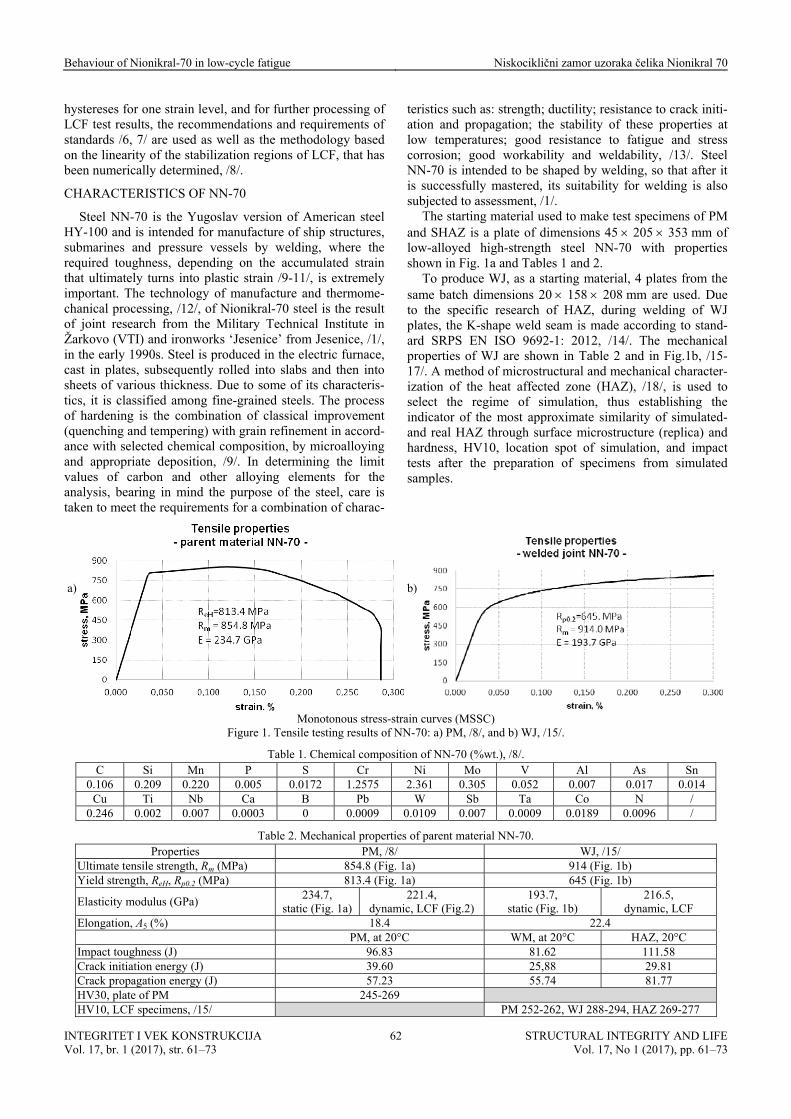
The cyclic stress-strain curve (CSSC) represents the dependence of stress amplitude /2 on the total strain amplitude /2, Fig. 6. Experimentally established stabi-lised hysteresis of multiple-level controlled strains are used to define this curve, Fig. 6a.
a) Hysteresis of more specific levels of regulated strain
b) hysteresis count for certain level of regulated strain, = const.
Figure 6. Construction of a cyclic stress-strain curve using stabilised hysteresis.
The equation of the cyclic stress-strain curve has the form /20, 21, 23, 35/:
1
'
2 2 2 '
n
E K
(1)
where: K' – coefficient of cyclic strength; n' – exponent of cyclic strain hardening; and E – modulus of elasticity, determined from the cycle N1/4, Fig. 6b.
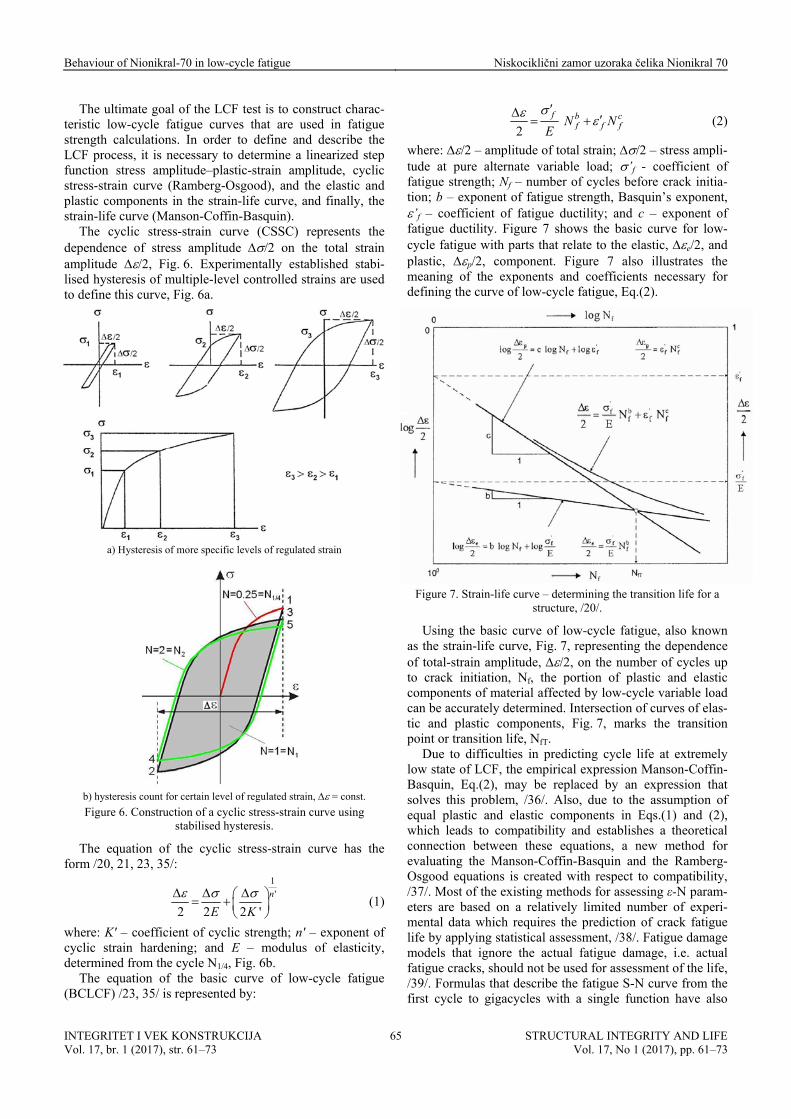
The equation of the basic curve of low-cycle fatigue (BCLCF) /23, 35/ is represented by:
2
f b cf f fN N
E
(2)
where: /2 – amplitude of total strain; /2 – stress ampli-tude at pure alternate variable load; ’f - coefficient of fatigue strength; Nf – number of cycles before crack initia-tion; b – exponent of fatigue strength, Basquin’s exponent, ’f – coefficient of fatigue ductility; and c – exponent of fatigue ductility. Figure 7 shows the basic curve for low-cycle fatigue with parts that relate to the elastic, e/2, and plastic, p/2, component. Figure 7 also illustrates the meaning of the exponents and coefficients necessary for defining the curve of low-cycle fatigue, Eq.(2).
Figure 7. Strain-life curve – determining the transition life for а
structure, /20/.
Using the basic curve of low-cycle fatigue, also known as the strain-life curve, Fig. 7, representing the dependence of total-strain amplitude, /2, on the number of cycles up to crack initiation, Nf, the portion of plastic and elastic components of material affected by low-cycle variable load can be accurately determined. Intersection of curves of elas-tic and plastic components, Fig. 7, marks the transition point or transition life, NfT.
Due to difficulties in predicting cycle life at extremely low state of LCF, the empirical expression Manson-Coffin-Basquin, Eq.(2), may be replaced by an expression that solves this problem, /36/. Also, due to the assumption of equal plastic and elastic components in Eqs.(1) and (2), which leads to compatibility and establishes a theoretical connection between these equations, a new method for evaluating the Manson-Coffin-Basquin and the Ramberg-Osgood equations is created with respect to compatibility, /37/. Most of the existing methods for assessing ε-N param-eters are based on a relatively limited number of experi-mental data which requires the prediction of crack fatigue life by applying statistical assessment, /38/. Fatigue damage models that ignore the actual fatigue damage, i.e. actual fatigue cracks, should not be used for assessment of the life, /39/. Formulas that describe the fatigue S-N curve from the first cycle to gigacycles with a single function have also
INTEGRITET I VEK KONSTRUKCIJA Vol. 17, br. 1 (2017), str. 61–73
STRUCTURAL INTEGRITY AND LIFEVol. 17, No 1 (2017), pp. 61–73
65

Behaviour of Nionikral-70 in low-cycle fatigue Niskociklični zamor uzoraka čelika Nionikral 70
INTEGRITET I VEK KONSTRUKCIJA Vol. 17, br. 1 (2017), str. 61–73
STRUCTURAL INTEGRITY AND LIFEVol. 17, No 1 (2017), pp. 61–73
66
been proposed, and from the parameters of materials’ based monotonous testing, only a Brinell hardness /40/ is required in this formula.
Programme for testing NN-70 by low-cycle fatigue
Defining the test objectives: The aim of testing is to compare the behaviour of BM,
RWJ and SHAZ of NN-70 exposed to low-cycle fatigue on the basis of: cyclic stress-strain curves (Ramberg-Osgood) and strain-life curves (Manson-Coffin-Basquin).
Required preliminary tests:
– testing the chemical composition of steel; – testing the mechanical properties of steel (determining the
modulus of elasticity); – determining impact energy of BM, RWJ and SHAZ
(toughness at different temperatures); – testing the structural properties (metallography).
Preparation of the test plan:
– selecting the testing standard (ISO 12106/03 /6/, ASTM E 606/04 /7/);
– selection of a tearing machine (MTS system, Universal hydraulic dynamic tearing machine of 500 kN, model 641.37A-01, VTI-Žarkovo, Belgrade);
– choice of specimen holders and related equipment during tests (extensometer measuring 25 mm in length);
– selecting the testing regime (controlled strain, room tem-perature, asymmetry factor –1 defined by sinus function, amplitude levels of strain /2 = 0.40-0.80);
– determining the appearance and sizes of specimens (round smooth specimen, 7/M10/25/90);
– determining the required number of test specimens (BM-10 pcs, RWJ-10 pcs, SHAZ-10 pcs);
– development of the technological procedure for specimen extraction and machining;
– manufacture of carriers-holders for specimens to be tested – determining the dimensions of the required sample – determining the direction of roll on a large sample of
steel of known chemical composition and mechanical properties
Sampling Sample sandblasting NDT and hardness testing of a sample
Necessary preliminary preparation:
– choice of device on which simulation will be conducted (SMITHWELD Thermal Cycle Simulator Model 1405 - Department of Mechanical Engineering Faculty, Mari-bor);
– selection of a simulation regime (frequency, amplitude, water temperature, the clearance between the waveguide and tested sample of material ...);
– determining the appearance and specimen sizes (11 11 60 mm);
– determining the required number of test specimens (3 4 = 12 pcs);
– developing the technological procedure for extraction and machining of specimens (as per diagram);
– simulation of HAZ for different cooling times t8/5 = 8, 10, 20 and 40 s, on samples used for preparing specimens for toughness testing;
– measurement of hardness HV10 on a sample of simulated HAZ;
– determining the structure of SHAZ; – determining the toughness of SHAZ as an approximation
of the toughness of real HAZ; – simulation of HAZ for proper cooling time t8/5 = 40 s on
samples for preparing specimens for toughness and LCF tests;
Preparation of the specimens for testing
Testing: – LCF (VTI-Žarkovo, Belgrade, testing up to rupture of the
specimens, photographing and recording results); – Analysis of fractured surfaces (VTI-Žarkovo).
Processing of the test results:
– choice of how to display test results; – selecting the program for processing results; – selecting a method to compare the obtained results; – drawing the curve of extreme stress values (filtering the
data obtained from the tearing machine ...); – determining the number of cycles to crack initiation, Nf,
(according to ISO 12106/03, /6/, and literature); – determining the stabilized hysteresis, its strain half-
ranges, minimum and maximum stress values (analytical presentation of strain in EXCEL and that of stress could be taken from the hysteresis);
– determining static and dynamic modules of elasticity (ASTM E 111/04 /41/, ASTM E 606/04 /7/);
– determining cyclic and stress-strain curves (calculating the coefficients and equation, and curve drawing);
– constructing the strain-life curve (linearized elastic and plastic components of the curve and overall curve);
– morphology of fracture (reading the SEM photographs of the surfaces of fractured samples).
Analysis and conclusions:
– assessing the cyclic behaviour of steel; – comparing the cyclic and monotonous stress-strain curves
(Ramberg-Osgood relation); – calculating transient lives (Manson-Coffin-Basquin); – assessment of the fractured surface.
Testing of steel NN-70 at low-cycle fatigue
From the necessity to assess the low-cycle fatigue life, and in order to determine fatigue characteristics BM, RWJ and SHAZ of steel NN-70, the resistance to low-cycle fatigue test is carried out. The preparation of the PM, RWJ and SHAZ in steel NN-70 test of resistance to low-cycle fatigue has consisted of producing smooth cylindrical speci-mens, Fig. 8: item 1a (PM); item 1b (RWJ); item 1c (SHAZ), and the tool for placing specimens in the tearing-machine jaw, Fig. 8: items 2 and 3, and check of the target static tensile properties BM and RWJ of steel NN -70, Fig. 1 and Table 2.

Behaviour of Nionikral-70 in low-cycle fatigue Niskociklični zamor uzoraka čelika Nionikral 70
Figure 8. Specimen and holder for testing LCF BM /8/, RWJ /15/, and SHAZ /8/, of steel NN-70: items 1a (BM), b (RWJ), c (SHAZ) -
LCF specimen, NN-70, D = 7 mm; item 2, Jam nut, 42CrMo4; item 3 Grip holder, 42CrMo4, /8/.
The procedure for determining low-cycle fatigue charac-teristics and the geometry of cylindrical smooth specimen, Fig. 8 items 1a, b, and c, are defined by ISO 12106:2003(E) /6/, and ASTM E 606-04e, /7/.
The fatigue test is conducted on a universal MTS system (Material Testing System – Universal hydraulic dynamic tearing machine of 500 kN in VTI-Žarkovo, Belgrade) for material testing, schematically presented in Fig. 9.
Linear characteristics of used MTS force-feeding device, Fig. 9, item 2a, and MTS extensometer with measuring length of L0 = 25 mm, Fig. 9, item 2b, are graphically presented in Fig. 10a and 10b.
Low-cycle fatigue tests are performed on a series of smooth specimens of steel NN-70, with semi-amplitudes of controlled and fully reversible strains, /2 = 0.40-0.80 (/2 = const., R = min/max = –1).
Figure 9. MTS universal system for material testing: 1–hydraulic aggregate; 2–pulsating device; 2a–MTS force-feeding device; 2b–MTS
extensometer; 3–control system; 4–A/D convertor; 5–PC.
a)
b)
Figure 10. Linear characteristics of MTS force-feeding device and MTS extensometer:
a) MTS force feeding device, F [kN] = F [V]·10; b) MTS extensometer, [%] = [V]·0.2.
INTEGRITET I VEK KONSTRUKCIJA Vol. 17, br. 1 (2017), str. 61–73
STRUCTURAL INTEGRITY AND LIFEVol. 17, No 1 (2017), pp. 61–73
67

Behaviour of Nionikral-70 in low-cycle fatigue Niskociklični zamor uzoraka čelika Nionikral 70
Processing and presentation of test results
As a result of low-cycle fatigue test on one specimen (one amplitude level of strain), a record in EXCEL, Fig. 11, can be further processed according to our requirements by using the tools available in EXCEL, /8/.
Before processing the results, it is possible to roughly determine the cycle in which there is a significant drop in force, Nf(estimation), Fig. 4b, and then establish a relationship between semi-amplitude of controlled strain and estimated cycle of crack initiation, Fig. 12.
To determine the indicators of low-cycle fatigue of the material presented by cyclic stress-strain curve (CSSC) and
basic curve of low-cycle fatigue (BCLCF), the following analyses of the results of low-cycle fatigue tests are made: 1. Elastic modules, Figs. 1 and 2, from N1/4 cycle are
determined, Fig. 6b. 2. For each amplitude level of strain (each specimen), by
filtering data, extreme values of load forces and number of cycles are paired, and thus we eliminated the excess data, Fig. 4a. Both positive and negative values of the load forces are filtered.
3. Diagrams of extreme values of load forces and number of cycles (F-N curves) are drawn for each amplitude level of strain, Fig. 4a.
Figure 11. Record in EXCEL after the low-cycle fatigue test of a single specimen.
Figure 12. Characteristic cycles Nf and strain half-range for BM and SHAZ specimens, Nf(estimation) and Nf(–25%).
INTEGRITET I VEK KONSTRUKCIJA Vol. 17, br. 1 (2017), str. 61–73
STRUCTURAL INTEGRITY AND LIFEVol. 17, No 1 (2017), pp. 61–73
68

Behaviour of Nionikral-70 in low-cycle fatigue Niskociklični zamor uzoraka čelika Nionikral 70
4. Diagrams for determining areas of stabilization are drawn (positive part of F-N curves, the area of stabiliza-tion is determined by linearization of data on maximum tensile forces of load in low-cycle fatigue tests for each amplitude level of strain, Fig. 4b). Areas of low-cycle fatigue and characteristic hysteresis are defined after the following: a) determining the maximum force and starting cycle
Nstart, Fig. 4b, b) determining the cycle of start of stabilization, Nps, end
of stabilization, Nks, and area of stabilization, Fig. 4b, Table 3,
c) determining the cycles Nf(–25%) /6, 8/, Nf(1) for BM, Nf(2) for RWJ, Nf(3) for SHAZ, Fig. 4b, Table 3,
5. The characteristic data of stabilized hysteresis curves for each amplitude level of strain were defined: a) extreme values of load force Fsmax and Fsmin, Fig. 4b,
are read, b) points of intersection on the hysteresis curve and the
positive part of the strain axis are established in EXCEL in order to determine the elastic and plastic components of strain semi-amplitude (coefficients of a straight line, m and b, intersecting strain axis are determined; in that way, the point of axis intersection, i.e. the values of elastic and plastic components of strain semi-amplitude, Fig. 3c, are determined. For RWJ this is done graphically in AutoCAD /15/, and can be done in another programme for precise draw-
ing, too (Corel, SolidWorks, etc.) or calculated according to various methods of adopted standards that are in effect and commercial software for testing LCF /38, 42/. Comparison of the life curves plotted as a function of plastic-strain amplitude vs. stress ampli-tude shows the decisive role of plastic-strain ampli-tudes /43/, so that this should be taken into account,
c) p/2, e/2, A0 = D2π/4, Fsr = (Fsmax + Fsmin)/2 and Fsr/A01000 are calculated.
6. Data on all amplitude levels of strain are classified, cyclic stress-strain curves (CSSC) and basic curves of low-cycle fatigue (BCLCF) are constructed and cyclic vs. monotonous stress-strain curves (MSSC) compared: a) exponents and coefficients are determined using line-
arized step function, n’ and K’, Table 4, Fig. 13a. b) exponents and coefficients are determined using line-
arized elastic component, b and ’f, Table 5, Fig. 14a. c) exponents and coefficients of linearized plastic com-
ponent, c and ’f, are determined, Table 6, Fig. 14b. 7. Data on cyclically stress-strain curves, Fig. 13b, and
basic curves of low-cycle fatigue, Fig. 16b, are classified for the group of selected stabilized hystereses, Ns1 (PM), Ns2 (RWJ), and Ns3 (SHAZ), in order to construct them, and finally,
8. Transition life is determined for a group of selected stabilized hystereses, Ns1 (PM), Ns2 (RWJ), and Ns3 (SHAZ), Table 7.
Table 3. Region of stabilization and characteristic cycles of LCF BM /8/, RWJ /15/, and SHAZ /8/ of steel NN-70.
LCF NN-70, ISO 12106/03 /6/ Stabilization regions Characteristic cycle of stabilization Specimen /2 (%) y = F (kN); x = N R2 Nbs Nes Nf* Ns**
10 0.45 y = –0.001x + 29.01 0.95 210 1354 1445 723 03 0.50 y = –0.002x + 28.57 0.97 256 1271 1402 701 06 0.60 y = –0.005x + 29.65 0.94 127 415 501 251 05 0.70 y = –0.006x + 29.04 0.91 135 333 412 206
PM
(in
dex
1)
08 0.80 y = –0.013x + 30.47 0.85 82 165 207 104 1 0.40 2956 1478 2 0.40 2250 1125 3 0.50 1710 855 4 0.50 1284 642 5 0.60 580 290 6 0.60 568 284 7 0.70 414 207 8 0.70 356 178 9 0.80 374 187
RW
J (i
ndex
2)
10 0.80
Determining Nf using tangents drawn in AutoCAD /15/
354 177
10 0.40 y = –0.001x + 28.83 0.97 719 2218 2736 1368 01 0.50 y = –0.001x + 27.72 0.94 799 1919 2235 1118 04 0.60 y = –0.008x + 29.29 0.86 71 184 248 124 05 0.60 y = –0.015x + 31.32 0.97 53 195 230 115 02 0.70 y = –0.013x + 31.32 0.82 87 155 172 86
SH
AZ
(in
dex
3)
03 0.70 y = –0.020x + 30.85 0.88 25 90 98 49 *) Nf(1) for PM, Nf(2) for RWJ, Nf(3) for SHAZ;
**) Ns(1) = Nf(1)/2 for PM, Ns(2) = Nf(2)/2 for RWJ, Ns(3) = Nf(3)/2 for SHAZ
INTEGRITET I VEK KONSTRUKCIJA Vol. 17, br. 1 (2017), str. 61–73
STRUCTURAL INTEGRITY AND LIFEVol. 17, No 1 (2017), pp. 61–73
69

Behaviour of Nionikral-70 in low-cycle fatigue Niskociklični zamor uzoraka čelika Nionikral 70
Table 4. Exponents n’ and coefficients K’ of cyclic stress-strain curves (CSSK), NN-70.
ISO 12106:2003 (E), /6/ NN-70 Nf(–25%) Ns = Nf/2
n' log K’ K’ (MPa) E (MPa)
PM /8/ Nf1 Ns1 0.047 2.976 946.2 221378 from N1/4 RWJ /15/ Nf2 Ns2 0.104 3.091 1233.1 216508 from N1/4 SHAZ /8/ Nf3 Ns3 0.040 2.967 926.8 225005 from N1/4
Linearized step function log log log2 2
pn K
Cyclic stress-strain curve 1
2 2
n
E K
a)
b)
Figure 13. Construction of CSSC, PM of NN-70, Nf = Nf1 (force drop 25% /6/):
a) n’ = 0.047, log K’ = 2.976 of cyclic stress-strain curve; b) cyclic stress-strain curve.
Table 5. Exponents b and coefficients ’f of elastic component of basic LCF curves, steel NN-70.
ISO 12106:2003 (E), /6/ NN-70
Nf
(–25%) Ns = Nf/2 b log ’f /E E (MPa) 'f (MPa)
PM /8/ Nf1 Ns1 –0.060 –2.283 221378 from N1/4 1153.8 RWJ /15/ Nf2 Ns2 –0,061 –2,311 216508 from N1/4 1057.97 SHAZ /8/ Nf3 Ns3 –0.030 –2.361 225005 from N1/4 979.9
Linearized part of elastic component flog log log2
efb N
E
Basic curve of low-cycle fatigue 2
f b cf f fN N
E
a)
b)
Figure 14. Comparison of cyclic and monotonous stress-strain curves of NN-70 steel (force drop 25%, /6/):
a) BM, Nf = Nf1, and SHAZ, Nf = Nf3; b) BM, Nf = Nf1, RWJ, Nf = Nf2, and SHAZ, Nf = Nf3.
Analysis and comparison of results
Based on experimental data, linearized step functions, Fig. 13a (for Ns1 (PM), Ns2 (RWJ), and Ns3 (SHAZ)), are determined, and from them the exponents and coefficients necessary for constructing CSSC, Fig. 13b (for Ns1 (PM), Ns2 (RWJ), and Ns3 (SHAZ)). In Fig. 14 (for Ns1 (PM), Ns2 (RWJ) and Ns3 (SHAZ)), a comparison of cyclic and mono-tonous stress-strain curves is presented, indicating quantita-
tive and qualitative related components of WJ steel NN-70 exposed to static and dynamic loads (low cycle fatigue). In Table 4, classified exponents and coefficients in equation CSSC are shown for all selected stabilized hysteresis of PM, RWJ and SHAZ of steel NN-70. One can observe that for BM and WJ of steel NN-70, the exponent n’ ranges from 0.040 to 0.104, and coefficient K’ from 926.8 to 1233.1 MPa.
INTEGRITET I VEK KONSTRUKCIJA Vol. 17, br. 1 (2017), str. 61–73
STRUCTURAL INTEGRITY AND LIFEVol. 17, No 1 (2017), pp. 61–73
70

Behaviour of Nionikral-70 in low-cycle fatigue Niskociklični zamor uzoraka čelika Nionikral 70
In Fig. 15a (for Ns1 (PM), Ns2 (RWJ), and Ns3 (SHAZ)) the linearized elastic components of total-strain amplitude, and in Fig. 15b (for Ns1 (PM), Ns2 (RWJ), and Ns3 (SHAZ)), linearized plastic components of the total-strain amplitude determined on the basis of experimental data are shown, in order to determine the exponents and coefficients required for constructing BCLCF. Classified exponents and coeffi-cients of the elastic component of total-strain amplitude in BCLCF equation for all selected stabilized hystereses of PM, RWJ and SHAZ of steel NN-70 are shown in Table 5.
One can observe that for PM and WJ of steel NN-70, the exponent b ranges from –0.030 to 0.061, and coefficient ’f from 979.9 to 1153.8 MPa.
Classified exponents and coefficients of the plastic component in the total-strain amplitude of BCLCF equation for all selected stabilized hystereses of BM, RWJ, and SHAZ of steel NN-70 are shown in Table 6.
One can observe that for BM and WJ of steel NN-70, the exponent c ranges from –0.400 to –0.684, and coefficient ’f from 0.0206 to 0.2312.
a)
b)
Figure 15. Linearized components of total-strain amplitude, PM of NN-70, Nf = Nf1 (force drop 25%, /6/): a) b = –0.060 and
log ’f /E = –2.283 of the basic curve of low-cycle fatigue; b) c = –0.594 and log ’f = –0.981 of basic curve of low-cycle fatigue.
Table 6. Exponents c and coefficients ’f of plastic component of basic LCF curves, steel NN-70.
ISO 12106:2003 (E), /6/ NN-70
Nf
(–25%) Ns = Nf/2 c log ’f ’f
PM /8/ Nf1 Ns1 –0.594 –0.981 0.1045 RWJ /15/ Nf2 Ns2 –0,684 –0,636 0,2312 SHAZ /8/ Nf3 Ns3 –0.400 –1.686 0.0206
Linearized part of plastic component log log log2
pf fc N
Basic curve of low-cycle fatigue 2
f b cf f fN N
E
a)
b)
Figure 16. Construction of BCLCF, BM of NN-70, Nf = Nf1 (force drop 25% /6/): a) ratio max and /2 for strain level /2 = 0.40 to
0.80; b) basic curve of low-cycle fatigue.
Table 7. Transition life for a variety of stabilized hystereses.
ISO 12106:2003 (E), /6/ elastic part plastic part NN-70 Nf (-25%) Ns = Nf/2 b ’f (MPa) E (MPa) c ’f NfT PM /8/ Nf1 Ns1 –0.060 1153.8 221378 from N1/4 –0.594 0.1045 274
RWJ /15/ Nf2 Ns2 –0,061 1057.97 216508 from N1/4 –0.684 0.2312 488 SHAZ /8/ Nf3 Ns3 –0.030 979.9 225005 from N1/4 –0.400 0.0206 67
Transition life
1
fTNb c
f
f
E
INTEGRITET I VEK KONSTRUKCIJA Vol. 17, br. 1 (2017), str. 61–73
STRUCTURAL INTEGRITY AND LIFEVol. 17, No 1 (2017), pp. 61–73
71

Behaviour of Nionikral-70 in low-cycle fatigue Niskociklični zamor uzoraka čelika Nionikral 70
In Fig. 16a (for Ns1 (PM), Ns2 (RWJ) and Ns3 (SHAZ)) the relationship between max and /2 is shown for all strain levels, and one can observe that the linear dependen-cies max–Nf and /2–Nf intersect in a certain cycle Nf. BCLCF defined through appropriate stabilized hysteresis, with finite transition life NfT, are shown in Fig. 16b (for Ns1 (PM), Ns2 (RWJ) and Ns3 (SHAZ)). In Table 7 the transition life for PM, RWJ and SHAZ of steel NN-70 is calculated based on parameters determined according to the methodol-ogy for determining stabilized hysteresis, /8/, and the requirements and recommendation of ISO 12106: 2003 (E), /6/, for determining stabilized hysteresis.
Transition life, NfT, for PM, RWJ and SHAZ of steel NN-70 ranges in an interval from 67 to 488 cycles, i.e. the biggest transition life has RWJ and is about 2 times higher than transition life PM, and about 7 times higher than tran-sition life SHAZ.
Characteristics of LCF for PM, SHAZ, /8/, and RWJ, /15/, of steel NN-70, are determined according to recom-mendation from ISO 12106: 2003 (E) /6/ (determination of stabilised hysteresis based on load-force drop by 25% since the end of stabilization), and are shown in Tables 4 to 7.
CONCLUSIONS
Theoretical, experimental and numerical research of the behaviour of low-alloy high-strength steels and their weld-ed joints exposed to loading induced by low-cycle fatigue described in this paper is a very complex research task. Extensive theoretical studies have required synthesis of knowledge in multiple engineering fields and disciplines, and numerical and experimental studies are an important part of this work. Detailed analysis of the historical review of research in this area and analyses of the latest published results as well, have provided the basis for further research in the field of low-cycle fatigue.
One of the goals of the research imposed itself during the processing of the results of experimental investigations, and is expressed through improvement of the methodology and methods of processing low cycle fatigue test results in order to establish a universal methodology for assessment of the behaviour of materials affected by low-cycle load. Through the analysis of the existing results the need arises for further research and the establishment of new universal principles, regarding the accuracy of determination and calculation of parameters, using various computer applications, describing the behaviour of materials, either directly, or indirectly.
From certain characteristic stabilized hystereses, based on criteria from defined standards, the data necessary to determine the equations of characteristic curves of low-cycle fatigue are collected, which are useful for providing mutual quantitative and qualitative comparison.
The new methodology for determining the area of stabi-lized hystereses and the possibility to select stabilized hys-tereses for a default criterion opens new perspectives for future research. This applies to the use in low-cycle fatigue tests of other materials with a default criterion for determin-ing stabilized hystereses in different operating conditions.
As one of the most interesting and promising directions for future research, the application of developed method-
ology imposes itself in order to define the size of a fatigue crack as a major parameter for characterization of the exist-ence of fatigue under conditions of variable load as a qual-ity possible for determining fatigue life and the assessment of material resistance to crack initiation, whose propagation can be traced to its critical size by NDT methods.
The results obtained represent a practical contribution in estimating the behaviour of low-alloy high-strength steel NN-70 and its welded joints exposed to effects of low-cycle fatigue.
ACKNOWLEDGEMENTS
This work is a contribution to Project TR 35011, funded by the Ministry of Education, Science, and Technological Development of the Republic of Serbia.
REFERENCES
1. Grabulov, V., Prilog definisanju uticaja hemijskog sastava i debljine lima na pojavu prskotina u zavarenim spojevima čelika Nionikral 70, Magister Thesis (in Serbian), University of Belgrade, Faculty of Technology and Metallurgy, 1986.
2. Sedmak, S., Petrovski, B., Sedmak, A. (1992), The resistance to crack growth of different regions of weldments in a real structure. Int. J Pres. Ves. & Piping, 52(3): 313-335.
3. Grabulov, V., Blačić, I., Radović, A., et al. (2008), Toughness and ductility of high strength steels welded joints, Struct. Integ. and Life, 2008, 8(3): 181-190.
4. Zrilić, M., Grabulov, V, Burzić, Z., et al. (2007), Static and impact crack properties of a high-strength steel welded joint. Int. J Pres. Ves. & Piping, 84(3): 139-150.
5. Gubeljak, N., Predan, J., Rak, I., Kozak, D. (2009), Integrity assessment of HSLA steel welded joint with mis-matched strength, Struct. Integ. and Life, 9(3): 157-164.
6. ISO 12106:2003(E): Metallic materials-fatigue testing-axial-strain-controlled method, Geneva: ISO 2003, Switzerland.
7. ASTM E606-04, Standard practice for strain-controlled fatigue testing, ASTM International, West Conshohocken, PA, USA.
8. Aleksić, V., Niskociklični zamor niskolegiranih čelika povišene čvrstoće, PhD Thesis submitted working title (in Serbian), University of Belgrade, Faculty of Tech. and Metall., 2016.
9. Das, A., Chowdhury, T., Tarafder, S. (2014), Ductile fracture micro-mechanisms of high strength low alloy steels, Materials and Design, 54: 1002-1009.
10. Ślęzaka, T., Śnieżeka, L., A comparative LCF study of S960 QL high strength steel and S355J2 mild steel, 1st Int. Conf. on Struct. Integ., Procedia Engineering, 114 (2015): 78-85.
11. De Jesus, A.M.P., Ribeiro, A.S., Fernandes, A.A. (2006), Low and high cycle fatigue and cyclic elasto-plastic behavior of the P355NL1 steel, J Press. Vess. Tech., 128(3): 298-304.
12. Radović, N., Drobnjak, Đ. (2001), Development of steels for fabrication of welded constructions with improved safety, Zavarivanje i zavarene konstrukcije, 46(3): 81-92.
13. Radović, A., Marković, D., Osvajanje brodograđevnog čelika povišene čvrstoće -NIONIKRAL-70, VTI, Beograd, 1984.
14. SRPS EN ISO 9692-1:2012, Zavarivanje i srodni postupci - Preporuke za pripremu spoja - Deo 1: Ručno elektrolučno zavarivanje topivom elektrodom, elektrolučno zavarivanje u zaštitnom gasu sa topivom elektrodnom žicom, gasno zavari-vanje, TIG zavarivanje i zavarivanje čelika snopom, Institut za standardizaciju Srbije, Beograd, Srbija, 2012.
15. Bulatović, S., Elasto-plastično ponašanje zavarenog spoja od niskolegiranog čelika povišene čvrstoće u uslovima niskociklič-nog zamora, PhD Thesis (in Serbian), University of Belgrade, Faculty of Mechanical Engineering, 2014.
INTEGRITET I VEK KONSTRUKCIJA Vol. 17, br. 1 (2017), str. 61–73
STRUCTURAL INTEGRITY AND LIFEVol. 17, No 1 (2017), pp. 61–73
72
Behaviour of Nionikral-70 in low-cycle fatigue Niskociklični zamor uzoraka čelika Nionikral 70
INTEGRITET I VEK KONSTRUKCIJA Vol. 17, br. 1 (2017), str. 61–73
STRUCTURAL INTEGRITY AND LIFEVol. 17, No 1 (2017), pp. 61–73
73
16. Bulatović, S., Burzić, Z., Aleksić, V., Sedmak, A., Milović, Lj. (2014), Impact of choice of stabilized hysteresis loop on the end result of investigation of high-strength low-alloy (HSLA) steel on low cycle fatigue, Metalurgija, 53(4): 477-480.
17. Bulatović, S., Milović, Lj., Sedmak, A., Samardžić, I. (2014). Identification of low cycle fatigue parameters of high strength low-alloy (HSLA) steel at room temperature, Metalurgija, 53 (4): 466-468.
18. Milović, Lj., Vuherer, T., Blačić, I., Vrhovac, M., Stanković, M. (2013). Microstructures and mechanical properties of creep resistant steel for application at elevated temperatures, Mate-rials and Design, 46: 660-667.
19. Boronski, D. (2004), The effect of the method of determination of Young’s modulus on the estimation of fatigue life of struc-tural elements, J Theor. and Appl. Mech., 42(2): 269-283.
20. Posavljak, S., Naponsko-deformaciona analiza i zamor materi-jala rotacionih diskova turbomlaznih motora, Magister Thesis (in Serbian), University of Belgrade, Faculty of Mech. Engng., Belgrade, 1999.
21. Posavljak, S., Istraživanje zamornog veka rotacionih diskova avionskih motora, PhD Thesis (in Serbian), University of Bel-grade, Faculty of Mech. Engng., Belgrade, 2008.
22. Schijve, J., Fatigue of Structures and Materials, Kluwer Aca-demic Publishers, New York, Boston, Dordrecht, London, Moscow, 2004.
23. Bannantine, J.A., Comer, J., Handrock, J., Fundamentals of Metal Fatigue Analysis, Prentice-Hall, Englewood Cliffs, New Jersy, 1990.
24. Janković, D.M., Malociklusni zamor, Univerzitet u Beogradu, Mašinski fakultet, Beograd, 2001. (in Serbian)
25. Janković, D.M., Eksperimentalno određivanje tokova zamara-nja materijala pri ciklično promenljivim elasto-plastičnim deformacijama, PhD Thesis (in Serbian), Univ. of Belgrade, Faculty of Mech. Engng., Belgrade, 1988.
26. Pippan, R., Grosinger, W. (2013), Fatigue crack closure: from LCF to small scale yielding, Int. J Fatigue, 46: 41-48.
27. Byrne, J., Hall, R.F., Powell, B.E. (2003). Influence of LCF overloads on combined HCF/LCF crack growth, Int. J Fatigue, 25(9-11): 827-834.
28. Huang, Z.Y., Wagner, D., Bathias, C., Chaboche, J.L. (2011), Cumulative fatigue damage in low cycle fatigue and gigacycle fatigue for low carbon-manganese steel, Int. J Fatigue, 33(2): 115-121.
29. Ding, J., Hall, R.F., Byrne, J., Tong, J. (2007). Fatigue crack growth from foreign object damage under combined low and high cycle loading. Part I: Experimental studies, Int. J Fatigue, 29: 1339-1349.
30. Vuherer, T., Milović, L., Gliha, V. (2011). Behaviour of small cracks during their propagation from Vickers indentations in coarse-grain steel: An experimental investigation, Int. J Fatigue, 33(12): 1505-1513.
31. Starke, P., Walther, F., Eifler, D. (2006). PHYBAL - A new method for lifetime prediction based on strain, temperature and electrical measurements, International Journal of Fatigue, 28: 1028-1036.
32. Aleksić, V., Aleksić, B., Milović, Lj., Methodology for deter-mining the region of stabilization of low-cycle fatigue, Book of Abstracts, 16th Int. Conf. on New Trends in Fatigue and Frac. (NT2F16) ed. Ž. Božić, Zagreb, Croatia, 2016, pp.189-190.
33. Aleksić, V., Milović, Lj., Aleksić, B., Hemer, A.M., Indicators of HSLA steel behavior under low cycle fatigue loading, 21st Euro. Conf. on Fracture, ECF21, 2016, Catania, Italy, Procedia Struc. Integrity Vol.2, Part 5 (2016): 3313-3321.
34. Aleksić, V., Aleksić, B., Milović Lj., Metodologija određiva-nja pokazatelja ponašanja HSLA čelika pri delovanju nisko-cikličnog zamora, (in Serbian) 5th Int. Congress ‘Engng., Envir. and Mat. in Proc. Industry’, Jahorina, Bosnia & Herzegovina (2017), CD, pp.1123-1135.
35. Kostaes, D., Fatigue Behaviour and Analysis, Talat Lecture 2401, EAA – European Aluminium Association, 1994.
36. Xue, L. (2008), A unified expression for low cycle fatigue and extremely low cycle fatigue and its implication for monotonic loading, Int. J Fatigue, 30(10-11): 1691-1698.
37. Niesłony, A., Dsoki, C.el, Kaufmann, H., Krug, P. (2008), New method for evaluation of the Manson-Coffin-Basquin and Ramberg-Osgood equations with respect to compatibility, Int. J Fatigue, 30(10): 1967-1977.
38. Meggiolaro, M.A., Castro, J.T.P. (2004). Statistical evaluation of strain-life fatigue crack initiation predictions, Int. J Fatigue 26(5): 463-476.
39. Murakamia, Y., Miller, K.J. (2005). What is fatigue damage? A view point from the observation of low cycle fatigue process, Int. J Fatigue, 27(8): 991-1005.
40. Bandara, C.S., Siriwardane, S.C., Dissanayake, U.I., Dissana-yake, R. (2016). Full range S-N curves for fatigue life evalua-tion of steels using hardness measurements, Int. J Fatigue, 82(2): 325-331.
41. ASTM E111-04 (2010): Standard Test Method for Young’s Modulus, Tangent Modulus, and Chord Modulus, ASTM Desig-nation E111-04, PA 19428-2959, USA.
42. Kandil, F.A. (1999). Potential ambiguity in the determination of the plastic strain range component in LCF testing, Int. J Fatigue, 21(10): 1013-1018.
43. Polak, J. (2005). Plastic strain-controlled short crack growth and fatigue life, International Journal of Fatigue, 27(10): 1192-1201.
© 2017 The Author. Structural Integrity and Life, Published by DIVK (The Society for Structural Integrity and Life ‘Prof. Dr Stojan Sedmak’) (http://divk.inovacionicentar.rs/ivk/home.html). This is an open access article distributed under the terms and conditions of the Creative Commons Attribution-NonCommercial-NoDerivatives 4.0 International License