Pultruded GFRP Sections as Stay-in-Place Structural Open ...

For Peer Review
Behaviour of hollow pultruded GFRP square beams with
different shear span-to-depth ratios
Journal: Journal of Composite Materials
Manuscript ID: Draft
Manuscript Type: Original Manuscript
Date Submitted by the Author: n/a
Complete List of Authors: Muttashar, Majid; University of Southern Queensland, Centre of Excellence in Engineered Fibre Composites Karunasena, Warna; University of Southern Queensland, Centre of Excellence in Engineered Fibre Composites Manalo, Allan; University of Southern Queensland, Centre of Excellence in Engineered Fibre Composites Lokuge, Weena; University of Southern Queensland, Centre of Excellence in Engineered Fibre Composites
Keywords: Pultruded sections, fibre composites, elastic properties, characterization, shear span, full-scale testing
Abstract:
It is important to determine accurately the elastic properties of fibre reinforced polymer (FRP) composites material, considering that their member design is often governed by deflection rather than strength. In this study, the elastic properties of the pultruded glass FRP (GFRP) square sections were evaluated firstly using full-scale with different shear span to depth (a/d) ratios and tested under static four-point bending. Back calculation and simultaneous methods were then employed to evaluate the flexural modulus and shear stiffness and were compared with the results of the coupon tests. Secondly, the full-scale beams were tested up to failure
to determine their capacity and failure mechanisms. Finally, prediction equations describing the behaviour of the pultruded GFRP square beams were proposed and compared with the experimental results. The results indicate that the back calculation method gives more reliable values of elastic properties of GFRP profiles. In addition, the behaviour of the beams is strongly affected by the a/d ratios. The shear was found to have a significant contribution on the behaviour of beams with lower a/d ratios while the flexural stress played a major part for higher a/d ratios. The proposed equation, which accounts for the combined effect of the shear and flexural stresses, reasonably predicted the failure load of pultruded GFRP square beams.
http://mc.manuscriptcentral.com/jcm
Journal of Composite Materials

For Peer Review
Page 1 of 30
http://mc.manuscriptcentral.com/jcm
Journal of Composite Materials
123456789101112131415161718192021222324252627282930313233343536373839404142434445464748495051525354555657585960

For Peer Review
0
Research paper
Behaviour of hollow pultruded GFRP square beams with different shear
span-to-depth ratios (Title contains 11 words)
Running headline: Behaviour of Hollow Pultruded GFRP square Beams with Different Shear Span-to-Depth Ratios (78 characters)
by
Majid Muttashar1, 2, Warna Karunasena
1, Allan Manalo
1,* and Weena Lokuge
1
1 Centre of Excellence in Engineered Fibre Composites (CEEFC),
School of Civil Engineering and Surveying, University of Southern Queensland,
Toowoomba, 4350, Australia 2 Department of Civil Engineering, College of Engineering, University of Thi Qar, Iraq.
Submitted to
Journal of Composite Materials
Corresponding Author*:
Allan Manalo
Senior Lecturer in Civil Engineering (Structural)
Centre of Excellence in Engineered Fibre Composites (CEEFC),
School of Civil Engineering and Surveying,
University of Southern Queensland,
Toowoomba, Queensland 4350, Australia
E-mail: [email protected]
Manuscript summary:
Total pages 21 (including 1-page cover)
Number of figures 18
Number of tables 7
Page 2 of 30
http://mc.manuscriptcentral.com/jcm
Journal of Composite Materials
123456789101112131415161718192021222324252627282930313233343536373839404142434445464748495051525354555657585960

For Peer Review
1
Behaviour of hollow pultruded GFRP square beams with different shear
span-to-depth ratios
Majid Muttashar
1, 2, Warna Karunasena
1, Allan Manalo
1,* and Weena Lokuge
1
Abstract
It is important to determine accurately the elastic properties of fibre reinforced polymer
(FRP) composites material, considering that their member design is often governed by
deflection rather than strength. In this study, the elastic properties of the pultruded glass FRP
(GFRP) square sections were evaluated firstly using full-scale with different shear span to
depth (a/d) ratios and tested under static four-point bending. Back calculation and
simultaneous methods were then employed to evaluate the flexural modulus and shear
stiffness and were compared with the results of the coupon tests. Secondly, the full-scale
beams were tested up to failure to determine their capacity and failure mechanisms. Finally,
prediction equations describing the behaviour of the pultruded GFRP square beams were
proposed and compared with the experimental results. The results indicate that the back
calculation method gives more reliable values of elastic properties of GFRP profiles. In
addition, the behaviour of the beams is strongly affected by the a/d ratios. The shear was
found to have a significant contribution on the behaviour of beams with lower a/d ratios
while the flexural stress played a major part for higher a/d ratios. The proposed equation,
which accounts for the combined effect of the shear and flexural stresses, reasonably
predicted the failure load of pultruded GFRP square beams.
1 Centre of Excellence in Engineered Fibre Composites (CEEFC), School of Civil Engineering and
Surveying, University of Southern Queensland, Toowoomba, 4350, Australia
2 Department of Civil Engineering, College of Engineering, University of Thi Qar, Iraq.
*Corresponding author:
Allan Manalo, Centre of Excellence in Engineered Fibre Composites (CEEFC), School of Civil
Engineering and Surveying, University of Southern Queensland, Toowoomba, 4350, Australia
Email: [email protected]
Page 3 of 30
http://mc.manuscriptcentral.com/jcm
Journal of Composite Materials
123456789101112131415161718192021222324252627282930313233343536373839404142434445464748495051525354555657585960

For Peer Review
2
Keywords: Elastic properties, characterization, shear, flexural, failure load, GFRP beams
Introduction
Fibre reinforced polymer (FRP) composites emerged as a promising material to satisfy the
increasing demand for better performing and more durable civil infrastructures 1. Recently,
FRP composites have been used in bridges, because of their high stiffness, strength-to-weight
ratios, corrosion resistance and durability 2. In addition to these superior properties, the
process of producing FRP sections allows the designer to specify different material properties
for different parts of the cross section 3. Nevertheless, the use of these advanced materials in
structural applications is constrained due to limited knowledge on their material properties
and structural behaviour. Therefore it is of paramount importance to investigate the properties
of pultruded FRP sections so that they can be broadly utilised in structural applications.
A number of micromechanical simulations have already been developed to predict the
properties of pultruded beams such as flexural and shear modulus4-6
. The mechanical
properties estimated using these models showed a good correlation with the experimental
results. However, the models require accurate information on the processing details of the
FRP profiles such as individual properties of fibres and resin, the fibre volume fraction and
the composition of the laminates 7. Therefore, the use of these models as a design tool for
structural purposes is likely to complicate the process. Thus, several researchers investigated
coupon specimens to determine the effective mechanical properties of the composites and
used these properties to predict the behaviour of full scale pultruded FRP profiles 8, 9
.
Manaloet al. 10
mentioned that there are limited test methods and equipment to characterise
the properties of thick FRP composites by using the results of coupon tests. Moreover, the
limited dimensions in the transverse direction of the majority of the pultruded GFRP sections
added a new obstacle to the applicability of available test standards 11
. The complex internal
Page 4 of 30
http://mc.manuscriptcentral.com/jcm
Journal of Composite Materials
123456789101112131415161718192021222324252627282930313233343536373839404142434445464748495051525354555657585960

For Peer Review
3
structure of composites and/or the variation of its mechanical properties within the element
itself warrant testing of full scale sections to obtain realistic design properties.
Guadeset al. 12
conducted an experimental investigation to characterise the
mechanical properties of square pultruded sections (100 mm x 100 mm) using both coupon
and full – scale specimens. Although, there was a good agreement between the coupon and
full-scale results for single span beams, the effect of shear deformation on the behaviour of
the pultruded profiles was neglected as the beam considered in sufficiently long. Bank 13
indicated that the effect of shear on thin walled FRP sections is very significant especially for
shorter beams and should be considered in determining the elastic properties of composite
material. In support of this, Bank 13
and Neto and Rovere 14
conducted experiments using
full-scale sections to determine the flexural (E) and shear (G) modulus of FRP composite
beams. In both situations, three – point bending tests were used to characterise the behaviour
of beams with different spans. Even though same test procedure and almost similar section
properties were used in both research, there was a huge difference between the calculated
E/G ratios as Bank 13
determined the elastic modulus based on Timoshenko Beam Theory
while Neto and Rovere 14
used the graphical (simultaneous) test method. Mottram 15
stated
that the sensitivity of the graphical method in determining the slope (of the regression line
through the data points) can lead to a significant change in the E and G calculations. As a
result, there is a need to revisit the graphical method used to find the flexural and shear
modulus.
To the authors’ knowledge, there are very limited experimental studies conducted to
determine the structural properties of full – scale FRP composite beams made of vinyl ester
resin with E-glass fibre reinforcement oriented in different directions. In this study, hollow
pultruded GFRP square beams with different shear span-to-depth (a/d) ratios were tested
using static four – point bending configuration. Graphical (simultaneous) and back
Page 5 of 30
http://mc.manuscriptcentral.com/jcm
Journal of Composite Materials
123456789101112131415161718192021222324252627282930313233343536373839404142434445464748495051525354555657585960

For Peer Review
4
calculation methods were used to calculate the E and G and compared with the results of the
coupon test. In addition, the effect of a/d ratio on the strength and failure behaviour of the
GFRP beams was analysed. Based on the experimental results of this research, a simplified
prediction equation to obtain the failure load of the GFRP beams was proposed with due
consideration given to the effect of a/d ratio. These predicted failure loads are then compared
with the experimental results.
Determination of flexural and shear modulus (Beam Theory)
The relatively low elastic modulus of GFRP leads to designs being governed by deflection
and buckling limitations, instead of strength 16, 17
. In addition, the anisotropic nature of the
FRP composites results in low shear modulus to longitudinal elastic modulus ratio.
Accordingly, the contribution of shear deformation in the total deformation becomes
significant and should be considered in designing composite structures3, 5, 14
. This shear
contribution can be theorised by using Timoshenko beam theory. This theory incorporates
shear deformation of thin walled composite sections in deflection and investigates its effect in
a quantitative manner in order to reliably determine the E and G for the pultruded FRP
section. In this method the controlling equations are:
�� �∅�� = � (1)
�� + ∅ =
��� (2)
where I is the second moment of area, ∅is the bending slope, M is the bending moment, δ is
the total deflection, V is the shear force and A is the cross- sectional area. The shear
coefficient K is a constant which accounts for the shear distribution over the beam cross
section. For homogenous box profile, K can be calculated using the equation recommended
by Bank 7:
K = ��������∗� �� ����� (3)
Page 6 of 30
http://mc.manuscriptcentral.com/jcm
Journal of Composite Materials
123456789101112131415161718192021222324252627282930313233343536373839404142434445464748495051525354555657585960

For Peer Review
5
where υ, G and E refer to the longitudinal Poisson’s ratio, shear modulus and elastic modulus,
respectively of the section. By solving equations 1 and 2 for the case of four- point load
bending with the load applied at a distance (a) from the support point (a=L/3 in this case,
where L is the beam span), the total deflection can be obtained as follows:
! = �"#$%���&'( + #$
&)*+ (4)
where P is the total applied load, EI is the flexural stiffness and KGA is the shear stiffness.
Two techniques are commonly used to calculate EI and KGA by using the above
equation. The first technique is called “back calculation method (BCM)” which was based on
the Bernoulli equation to determine the EI from the strain readings on the outer flange
surfaces at mid-span (in the constant moment region):
�� = ,-. (5)
where c is the distance from the neutral axis to the outermost fibre, and ε is the measured
strain. After EI is calculated, Equation 4 can be used to back calculate KGA.
The second technique is referred to as “simultaneous method (SM)” where at least
two different spans should be investigated experimentally. Each test produces a data set for
load, deflection and span. These three terms are known in Equation 4 with EI and KGA as
two unknowns. For better interpretation of the method, Equation 4 is divided throughout by
PL/6A as follows:
&+/#$ = �"
��&' 0$12
� + �)* (6)
This represents a straight line, with (L/r) 2
being the independent variable on the horizontal
axis and 6Aδ/PL being the dependent variable on the vertical axis. Herein, r is the radius of
gyration of the section defined by3 = 4� 5� . By plotting the variable &+/#$ against0$
12�, the
elastic modulus can be found from the slope of the straight line and the shear modulus from
the intercept on the vertical axis:
Page 7 of 30
http://mc.manuscriptcentral.com/jcm
Journal of Composite Materials
123456789101112131415161718192021222324252627282930313233343536373839404142434445464748495051525354555657585960
For Peer Review
6
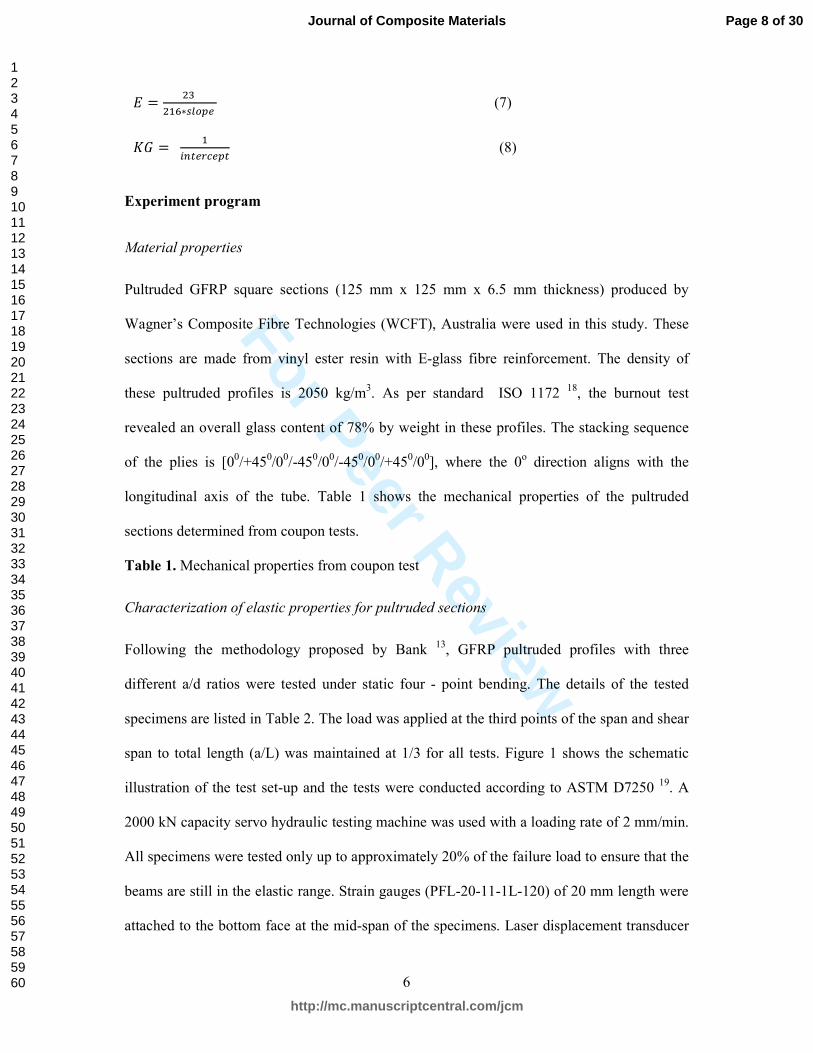
� = �"��&∗6789: (7)
;< = �=>?:1-:9? (8)
Experiment program
Material properties
Pultruded GFRP square sections (125 mm x 125 mm x 6.5 mm thickness) produced by
Wagner’s Composite Fibre Technologies (WCFT), Australia were used in this study. These
sections are made from vinyl ester resin with E-glass fibre reinforcement. The density of
these pultruded profiles is 2050 kg/m3. As per standard ISO 1172
18, the burnout test
revealed an overall glass content of 78% by weight in these profiles. The stacking sequence
of the plies is [00/+45
0/0
0/-45
0/0
0/-45
0/0
0/+45
0/0
0], where the 0
o direction aligns with the
longitudinal axis of the tube. Table 1 shows the mechanical properties of the pultruded
sections determined from coupon tests.
Table 1. Mechanical properties from coupon test
Characterization of elastic properties for pultruded sections
Following the methodology proposed by Bank 13
, GFRP pultruded profiles with three
different a/d ratios were tested under static four - point bending. The details of the tested
specimens are listed in Table 2. The load was applied at the third points of the span and shear
span to total length (a/L) was maintained at 1/3 for all tests. Figure 1 shows the schematic
illustration of the test set-up and the tests were conducted according to ASTM D7250 19
. A
2000 kN capacity servo hydraulic testing machine was used with a loading rate of 2 mm/min.
All specimens were tested only up to approximately 20% of the failure load to ensure that the
beams are still in the elastic range. Strain gauges (PFL-20-11-1L-120) of 20 mm length were
attached to the bottom face at the mid-span of the specimens. Laser displacement transducer
Page 8 of 30
http://mc.manuscriptcentral.com/jcm
Journal of Composite Materials
123456789101112131415161718192021222324252627282930313233343536373839404142434445464748495051525354555657585960

For Peer Review
7
was used to measure the mid-span deflection. The applied load and the deflection of the
loading ram were recorded using the Systems 5000 data acquisition system.
Table 2. Details of the specimens tested for the elastic properties
Figure 1. Experimental set-up for characterisation of elastic properties.
Behaviour of hollow pultruded GFRP composite beams
Hollow GFRP pultruded sections with four different a/d ratios were tested up to failure under
static four point bending test. In contrast to section 3.2, the load was applied at the two points
with a load span equal to 300 mm. The constant load span was used to keep the upper face of
the section under same condition for all specimens and to take account of the limitation on
the length of the test frame. Vertical supports were provided to prevent lateral buckling. The
details of the tested specimens are listed in Table 3. Figure 2 shows the experimental set up.
A 2000 kN capacity universal machine was used for applying the load. Steel plates were
provided at the support and loading points to minimise indentation failure.
Table 3. Details of the specimens tested for the behaviour of GFRP beams
Figure 2. Experimental setup for the behaviour of GFRP beams.
Experimental results and observations
The experimental results for the elastic properties and the behaviour of full scale beams are
discussed in this section.
Elastic properties of GFRP sections
E and G using back calculation method. The load versus deflection curves for all specimens
are shown in Figure 3. Linear elastic behaviour up to 20 kN can be observed from these. The
variations of E and KGA with load for all specimens are shown in Figures 4 to 6. From these
curves, it can be seen that these parameters start at a high value but reduce with increasing
load. In order to minimise the errors that might have occurred due to deflection
Page 9 of 30
http://mc.manuscriptcentral.com/jcm
Journal of Composite Materials
123456789101112131415161718192021222324252627282930313233343536373839404142434445464748495051525354555657585960

For Peer Review
8
measurements in this study, EI and KGA were computed from the average of several points
spaced within a range of L/800 to L/600 deflection as suggested by Hayes and Lesko 20
. The
average calculated values of E and KGA from the BCM are summarized in Table 4. In this
table, a numerical value for the moment of inertia has been used. The shear modulus G is
separated from KGA using the k determined from equation (3) and the nominal cross section
area of the beam. The average value of E was 47.2 GPa which is 20% higher than the coupon
test results. The higher flexural modulus obtained from the full section compared with the
coupon specimens can be related to the continuity of ±45o
fibres along the length of the
pultruded beams. In addition, the shear modulus value of 4 GPa is comparable with the value
suggested by Mottram 15
for a standard GFRP pultruded profile.
Figure 3. Load – deflection relationship for GFRP beams.
Figure 4. Elastic modulus (E) and Shear stiffness (KGA) versus Load for a/d =1.6
Figure 5. Flexural Modulus (E) and Shear Stiffness (KGA) versus Load for a/d =2.4
Figure 6. Flexural Modulus (E) and Shear Stiffness (KGA) versus Load for a/d =3.2
Table 4. Summary of average E and KGA for each span for GFRP beam testing (BCM)
E and G using simultaneous method. In order to determine the elastic properties E and G, a
graph for 6Aδ/PL versus (L/r) 2 was plotted as shown in Figure 7. A linear regression was
used to obtain the slope, intercept and the coefficient of correlation, which are also shown in
the figure. The E and G values were then calculated using equations 7 and 8, respectively.
The calculated E in this method is 56.1 GPa which is higher than the coupon test results by
about 43 %. In contrast, G is 3.3 GPa which is less than the average value for standard
pultruded profiles by about 17 %.
Figure 7. Typical graph to determine E and KG using simultaneous method.
Behaviour of hollow pultruded GFRP composite beams
Page 10 of 30
http://mc.manuscriptcentral.com/jcm
Journal of Composite Materials
123456789101112131415161718192021222324252627282930313233343536373839404142434445464748495051525354555657585960

For Peer Review
9
Load-deflection behaviour. Figure 8 shows the load - deflection curves for the GFRP
pultruded beams, which shows a linear behaviour until failure. There is a non- linear response
before the final failure for the beams with a/d ratios of 1.2 and 2.4. This behaviour is possibly
due to the crushing of the corners of the specimen at the support and at the loading points
which leads to separation of the web – flange junction. This progressive failure results in the
web to continue carrying the applied load. The load carrying capacity of the beam is affected
by the variation of the a/d ratio whereas a decreasing trend was observed with increasing a/d
ratio. All the beams show a brittle failure in both flexural and transverse shear failure modes.
Table 5 presents a summary of the test results with respect to failure load, corresponding
deflection and failure mode.
Table 5. Summary of experimental results for GFRP beams
Stress -strain behaviour. The strain measurements for the beams at the top and bottom faces
in addition to the strain at the shear path are shown in Figures 9 to 11. It can be seen that the
tension strain at the bottom face is higher than the top face compression strain (i.e. for a/d
ratio of 6 and stress 250 MPa the tension strain reaches 4700 micro strain compared with
4000 micro-strain in the compression side). There was a different trend in the strain on the
top and bottom sides. The tension strains increased linearly up to failure, whereas the
compression strains began to decrease non – linearly as the load exceeded approximately
75% of the ultimate failure load. At the top side, the strain was negative demonstrating that
the profile is compressed, as expected. With increasing load, however, the values tend to
become positive indicating that the top surface is moving from being compressed to
tensioned as shown in Figure 9. This behaviour reflects the onset of buckling considering
that the flange can be assumed to be simply supported at the loading points. Consequently,
the increase in the applied load increased the compression component of the moment which
results in a local buckling of the flange. Figure 10 shows that the tensile strain decreases
Page 11 of 30
http://mc.manuscriptcentral.com/jcm
Journal of Composite Materials
123456789101112131415161718192021222324252627282930313233343536373839404142434445464748495051525354555657585960

For Peer Review
10
with decreasing shear span. The bottom side of the tested specimens were subjected to
extensive tensile straining although failure cannot be observed there even after the
compression region at the loading zone has failed entirely. Figure 11 shows that shear strain
increases with decreasing a/d due to the fact that a significant portion of the shear is
transferred directly to the support by an inclined strut. As a result the amount of the direct
load transfer increases with decreasing a/d ratio. In summary, the failure initiated at web –
flange junction and followed by buckling and/or crushing in the web depending on the a/d
ratio: beams with higher a/d ratio experienced buckling failure whereas beams with lower
a/d ratio experienced crushing.
Figure 8. Load – deflection curves for GFRP beams.
Figure 9. Stress versus compression strain.
Figure 10. Stress versus tensile strain.
Figure 11. Stress versus shear strain.
Failure mode. The different failure modes of the GFRP beams are shown in Figure 12. The
observed failure modes can be classified as flexural failure and transverse shear failure. The
shorter beams (a/d ratios of 1.2 and 2.4) displayed progressive damage accumulation, which
is indicated by the drops in the load – deflection curves, with the increasing of the applied
load. It was observed that the specimens had cracked and some twisted away from the centre
towards one side. The mode of failure observed was transverse shear failure resulting in the
delamination and cracking of the fibre along the edges of the pultruded beam in addition to
local buckling on the compression flange as shown in Figures 13(a) and (b). Moreover, it was
observed that the failure initiated at web-flange junctions and followed by premature
buckling and crushing in the webs. This failure behaviour is described as a potential failure
for pultruded GFRP sections under concentrated bearing load conditions 21
. For beams with
a/d ratios of 3.6 and 6, the failure occurred at the points of loading and distinct cracks
Page 12 of 30
http://mc.manuscriptcentral.com/jcm
Journal of Composite Materials
123456789101112131415161718192021222324252627282930313233343536373839404142434445464748495051525354555657585960

For Peer Review
11
developed on the top surface and side of the tubes. Furthermore, cracks developed at the
intersection between the flange and the web due to the buckling, leading to separation
between them. It was also observed that delamination crack happened at the compression
surface and later progressed into the sides as a result of local buckling initiation as shown in
Figure 13(c) and (d). Similar observation was reported by Guadeset al. 12
and Kumaret al. 22
in their investigations on the flexural behaviour of 100 and 76 mm square pultruded FRP
tubes. In their studies, however, they reported that the final failure of the specimen occurs
mainly due to the effect of the local buckling of the thin wall which results in material
delamination and cracking of the fibre along the edges of the beam under the point loads.
Shear crack was not observed even for beams with the lowest a/d ratio. The possible reason
for this is the presence of the ±45o
plies in addition to the main fibre on the tube which
provides a stronger shear resistance along the transverse direction.
Figure 12. Failure modes of GFRP beams for different shear span to depth ratios.
Discussion
Determination of elastic properties. Table 6 gives a summary of the properties of the GFRP
profiles based on the coupon and full scale tests. It can be seen from this table that there is a
significant difference between the results determined from coupon and full scale tests. The
main reason between the coupon and full scale results is the effect of discontinuity of the
fibres (especially the +45o) in the small solid coupon of composite material. However, the
continuity of the fibres in the full-scale beam results in higher effective elastic properties than
the coupon specimens. Using these properties, the load-deflection behaviour of the full-scale
pultruded GFRP beams were calculated using equation 4 and compared with the experimental
results. Figure 13 displays comparison between the experimental and the predicted deflection
calculated by using Timoshenko Beam Theory (equation 4). Elastic properties obtained from
full scale test (using BCM and SM) and coupon test have been used to predict the deflection.
Page 13 of 30
http://mc.manuscriptcentral.com/jcm
Journal of Composite Materials
123456789101112131415161718192021222324252627282930313233343536373839404142434445464748495051525354555657585960

For Peer Review
12
It can be seen that the Timoshenko Beam Theory provides a good approximation for the
curves determined by the experimental tests. It can also be observed from the figure that
using the elastic properties from BCM to calculate the beam deflection showed a good
correlation with the experimental results for all a/d ratios. In contrast, analytical results using
SM underestimated the experimental results and using coupon test results overestimated the
deflection as shown in Figure 13. SM generally is relatively sensitive to the accuracy of the E
measurement. When the span is short and for the same applied load, the deflection is in
minimal. This observation is similar with Roberts and Al-Ubaidi 23
wherein they indicated
that the measured elastic properties of Pultruded FRP I-profile can change substantially
depending on the sensitivity of the graphical method. Therefore, it can be concluded that the
elastic properties (E and G) determined using the BCM can reliably predict the behaviour of
full scale GFRP beams.
Figure 14 shows the relationship between the flexural and shear deflection percentage
of total deflection as a function of a/d ratio. The flexural and shear deflection was calculated
using the average value obtained in this study (E/G = 11.6). It can be seen that the flexural
deflection constitutes approximately 40% of the total deflection for a/d of 1.2. In contrast,
shear deflection was 60 % for the same a/d ratio. These observations reflect the significant
contribution of shear deformation in the total deflection of beams with low shear span to
depth ratio. From the figure it can also be observed that the percentage of shear deflection is
less than 10% for a/d of 10 and a ratio of 20 is required to decrease the shear deflection to
less than 5%. Therefore, for composite beams with a/d equal or less than 10 the effect of
shear deformation should be accounted in the total deflection calculation.
Table 6. Summary of experimental properties for GFRP beams
Figure 13. Comparison of theoretical and experimental deflection of beams with different a/d
ratios.
Page 14 of 30
http://mc.manuscriptcentral.com/jcm
Journal of Composite Materials
123456789101112131415161718192021222324252627282930313233343536373839404142434445464748495051525354555657585960

For Peer Review
13
Figure 14. Contribution of flexural and shear deflection for beams with different a/d ratios.
Effect of a/d ratio on shear stress. The effects of shear span to depth ratio on the shear stress
of the GFRP beams were evaluated by calculating the shear stress experienced by the beams
using equation 9:
τ = A�BC (9)
where V is the shear force, Q is the first moment of area, I is the moment of inertia, and t is
the wall thickness. The calculated values of shear stress at failure for different a/d ratios of
the GFRP beams are shown in Figure 15. The results showed that the a/d ratio has a
significant effect on the shear stress experienced by the pultruded GFRP beams. The reason is
that the shorter span beams can be subjected to higher failure load which means higher shear
force resulting in higher shear stress according to Equation 9. As a result, it can be seen that
the shear stress increases with decreasing a/d ratio. Similar behaviour has been documented
for composite sandwich beams and timber beams tested with different a/d ratios 24-26
. The
authors indicated that shorter beam is subjected to a higher shear stress compared with longer
span beams. They also mentioned that due to the core weakness, the shorter beams failed due
to shear. In this study, no shear cracks were observed on the tested beams at the region of
maximum shear even for short span beams.
The relationship between the shear stress and the a/d ratios seems to be linear. Almost
all the tested sections failed in similar mode by local buckling under the applied load
followed by cracking at the compression side and the delamination of the plies. Although the
tensile strain is low for small a/d ratios, the bottom face of the beam displays a crushing of
fibres at the support without any failure at the mid-span as shown in Figure 12. The reason
for this is the higher applied load corresponding to lower a/d ratio.
Page 15 of 30
http://mc.manuscriptcentral.com/jcm
Journal of Composite Materials
123456789101112131415161718192021222324252627282930313233343536373839404142434445464748495051525354555657585960

For Peer Review
14
The maximum calculated shear stress of the pultruded GFRP beams with shear span to depth
ratio of 1.2 and 6 are 55 and 32 MPa, respectively. These shear stresses are 45% and 27%,
respectively, of the shear strength of the pultruded profile given in Table 1. These lower
percentages indicated that the shear stress is not only the factor which affected the behaviour
of the pultruded beams but also the flexural stress. Manaloet al. 10
mentioned that these
combined stresses played an important part in understanding the overall behaviour of
composites and should be considered in the design and analysis of composite materials.
Figure 15. Shear stress versus shear span to depth ratio for GFRP beam.
Effect of a/d ratio on flexural stress. The flexural behaviour of the GFRP hollow sections
have been studied by calculating the bending stress using equation 10:
σ = EFB (10)
The calculated bending stresses for GFRP beams with different a/d ratios are shown in Figure
16. It can be seen that the bending stress increases with increasing a/d ratio. The maximum
bending stress with a/d ratios of 1.2 and 6 are 98 and 300 MPa, respectively. These bending
stress values are 21% and 66% of the compression strength, respectively, and 13% and 41%,
respectively, of the tensile strength of the pultruded profile as mentioned in Table 1. This
explains the reason why the failure is happening at the compression side. Furthermore, the
results indicated that the specimen experiences considerable flexural stresses even at a/d ratio
of 1.2 which contributed to the failure mechanisms. Similar result was reported by Turvey
and Zhang 27
in their investigation on the shear failure strength of web – flange junctions in
pultruded GRP profiles. In their study, however, they reported that failure is a function of
combined high shear and bending stresses at the interfaces of different plies.
Figure 16. Bending stress versus shear span to depth ratio for GFRP beam.
Page 16 of 30
http://mc.manuscriptcentral.com/jcm
Journal of Composite Materials
123456789101112131415161718192021222324252627282930313233343536373839404142434445464748495051525354555657585960

For Peer Review
15
Effect of a/d ratio on failure mode. The GFRP pultruded beams showed a brittle failure mode.
The failure happened without any reduction in the slope of the load – deflection behaviour.
The beams with a/d ratio of more than 3 exhibited a flexural mode of failure. The failure of
those beams was controlled by the buckling under the load points followed by cracks and
delamination at the compression face in addition to a web – flange junction failure as shown
in Figures 12(c) and (d). The beams with a/d less than 3 showed a transverse shear failure.
This type of failure was resulting in the delamination and cracking of the fibre along the
edges of the pultruded beam in addition to local buckling on the compression flange. This
failure behaviour was reported by Turvey and Zhang 27
and Wu and Bai 21
as a web – flange
junction failure which caused mainly by the concentrated bearing load conditions. A change
in the slope of the load – deflection behaviour has been noticed. In some cases, it can be seen
that there are some drops in the load at the failure progress stage for the beams with spans
lower a/d ratios. This failure response is due to the progressive damage accumulation of the
section. No pure shear failure or shear cracks appeared in all of the tested beams. The main
reason for that is the stacking sequence of the plies of the GFRP pultruded sections are in the
form of ±45 degrees. It was clearly noticed that the failure cracks position was closer to the
top loading point than to the supports.
Prediction of failure load for pultruded GFRP beams with different a/d ratio
The contribution of the shear deformation was clearly observed for all a/d ratios considered in
this study. Therefore, in order to estimate the failure load of the pultruded GFRP beams, it is
important to account for the shear and the bending stresses in the prediction equation.
Proposed prediction equation
Based on the experimental results, buckling failure occurred at the concentrated load points
and/or near the support locations. The main reason for this behaviour is the high shear forces
Page 17 of 30
http://mc.manuscriptcentral.com/jcm
Journal of Composite Materials
123456789101112131415161718192021222324252627282930313233343536373839404142434445464748495051525354555657585960
For Peer Review
16
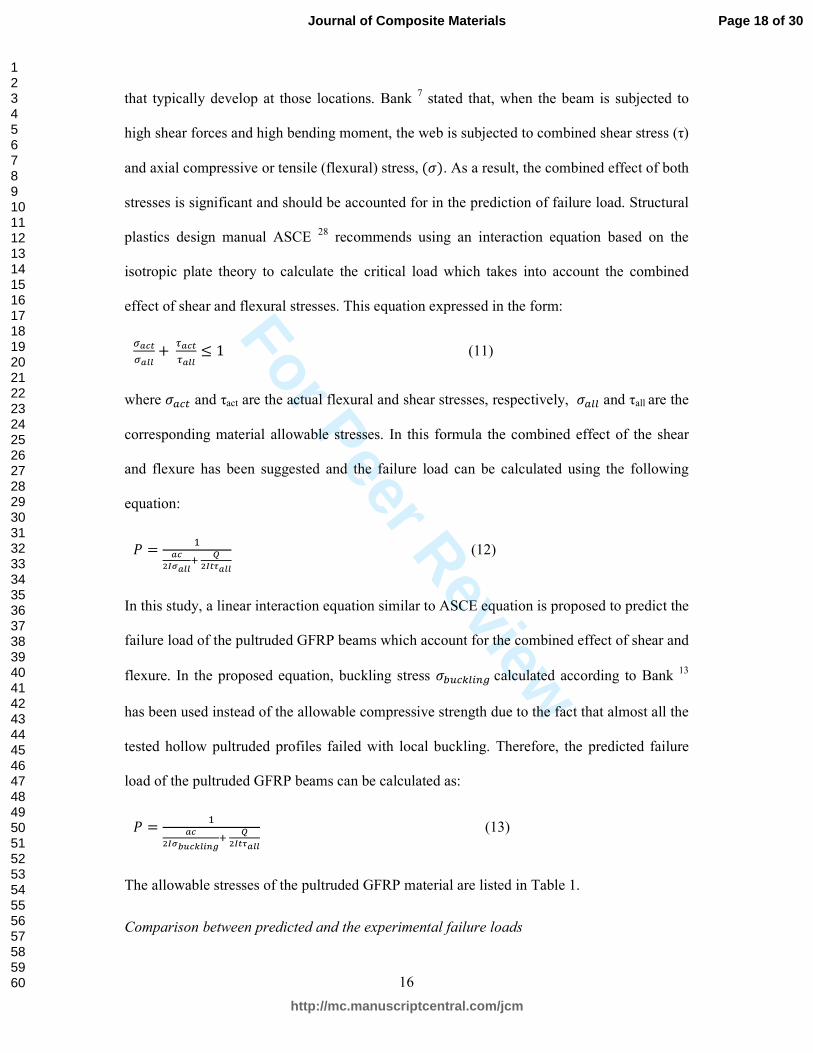
that typically develop at those locations. Bank 7 stated that, when the beam is subjected to
high shear forces and high bending moment, the web is subjected to combined shear stress (τ)
and axial compressive or tensile (flexural) stress,�G . As a result, the combined effect of both
stresses is significant and should be accounted for in the prediction of failure load. Structural
plastics design manual ASCE 28
recommends using an interaction equation based on the
isotropic plate theory to calculate the critical load which takes into account the combined
effect of shear and flexural stresses. This equation expressed in the form:
HIJKHILL
+ MIJKMILL
≤ 1 (11)
where GP-? and τact are the actual flexural and shear stresses, respectively, GP77 and τall are the
corresponding material allowable stresses. In this formula the combined effect of the shear
and flexure has been suggested and the failure load can be calculated using the following
equation:
Q = �IJ
RSTILL� URSKVILL
(12)
In this study, a linear interaction equation similar to ASCE equation is proposed to predict the
failure load of the pultruded GFRP beams which account for the combined effect of shear and
flexure. In the proposed equation, buckling stress GWX-Y7=>Zcalculated according to Bank 13
has been used instead of the allowable compressive strength due to the fact that almost all the
tested hollow pultruded profiles failed with local buckling. Therefore, the predicted failure
load of the pultruded GFRP beams can be calculated as:
Q = �IJ
RST[\J]L^_`� URSKVILL
(13)
The allowable stresses of the pultruded GFRP material are listed in Table 1.
Comparison between predicted and the experimental failure loads
Page 18 of 30
http://mc.manuscriptcentral.com/jcm
Journal of Composite Materials
123456789101112131415161718192021222324252627282930313233343536373839404142434445464748495051525354555657585960

For Peer Review
17
The predicted failure load of the pultruded GFRP beams tested using 4 – point load and the
percentage difference between the predicted and actual (experimental) average failure loads
are summarised in Table 7. For clarity, the comparison is also shown in Figure 17.
It can be seen from Table 7 and Figure 17 that the proposed equation (13) shows a good
agreement between the predicted and the actual failure load. For beam with a/d ratio 1.2, the
proposed equation overestimates the failure load by 11%. This indicates that the beams are
more likely to fail by transverse shear failure and the shear has the higher effect on the
section’s failure mode. In contrast, the flexural compression stress is the more dominant
stress to cause the failure for pultruded beams with a/d ratios of 3.6 – 6. Moreover, it can be
clearly noticed that the use of equation (12) to predict the failure load depends on the ultimate
flexural stress will overestimate the failure load by as much as 31 to 44 %. Figure 18 shows
the percentages of stress contribution from the failure stress of the pultruded beams. As seen
from the figure, for beams of a/d ratio 1.2, shear stress contribution (57%) for the failure load
is higher than that for the flexural stress (42%). For beams with higher a/d ratio, the flexural
stress becomes the dominant stress to cause the failure with 79% of the failure load compared
with 21% of shear stress, respectively. These percentages showed that the predicted
contributions compare well with the experimental contributions for shear and flexural
stresses. In general, the proposed equation 13 provided a conservative but practical estimation
of the failure load of the pultruded GFRP beams with different a/d ratios.
Table 7. Predicted failure load compared with the actual failure load
Figure 17. Comparison between the predicted and the actual failure loads.
Figure 18. Percentages of stress contribution from the total failure stress.
Conclusions
Page 19 of 30
http://mc.manuscriptcentral.com/jcm
Journal of Composite Materials
123456789101112131415161718192021222324252627282930313233343536373839404142434445464748495051525354555657585960

For Peer Review
18
The behaviour of GFRP pultruded square beams with different shear span to depth (a/d)
ratios was investigated using the four-point bending test. Similarly, the elastic properties of
the beams were determined by testing full-scale specimens. The following conclusions can be
drawn based on the results of the investigation:
1. The back calculation method gives more reliable values of effective flexural and shear
moduli of pultruded hollow GFRP square sections compared with simultaneous
method and coupon test. This method is based on the Bernoulli equation and uses the
strain readings at mid-span of the beam. A good correlation between the predicted and
the actual load-deflection behaviour was achieved using the elastic properties
determined from this method.
2. The shear deformation contributes by as much as 50% to the total deflection of beams
with low a/d ratio. Thus, it is recommended to account for the shear deflection in the
deflection calculation of GFRP beams when (a/d) is less than or equal to 6.
3. The shear stress experienced by the beam decreases with increasing a/d. In contrast,
the flexural stress increases with increasing a/d ratio.
4. The failure of the beam is governed by the buckling under the loading points followed
by cracks and delamination at the web-flange junction at the compression face.
5. The proposed equation accounting for the combined effect of shear and flexural
stresses in pultruded GFRP square beams and accounting for the buckling stress of
composites reasonably predicted the failure load of full size pultruded GFRP beams.
6. Aside from shear and flexural stresses, it was found that there is a complexity on the
overall behaviour of pultruded GFRP square beams with low a/d, which needs further
investigation.
Acknowledgement
Page 20 of 30
http://mc.manuscriptcentral.com/jcm
Journal of Composite Materials
123456789101112131415161718192021222324252627282930313233343536373839404142434445464748495051525354555657585960

For Peer Review
19
The authors would like to acknowledge the support of Wagner’s Composite Fibre
Technologies (WCFT) for providing the GFRP pultruded sections. The first author would
like to acknowledge the financial support by the Ministry of Higher Education and Scientific
Research-Iraq.
References
1. Bakis C, Bank LC, Brown V, et al. Fiber-reinforced polymer composites for construction-state-of-
the-art review. Journal of Composites for Construction. 2002; 6: 73-87.
2. Hollaway L. A review of the present and future utilisation of FRP composites in the civil infrastructure with reference to their important in-service properties. Construction and Building
Materials. 2010; 24: 2419-2445.
3. Bank LC. Shear coefficients for thin-walled composite beams. Composite Structures. 1987; 8: 47-61.
4. Barbero EJ, Fu S-H and Raftoyiannis I. Ultimate bending strength of composite beams. Journal of
Materials in Civil Engineering. 1991; 3: 292-306. 5. Omidvar B. Shear coefficient in orthotropic thin-walled composite beams. Journal of Composites
for Construction. 1998; 2: 46-56.
6. Nagaraj V and GangaRao HV. Static behavior of pultruded GFRP beams. Journal of Composites
for Construction. 1997; 1: 120-129.
7. Bank LC. Composite for Construction Structural Design with FRP Materials. New Jersey: Jone
Wiley & Sons, 2006, p.551.
8. Davalos JF, Salim H, Qiao P, Lopez-Anido R and Barbero E. Analysis and design of pultruded
FRP shapes under bending. Composites Part B: Engineering. 1996; 27: 295-305.
9. Roberts T and Masri H. Section properties and buckling behavior of pultruded FRP profiles. Journal of reinforced plastics and composites. 2003; 22: 1305-1317.
10. Manalo A, Mutsuyoshi H and Matsui T. Testing and characterization of thick hybrid fibre
composites laminates. International Journal of Mechanical Sciences. 2012; 63: 99-109. 11. Cardoso D, Harries K and Batista E. On the Determination of Mechanical Properties for Pultruded
GFRP Sections. International Conference on FRP composites in Civil Engineering. Vancouver,
Canada: Internationl Institute for FRP in Construction 2014.
12. Guades E, Aravinthan T and Islam MM. Characterisation of the mechanical properties of
pultruded fibre-reinforced polymer tube. Materials & Design. 2014; 63: 305-315.
13. Bank LC. Flexural and shear moduli of full-section fiber reinforced plastic(FRP) pultruded beams.
Journal of Testing and Evaluation. 1989; 17: 40-45.
14. Neto A and Rovere H. Flexural stiffness characterization of fiber reinforced plastic (FRP)
pultruded beams. Composite structures. 2007; 81: 274-282. 15. Mottram J. Shear modulus of standard pultruded fiber reinforced plastic material. Journal of
Composites for Construction. 2004; 8: 141-147.
16. Chambers RE. ASCE design standard for pultruded fiber-reinforced-plastic (FRP) structures.
Journal of Composites for Construction. 1997; 1: 26-38.
17. Parke G and Hewson N. ICE manual of bridge engineering. history. 2008; 6: 3.
18. ISO 1172. Textile-glass-reinforced plastics, prepegs, moulding compounds and laminates:
Determination of the textile-glass and mineral-filler content- Calcination methods. 1996.
19. ASTM D7250. ASTM D7250/D7250M-06 Standard practice for determine sandwich beam
flexural and shear stiffeness. West Conshohocken, (PA): ASTM International, 2006.
20. Hayes M and Lesko J. The effect of non-classical behaviors on the measurement of the Timoshenko shear stiffness. Proc 2nd Inter Conf FRP Composites in Civil Engineering–CICE. 2004,
p. 873-880.
Page 21 of 30
http://mc.manuscriptcentral.com/jcm
Journal of Composite Materials
123456789101112131415161718192021222324252627282930313233343536373839404142434445464748495051525354555657585960

For Peer Review
20
21. Wu C and Bai Y. Web crippling behaviour of pultruded glass fibre reinforced polymer sections.
Composite Structures. 2014; 108: 789-800.
22. Kumar P, Chandrashekhara K and Nanni A. Structural performance of a FRP bridge deck.
Construction and Building Materials. 2004; 18: 35-47.
23. Roberts T and Al-Ubaidi H. Flexural and torsional properties of pultruded fiber reinforced plastic I-profiles. Journal of Composites for Construction. 2002; 6: 28-34.
24. Dai J and Hahn HT. Flexural behavior of sandwich beams fabricated by vacuum-assisted resin
transfer molding. Composite Structures. 2003; 61: 247-253. 25. Yoshihara H and Furushima T. Shear strengths of wood measured by various short beam shear
test methods. Wood science and technology. 2003; 37: 189-197.
26. Awad ZK, Aravinthan T and Manalo A. Geometry effect on the behaviour of single and glue-
laminated glass fibre reinforced polymer composite sandwich beams loaded in four-point bending.
Materials & Design. 2012; 39: 93-103.
27. Turvey GJ and Zhang Y. Shear failure strength of web–flange junctions in pultruded GRP WF
profiles. Construction and Building Materials. 2006; 20: 81-89.
28. ASCE. Structural Plastics Design Manual. ASCE Manuals and Reports on Engineering Practice
63. Reston, VA: American Society of Civil Engineering, 1984.
Page 22 of 30
http://mc.manuscriptcentral.com/jcm
Journal of Composite Materials
123456789101112131415161718192021222324252627282930313233343536373839404142434445464748495051525354555657585960

For Peer Review
All Figures
*All dimensions are in mm as per Table 2
Figure 1. Experimental set-up for characterisation of elastic properties
*All dimensions are in mm as per Table 3
Figure 2. Experimental setup for the behaviour of GFRP beams
Figure 3. Load – deflection relationship for GFRP beams
a a
L
300 mm
P
125mm 125mm
Page 23 of 30
http://mc.manuscriptcentral.com/jcm
Journal of Composite Materials
123456789101112131415161718192021222324252627282930313233343536373839404142434445464748495051525354555657585960

For Peer Review
Figure 4. Elastic modulus (E) and shear stiffness (KGA) versus Load for a/d =1.6
Figure 5. Flexural modulus (E) and shear stiffness (KGA) versus Load for a/d =2.4
Figure 6. Flexural modulus (E) and shear stiffness (KGA) versus Load for a/d =3.2
Page 24 of 30
http://mc.manuscriptcentral.com/jcm
Journal of Composite Materials
123456789101112131415161718192021222324252627282930313233343536373839404142434445464748495051525354555657585960

For Peer Review
Figure 7. Typical graph to determine E and KG using SM
Figure 8. Load – deflection curves for GFRP beams
Figure 9. Stress versus compression strain
Page 25 of 30
http://mc.manuscriptcentral.com/jcm
Journal of Composite Materials
123456789101112131415161718192021222324252627282930313233343536373839404142434445464748495051525354555657585960

For Peer Review
Figure 10. Stress versus tensile strain
Figure 11. Stress versus shear strain
Page 26 of 30
http://mc.manuscriptcentral.com/jcm
Journal of Composite Materials
123456789101112131415161718192021222324252627282930313233343536373839404142434445464748495051525354555657585960

For Peer Review
Figure 12. Failure modes of GFRP beams for different shear span to depth ratios
Figure 13. Comparison of theoretical and experimental deflection of beams with different a/d
ratios
(a) a/d= 1.2
(c) a/d= 3.6 (d) a/d= 6
Page 27 of 30
http://mc.manuscriptcentral.com/jcm
Journal of Composite Materials
123456789101112131415161718192021222324252627282930313233343536373839404142434445464748495051525354555657585960

For Peer Review
Figure 14. Contribution of flexural and shear deflection for beams with different a/d ratios
Figure 15. Shear stress versus shear span to depth ratio for GFRP beam
Figure 16. Bending stress versus shear span to depth ratio for GFRP beam
Page 28 of 30
http://mc.manuscriptcentral.com/jcm
Journal of Composite Materials
123456789101112131415161718192021222324252627282930313233343536373839404142434445464748495051525354555657585960

For Peer Review
Figure 17. Comparison between the predicted and the actual failure loads
Figure 18. Percentages of stress contribution from the total failure stress
Page 29 of 30
http://mc.manuscriptcentral.com/jcm
Journal of Composite Materials
123456789101112131415161718192021222324252627282930313233343536373839404142434445464748495051525354555657585960

For Peer Review
All Tables
Table 1. Mechanical properties from coupon test
Properties Average value SD
Compressive modulus (Longitudinal), GPa 38 1.4
Compressive strength, MPa 640 37
Tensile modulus (Longitudinal), GPa 42 2
Tensile Strength (MPa) 741 39
Flexural modulus (Longitudinal) (GPa) 39.3 2.3
Shear modulus (Longitudinal) (GPa) 5.7 0.4
Shear Strength (MPa) 120 14
Inter-laminar shear strength (MPa) 51 2
Table 2. Details of the specimens tested for the elastic properties
Span length
mm
Shear span, a
mm a/d
600 200 1.6
900 300 2.4
1200 400 3.2
Table 3. Details of the specimens tested for the behaviour of GFRP beams
Span length
mm
Shear span, a
mm
a/d
600 150 1.2
900 300 2.4
1200 450 3.6
1800 750 6
Table 4. Summary of average E and KGA for each span for GFRP beam testing (BCM)
a/d E
GPa
C.O.V
%
KGA
GPa-cm2
C.O.V
%
G
GPa
1.6 47.3 4.4 58.5 10 4.8
2.4 46.2 2.4 49.1 9 4.1
3.2 48.1 2.1 39.3 10 3.3
Ave. 47.2 4
Page 30 of 30
http://mc.manuscriptcentral.com/jcm
Journal of Composite Materials
123456789101112131415161718192021222324252627282930313233343536373839404142434445464748495051525354555657585960

For Peer Review
Table 5. Summary of experimental results for GFRP beams
Shear span/ depth Average failure load
kN
Deflection
mm
Failure mode
1.2 148 8 TS
2.4 132 9 TS
3.6 107.8 14 F
6 80.8 37 F
TS: transverse shear failure
F: flexural failure
Table 6. Summary of experimental properties for GFRP beams
Test type E modulus
GPa
G modulus
GPa
Coupon 39.3 5.7
BCM 47.2 4
SM 56.1 3.3
Table 7. Predicted failure load compared with the actual failure load
a/d ratio Exp.
kN
Eq. 12
kN
Eq. 13
kN
1.2 148 214 164
2.4 132 170 115
3.6 107.8 142 88
6 80.8 106 60
Page 31 of 30
http://mc.manuscriptcentral.com/jcm
Journal of Composite Materials
123456789101112131415161718192021222324252627282930313233343536373839404142434445464748495051525354555657585960