Behaviour of elementary bolted steel T-stub connections: an ...
20
Turkish J. Eng. Env. Sci. 35 (2011) , 1 – 20. c T ¨ UB ˙ ITAK doi:10.3906/muh-1005-32 Research Article Behaviour of elementary bolted steel T-stub connections: an evaluation of EC3 design procedure Rabah SOLTANI ∗ , Djamel Elddine KERDAL Civil Engineering Department, Faculty of Architecture and Civil Engineering, University of Sciences and Technology of Oran (Mohamed Boudiaf), BP.1505, El Menaouar, 31000 Oran-ALGERIA e-mail: [email protected] Received: 19.05.2010 Abstract Design rules of bolted steel beam-to-column connections have already turned towards new approaches in philosophy and methodology. In this paper, elementary bolted steel T-stub connections, proportioned according to Eurocode3 (EC3), were studied by means of a 3-dimensional finite element model using the ANSYS software package. The specimens reflected different geometric and strength parameters. Parameters considered were the thickness of the flange, the distance between the mid-web and the bolt line, and the distance between the bolt line and the end of the flange. The elastoplastic response, up to the ultimate state, was analysed and aspects relative to stiffness, strength, bolt loads, prying forces, and interaction between flanges were examined. Comparisons of experimental values, computed results, and EC3 predictions indicated that the design procedure still needs to be improved, owing to the complex phenomena embodied. Key Words: Bolted steel T-stub connections, 3D finite elements, EC3 design procedure, combined failure modes, stiffness, strength, friction effects, contact region, prying forces, bolt loads 1. Introduction Endplate bolted steel beam-to-column connections are widely used in steel structures. Their popularity is mainly attributed to the simplicity and economy associated with their fabrication and erection. However, their behaviour and analysis are quite complex. This complexity is due to the variation in geometric proportions, material properties, bolt preloading conditions, and many other factors, such as the induced curvatures in the endplate and column flange, and the distribution of the normal pressure and its associated contact regions between the flanges, which vary with changing load. In addition, analysis is generally complicated because of the number of components and their inherent combined nonlinear phenomena, like material and geometrical nonlinearities, friction, slippage, contact, and interaction. ∗ Corresponding author 1
Transcript of Behaviour of elementary bolted steel T-stub connections: an ...
Turkish J. Eng. Env. Sci.35 (2011) , 1 – 20.c© TUBITAKdoi:10.3906/muh-1005-32
Research Article
Behaviour of elementary bolted steel T-stub connections: an
evaluation of EC3 design procedure
Rabah SOLTANI∗, Djamel Elddine KERDALCivil Engineering Department, Faculty of Architecture and Civil Engineering,University of Sciences and Technology of Oran (Mohamed Boudiaf), BP.1505,
El Menaouar, 31000 Oran-ALGERIAe-mail: [email protected]
Received: 19.05.2010
Abstract
Design rules of bolted steel beam-to-column connections have already turned towards new approaches
in philosophy and methodology. In this paper, elementary bolted steel T-stub connections, proportioned
according to Eurocode3 (EC3), were studied by means of a 3-dimensional finite element model using the
ANSYS software package. The specimens reflected different geometric and strength parameters. Parameters
considered were the thickness of the flange, the distance between the mid-web and the bolt line, and the
distance between the bolt line and the end of the flange. The elastoplastic response, up to the ultimate
state, was analysed and aspects relative to stiffness, strength, bolt loads, prying forces, and interaction
between flanges were examined. Comparisons of experimental values, computed results, and EC3 predictions
indicated that the design procedure still needs to be improved, owing to the complex phenomena embodied.
Key Words: Bolted steel T-stub connections, 3D finite elements, EC3 design procedure, combined failure
modes, stiffness, strength, friction effects, contact region, prying forces, bolt loads
1. Introduction
Endplate bolted steel beam-to-column connections are widely used in steel structures. Their popularity ismainly attributed to the simplicity and economy associated with their fabrication and erection. However, theirbehaviour and analysis are quite complex. This complexity is due to the variation in geometric proportions,material properties, bolt preloading conditions, and many other factors, such as the induced curvatures in theendplate and column flange, and the distribution of the normal pressure and its associated contact regionsbetween the flanges, which vary with changing load. In addition, analysis is generally complicated because ofthe number of components and their inherent combined nonlinear phenomena, like material and geometricalnonlinearities, friction, slippage, contact, and interaction.
∗Corresponding author
1
SOLTANI, KERDAL
1.1. Background to the study
Recently, design rules of bolted steel beam-to-column connections have turned towards new approaches inphilosophy and methodology. In this context, one of the modern design codes (Eurocode3 (EC3), 2005) hasintroduced new design rules for beam-to-column bolted steel connections. For the case of endplate bolted steelconnections with 4 bolts in the tension region and only 2 bolts in the compression region, as shown in Figure 1,the beam tension flange force is assumed to be transmitted over a small region of the endplate to the columnflange, and the response of this portion can be represented by elementary bolted steel T-stub connections.
Figure 1. Endplate bolted steel beam-to-column connection with 4 bolts in tension region and 2 bolts in compression
region.
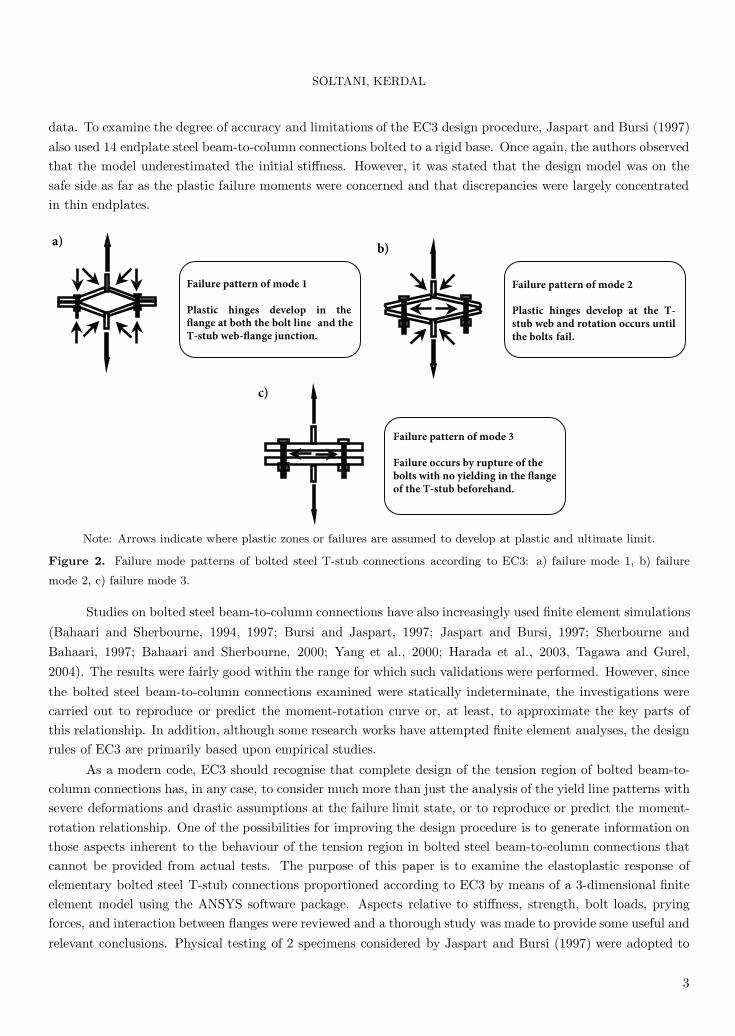
According to the design procedure adopted by EC3, the yield failure modes of the tension region mayoccur by 1 of 3 typical failure modes, shown in Figure 2. These are plastic failure of the endplate or the columnflange (mode 1), yielding of the endplate or column flange followed by bolt fracture (mode 2), or bolt fracture
(mode 3). The corresponding failure modes are shown in Figures 2a-c, respectively. Studies in the inelasticregime have been concerned with formulae for the load carrying capacity or the minimum required thicknessof the extended endplate and that of the column flange. The method of theoretical study most widely usedand adopted by EC3 has been based upon yield line analysis using empirically determined straight or curvedyield line patterns (Mansfield, 1957; Johansen, 1962). However, because of variation in proportions, differentyield line patterns are associated with different yield line formulae and, therefore, lead to different strengthcapacities. In the elastic regime, studies were based on a simple theory of bending. However, to compute theelastic stiffness, EC3 applies a “geometric” model for whatever the proportions and bolt loading conditionsare. Insofar as the prediction of the initial stiffness of the EC3 model is concerned, the preloading effects aredisregarded in the model.
Endplate bolted steel beam-to-column connections in general, or the tension region in bolted steel beam-to-column connections in particular, has been the subject of substantial experimental research activity. Suchstudies (Douty and McGuire, 1965; Zoetemeijer, 1974; Agerskov, 1977; Packer and Morris, 1977; Moore and
Sims, 1986; Grogan and Surtees, 1999; Swanson and Leon, 2001; Tagawa and Gurel, 2004) have includedbare connections, welded transverse stiffeners, backing plates, and hot-rolled or cold-formed channels. In linewith these developments, Bursi and Jaspart (1997) evaluated the degree of accuracy and limitations of EC3design applications by testing and numerically analysing the behaviour of 2 elementary bolted steel T-stubconnections, shown in Figure 3. The specimens were cut from IPE300 and HEB220 sections and their geometriccharacteristics are represented in Figures 3a and 3b, respectively. They were designed to fail according to thefailure modes reported in Figures 2a and 2b, respectively. When comparing the load-displacement relationshipsof both the tested data and the EC3 predictions, the authors recognised that the EC3 model was unable topredict the load-displacement evolution and did not permit complete agreement between the predicted and test
2
SOLTANI, KERDAL
data. To examine the degree of accuracy and limitations of the EC3 design procedure, Jaspart and Bursi (1997)also used 14 endplate steel beam-to-column connections bolted to a rigid base. Once again, the authors observedthat the model underestimated the initial stiffness. However, it was stated that the design model was on thesafe side as far as the plastic failure moments were concerned and that discrepancies were largely concentratedin thin endplates.
a)
Failure pattern of mode 1
Plastic hinges develop in theflange at both the bolt line and theT-stub web-flange junction.
b)
Failure pattern of mode 2
Plastic hinges develop at the T-stub web and rotation occurs untilthe bolts fail.
c)
Failure pattern of mode 3
Failure occurs by rupture of the bolts with no yielding in the flange of the T-stub beforehand.
Note: Arrows indicate where plastic zones or failures are assumed to develop at plastic and ultimate limit.
Figure 2. Failure mode patterns of bolted steel T-stub connections according to EC3: a) failure mode 1, b) failure
mode 2, c) failure mode 3.
Studies on bolted steel beam-to-column connections have also increasingly used finite element simulations(Bahaari and Sherbourne, 1994, 1997; Bursi and Jaspart, 1997; Jaspart and Bursi, 1997; Sherbourne andBahaari, 1997; Bahaari and Sherbourne, 2000; Yang et al., 2000; Harada et al., 2003, Tagawa and Gurel,2004). The results were fairly good within the range for which such validations were performed. However, sincethe bolted steel beam-to-column connections examined were statically indeterminate, the investigations werecarried out to reproduce or predict the moment-rotation curve or, at least, to approximate the key parts ofthis relationship. In addition, although some research works have attempted finite element analyses, the designrules of EC3 are primarily based upon empirical studies.
As a modern code, EC3 should recognise that complete design of the tension region of bolted beam-to-column connections has, in any case, to consider much more than just the analysis of the yield line patterns withsevere deformations and drastic assumptions at the failure limit state, or to reproduce or predict the moment-rotation relationship. One of the possibilities for improving the design procedure is to generate information onthose aspects inherent to the behaviour of the tension region in bolted steel beam-to-column connections thatcannot be provided from actual tests. The purpose of this paper is to examine the elastoplastic response ofelementary bolted steel T-stub connections proportioned according to EC3 by means of a 3-dimensional finiteelement model using the ANSYS software package. Aspects relative to stiffness, strength, bolt loads, pryingforces, and interaction between flanges were reviewed and a thorough study was made to provide some useful andrelevant conclusions. Physical testing of 2 specimens considered by Jaspart and Bursi (1997) were adopted to
3

SOLTANI, KERDAL
confirm the analysis and to adjust the models as necessary. Once adequate validation of the numerical analyseswas established, the model could be used to generate information that could not be provided from actual tests.The findings obtained in this study are useful in checking the validity of the theoretical model being developedand will be adopted as a data basis in a subsequent paper.
7.1
30 90 30
2040
20150a b
30 90 30
2040
20150
IPE300
BOLTS M128.8 L = 55
BOLTS M128.8 L = 45
HE220B9.5
1610.7
Figure 3. Geometrical characteristics of tested specimens (Bursi and Jaspart, 1997): a) IPE300 T-stub specimen, b)
HEB220 T-stub specimen.
1.2. Approach of the study
The behaviour of endplate bolted steel beam-to-column connections is very complex and requires the consid-eration of various phenomena. Although the latest generation of research and commercial finite element codesis capable of simulating almost all of the complex phenomena outlined above, they require lengthy proceduresand are very sensitive to the modelling options. To overcome this difficulty, the EC3 design approach usesthe so-called component method, which supplies procedures for the evaluation of the global behaviour of theendplate bolted steel beam-to-column connections. In the case of endplate bolted steel connections with 4 boltsin the tension region and only 2 bolts in the compression region, the tension region represents an importantcomponent and is used for the evaluation of the strength capacity of the tension region and the initial stiffness.According to EC3, this component can be represented by an elementary bolted steel T-stub connection.
The study of elementary bolted steel T-sub connections is indeed appropriate as far as the behaviourof the tension region in the endplate bolted steel beam-to-column connections and their modes of failure areconcerned. They are also relevant specimens as much knowledge can be derived from their behaviour, such asthe interaction between the flanges and the distribution of the normal contact pressure induced by the normalstresses and in equilibrium with the prying force, initial stiffness, strength capacity, and bolt-induced load. Suchaspects could be those inherent to the tension region in the endplate bolted steel beam-to-column connections.
4
SOLTANI, KERDAL
Therefore, an understanding of these complex phenomena is of great benefit in setting a suitable basis uponwhich a theoretical model is to be developed and in which the connection will be able to reflect the assumptionsused in analysis. This study can also be considered as a preliminary step to understanding the response of thetension region in endplate bolted steel beam-to-column connections.
The latest numerical approaches using the finite element technique have been shown to be capable ofsimulating almost all of the complex phenomena outlined above, and therefore analyses should be applied toinvestigate the complex phenomena in order to provide an accurate representation of the physics inherent to thetension region in endplate bolted steel beam-to-column connections. Relevant papers were reviewed to establishan appropriate approach for finite element simulation of the elementary bolted steel T-sub connections.
To gain insight into the behaviour of elementary bolted steel T-stub connections and examine some of thefeatures outlined above, numerical simulations were performed on 44 nonpreloaded specimens involving variouscombinations of geometric and strength parameters and failure modes. Within each elementary bolted steelT-stub connection, the parameters considered were the distance between the mid-web thickness and the boltline, and the distance between the bolt line and the end of the flange. Elastoplastic response, up to the ultimatestate, was analysed and aspects relative to yield lines, interaction between flanges, prying forces, displacements,stiffness, and strength and bolt loads were examined. The computed values were compared with the EC3 modelat each loading phase.
To reproduce the behaviour of the elementary bolted steel T-stub connections, numerical simulationswere performed by 3D finite elements (FEs) using the ANSYS software package. To validate the proposed 3DFE model, comparisons were performed by superimposing the computed load-displacement relationships uponthe measured ones (Bursi and Jaspart, 1997). The geometric properties of the 2 specimens (see Figure 3) arereported in Table 1 and the material data for the flanges and webs, i.e. the tensile value of yield stress and thatof the tensile stress, are shown in Table 2. The bolts used were M12 grade 8.8 and characterised by the yieldand ultimate stress values provided in Table 3.
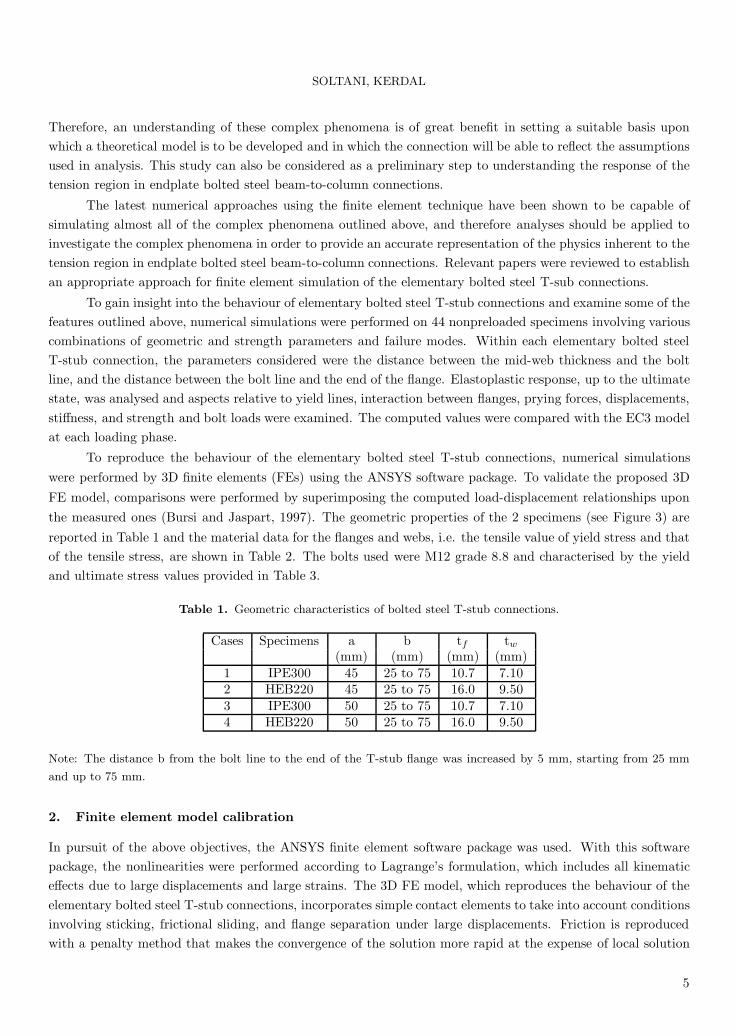
Table 1. Geometric characteristics of bolted steel T-stub connections.
Cases Specimens a b tf tw
(mm) (mm) (mm) (mm)1 IPE300 45 25 to 75 10.7 7.102 HEB220 45 25 to 75 16.0 9.503 IPE300 50 25 to 75 10.7 7.104 HEB220 50 25 to 75 16.0 9.50
Note: The distance b from the bolt line to the end of the T-stub flange was increased by 5 mm, starting from 25 mm
and up to 75 mm.
2. Finite element model calibration
In pursuit of the above objectives, the ANSYS finite element software package was used. With this softwarepackage, the nonlinearities were performed according to Lagrange’s formulation, which includes all kinematiceffects due to large displacements and large strains. The 3D FE model, which reproduces the behaviour of theelementary bolted steel T-stub connections, incorporates simple contact elements to take into account conditionsinvolving sticking, frictional sliding, and flange separation under large displacements. Friction is reproducedwith a penalty method that makes the convergence of the solution more rapid at the expense of local solution
5
SOLTANI, KERDAL
accuracy. A classical Coulomb friction model was used with 3 friction values (μ = 0, 0.25, and 0.50), and theHuber-von Mises-Hencky criterion was used to reproduce the plastic deformation in the bolted steel T-stubconnections. In order to perform realistic simulations, the material data for flanges, webs, and bolt shanks werereproduced with piecewise constitutive linear stress-strain relationships.
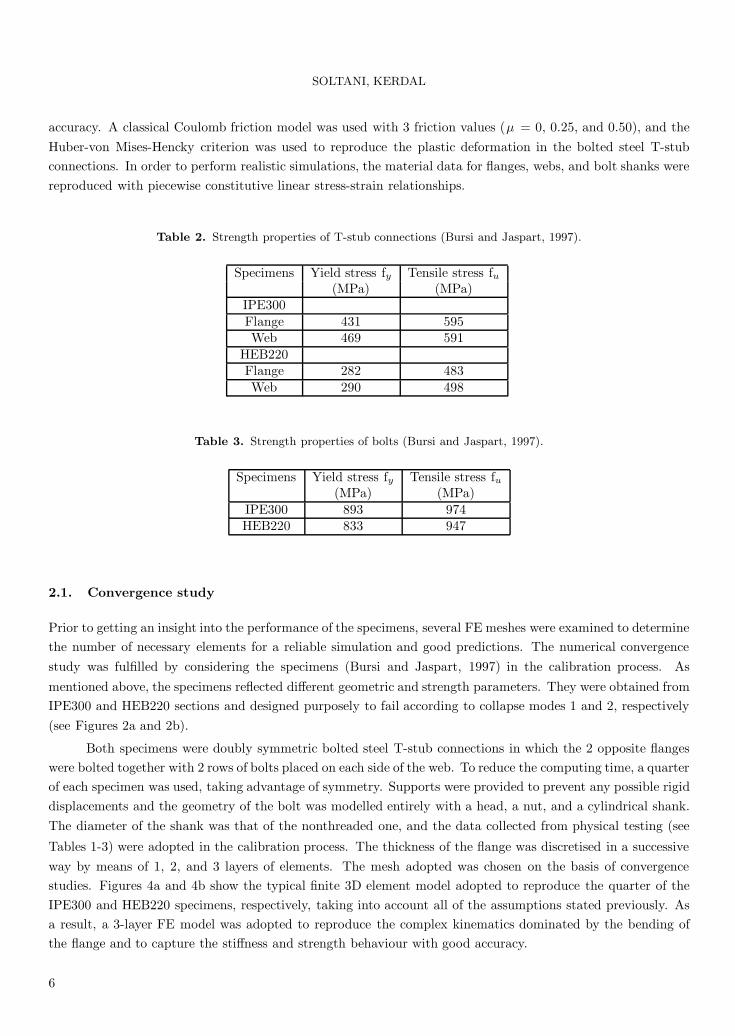
Table 2. Strength properties of T-stub connections (Bursi and Jaspart, 1997).
Specimens Yield stress fy Tensile stress fu(MPa) (MPa)
IPE300Flange 431 595Web 469 591
HEB220Flange 282 483Web 290 498
Table 3. Strength properties of bolts (Bursi and Jaspart, 1997).
Specimens Yield stress fy Tensile stress fu(MPa) (MPa)
IPE300 893 974HEB220 833 947
2.1. Convergence study
Prior to getting an insight into the performance of the specimens, several FE meshes were examined to determinethe number of necessary elements for a reliable simulation and good predictions. The numerical convergencestudy was fulfilled by considering the specimens (Bursi and Jaspart, 1997) in the calibration process. Asmentioned above, the specimens reflected different geometric and strength parameters. They were obtained fromIPE300 and HEB220 sections and designed purposely to fail according to collapse modes 1 and 2, respectively(see Figures 2a and 2b).
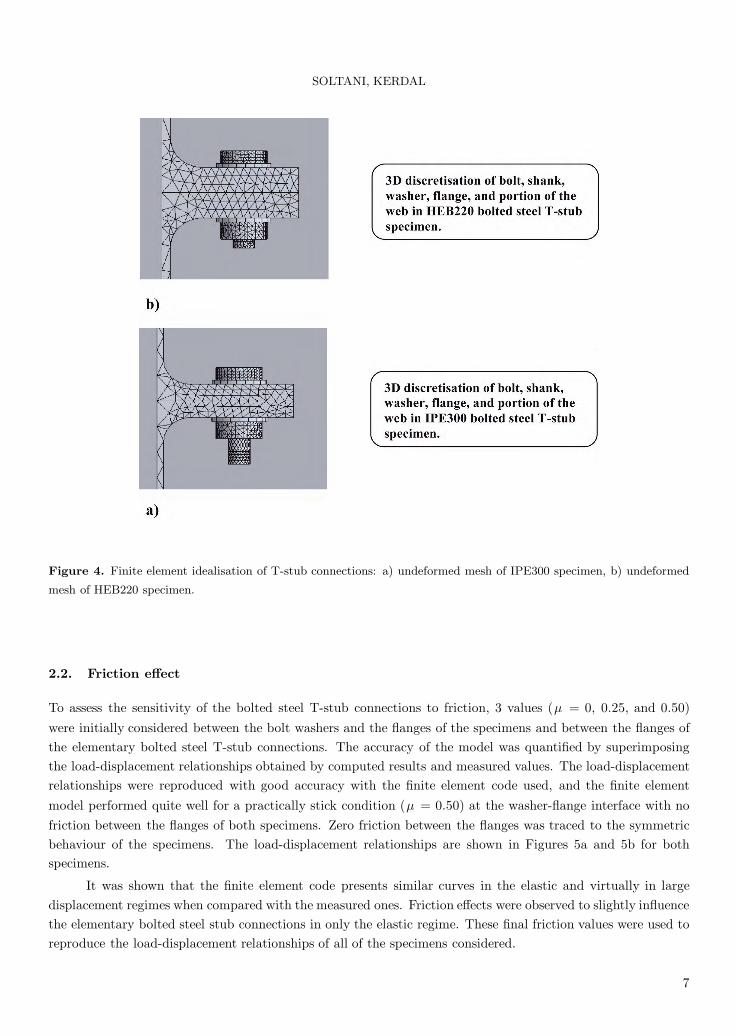
Both specimens were doubly symmetric bolted steel T-stub connections in which the 2 opposite flangeswere bolted together with 2 rows of bolts placed on each side of the web. To reduce the computing time, a quarterof each specimen was used, taking advantage of symmetry. Supports were provided to prevent any possible rigiddisplacements and the geometry of the bolt was modelled entirely with a head, a nut, and a cylindrical shank.The diameter of the shank was that of the nonthreaded one, and the data collected from physical testing (see
Tables 1-3) were adopted in the calibration process. The thickness of the flange was discretised in a successiveway by means of 1, 2, and 3 layers of elements. The mesh adopted was chosen on the basis of convergencestudies. Figures 4a and 4b show the typical finite 3D element model adopted to reproduce the quarter of theIPE300 and HEB220 specimens, respectively, taking into account all of the assumptions stated previously. Asa result, a 3-layer FE model was adopted to reproduce the complex kinematics dominated by the bending ofthe flange and to capture the stiffness and strength behaviour with good accuracy.
6
SOLTANI, KERDAL
Figure 4. Finite element idealisation of T-stub connections: a) undeformed mesh of IPE300 specimen, b) undeformed
mesh of HEB220 specimen.
2.2. Friction effect
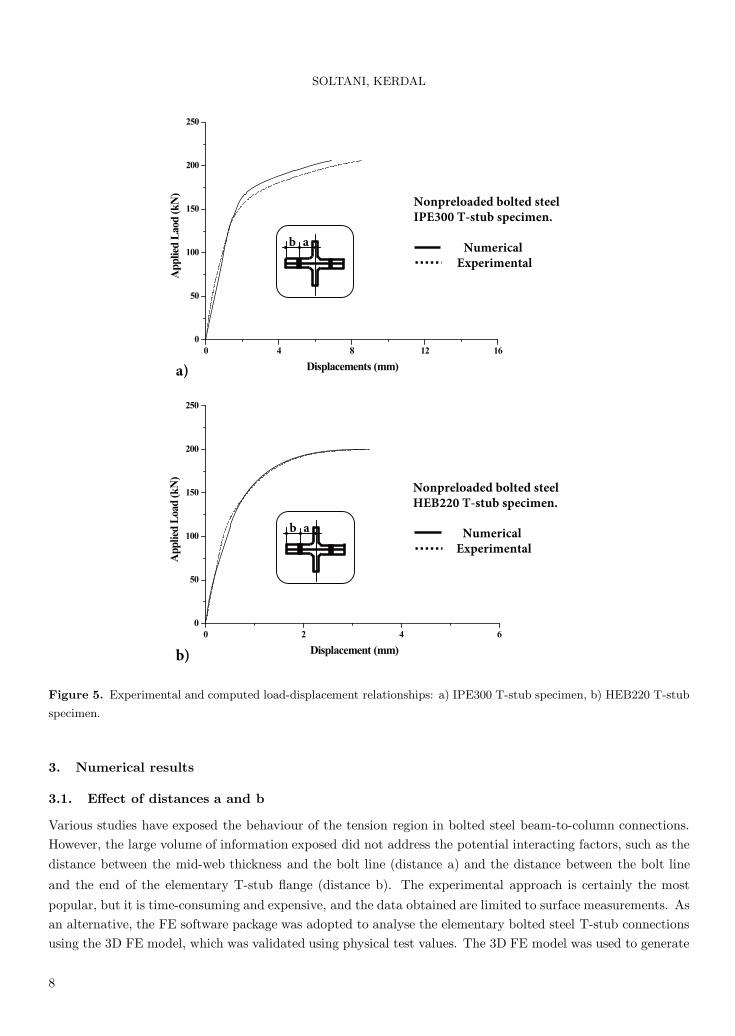
To assess the sensitivity of the bolted steel T-stub connections to friction, 3 values (μ = 0, 0.25, and 0.50)were initially considered between the bolt washers and the flanges of the specimens and between the flanges ofthe elementary bolted steel T-stub connections. The accuracy of the model was quantified by superimposingthe load-displacement relationships obtained by computed results and measured values. The load-displacementrelationships were reproduced with good accuracy with the finite element code used, and the finite elementmodel performed quite well for a practically stick condition (μ = 0.50) at the washer-flange interface with nofriction between the flanges of both specimens. Zero friction between the flanges was traced to the symmetricbehaviour of the specimens. The load-displacement relationships are shown in Figures 5a and 5b for bothspecimens.
It was shown that the finite element code presents similar curves in the elastic and virtually in largedisplacement regimes when compared with the measured ones. Friction effects were observed to slightly influencethe elementary bolted steel stub connections in only the elastic regime. These final friction values were used toreproduce the load-displacement relationships of all of the specimens considered.
7
SOLTANI, KERDAL
a)
b a
Nonpreloaded bolted steel IPE300 T-stub specimen.
Numerical Experimental
b)
b a
Nonpreloaded bolted steel HEB220 T-stub specimen.
Numerical Experimental
Figure 5. Experimental and computed load-displacement relationships: a) IPE300 T-stub specimen, b) HEB220 T-stub
specimen.
3. Numerical results
3.1. Effect of distances a and b
Various studies have exposed the behaviour of the tension region in bolted steel beam-to-column connections.However, the large volume of information exposed did not address the potential interacting factors, such as thedistance between the mid-web thickness and the bolt line (distance a) and the distance between the bolt line
and the end of the elementary T-stub flange (distance b). The experimental approach is certainly the mostpopular, but it is time-consuming and expensive, and the data obtained are limited to surface measurements. Asan alternative, the FE software package was adopted to analyse the elementary bolted steel T-stub connectionsusing the 3D FE model, which was validated using physical test values. The 3D FE model was used to generate
8
SOLTANI, KERDAL
information about these variables and to provide some useful and relevant information in order to improve thestate of the current knowledge. We considered 4 cases, making a total of 44 nonpreloaded elementary boltedsteel T-stub connections, and the geometric properties are summarised in Table 1. The top and bottom portionsof the elementary bolted steel T-stubs were endowed with identical material and geometric properties.
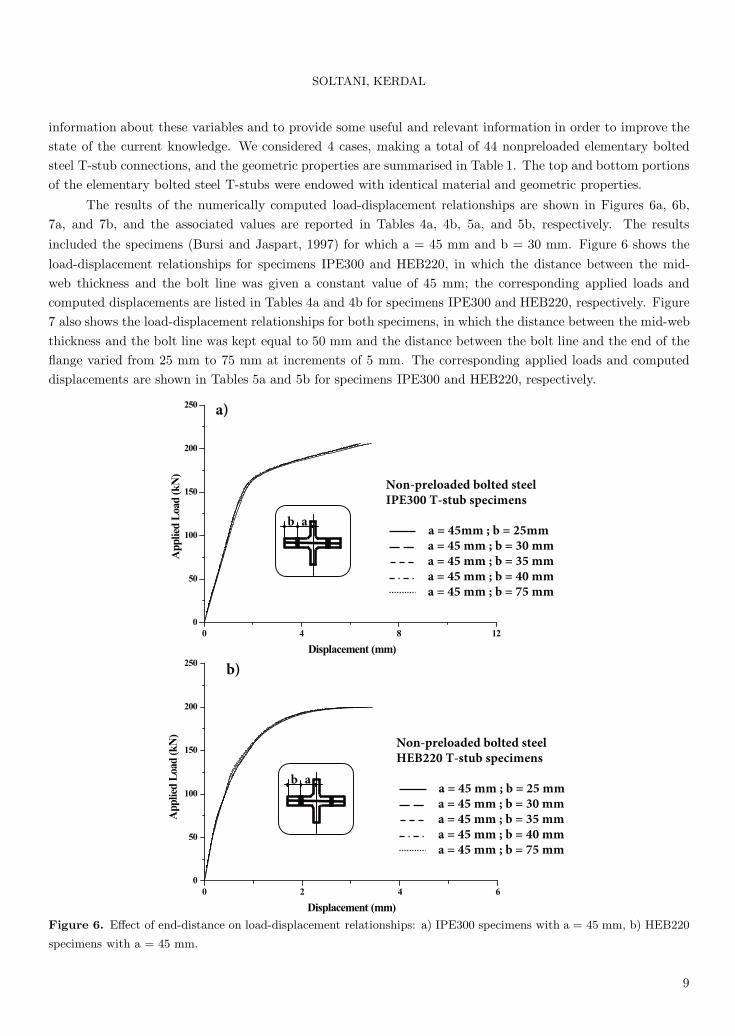
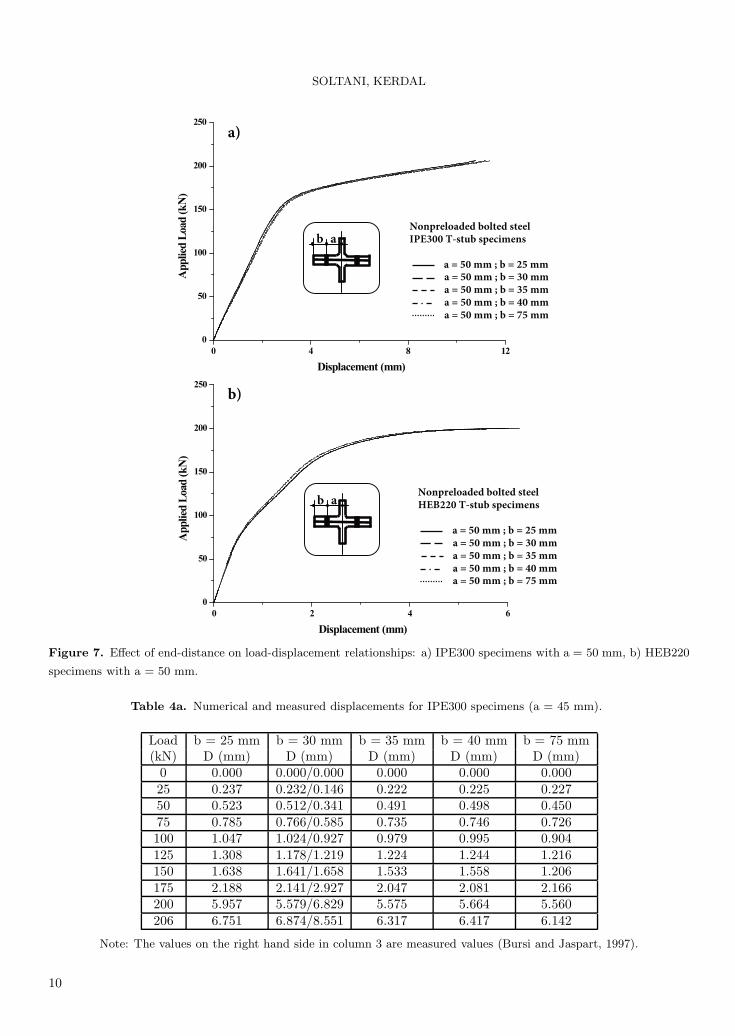
The results of the numerically computed load-displacement relationships are shown in Figures 6a, 6b,7a, and 7b, and the associated values are reported in Tables 4a, 4b, 5a, and 5b, respectively. The resultsincluded the specimens (Bursi and Jaspart, 1997) for which a = 45 mm and b = 30 mm. Figure 6 shows theload-displacement relationships for specimens IPE300 and HEB220, in which the distance between the mid-web thickness and the bolt line was given a constant value of 45 mm; the corresponding applied loads andcomputed displacements are listed in Tables 4a and 4b for specimens IPE300 and HEB220, respectively. Figure7 also shows the load-displacement relationships for both specimens, in which the distance between the mid-webthickness and the bolt line was kept equal to 50 mm and the distance between the bolt line and the end of theflange varied from 25 mm to 75 mm at increments of 5 mm. The corresponding applied loads and computeddisplacements are shown in Tables 5a and 5b for specimens IPE300 and HEB220, respectively.
b)
b a
Non-preloaded bolted steel HEB220 T-stub specimens
a = 45 mm ; b = 25 mm a = 45 mm ; b = 30 mm a = 45 mm ; b = 35 mm a = 45 mm ; b = 40 mm a = 45 mm ; b = 75 mm
a)
b a
Non-preloaded bolted steel IPE300 T-stub specimens
a = 45mm ; b = 25mm a = 45 mm ; b = 30 mm a = 45 mm ; b = 35 mm a = 45 mm ; b = 40 mm a = 45 mm ; b = 75 mm
Figure 6. Effect of end-distance on load-displacement relationships: a) IPE300 specimens with a = 45 mm, b) HEB220
specimens with a = 45 mm.
9
SOLTANI, KERDAL
a)
b aNonpreloaded bolted steel IPE300 T-stub specimens
a = 50 mm ; b = 25 mm a = 50 mm ; b = 30 mm a = 50 mm ; b = 35 mm a = 50 mm ; b = 40 mm a = 50 mm ; b = 75 mm
b)
b aNonpreloaded bolted steel HEB220 T-stub specimens
a = 50 mm ; b = 25 mm a = 50 mm ; b = 30 mm a = 50 mm ; b = 35 mm a = 50 mm ; b = 40 mm a = 50 mm ; b = 75 mm
Figure 7. Effect of end-distance on load-displacement relationships: a) IPE300 specimens with a = 50 mm, b) HEB220
specimens with a = 50 mm.
Table 4a. Numerical and measured displacements for IPE300 specimens (a = 45 mm).
Load b = 25 mm b = 30 mm b = 35 mm b = 40 mm b = 75 mm(kN) D (mm) D (mm) D (mm) D (mm) D (mm)
0 0.000 0.000/0.000 0.000 0.000 0.00025 0.237 0.232/0.146 0.222 0.225 0.22750 0.523 0.512/0.341 0.491 0.498 0.45075 0.785 0.766/0.585 0.735 0.746 0.726100 1.047 1.024/0.927 0.979 0.995 0.904125 1.308 1.178/1.219 1.224 1.244 1.216150 1.638 1.641/1.658 1.533 1.558 1.206175 2.188 2.141/2.927 2.047 2.081 2.166200 5.957 5.579/6.829 5.575 5.664 5.560206 6.751 6.874/8.551 6.317 6.417 6.142
Note: The values on the right hand side in column 3 are measured values (Bursi and Jaspart, 1997).
10
SOLTANI, KERDAL
Table 4b. Numerical and measured displacements for HEB220 specimens (a = 45 mm).
Load b = 25 mm b = 30 mm b = 35 mm b = 40 mm b = 75 mm(kN) D (mm) D (mm) D (mm) D (mm) D (mm)
0 0.000 0.000/0.000 0.000 0.000 0.00025 0.050 0.110/0.049 0.047 0.045 0.05150 0.149 0.224/0.146 0.145 0.135 0.14775 0.298 0.448/0.293 0.283 0.270 0.226100 0.449 0.443/0.439 0.433 0.405 0.407125 0.598 0.598/0.585 0.569 0.540 0.559150 0.847 0.859/0.829 0.773 0.766 0.767175 1.022 1.070/1.219 0.946 0.923 0.923198 1.749 1.758/2.049 1.984 1.616 1.857200 4.002 4.002/3.268 4.005 3.998 3.768
Note: The values on the right hand side in column 3 are measured values (Bursi and Jaspart, 1997).
Table 5a. Numerical displacements for IPE300 specimens (a = 50 mm).
Load b = 25 mm b = 30 mm b = 35 mm b = 40 mm b = 75 mm(kN) D (mm) D (mm) D (mm) D (mm) D (mm)
0 0.000 0.000 0.000 0.000 0.00025 0.378 0.401 0.392 0.379 0.39250 0.835 0.882 0.866 0.836 0.86675 1.252 1.324 1.299 1.255 1.299100 1.671 1.765 1.732 1.673 1.732125 2.087 2.206 2.165 2.091 2.165150 2.614 2.762 2.711 2.618 2.711175 3.491 3.689 3.621 3.496 3.621198 9.505 10.051 9.858 9.522 9.858200 10.771 11.381 11.171 10.791 11.172
Table 5b. Numerical displacements for HEB220 specimens (a = 50 mm).
Load b = 25 mm b = 30 mm b = 35 mm b = 40 mm b = 75 mm(kN) D (mm) D (mm) D (mm) D (mm) D (mm)
0 0.000 0.000 0.000 0.000 0.00025 0.152 0.152 0.146 0.145 0.15250 0.305 0.304 0.293 0.291 0.29975 0.491 0.489 0.471 0.467 0.485100 0.833 0.831 0.801 0.794 0.787125 1.331 1.327 1.277 1.267 1.259150 1.751 1.744 1.681 1.666 1.767175 2.295 2.288 2.203 2.186 2.183198 3.871 3.859 3.716 3.687 3.857200 6.246 6.227 5.996 5.948 5.768
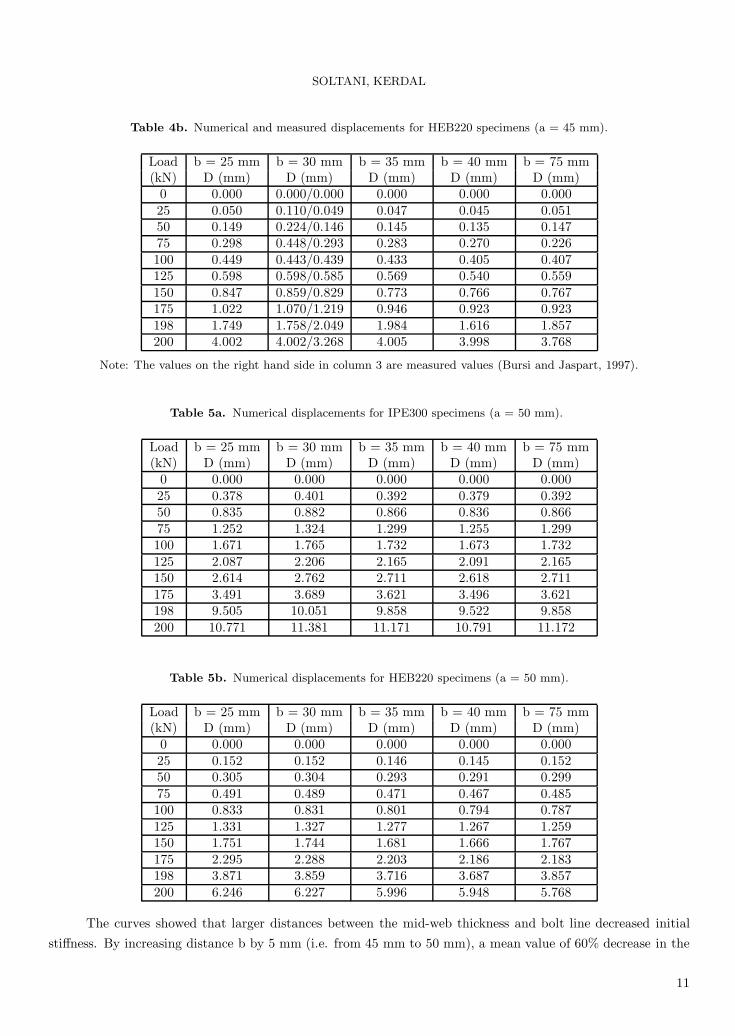
The curves showed that larger distances between the mid-web thickness and bolt line decreased initialstiffness. By increasing distance b by 5 mm (i.e. from 45 mm to 50 mm), a mean value of 60% decrease in the
11
SOLTANI, KERDAL
initial stiffness was obtained for the IPE300 specimens. When increasing this distance by the same value, theinitial stiffness of the HEB220 specimens was decreased by only 33%. The results of the numerical simulationsshowed that each specimen was able to develop the same initial stiffness and strength capacity, both in theelastic and inelastic regimes, when the end distance was increased from 25 mm to 75 mm. From the analysis, itwas observed that the stiffness and strength characteristics were not affected by the extension of end distanceb as long as distance a remained constant. EC3 contains application rules for the evaluation of the effectivelength, which state that the maximum distance n between the bolt line and the point of application of theprying force cannot exceed 1.25 m or the distance b, i.e. n ≤ (1.25 m or b), whichever is smaller (1.25 m =
33.062 mm for IPE300 and 27.812 mm for HEB220). If only this specification is considered for comparison,then the considerations mean that the distance n, which gives the location of the point of application of theprying, does not exceed distance b as, beyond this value, the initial stiffness and the strength capacity will havethe same values. In the following 2 sections, the FE analyses presented were restricted to the specimens withdistance b varying from 25 mm to 40 mm only.
3.2. Prying action
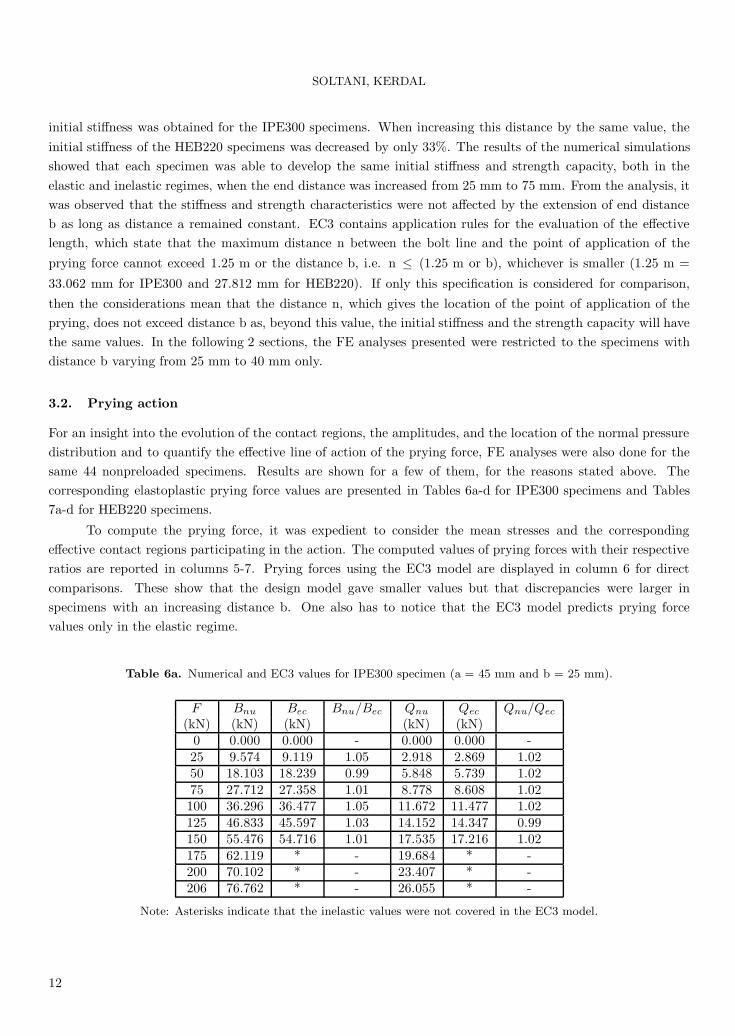
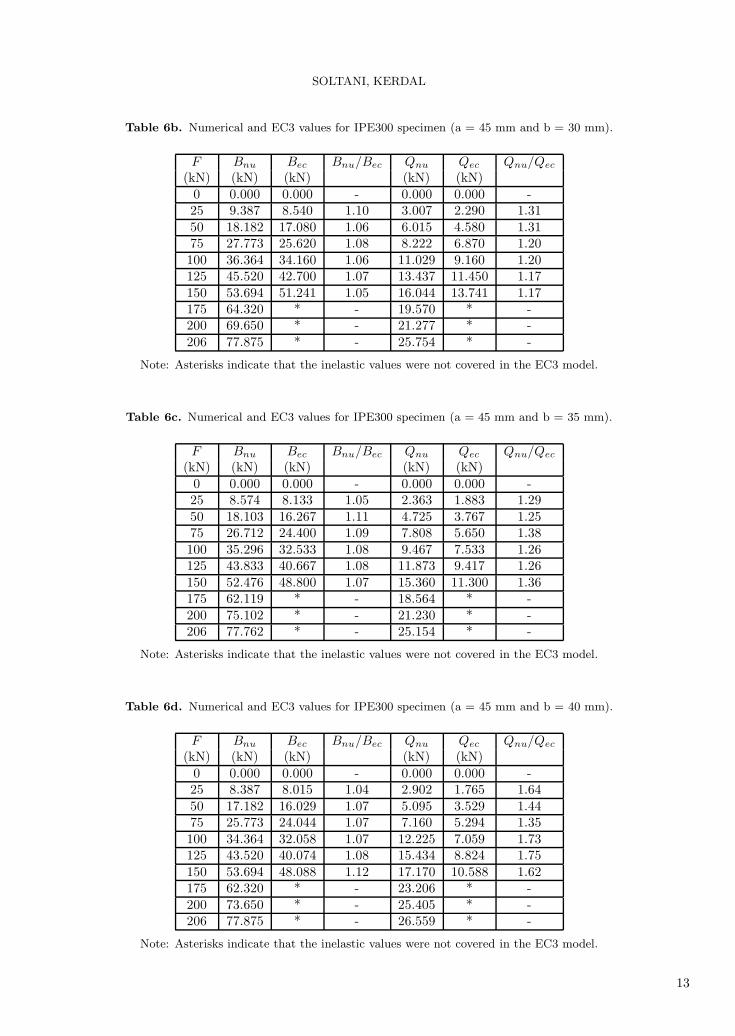
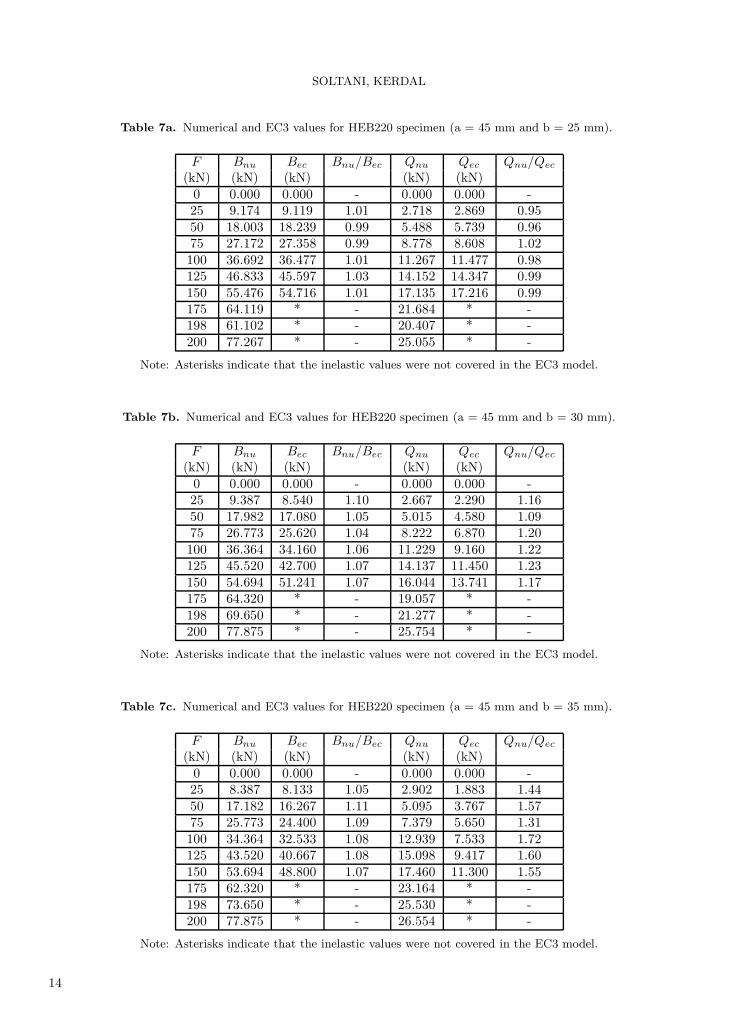
For an insight into the evolution of the contact regions, the amplitudes, and the location of the normal pressuredistribution and to quantify the effective line of action of the prying force, FE analyses were also done for thesame 44 nonpreloaded specimens. Results are shown for a few of them, for the reasons stated above. Thecorresponding elastoplastic prying force values are presented in Tables 6a-d for IPE300 specimens and Tables7a-d for HEB220 specimens.
To compute the prying force, it was expedient to consider the mean stresses and the correspondingeffective contact regions participating in the action. The computed values of prying forces with their respectiveratios are reported in columns 5-7. Prying forces using the EC3 model are displayed in column 6 for directcomparisons. These show that the design model gave smaller values but that discrepancies were larger inspecimens with an increasing distance b. One also has to notice that the EC3 model predicts prying forcevalues only in the elastic regime.
Table 6a. Numerical and EC3 values for IPE300 specimen (a = 45 mm and b = 25 mm).
F Bnu Bec Bnu/Bec Qnu Qec Qnu/Qec
(kN) (kN) (kN) (kN) (kN)0 0.000 0.000 - 0.000 0.000 -25 9.574 9.119 1.05 2.918 2.869 1.0250 18.103 18.239 0.99 5.848 5.739 1.0275 27.712 27.358 1.01 8.778 8.608 1.02100 36.296 36.477 1.05 11.672 11.477 1.02125 46.833 45.597 1.03 14.152 14.347 0.99150 55.476 54.716 1.01 17.535 17.216 1.02175 62.119 * - 19.684 * -200 70.102 * - 23.407 * -206 76.762 * - 26.055 * -
Note: Asterisks indicate that the inelastic values were not covered in the EC3 model.
12
SOLTANI, KERDAL
Table 6b. Numerical and EC3 values for IPE300 specimen (a = 45 mm and b = 30 mm).
F Bnu Bec Bnu/Bec Qnu Qec Qnu/Qec
(kN) (kN) (kN) (kN) (kN)0 0.000 0.000 - 0.000 0.000 -25 9.387 8.540 1.10 3.007 2.290 1.3150 18.182 17.080 1.06 6.015 4.580 1.3175 27.773 25.620 1.08 8.222 6.870 1.20100 36.364 34.160 1.06 11.029 9.160 1.20125 45.520 42.700 1.07 13.437 11.450 1.17150 53.694 51.241 1.05 16.044 13.741 1.17175 64.320 * - 19.570 * -200 69.650 * - 21.277 * -206 77.875 * - 25.754 * -
Note: Asterisks indicate that the inelastic values were not covered in the EC3 model.
Table 6c. Numerical and EC3 values for IPE300 specimen (a = 45 mm and b = 35 mm).
F Bnu Bec Bnu/Bec Qnu Qec Qnu/Qec
(kN) (kN) (kN) (kN) (kN)0 0.000 0.000 - 0.000 0.000 -25 8.574 8.133 1.05 2.363 1.883 1.2950 18.103 16.267 1.11 4.725 3.767 1.2575 26.712 24.400 1.09 7.808 5.650 1.38100 35.296 32.533 1.08 9.467 7.533 1.26125 43.833 40.667 1.08 11.873 9.417 1.26150 52.476 48.800 1.07 15.360 11.300 1.36175 62.119 * - 18.564 * -200 75.102 * - 21.230 * -206 77.762 * - 25.154 * -
Note: Asterisks indicate that the inelastic values were not covered in the EC3 model.
Table 6d. Numerical and EC3 values for IPE300 specimen (a = 45 mm and b = 40 mm).
F Bnu Bec Bnu/Bec Qnu Qec Qnu/Qec
(kN) (kN) (kN) (kN) (kN)0 0.000 0.000 - 0.000 0.000 -25 8.387 8.015 1.04 2.902 1.765 1.6450 17.182 16.029 1.07 5.095 3.529 1.4475 25.773 24.044 1.07 7.160 5.294 1.35100 34.364 32.058 1.07 12.225 7.059 1.73125 43.520 40.074 1.08 15.434 8.824 1.75150 53.694 48.088 1.12 17.170 10.588 1.62175 62.320 * - 23.206 * -200 73.650 * - 25.405 * -206 77.875 * - 26.559 * -
Note: Asterisks indicate that the inelastic values were not covered in the EC3 model.
13
SOLTANI, KERDAL
Table 7a. Numerical and EC3 values for HEB220 specimen (a = 45 mm and b = 25 mm).
F Bnu Bec Bnu/Bec Qnu Qec Qnu/Qec
(kN) (kN) (kN) (kN) (kN)0 0.000 0.000 - 0.000 0.000 -25 9.174 9.119 1.01 2.718 2.869 0.9550 18.003 18.239 0.99 5.488 5.739 0.9675 27.172 27.358 0.99 8.778 8.608 1.02100 36.692 36.477 1.01 11.267 11.477 0.98125 46.833 45.597 1.03 14.152 14.347 0.99150 55.476 54.716 1.01 17.135 17.216 0.99175 64.119 * - 21.684 * -198 61.102 * - 20.407 * -200 77.267 * - 25.055 * -
Note: Asterisks indicate that the inelastic values were not covered in the EC3 model.
Table 7b. Numerical and EC3 values for HEB220 specimen (a = 45 mm and b = 30 mm).
F Bnu Bec Bnu/Bec Qnu Qec Qnu/Qec
(kN) (kN) (kN) (kN) (kN)0 0.000 0.000 - 0.000 0.000 -25 9.387 8.540 1.10 2.667 2.290 1.1650 17.982 17.080 1.05 5.015 4.580 1.0975 26.773 25.620 1.04 8.222 6.870 1.20100 36.364 34.160 1.06 11.229 9.160 1.22125 45.520 42.700 1.07 14.137 11.450 1.23150 54.694 51.241 1.07 16.044 13.741 1.17175 64.320 * - 19.057 * -198 69.650 * - 21.277 * -200 77.875 * - 25.754 * -
Note: Asterisks indicate that the inelastic values were not covered in the EC3 model.
Table 7c. Numerical and EC3 values for HEB220 specimen (a = 45 mm and b = 35 mm).
F Bnu Bec Bnu/Bec Qnu Qec Qnu/Qec
(kN) (kN) (kN) (kN) (kN)0 0.000 0.000 - 0.000 0.000 -25 8.387 8.133 1.05 2.902 1.883 1.4450 17.182 16.267 1.11 5.095 3.767 1.5775 25.773 24.400 1.09 7.379 5.650 1.31100 34.364 32.533 1.08 12.939 7.533 1.72125 43.520 40.667 1.08 15.098 9.417 1.60150 53.694 48.800 1.07 17.460 11.300 1.55175 62.320 * - 23.164 * -198 73.650 * - 25.530 * -200 77.875 * - 26.554 * -
Note: Asterisks indicate that the inelastic values were not covered in the EC3 model.
14
SOLTANI, KERDAL
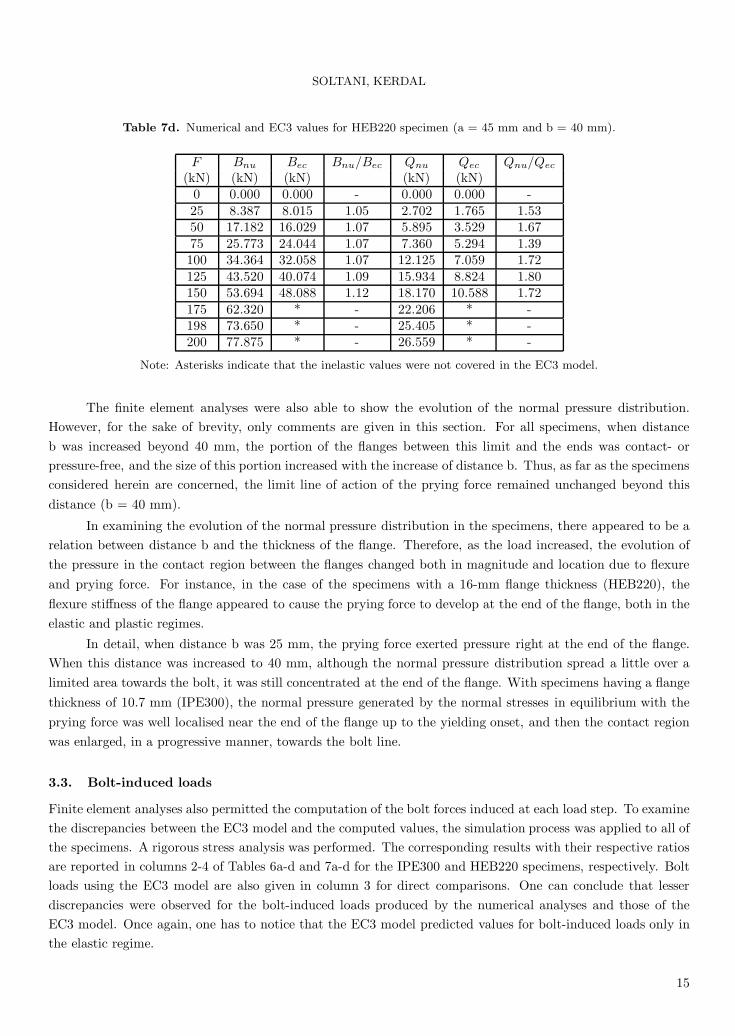
Table 7d. Numerical and EC3 values for HEB220 specimen (a = 45 mm and b = 40 mm).
F Bnu Bec Bnu/Bec Qnu Qec Qnu/Qec
(kN) (kN) (kN) (kN) (kN)0 0.000 0.000 - 0.000 0.000 -25 8.387 8.015 1.05 2.702 1.765 1.5350 17.182 16.029 1.07 5.895 3.529 1.6775 25.773 24.044 1.07 7.360 5.294 1.39100 34.364 32.058 1.07 12.125 7.059 1.72125 43.520 40.074 1.09 15.934 8.824 1.80150 53.694 48.088 1.12 18.170 10.588 1.72175 62.320 * - 22.206 * -198 73.650 * - 25.405 * -200 77.875 * - 26.559 * -
Note: Asterisks indicate that the inelastic values were not covered in the EC3 model.
The finite element analyses were also able to show the evolution of the normal pressure distribution.However, for the sake of brevity, only comments are given in this section. For all specimens, when distanceb was increased beyond 40 mm, the portion of the flanges between this limit and the ends was contact- orpressure-free, and the size of this portion increased with the increase of distance b. Thus, as far as the specimensconsidered herein are concerned, the limit line of action of the prying force remained unchanged beyond thisdistance (b = 40 mm).
In examining the evolution of the normal pressure distribution in the specimens, there appeared to be arelation between distance b and the thickness of the flange. Therefore, as the load increased, the evolution ofthe pressure in the contact region between the flanges changed both in magnitude and location due to flexureand prying force. For instance, in the case of the specimens with a 16-mm flange thickness (HEB220), theflexure stiffness of the flange appeared to cause the prying force to develop at the end of the flange, both in theelastic and plastic regimes.
In detail, when distance b was 25 mm, the prying force exerted pressure right at the end of the flange.When this distance was increased to 40 mm, although the normal pressure distribution spread a little over alimited area towards the bolt, it was still concentrated at the end of the flange. With specimens having a flangethickness of 10.7 mm (IPE300), the normal pressure generated by the normal stresses in equilibrium with theprying force was well localised near the end of the flange up to the yielding onset, and then the contact regionwas enlarged, in a progressive manner, towards the bolt line.
3.3. Bolt-induced loads
Finite element analyses also permitted the computation of the bolt forces induced at each load step. To examinethe discrepancies between the EC3 model and the computed values, the simulation process was applied to all ofthe specimens. A rigorous stress analysis was performed. The corresponding results with their respective ratiosare reported in columns 2-4 of Tables 6a-d and 7a-d for the IPE300 and HEB220 specimens, respectively. Boltloads using the EC3 model are also given in column 3 for direct comparisons. One can conclude that lesserdiscrepancies were observed for the bolt-induced loads produced by the numerical analyses and those of theEC3 model. Once again, one has to notice that the EC3 model predicted values for bolt-induced loads only inthe elastic regime.
15
SOLTANI, KERDAL
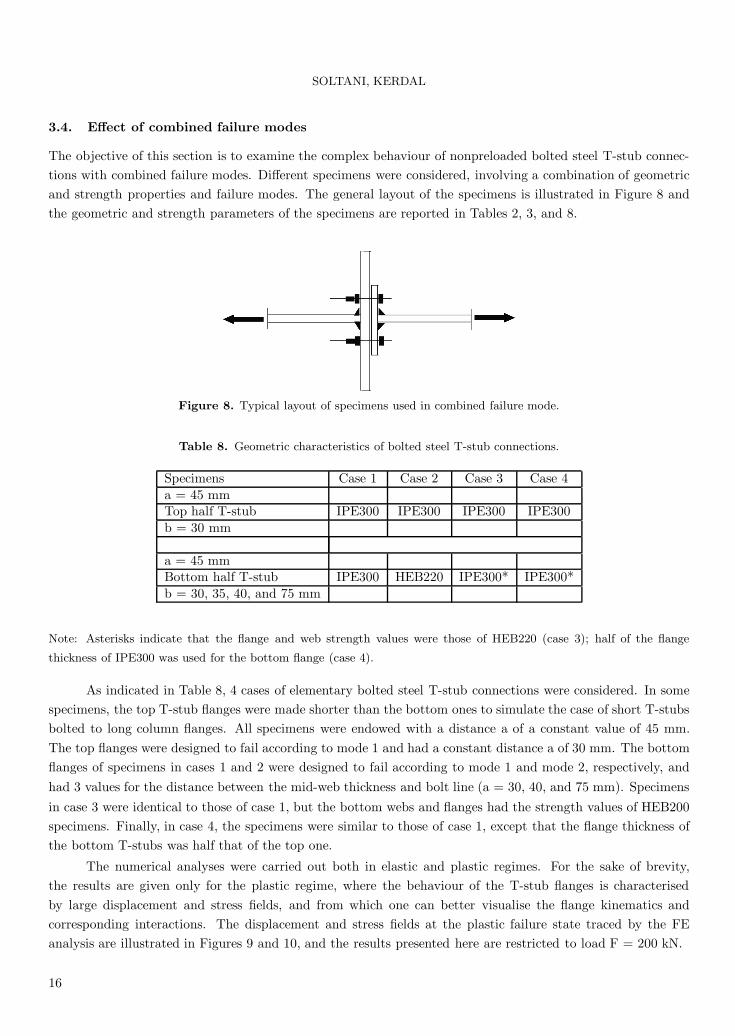
3.4. Effect of combined failure modes
The objective of this section is to examine the complex behaviour of nonpreloaded bolted steel T-stub connec-tions with combined failure modes. Different specimens were considered, involving a combination of geometricand strength properties and failure modes. The general layout of the specimens is illustrated in Figure 8 andthe geometric and strength parameters of the specimens are reported in Tables 2, 3, and 8.
Figure 8. Typical layout of specimens used in combined failure mode.
Table 8. Geometric characteristics of bolted steel T-stub connections.
Specimens Case 1 Case 2 Case 3 Case 4a = 45 mmTop half T-stub IPE300 IPE300 IPE300 IPE300b = 30 mm
a = 45 mmBottom half T-stub IPE300 HEB220 IPE300* IPE300*b = 30, 35, 40, and 75 mm
Note: Asterisks indicate that the flange and web strength values were those of HEB220 (case 3); half of the flange
thickness of IPE300 was used for the bottom flange (case 4).
As indicated in Table 8, 4 cases of elementary bolted steel T-stub connections were considered. In somespecimens, the top T-stub flanges were made shorter than the bottom ones to simulate the case of short T-stubsbolted to long column flanges. All specimens were endowed with a distance a of a constant value of 45 mm.The top flanges were designed to fail according to mode 1 and had a constant distance a of 30 mm. The bottomflanges of specimens in cases 1 and 2 were designed to fail according to mode 1 and mode 2, respectively, andhad 3 values for the distance between the mid-web thickness and bolt line (a = 30, 40, and 75 mm). Specimensin case 3 were identical to those of case 1, but the bottom webs and flanges had the strength values of HEB200specimens. Finally, in case 4, the specimens were similar to those of case 1, except that the flange thickness ofthe bottom T-stubs was half that of the top one.
The numerical analyses were carried out both in elastic and plastic regimes. For the sake of brevity,the results are given only for the plastic regime, where the behaviour of the T-stub flanges is characterisedby large displacement and stress fields, and from which one can better visualise the flange kinematics andcorresponding interactions. The displacement and stress fields at the plastic failure state traced by the FEanalysis are illustrated in Figures 9 and 10, and the results presented here are restricted to load F = 200 kN.
16
SOLTANI, KERDAL
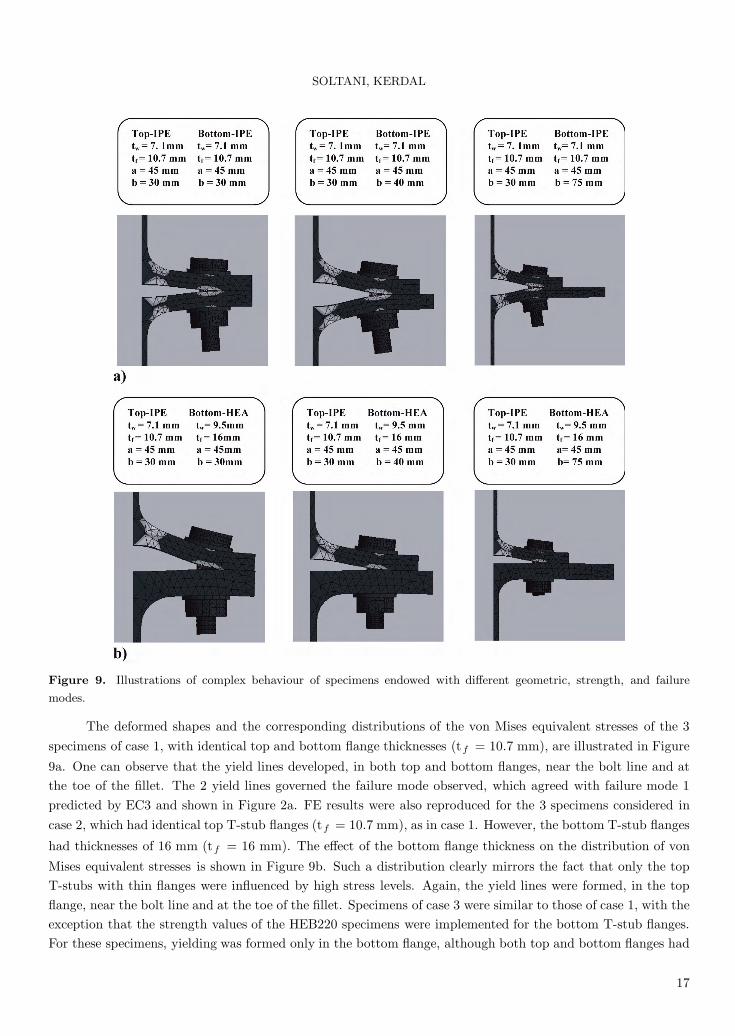
Figure 9. Illustrations of complex behaviour of specimens endowed with different geometric, strength, and failure
modes.
The deformed shapes and the corresponding distributions of the von Mises equivalent stresses of the 3specimens of case 1, with identical top and bottom flange thicknesses (tf = 10.7 mm), are illustrated in Figure
9a. One can observe that the yield lines developed, in both top and bottom flanges, near the bolt line and atthe toe of the fillet. The 2 yield lines governed the failure mode observed, which agreed with failure mode 1predicted by EC3 and shown in Figure 2a. FE results were also reproduced for the 3 specimens considered incase 2, which had identical top T-stub flanges (tf = 10.7 mm), as in case 1. However, the bottom T-stub flanges
had thicknesses of 16 mm (tf = 16 mm). The effect of the bottom flange thickness on the distribution of von
Mises equivalent stresses is shown in Figure 9b. Such a distribution clearly mirrors the fact that only the topT-stubs with thin flanges were influenced by high stress levels. Again, the yield lines were formed, in the topflange, near the bolt line and at the toe of the fillet. Specimens of case 3 were similar to those of case 1, with theexception that the strength values of the HEB220 specimens were implemented for the bottom T-stub flanges.For these specimens, yielding was formed only in the bottom flange, although both top and bottom flanges had
17
SOLTANI, KERDAL
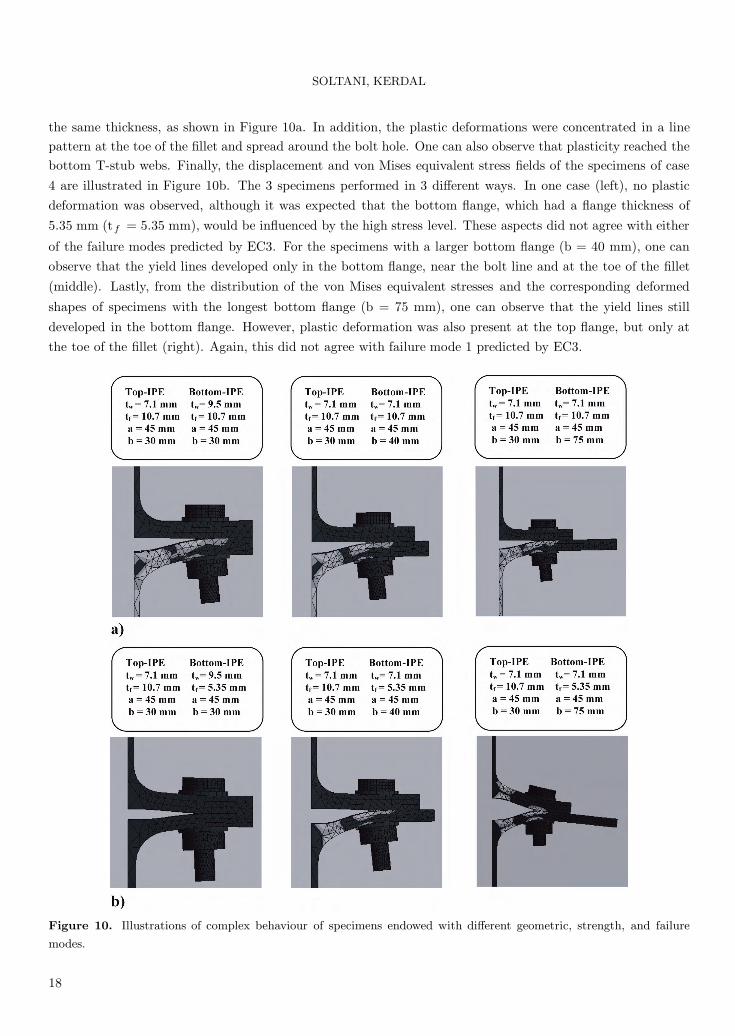
the same thickness, as shown in Figure 10a. In addition, the plastic deformations were concentrated in a linepattern at the toe of the fillet and spread around the bolt hole. One can also observe that plasticity reached thebottom T-stub webs. Finally, the displacement and von Mises equivalent stress fields of the specimens of case4 are illustrated in Figure 10b. The 3 specimens performed in 3 different ways. In one case (left), no plasticdeformation was observed, although it was expected that the bottom flange, which had a flange thickness of5.35 mm (tf = 5.35 mm), would be influenced by the high stress level. These aspects did not agree with either
of the failure modes predicted by EC3. For the specimens with a larger bottom flange (b = 40 mm), one canobserve that the yield lines developed only in the bottom flange, near the bolt line and at the toe of the fillet(middle). Lastly, from the distribution of the von Mises equivalent stresses and the corresponding deformed
shapes of specimens with the longest bottom flange (b = 75 mm), one can observe that the yield lines stilldeveloped in the bottom flange. However, plastic deformation was also present at the top flange, but only atthe toe of the fillet (right). Again, this did not agree with failure mode 1 predicted by EC3.
Figure 10. Illustrations of complex behaviour of specimens endowed with different geometric, strength, and failure
modes.
18
SOLTANI, KERDAL
As illustrated, the specimens performed in different ways under combined failure modes and differentgeometric and strength parameters. Although the observed displacement and stress distribution fields resultingfrom the FE model were related to elementary bolted steel T-stub connections, features like this could be thoseinherent to the tension region in endplate bolted steel beam-to-column connections. An understanding of thesecomplex phenomena is of great benefit in setting a suitable basis upon which to develop a theoretical modeland in which the connection will be able to reflect the assumptions used in analysis.
4. Conclusion
This study was devoted to the analysis of elementary bolted steel T-stub connections by a 3D finite elementmodel using the ANSYS software package. The elementary bolted steel T-stub connections used were endowedwith different geometric and strength parameters as well as failure modes. The 3D FE model was able toreproduce the elastoplastic response, up to the ultimate state, and aspects such as stiffness, strength, bolt loads,and prying forces were examined. The comparisons performed highlighted discrepancies between numericalresults and the EC3 model. It was concluded that the EC3 design procedure still needs to be improved andthat a rigorous model is required. In this paper, aspects relative to elementary bolted steel T-stub connectionswere studied. A theoretical model to predict the behaviour of nonpreloaded elementary bolted steel T-stubconnections will be presented in a subsequent paper in the same journal. Numerical results obtained from thefinite element simulations will be included to demonstrate the validity of the model.
Acknowledgement
The authors express their gratitude to the laboratory staff of Applied Mechanics, Department of Mechanical En-gineering, Faculty of Mechanical Engineering and Metallurgy, University of Sciences and Technology, MohamedBOUDIAF, Oran, Algeria.
References
Agerskov, H., “Analysis of Bolted Connections Subject to Prying”, Journal of the Structural Division, 103, 2145-2163,
1977.
Bahaari, M.R. and Sherbourne, A.N., “3D Simulation of Endplate Bolted Connections”, Journal of Structural Engi-
neering, 120, 3122-3136, 1994.
Bahaari, M.R. and Sherbourne, A.N., “3D Simulation of Bolted Connections to Unstiffened Columns: Extended
Endplate Connections”, Journal of Constructional Steel Research, 40, 189-223, 1997.
Bahaari, M.R. and Sherbourne, A.N., “Behaviour of Eight Bolt Large Capacity Endplate Connections”, Computers
and Sciences, 77, 315-325, 2000.
Bursi, O.S. and Jaspart, J.P., “Benchmarks for Finite Element Modelling of Bolted Steel Connections”, Journal of
Constructional Steel Research, 43, 17-42, 1997.
Douty, R.T. and McGuire, W., “High Strength Bolted Moment Connections”, Journal of the Structural Division, 91,
101-128, 1965.
Eurocode3, Design of Steel Structures: General Rules and Rules for Buildings, Brussels, Belgium, 2005.
Grogan, W. and Surtees, J.O., “Experimental Behaviour of Endplate Connections Reinforced with Bolted Backing
Angles”, Journal of Constructional Steel Research, 50, 71-96, 1999.
19
SOLTANI, KERDAL
Harada, Y., Nagawa, H. and Morita. K., “Out-of-Plane Behaviour of Column Skin Plate in RHS Column-to-Split-T
Tensile Connection with High Strength Bolts”, Journal of Structural and Construction Engineering, 56, 173-180, 2003.
Jaspart, J.P. and Bursi, O.S., “Calibration of a Finite Element Model for Isolated Bolted Endplate Steel Connections”,
Journal of Constructional Steel Research, 44, 225-262, 1997.
Johansen, K.W., Yield Line Theory, Cement and Concrete Association, London, 1962.
Mansfield, E.H., Studies in Collapse Analysis of Rigid Plastic Plates With a Square Yield Diagram, London, 1957.
Moore D.B. and Sims, P.A.C., “Preliminary Investigations into the Behaviour of Extended Endplate Steel Connections
with Backing Plates”, Journal of Constructional Steel Research, 6, 95-122, 1986.
Packer, J.A. and Morris, L.J., “A Limit State Design Method for Tension Region of Bolted Beam-Column Connections”,
The Structural Engineer, 55, 446-458, 1977.
Sherbourne, A.N. and Bahaari, M.R., “3D Simulation of Bolted Connections to Unstiffened Columns: T-stub Connec-
tions”, Journal of Constructional Steel Research, 40, 169-187, 1997.
Swanson, J.A. and Leon, R.T., “Bolted Steel Connections: Tests on T-stub Components”, Journal of Structural
Engineering, 127, 498-512, 2001.
Tagawa, H. and Gurel, S., Strength Evaluation of Bolted Moment Connections Stiffened With Channels, Tokai, Japan,
2004.
Yang, J.G., Murray, T.M and Plaut, R.H., “Three Dimensional Finite Element Analysis of Double Angle Connections
under Tension and Shear”, Journal of Constructional Steel Research, 54, 227-244, 1997.
Zoetemeijer, P., A Design Method for the Tension Side of Statically Loaded Bolted Beam to Column Connections,
Delft, Netherlands, 1974.
20