Behavioral/Systems/Cognitive ... · PDF filetaxic coordinates of V4 in two adult male rhesus...
11
Behavioral/Systems/Cognitive Attention Influences Single Unit and Local Field Potential Response Latencies in Visual Cortical Area V4 Kristy A. Sundberg, 1 Jude F. Mitchell, 1 Timothy J. Gawne, 2 and John H. Reynolds 1 1 Systems Neurobiology Laboratory, The Salk Institute for Biological Studies, La Jolla, California 92037, and 2 Department of Vision Sciences, University of Alabama at Birmingham, Birmingham, Alabama 35294 Many previous studies have demonstrated that changes in selective attention can alter the response magnitude of visual cortical neurons, but there has been little evidence for attention affecting response latency. Small latency differences, though hard to detect, can potentially be of functional importance, and may also give insight into the mechanisms of neuronal computation. We therefore reexamined the effect of attention on the response latency of both single units and the local field potential (LFP) in primate visual cortical area V4. We find that attention does produce small (1–2 ms) but significant reductions in the latency of both the spiking and LFP responses. Though attention, like contrast elevation, reduces response latencies, we find that the two have different effects on the magnitude of the LFP. Contrast elevations increase and attention decreases the magnitude of the initial deflection of the stimulus-evoked LFP. Both contrast elevation and attention increase the magnitude of the spiking response. We speculate that latencies may be reduced at higher contrast because stronger stimulus inputs drive neurons more rapidly to spiking threshold, while attention may reduce latencies by placing neurons in a more depolarized state closer to threshold before stimulus onset. Introduction Attention can alter firing rates of visual cortical neurons (Moran and Desimone, 1985; Mountcastle et al., 1987; Spitzer et al., 1988; Roelfsema et al., 1998; McAdams and Maunsell, 1999; Reynolds et al., 1999, 2000; Treue and Martínez Trujillo, 1999; McAdams and Reid, 2005; Williford and Maunsell, 2006; Mitchell et al., 2007; Khayat et al., 2010). Its effect on the timing of the response is less obvious. Elevation of contrast reduces the response latency of visual cortical neurons (Celebrini et al., 1993; Carandini and Heeger, 1994; Albrecht, 1995; Gawne et al., 1996; Reich et al., 2001). Models of contrast gain control can account for this contrast-dependent reduction in latency (Victor, 1987; Caran- dini and Heeger, 1994; Carandini et al., 1997) and there is evi- dence that attentional feedback modulates the circuitry that mediates contrast gain control (Reynolds et al., 1999, 2000; Reyn- olds and Chelazzi, 2004; Reynolds and Heeger, 2009; Lee and Maunsell, 2009; but see, Thiele et al., 2009). However, current evidence suggests that changes in attention do not significantly alter response latency (Reynolds et al., 2000; Bisley et al., 2004; Cook and Maunsell, 2004; McAdams and Reid, 2005; Lee et al., 2007). Modest changes in the relative latency of neurons can be func- tionally important (VanRullen et al., 2005). Feedforward inhibi- tion has been shown to have powerful effects in cortex for timing changes on the order of 2 ms or less (Pouille and Scanziani, 2001; Swadlow, 2003). It has also been proposed that small changes in relative timing of inputs could create a temporal gating system for controlling information flow in cortex (Gawne, 2008). Small changes in response latency could also yield insight into the mechanisms of neuronal computation. Given the potential importance of even small changes in response latency, we revisited the question of whether atten- tion modulates response latency. We examined the latencies of the spiking and local field potential (LFP) responses evoked by a stimulus when attention was either directed toward the stim- ulus or away to a second stimulus that was placed contralateral to the receptive field. The LFP is the low-frequency (typically 100 Hz) component of the potential recorded from a micro- electrode. It provides information that is complementary to that of spikes, reflecting the subthreshold potentials driven primarily from a local population of neurons (Mitzdorf, 1985; Kamondi et al., 1998; Logothetis, 2002, 2003; Buzsaki, 2006; Monosov et al., 2008). Changes in attention could therefore affect response dynamics of the LFP that are not obvious in spiking responses. We find that attention causes a small but significant reduction in the latency of the spiking and LFP responses. Attention and contrast are distinct in their influence on the magnitude of the stimulus-locked local field potential, with increasing contrast causing an increase in the depth of the initial LFP transient re- sponse, and attention diminishing the depth of the same trough. Thus, while attention changes response latency, it most likely does so via different mechanisms than those involved in contrast Received Feb. 1, 2012; revised Aug. 15, 2012; accepted Sept. 14, 2012. Author contributions: K.A.S., J.F.M., and J.H.R. designed research; K.A.S. and J.F.M. performed research; K.A.S., J.F.M., and T.J.G. analyzed data; K.A.S., J.F.M., T.J.G., and J.H.R. wrote the paper. This work was supported in part by a grant from the National Eye Institute (EY13802 to J.F.M. and J.H.R.), a National Institutes of Health Training Fellowship (J.F.M.), a grant from the National Science Foundation (IOS 0622318 to T.J.G.), and by a grant from The Gatsby Charitable Foundation (J.H.R.). We thank C. Williams and J. Reyes for help with animals and technical support. The authors declare no financial conflicts of interest. Correspondence should be addressed to John H. Reynolds, Systems Neurobiology Laboratory, The Salk Institute for Biological Studies, La Jolla, CA 92037. E-mail: [email protected]. DOI:10.1523/JNEUROSCI.0489-12.2012 Copyright © 2012 the authors 0270-6474/12/3216040-11$15.00/0 16040 • The Journal of Neuroscience, November 7, 2012 • 32(45):16040 –16050
Transcript of Behavioral/Systems/Cognitive ... · PDF filetaxic coordinates of V4 in two adult male rhesus...

Behavioral/Systems/Cognitive
Attention Influences Single Unit and Local Field PotentialResponse Latencies in Visual Cortical Area V4
Kristy A. Sundberg,1 Jude F. Mitchell,1 Timothy J. Gawne,2 and John H. Reynolds1
1Systems Neurobiology Laboratory, The Salk Institute for Biological Studies, La Jolla, California 92037, and 2Department of Vision Sciences, University ofAlabama at Birmingham, Birmingham, Alabama 35294
Many previous studies have demonstrated that changes in selective attention can alter the response magnitude of visual cortical neurons,but there has been little evidence for attention affecting response latency. Small latency differences, though hard to detect, can potentiallybe of functional importance, and may also give insight into the mechanisms of neuronal computation. We therefore reexamined the effectof attention on the response latency of both single units and the local field potential (LFP) in primate visual cortical area V4. We find thatattention does produce small (1–2 ms) but significant reductions in the latency of both the spiking and LFP responses. Though attention,like contrast elevation, reduces response latencies, we find that the two have different effects on the magnitude of the LFP. Contrastelevations increase and attention decreases the magnitude of the initial deflection of the stimulus-evoked LFP. Both contrast elevationand attention increase the magnitude of the spiking response. We speculate that latencies may be reduced at higher contrast becausestronger stimulus inputs drive neurons more rapidly to spiking threshold, while attention may reduce latencies by placing neurons in amore depolarized state closer to threshold before stimulus onset.
IntroductionAttention can alter firing rates of visual cortical neurons (Moranand Desimone, 1985; Mountcastle et al., 1987; Spitzer et al., 1988;Roelfsema et al., 1998; McAdams and Maunsell, 1999; Reynoldset al., 1999, 2000; Treue and Martínez Trujillo, 1999; McAdamsand Reid, 2005; Williford and Maunsell, 2006; Mitchell et al.,2007; Khayat et al., 2010). Its effect on the timing of the responseis less obvious. Elevation of contrast reduces the response latencyof visual cortical neurons (Celebrini et al., 1993; Carandini andHeeger, 1994; Albrecht, 1995; Gawne et al., 1996; Reich et al.,2001). Models of contrast gain control can account for thiscontrast-dependent reduction in latency (Victor, 1987; Caran-dini and Heeger, 1994; Carandini et al., 1997) and there is evi-dence that attentional feedback modulates the circuitry thatmediates contrast gain control (Reynolds et al., 1999, 2000; Reyn-olds and Chelazzi, 2004; Reynolds and Heeger, 2009; Lee andMaunsell, 2009; but see, Thiele et al., 2009). However, currentevidence suggests that changes in attention do not significantlyalter response latency (Reynolds et al., 2000; Bisley et al., 2004;Cook and Maunsell, 2004; McAdams and Reid, 2005; Lee et al.,2007).
Modest changes in the relative latency of neurons can be func-tionally important (VanRullen et al., 2005). Feedforward inhibi-tion has been shown to have powerful effects in cortex for timingchanges on the order of 2 ms or less (Pouille and Scanziani, 2001;Swadlow, 2003). It has also been proposed that small changes inrelative timing of inputs could create a temporal gating system forcontrolling information flow in cortex (Gawne, 2008). Smallchanges in response latency could also yield insight into themechanisms of neuronal computation.
Given the potential importance of even small changes inresponse latency, we revisited the question of whether atten-tion modulates response latency. We examined the latencies ofthe spiking and local field potential (LFP) responses evoked bya stimulus when attention was either directed toward the stim-ulus or away to a second stimulus that was placed contralateralto the receptive field. The LFP is the low-frequency (typically�100 Hz) component of the potential recorded from a micro-electrode. It provides information that is complementary tothat of spikes, reflecting the subthreshold potentials drivenprimarily from a local population of neurons (Mitzdorf, 1985;Kamondi et al., 1998; Logothetis, 2002, 2003; Buzsaki, 2006;Monosov et al., 2008). Changes in attention could thereforeaffect response dynamics of the LFP that are not obvious inspiking responses.
We find that attention causes a small but significant reductionin the latency of the spiking and LFP responses. Attention andcontrast are distinct in their influence on the magnitude of thestimulus-locked local field potential, with increasing contrastcausing an increase in the depth of the initial LFP transient re-sponse, and attention diminishing the depth of the same trough.Thus, while attention changes response latency, it most likelydoes so via different mechanisms than those involved in contrast
Received Feb. 1, 2012; revised Aug. 15, 2012; accepted Sept. 14, 2012.Author contributions: K.A.S., J.F.M., and J.H.R. designed research; K.A.S. and J.F.M. performed research; K.A.S.,
J.F.M., and T.J.G. analyzed data; K.A.S., J.F.M., T.J.G., and J.H.R. wrote the paper.This work was supported in part by a grant from the National Eye Institute (EY13802 to J.F.M. and J.H.R.), a
National Institutes of Health Training Fellowship (J.F.M.), a grant from the National Science Foundation (IOS0622318 to T.J.G.), and by a grant from The Gatsby Charitable Foundation (J.H.R.). We thank C. Williams and J. Reyesfor help with animals and technical support.
The authors declare no financial conflicts of interest.Correspondence should be addressed to John H. Reynolds, Systems Neurobiology Laboratory, The Salk Institute
for Biological Studies, La Jolla, CA 92037. E-mail: [email protected]:10.1523/JNEUROSCI.0489-12.2012
Copyright © 2012 the authors 0270-6474/12/3216040-11$15.00/0
16040 • The Journal of Neuroscience, November 7, 2012 • 32(45):16040 –16050

changes. We considered possible underlying mechanisms in theDiscussion.
Materials and MethodsSubjects and surgery. Preoperative MRI was used to identify the stereo-taxic coordinates of V4 in two adult male rhesus monkeys (Macaca mu-latta). Experimental and surgical procedures have been describedpreviously (Reynolds et al., 1999). A recording chamber was placed overthe prelunate gyrus. At the beginning of the study, several recordingswere made at different positions in each recording chamber to ensurethat the electrode was in area V4, on the basis of receptive field (RF) sizes,topographic organization, and feature preferences. To inhibit granula-tion tissue growth in the chamber, the anti-mitotic 5-fluorouracil wasapplied to the tissue in the chamber three times each week (Spinks et al.,2003). Experimental and surgical procedures were approved by the SalkInstitute Institutional Animal Care and Use Committee and conformedto NIH guidelines for the care and use of laboratory animals.
Electrophysiology and stimulus presentation. In each experimental ses-sion, two to four tungsten electrodes (FHC) were advanced into cortexusing a multielectrode drive (NAN 4-tower drive, Plexon; or 3NRM-3Amicrodrive, Crist Instrument). Electrodes were passed through guidetubes that touched but did not penetrate the dura. Guide tubes werepositioned using a grid with 1 mm spacing between adjacent locations.Neuronal signals were recorded extracellularly, filtered, and stored usingthe Multichannel Acquisition Processor system (Plexon). To record spik-ing activity, the signal was filtered from 400 Hz to 8.8 kHz and digitized at40 kHz. Single units were isolated online with Rasputin software(Plexon). Spike sorting was then repeated offline using the Plexon OfflineSorter to ensure that all action potentials were well isolated throughoutthe recording session. Single units recorded on a given electrode wereisolated by waveform shape and included for analysis only if the wave-forms formed an identifiable cluster when projected into the space de-fined by the principal components derived from the all waveformsrecorded on that electrode.
The cortical LFP consists of two components: a fast local (retinotopic)component and a slow distributed (nonretinotopic) one (Doty, 1958;Ebersole and Kaplan, 1981; Gawne, 2010; Kasamatsu et al., 2005; Kitanoet al., 1994, 1995). In this study, we restricted our analysis to the fast localcomponent of the LFP, because it is the one that is most closely associatedwith local neuronal activity. In particular, the fast local component has alatency and retinotopic spread that is closely related to local spikingactivity. To record LFP activity, the signal was filtered from 0.7 Hz to 170Hz and digitized at 1 kHz.
Stimuli were presented on a computer monitor (Sony TrinitronMultiscan, TC, 640 � 480 pixel resolution, 120 Hz) placed 57 cm fromthe eye. Lookup tables were linearized using a PR-650 or PR-701Sspectroradiometer (Photo-Research). Eye position was continuouslymonitored with an infrared eye tracking system (240 Hz, ETL-400;ISCAN). Experimental control was handled by NIMH Cortex soft-ware (http://www.cortex.salk.edu/).
Behavioral task. Neuronal responses were recorded as the monkeyperformed an attention-demanding multiple-object tracking task.Task and stimulus conditions were as described by Sundberg et al.(2009). Briefly, the monkey began each trial by fixating a central pointfor 200 ms and then maintained fixation through the trial. Four iden-tical square-wave gratings presented in a circular aperture (2° diam-eter, 2 cycles/degree) appeared, positioned so that they fell outsideeach neuron’s classical RF. One or two stimuli were then briefly ele-vated in luminance, identifying them as targets. All stimuli thenmoved along independent trajectories at �10°/s for 950 ms, placingthem at a new set of equally eccentric locations, with one stimulus inthe receptive field of the neurons under study, and the others outside thereceptive field. Attention was either directed into or away from the re-ceptive field, depending on whether or not the stimulus in the receptivefield was cued at the beginning of the trial. Following the pause period,stimuli moved to another set of locations, the fixation point disappeared,and the monkey made a saccade to each target. Reward was delivered ifthe monkey made a saccade to all cued targets, without first making asaccade to a nontarget.
During the movement and pause phases of the trial, stimuli wereflashed for 50 ms with a 150 ms blank between flashes. Eight flashesoccurred during the pause period. Each time the stimuli flashed, theywere presented at a different contrast value (99%, 57%, 33%, 19%, 11%,6.5%, 3.5%, and 0%).
Analyses were performed only on correctly completed trials to ensurethat the monkey was attending to the cued items. Incorrect trials wererepeated later in the experimental session. Both monkeys performed thistask above 70% correct, well above chance levels of 25% for experimentswith one-target tracking and 16.5% for two-target tracking experimentsin which monkeys had to identify both targets. All cells in the first mon-key and approximately half (38 of 86) of cells in the second monkey wererecorded in the one-target tracking paradigm.
Data analysis. Analysis was done using the MATLAB software package(Mathworks). Over the course of 124 sessions, 164 single units and 309LFPs were recorded in two monkeys. Single units and LFPs were includedfor analysis if a stimulus of any contrast elicited a response robust enoughto allow accurate latency estimation (see below for latency calculationmethods). Analyses that required direct comparisons between contrastswere restricted to the subset of cells that met this inclusion criterion forboth of the contrasts compared.
Response latency for spiking activity was calculated by a metric used byLee et al. (2007), as the time the spike density function reached 50% of themaximum firing rate in the transient response following stimulus onset.To calculate the latency, the response histogram was first smoothed withan 8 ms � Gaussian kernel. The response maximum was defined to be thefirst local maxima occurring at least 45 ms after stimulus onset, if itexceeded 3.72 times the standard error of the baseline response andexceeded 3 times the maximum baseline response. In cases where the firstlocal maximum failed to meet these criteria, the global maximum of thesmoothed response histogram was used. The response latency was de-fined as the time the smoothed response histogram reached half thedifference between the maximum amplitude and baseline amplitude,where baseline amplitude is defined as the mean response to a zero con-trast stimulus. To determine the reliability of the latency measurement,bootstrap confidence intervals were calculated (1000 resamplings). Alatency was only included in the analysis if the 95% bootstrap confidenceintervals were �30 ms. Latency estimates became increasingly unreliableat low contrasts. Of the original eight contrasts tested, we only includedcontrasts for which latencies could reliably be estimated for at least 30individual neurons in both attention conditions, as indicated by thebootstrap test. This resulted in exclusion of the four contrasts �19%from further consideration. Response amplitude was defined as the max-imum firing rate of the response histogram.
Two response latencies for LFPs were calculated, the first as the timethe stimulus-evoked LFP reached the peak of its first negative deflection(restricted to a window 50 –100 ms poststimulus onset) and the second asthe time the stimulus-evoked LFP reached the peak of its first positivedeflection (restricted to a window 75–125 ms poststimulus onset). Todetermine the reliability of the latency calculation, bootstrap confidenceintervals were calculated (1000 resamplings). A latency was only includedin the analysis if the 95% bootstrap confidence intervals were �10 ms.Response amplitude was defined as the amplitude of the deflection of thestimulus-evoked LFP.
Attention-dependent shifts in latency were defined as Delta latency �attended latency � unattended latency. Contrast-dependent shifts inlatency were defined as Delta latency � higher contrast unattended la-tency � lower contrast unattended latency. Attention-dependentchanges in response magnitude were defined as Difference index � (at-tended � unattended)/(attended � unattended). Contrast-dependentchanges in response magnitude were defined as Difference index �(higher contrast � lower contrast)/(higher contrast � lower contrast).Indexes were used to calculate changes in response magnitude due todifferences in absolute response magnitudes. This index varies over arange from �1.0 to �1.0, with 0 indicating no effect of attention orcontrast.
Statistical significance of population latency and magnitude shiftswere tested with nonparametric tests to avoid making potentiallyunwarranted assumptions about underlying distributions, using
Sundberg et al. • Attention and Latency in V4 J. Neurosci., November 7, 2012 • 32(45):16040 –16050 • 16041

Matlab (Wilcoxon signed rank test, signrank function, Mathworks).Correlation coefficients were calculated using Matlab (corrcoef func-tion, Mathworks).
Rate-matching procedure. For each neuron, we measured the baselinefiring rate with no stimulus within the receptive field in each attentioncondition and the stimulus-evoked response over a time period chosento cover the onset of the stimulus-evoked response for all neurons in thepopulation—a window that ranged from 40 ms (25 ms before the short-est latency observed for any cell) to 162 ms (25 ms longer than the longestobserved latency). We then equated baseline firing rates across attentionconditions by randomly deleting spikes from whichever attention con-dition had the higher baseline firing rate and equated stimulus-evokedresponses across attention conditions by, again, deleting spikes at ran-dom from whichever attention condition had the higher stimulus-evoked response. This was repeated at each level of luminance contrast.
ResultsFigure 1 illustrates recordings of the spiking responses of wellisolated neurons and the mean response of the neuronal popula-tion after normalizing each individual neuron’s response to thepeak response evoked in any condition. Each row corresponds tothe luminance contrast of the stimulus that fell within the recep-tive field, with contrast decreasing from top to bottom. Each ofthe three main columns is split into panels; the left shows theresponse over the initial 150 ms following stimulus onset, and theright zooms in on the initial phase of the response to aid in seeingthe change in latency. Attended responses are shown in red, un-attended in blue.
When attention was directed toward the stimulus in the re-ceptive field, the firing rate was modulated. In example unit 1, the
effect of attention on firing rate was modest. Example neuron 2exhibited a more robust attention-dependent increase in firingrate. We calculated response latencies using a metric adoptedfrom an earlier study examining the effect of attention on thelatencies of V4 neuronal responses (Lee et al., 2007). This metricestimates latency as the time at which the neuron’s firing ratereached the midpoint between its baseline firing rate and its peakresponse. It has the advantage of being relatively invariant tochanges in the magnitude or statistical reliability of neuronalresponses (Levick, 1973; Gawne et al., 1996; Lee et al., 2007). Thecalculated response latencies are indicated by dashed verticallines superimposed on the single-unit examples. Both exampleneurons showed reductions in latency with attention at most ofthe contrasts shown. The population average responses, on theright, show the trend across the population. Attention increasedthe magnitude of the response at the lower levels of luminancecontrast. There also appeared, by eye, to be a modest reduction inlatency with attention.
To quantify the effects of contrast and attention on latencyand response magnitude across the population of neurons, weapplied the same latency measure to every neuron in the popula-tion. The results are shown in Figures 2 (contrast) and 3 (atten-tion). We first show the effect of changes in contrast on responselatency and response amplitude to validate our metrics and toallow comparison to previous studies of contrast. For each neu-ron, we calculate the contrast-dependent change in latency (deltalatency) and a contrast-dependent amplitude difference index(see Materials and Methods), comparing across contrasts, with
Figure 1. Examples of single site spiking responses (one from each monkey) and the amplitude-normalized population average for the top four contrasts (right two columns). Each spike densityfunction is shown at two time scales (broad and zoomed in) arranged in parallel columns. Stimulus onset occurred at time 0. The blue line is the unattended condition; the red line is the attendedcondition. Vertical dashed lines in the zoomed panels for the examples indicate response latency. Amplitude is in spikes/s for the individual examples and normalized units for the population mean.At each level of contrast, attention caused a reduction in spiking response latency with attention in the single-unit examples and the population average response.
16042 • J. Neurosci., November 7, 2012 • 32(45):16040 –16050 Sundberg et al. • Attention and Latency in V4
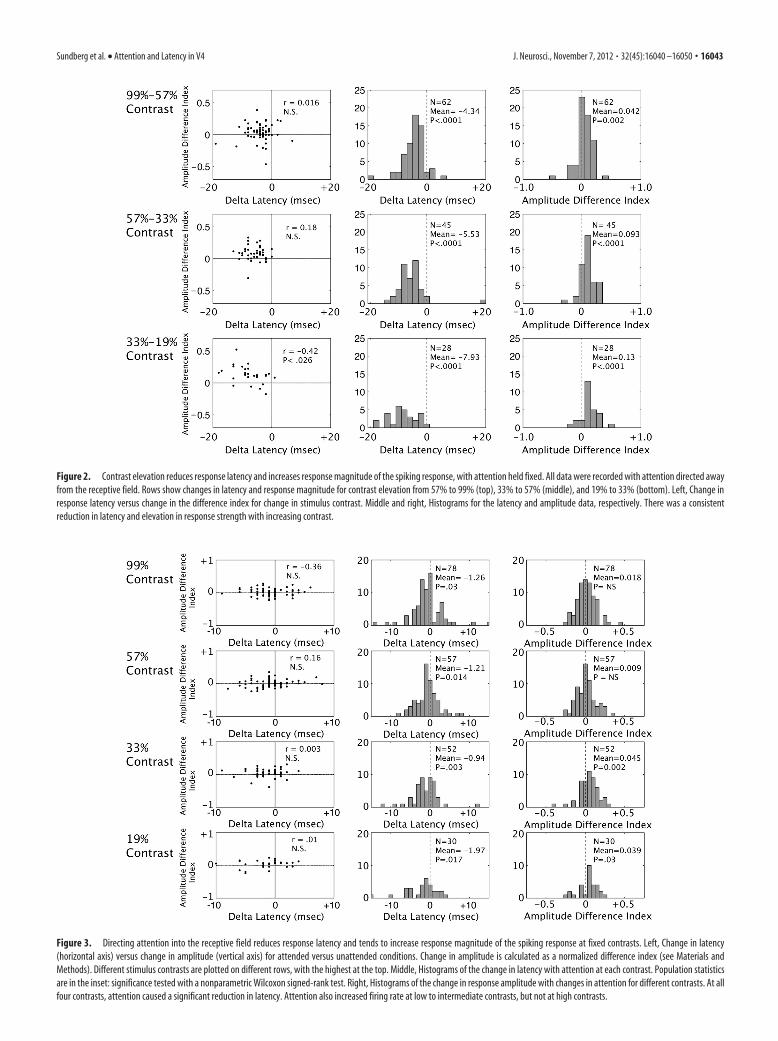
Figure 3. Directing attention into the receptive field reduces response latency and tends to increase response magnitude of the spiking response at fixed contrasts. Left, Change in latency(horizontal axis) versus change in amplitude (vertical axis) for attended versus unattended conditions. Change in amplitude is calculated as a normalized difference index (see Materials andMethods). Different stimulus contrasts are plotted on different rows, with the highest at the top. Middle, Histograms of the change in latency with attention at each contrast. Population statisticsare in the inset: significance tested with a nonparametric Wilcoxon signed-rank test. Right, Histograms of the change in response amplitude with changes in attention for different contrasts. At allfour contrasts, attention caused a significant reduction in latency. Attention also increased firing rate at low to intermediate contrasts, but not at high contrasts.
Figure 2. Contrast elevation reduces response latency and increases response magnitude of the spiking response, with attention held fixed. All data were recorded with attention directed awayfrom the receptive field. Rows show changes in latency and response magnitude for contrast elevation from 57% to 99% (top), 33% to 57% (middle), and 19% to 33% (bottom). Left, Change inresponse latency versus change in the difference index for change in stimulus contrast. Middle and right, Histograms for the latency and amplitude data, respectively. There was a consistentreduction in latency and elevation in response strength with increasing contrast.
Sundberg et al. • Attention and Latency in V4 J. Neurosci., November 7, 2012 • 32(45):16040 –16050 • 16043

attention directed away from the receptive field. These values areplotted in the scatter plots in the first column of Figure 2, witheach point corresponding to one neuron (latency difference onthe abscissa, amplitude index on the ordinate). We limited ouranalysis to neurons whose latencies could be accurately esti-mated. As described further in Materials and Methods, this wasassessed using a bootstrap procedure to determine the confidenceinterval of each latency estimate. Neurons were included only ifthe 95% bootstrap confidence interval was �30 ms at each of thetwo contrasts being compared. This resulted in smaller popula-tions of neurons being included at lower contrasts. The top panelillustrates the effect of increasing the contrast from 57% to 99%.Most points cluster in the upper left quadrant, indicating that anelevation in contrast results in a reduction in latency (negativedelta latencies) and an increase in response amplitude (positiveamplitude difference indices). These results are also shown in thehistograms in the middle column for latency (mean delta latency:�4.34 ms, p � 0.0001) and in the right column for amplitude(mean amplitude difference index: 0.042, p � 0.002). Significantreductions in latency and elevations in response amplitude areseen for the other two contrast increments: 33% to 57% contrastin the middle row and 19% to 33% contrast in the bottom row.
Having demonstrated the expected effect of contrast eleva-tions on latency and response amplitude, we conducted a similaranalysis to test for attention-dependent changes in latency andamplitude with attention (Fig. 3). For each neuron, we computedthe identical latency difference and amplitude difference index,but across attention conditions, at each contrast (see Materialsand Methods, above). As was done in comparing contrasts, welimited our analysis to neurons whose latencies could be accu-rately estimated. Neurons were included at each contrast only iftheir latencies could be estimated reliably in both attention con-ditions, according to the bootstrap test described above (see Ma-terials and Methods). These values are plotted in the scatter plotsin the first column of Figure 3, with each point corresponding toone neuron (latency difference on the abscissa, amplitude indexon the ordinate). The top panel illustrates the effect of directingattention to a 99% contrast stimulus. There is no significant cor-relation between the two measures. Points tend to fall to the left ofthe origin (negative attention-dependent delta latency), corre-sponding to attention-dependent reductions in latency, with noclear effect of attention on response amplitude. The distributionof effects of attention on latency can be seen clearly in the histo-grams in the middle column (mean delta latency: �1.26 ms,significantly less than zero, p � 0.03) and the lack of an effect onamplitude is shown in the right column (mean amplitude differ-ence index: 0.018, p � 0.28). The population showed a significantreduction in latency with attention at all four luminance con-trasts, with a range of �0.94 to �1.97 ms. Significant attention-dependent elevations in peak response amplitude were found forthe two lower contrast values (19% and 33% contrast) but werenot significant for the two higher contrast values (57% and 99%contrast).
To test whether these results depended critically on the selec-tion criterion, which excluded cells whose latency could not bereliably estimated, we repeated the above analyses using moreliberal criterion for inclusion. When the inclusion criterion wasrelaxed to include neurons if the 95% bootstrap confidence in-terval was �50 ms, the results did not change: significant laten-cies were still observed (p � 0.05). The motivation for excludingneurons whose latencies could not be reliably estimated was thatthat inclusion of unreliable neurons could potentially mask a trueattention-dependent reduction in latency. Consistent with this,
when we included unreliable cells, we no longer observed a sig-nificant reduction in latency. An earlier study that examinedwhether attention reduces response latency (Lee et al., 2007) re-stricted their analysis to neurons that exhibited at least a 10%increase in firing rate with attention. Imposing this criterion didnot alter our finding: we still found significant attention-dependent reductions in latency (p � 0.05).
One important question is whether the reduction in latency inthe population average could be a measurement artifact, resultingfrom the elevation in firing rate. This was unlikely, as attention-dependent reductions in latency were observed for neuronsshowing both increases and decreases in mean peak rate withattention. There was no correlation between the attention-dependent modulation of firing rate and latency, as would beexpected if our estimates of latency were biased by attention-dependent differences in peak response rate (Fig. 3, leftmost pan-els). Further, significant attention-dependent reductions inresponse latency were found at 99% and 57% contrast values eventhough significant elevations in peak response amplitude werenot observed at these contrasts (Fig. 3, top two panels, right col-umn). Prior studies have found latency estimates made using themetric used are insensitive to changes in response amplitude(Levick, 1973; Gawne et al., 1996; Lee et al., 2007). However, totest this directly, we repeated the latency analysis after matchingfiring rates across the two attention conditions for each neuron.This was accomplished by randomly removing spikes from thehigher firing rate condition until firing rates were equal acrossattention conditions (for details of the rate matching procedure,see Materials and Methods). If the latency reduction we see withattention were a measurement artifact stemming from attention-dependent changes in firing rate (either in the baseline responseor the stimulus-evoked response), then it would be expected todisappear after equating rates. As shown in Table 1, after equatingfor attention-dependent differences in firing rate, latencies werestill significantly reduced when attention was directed into theneuronal receptive field at all contrasts tested. Therefore, theattention-dependent reductions in latency we report are not anartifact of changes in firing rate.
These findings show that both attention and contrast eleva-tion reduce the response latencies of V4 neurons, which could betaken as suggesting that attention and contrast elevation bothinfluence a common set of mechanisms. To examine this further,we examined a measure that is complementary to spiking activity:the LFP. The LFP is thought to reflect subthreshold changes inpotential driven by synaptic activity within a local population ofneurons (Mitzdorf, 1985; Kamondi et al., 1998; Logothetis, 2002,2003; Buzsaki, 2006; Monosov et al., 2008). It is thus thought togive access to subthreshold signals before the emission of an ac-tion potential (Monosov et al., 2008). In the LFP, we find some
Table 1. Latency of the spiking response is reduced at each level of luminancecontrast before and after equating spike rates across attention conditions
Latency change
Latency change
Before rate match After rate match
99% contrast �1.26 ms ( p � 0.030) �2.19 ms ( p � 0.002)57% contrast �1.21 ms ( p � 0.014) �0.74 ms ( p � 0.019)33% contrast �0.94 ms ( p � 0.003) �0.87 ms ( p � 0.004)19% contrast �1.97 ms ( p � 0.017) �2.05 ms ( p � 0.004)
The left column shows the mean change in estimated spiking response latency when attention was directed into thereceptive field. In order to control for any bias in latency estimates due to attention-dependent changes in firing rate,latency estimates were repeated after randomly deleting spikes to equate firing rates across attention conditions(see Materials and Methods). After equating firing rates, latencies remained significantly reduced at all levels ofcontrast ( p � 0.05, right column).
16044 • J. Neurosci., November 7, 2012 • 32(45):16040 –16050 Sundberg et al. • Attention and Latency in V4

parallels, as well as qualitative differences between the effects ofattention and contrast elevation. Figure 4 is arranged the same asFigure 1, but shows the LFP responses for two recording sites (leftand middle columns) and across the population (right column)rather than spiking responses. Unlike spiking activity, which iscomposed of discrete spiking events, the local field potential is aninherently analog signal. The stimulus-evoked LFP is a complexwaveform with multiple peaks and troughs defining its full dy-namics. As a convenient way of quantifying the timing of the LFPresponse, we have, for the purpose of the present study, adoptedan operational definition of latency that is borrowed from ERPanalysis, in which latencies of ERP components are defined basedon the time of the peaks and troughs of the ERP waveform. Foreach recording, we computed two response latency estimates:time to first negative peak (restricted to a window 50 –100 mspoststimulus onset) and time to first positive peak (restricted to awindow 75–125 ms poststimulus onset). As with the spiking re-sponse, attention caused alterations in both the time course andmagnitude of the LFP signal. Attention caused the first negativedeflection of the LFP to peak and reverse earlier, leading to areduction in latency and a reduction in amplitude. For the firstpositive deflection, attention also caused an earlier peak (reduc-tion in latency) and an elevation in amplitude.
For the population of single units, we found that both eleva-tions of contrast and addition of attention lead to reductions inresponse latency and increases in response amplitude. Figure 5 isorganized to facilitate comparison of the effects of attention andcontrast on the latencies of the first negative and positive peaks of
the LFP response across LFP recordings. The histograms in theleft column of Figure 5 are all significantly shifted to the left ofzero, showing that attention reduces the time to the peak of thefirst negative LFP deflection at each of the four contrasts. Latencychanges ranged from �1.03 to �1.68 ms. The three histograms inthe second column of Figure 5 show changes in latency to the firstnegative peak with each contrast increment, with attention di-rected away from the receptive field. In each case, incrementingcontrast significantly reduced latency to peak. Latency reductionsranged from �4.02 to �6.2 ms. Similar results are found for theeffect of attention (third column) and contrast elevation (fourthcolumn) on the time to peak of the first positive LFP deflection.Attention and contrast both, therefore, lead to significant reduc-tions in the latency to the first positive and negative deflection ofthe LFP response, consistent with their effects on the latency ofthe spiking response.
While attention and contrast elevation had similar effects onthe latencies of spiking and LFP responses, they differed markedlyin their effects on the magnitude of the LFP response. Figure 6 isorganized in the same format as Figure 5 to facilitate this com-parison. The top histograms in the left column show the effect ofattention on the magnitude of the first negative deflection of theLFP. With the exception of measurements made at 19% contrast,attention significantly reduced the amplitude of the first negativeLFP deflection (19% contrast showed a small, nonsignificant re-duction in amplitude). The panels in the second column showchanges in the amplitude of the first negative peak resulting fromcontrast increases (with attention directed away from the recep-
Figure 4. Attention reduces latency to first negative and positive peak of the stimulus-locked LFP. Examples of single-site LFPs (one from each monkey; left two pairs of columns) and theamplitude-normalized population average for the top four contrasts (left pair of columns). Each LFP is shown at two time scales (broad and zoomed in on the negative deflection), arranged in parallelcolumns. Stimulus onset occurred at time 0. The blue line shows data recorded in the unattended condition, and the red line shows the attended condition. Vertical dashed lines in the zoomed panelsfor the examples indicate response latency. Amplitude is in volts for the individual examples, and normalized units for the population mean. There is a clear advance in LFP response latency in theattended condition at all four contrasts.
Sundberg et al. • Attention and Latency in V4 J. Neurosci., November 7, 2012 • 32(45):16040 –16050 • 16045

tive field). In each case, increases in contrast led to a significantincrease in the amplitude of the first negative LFP deflection. Thisdissociation between contrast and attention in the first deflectionof the LFP signal may provide important clues into the mecha-nisms underlying attention-dependent response modulations. Asimilar dissociation is not seen for the first positive deflection ofthe LFP. Both attention (third column) and contrast (fourth col-umn) show significant increases in the amplitude of the first pos-itive deflection of the LFP for most contrast values tested.
DiscussionSummaryThis study provides the first demonstration that attention re-duces the response latencies of visual cortical neurons. As in priorstudies (Celebrini et al., 1993; Carandini and Heeger, 1994;Albrecht, 1995; Gawne et al., 1996; Reynolds et al., 2000; Reich etal., 2001; Lee et al., 2007), we found a significant reduction ofresponse latency with elevations of luminance contrast. Theseattention-dependent and contrast-dependent reductions in la-tency were observed in both the spiking response and in thestimulus-locked LFP response. Although attention and contrastelevation both caused significant reductions in latency, they dif-fered in their effects on the magnitude of the LFP: increasingstimulus contrast increased the magnitude of the first LFP deflec-tion, whereas attention toward the stimulus decreased the firstLFP deflection.
Magnitude of the latency reductionThe population-mean shifts in latency with attention that weobserved are modest, but could still be functionally significant.
Millisecond-range differences in relative spike timing betweenneurons could be an important part of the neuronal code (Victor,1999; Oram et al., 2002; Guyonneau et al., 2004; VanRullen et al.,2005; Tiesinga et al., 2008; Di Lorenzo et al., 2009). Data fromhippocampal cortex, where it is possible to directly control theinputs to a neuron, show that small changes in input timing andrelative firing time can have powerful effects on hippocampalcomputation (Jarsky et al., 2005; Dekay et al., 2006; Klyachko andStevens, 2006; Kandaswamy et al., 2010). Given the parallels be-tween neocortical and hippocampal cortices (Shepherd, 2011), itwould be surprising if the hippocampal circuitry was sensitive tosmall changes in relative spike timing and the neocortical cir-cuitry was not, and there are studies showing similar sensitivity tosmall timing differences in the cerebral cortex (Gabernet et al.,2005).
Relationship to earlier studies that have not found attention-dependent reductions in the spiking response latencySeveral prior studies have failed to find reductions in the latencyof the spiking response with attention (Reynolds et al., 2000;Bisley et al., 2004; Cook and Maunsell, 2004; McAdams and Reid,2005; Lee et al., 2007). The study that most closely parallels thepresent study examined latency differences in the spiking re-sponses in macaque V4 using the same latency measure andfound no significant effects of attention (Lee et al., 2007). Ourstudy differed in some of the selection criteria used to determinewhich neurons to include for analysis. One difference is that weexcluded neurons for which the peak response was less than threetimes the baseline response. We found that this was necessary, inour dataset, because the latency metric we adopted from Lee et al.
Figure 5. Both attention and contrast elevation reduce latencies to peak of first and second LFP deflection. First column, Distribution of attention-dependent changes in latencies to the first LFPdeflection at each of the four contrasts tested. Second column, Changes in latency to peak of first LFP deflection, in attended away condition, with contrast elevation [elevation of contrast from 19%to 33% (bottom), 33% to 57% (middle), and 57% to 99% (top)]. Right two columns, Attention- and contrast-dependent reductions in latency to peak of second LFP deflection.
16046 • J. Neurosci., November 7, 2012 • 32(45):16040 –16050 Sundberg et al. • Attention and Latency in V4

(2007) often generated false positive responses for neurons withlow peak responses— giving latency estimates that were clearlyearlier than the response onset visible by eye. Lee and colleagues(2007) did not report this issue. The earlier study also excludedneurons if they did not show an attention-dependent increase infiring rate greater than 10%. In our main analysis, we includedneurons regardless of whether their firing rates were modulatedby attention, reasoning that attention-dependent changes in la-tency might be observed independently of whether attentionmodulated a given neuron’s firing rate. However, we also foundsignificant reductions in latency after applying the 10% thresholdused in the earlier study. Our study also differed from the earlierstudy in the treatment of neurons whose latencies could not reli-ably be estimated. With the exception of a regression analysiscomparing the effects of attention and contrast, the earlier studyincluded neurons for which reliable estimates of latency couldnot be obtained—neurons for which the 95% confidence inter-vals on estimated latency exceeded 50 ms. The application of thisexclusion criterion in their regression analysis resulted in theexclusion of 50% of the neurons in their sample, which wereincluded in other analyses, including the analysis where theyasked whether attention measurably reduced latency. Our moti-vation for excluding neurons whose latencies could not be reli-ably estimated was that that inclusion of unreliable neuronscould potentially mask a true attention-dependent reduction inlatency. Consistent with this, inclusion of neurons whose laten-cies could not reliably be estimated caused us to fail to detect this
difference. Therefore, a plausible explanation for the differentconclusions of the two studies is that, in the analysis that directlytested for a reduction in latency with attention, the prior studyincluded neurons whose latencies could not reliably bedetermined.
Relationship of the present results to earlier studies ofattention and variation in contrastEarlier studies have found parallels between the effects of spatialattention and contrast elevation. Luminance contrast can cause amultiplicative scaling of orientation tuning curves (Dean, 1981;Sclar and Freeman, 1982; Bradley et al., 1987). These findingshave motivated modeling studies, including Heeger (1992), whoshowed that contrast-dependent scaling of tuning curves couldbe accounted for by a normalization circuit in which elevation ofcontrast scaled excitation and divisive inhibition. Reynolds et al.(1999) proposed a related model in which attentional feedbackscaled excitation and divisive inhibition, leading to the predictionthat attention and contrast elevation should have similar effectson firing rates. This is consistent with the findings of McAdamsand Maunsell (1999), who found that directing spatial attentiontoward a stimulus caused a scaling of orientation tuning curvesand noted the parallel with contrast elevation. Studies in whichattention was directed to a stimulus varying in contrast (Reynoldset al., 2000; Williford and Maunsell, 2006) have led to the devel-opment of more refined normalization models of attention (Leeand Maunsell, 2009; Reynolds and Heeger, 2009).
Figure 6. Attention and contrast elevation differ in their effects on the magnitude of LFP deflections. First column, Distribution of attention-dependent changes in magnitude of the first LFPdeflection at each of the four contrasts tested. Except at the lowest contrast, attention caused a significant reduction in LFP magnitude. The second column shows the opposite effect: increases in themagnitude of the first LFP deflection, with elevation of contrast (attention directed away from the receptive field). Elevations of contrast are from 19% to 33% (bottom), 33% to 57% (middle), and57% to 99% (top). Right two columns, Attention- and contrast-dependent increases in magnitude of the second LFP deflection, with both attention (column 3) and contrast elevation (column 4).
Sundberg et al. • Attention and Latency in V4 J. Neurosci., November 7, 2012 • 32(45):16040 –16050 • 16047

The parallels between attention and contrast elevation extendto studies in which multiple stimuli appear in and around a neu-ron’s receptive field. For example, when two stimuli, one pre-ferred, the other nonpreferred, fall within a neuron’s classicalreceptive field, the nonpreferred stimulus can often reduce theresponse evoked by the preferred stimulus (Miller et al., 1993;Rolls and Tovee, 1995; Recanzone et al., 1997; Reynolds et al.,1999; Britten and Heuer, 1999; Heuer and Britten, 2002; but seeGawne and Martin, 2002). This observation led to the proposalthat attention and contrast both act to modulate the circuitry thatmediates competitive interactions among stimuli (Reynolds etal., 1999; Reynolds and Chelazzi, 2004; Lee and Maunsell, 2009;Reynolds and Heeger, 2009). Consistent with this proposal, ele-vating the contrast of the nonpreferred stimulus in the classicalreceptive field or directing attention to it can increase its capacityto suppress the response evoked by preferred stimulus appearingin the classical receptive field (Reynolds and Desimone, 2003). Asimilar parallel is observed for surround suppression in V4. Pre-senting a stimulus in the suppressive surround of a V4 neuronwill reduce the response evoked by a stimulus appearing withinthe center of the classical receptive field. Elevating the luminancecontrast of the center stimulus diminishes the magnitude of sup-pression, as does directing attention toward the center stimulus.Elevating the contrast of the surround stimulus or directing at-tention to it magnifies surround suppression (Sundberg et al.,2009).
Despite these striking parallels, contrast elevation and atten-tion are distinct in their effects on neuronal processing, and itwould be an oversimplification to equate the two. One obviousdifference is that contrast elevation activates contrast gain controlmechanisms at multiple stages of processing, including the retina(Shapley and Victor, 1978), which is not thought to be subject toattentional feedback. There are also, within V4, key differences inthe effects of attention and contrast elevation. Hudson et al.(2009) showed that they differ in their effects on adaptation, withattention counteracting reductions in gain that are produced bythe adaptation that occurs following increases in contrast. Differ-ences have also been reported in primary visual cortex. One studyin macaque primary visual cortex found additive effects of con-trast and attention (Thiele et al., 2009). Recent evidence impli-cating the cholinergic system in attentional modulation and gaincontrol in macaque V1 point to nicotinic and muscarinic mech-anisms that are expressed in distinct components of the corticalcircuit (Disney et al., 2007; Herrero et al., 2008). Together, thesestudies highlight the complexity of the underlying circuitry andsuggest that while attention and contrast elevation may both in-fluence a common set of mechanisms, the pathways by whichthey converge on these mechanisms and the neurons that makeup these pathways are likely to be somewhat distinct. Consistentwith this emerging picture, the present experiments find bothparallels and differences between the effects of attention and con-trast elevation. Both were found to cause reductions in responselatencies in spiking and LFP responses. Both caused increases inspike rate during the initial period of the response at lower con-trasts. However, the two had opposite effects on the magnitude ofthe initial LFP deflection following stimulus onset, indicatingdifferences in underlying mechanisms.
Here we consider how these findings may relate to one an-other. In the task, attention was either directed toward or awayfrom the receptive field, after which stimuli flashed within theneuronal receptive field. Attentional state was therefore set beforethe appearance of each flashed stimulus. One possible explana-tion for the observation that attention reduced response latency is
that it may have depolarized the neuron, placing it closer to spik-ing threshold. This would be expected to reduce the time requiredfor the neuron to reach spiking threshold upon arrival ofstimulus-evoked afferent input. Consistent with this proposal,intracellular recordings in the primary visual cortex of anesthe-tized cats have found reductions in the latency of spiking re-sponses and increases in response strength when cortical neuronsare in a depolarized state (Sanchez-Vives et al., 2000; Haider et al.,2007).
The contrast of each stimulus was randomized, so the partic-ular contrast of a given stimulus could, in principle, only have itsinfluence on latency after the stimulus appeared. Part of the ob-served contrast-dependent latency reduction is likely inheritedfrom earlier stages of processing, beginning in the retina. How-ever, there is evidence that response latencies become increas-ingly contrast-dependent going from early to later stages of visualprocessing (Perrett et al., 1992), suggesting that each stage con-tributes to latency increments as contrast is reduced, possiblyresulting from a slower drift toward response threshold at lowercontrasts. Higher contrast stimuli tend to produce responses withmore abrupt onset transients and higher peak firing rates(Gawne, 2008), which would naturally be expected to cause amore rapid depolarization and spike firing.
This hypothesis, in which elevation of contrast results in morerapid depolarization due in part to more abrupt afferent inputwhile attention sets the neuron in a more depolarized state beforethe arrival of afferent input, could also help to account for thecounterintuitive finding that the initial LFP deflection was re-duced in magnitude with attention. The LFP is thought to resultfrom each neuron’s integration of local synaptic activity (Mono-sov et al., 2008), which gives rise to return currents that are com-bined across multiple neurons to yield changes in theextracellular potential recorded across the electrode tip. Thesereturn currents are what give rise to the current sources and sinksthat are the basis, in current-source-density analysis, for estimat-ing the position of spiking neurons within a laminar circuit(Mehta et al., 2000; Ahrens et al., 2002; Swadlow et al., 2002). Anappearance of positive charge (a source) designates current that isflowing out of neurons into the extracellular space, correspond-ing to a net hyperpolarization of membrane potentials. Disap-pearance of positive charge (a sink) designates current that isflowing into neurons, corresponding to net depolarization ofmembrane potentials (Nicholson and Freeman, 1975). The rela-tionship between the local field potential and intracellular poten-tials can be seen in studies that have simultaneously recordedfield potentials and intracellular potentials and found that themagnitude of intracellular potential fluctuations are mirrored bydeflections of the field potential in the vicinity of the neuron(Frost, 1967; Okun et al., 2010). If directing attention to the lo-cation of a neuron’s receptive field places the neuron closer to itsresponse threshold, it would be expected to reduce the change indepolarization that the neuron undergoes as it moves towardresponse threshold. This reduction in the change in depolariza-tion might then be reflected in the reduced magnitude in the LFPwe observed with attention.
In conclusion, we have demonstrated that across a populationof V4 cortical neurons, there is a significant reduction in responselatency with selective attention. The magnitude of this shift issmaller than that observed when we approximately doubledstimulus contrast, but is still large enough to be of potential func-tional significance. Latency shifts with attention were also seen inthe LFP, but the effect of attention differed in its effects on themagnitude of the LFP response. These findings thus help us to
16048 • J. Neurosci., November 7, 2012 • 32(45):16040 –16050 Sundberg et al. • Attention and Latency in V4
dissociate the effects of attention and contrast elevation, and helpmotivate a simple model in which attention-dependent depolar-ization primes the target neuron to quickly detect a stimulus byplacing it near its response threshold.
ReferencesAhrens KF, Levine H, Suhl H, Kleinfeld D (2002) Spectral mixing of rhyth-
mic neuronal signals in sensory cortex. Proc Natl Acad Sci U S A 99:15176 –15181. CrossRef Medline
Albrecht DG (1995) Visual cortex neurons in monkey and cat: effect ofcontrast on the spatial and temporal phase transfer functions. Vis Neuro-sci 12:1191–1210. CrossRef Medline
Bisley JW, Krishna BS, Goldberg ME (2004) A rapid and precise on-response in posterior parietal cortex. J Neurosci 24:1833–1838. CrossRefMedline
Bradley A, Skottun BC, Ohzawa I, Sclar G, Freeman RD (1987) Visual ori-entation and spatial frequency discrimination: a comparison of singleneurons and behavior. J Neurophysiol 57:755–772. Medline
Britten KH, Heuer HW (1999) Spatial summation in the receptive fields ofMT neurons. J Neurosci 19:5074 –5084. Medline
Buzsaki G (2006) Rhythms of the brain. Oxford UP.Carandini M, Heeger DJ (1994) Summation and division by neurons in
primate visual cortex. Science 264:1333–1336. CrossRef MedlineCarandini M, Heeger DJ, Movshon JA (1997) Linearity and normali- zation
in simple cells of the macaque primary visual cortex. J Neurosci 17:8621–8644. Medline
Celebrini S, Thorpe S, Trotter Y, Imbert M (1993) Dynamics of orientationcoding in area V1 of the awake primate. Vis Neurosci 10:811– 825.CrossRef Medline
Cook EP, Maunsell JH (2004) Attentional modulation of motion integra-tion of individual neurons in the middle temporal visual area. J Neurosci24:7964 –7977. CrossRef Medline
Dekay JG, Chang TC, Mills N, Speed HE, Dobrunz LE (2006) Responses ofexcitatoryhippocampal synapses to natural stimulus patterns reveal a de-crease in short-term facilitation and increase in short-term depressionduring postnatal development. Hippocampus 16:66 –79. CrossRefMedline
Dean AF (1981) The relationship between response amplitude and contrastfor cat striate cortical neurones. J Physiol 318:413– 427. Medline
Di Lorenzo PM, Chen JY, Victor JD (2009) Quality time: representation of amultidimensional sensory domain through temporal coding. J Neurosci29:9227–9238. CrossRef Medline
Disney AA, Aoki C, Hawken MJ (2007) Gain modulation by nicotine inmacaque V1. Neuron 56:701–713. CrossRef Medline
Doty RW (1958) Potentials evoked in cat cerebral cortex by diffuse and bypunctiform photic stimuli. J Neurophysiol 21:437– 464. Medline
Ebersole JS, Kaplan BJ (1981) Intracortical evoked potentials of cats elicitedby punctate visual stimuli in receptive field peripheries. Brain Res 224:160 –164. Medline
Frost JD Jr (1967) An averaging technique for detection of EEG-intracellular potential relationships. Electroencephalogr Clin Neuro-physiol 23:179 –181. CrossRef Medline
Gabernet L, Jadhav SP, Feldman DE, Carandini M, Scanziani M (2005) So-matosensory integration controlled by dynamic thalamocortical feed-forward inhibition. Neuron 48:315–327. CrossRef Medline
Gawne TJ (2008) Stimulus selection via differential response latencies invisual cortical area V4. Neurosci Lett 435:198 –203. CrossRef Medline
Gawne TJ (2010) The local and non-local components of the local fieldpotential in awake primate visual cortex. J Comput Neurosci 29:615– 623.CrossRef Medline
Gawne TJ, Martin JM (2002) Responses of primate visual cortical V4 neu-rons to simultaneously presented stimuli. J Neurophysiol 88:1128 –1135.Medline
Gawne TJ, Kjaer TW, Richmond BJ (1996) Latency: another potential codefor feature binding in striate cortex. J Neurophysiol 76:1356 –1360.Medline
Guyonneau R, Vanrullen R, Thorpe SJ (2004) Temporal codes and sparserepresentations: a key to understanding rapid processing in the visualsystem. J Physiol Paris 98:487– 497. CrossRef Medline
Haider B, Duque A, Hasenstaub AR, Yu Y, McCormick DA (2007) En-hancement of visual responsiveness by spontaneous local network activityin vivo. J Neurophysiol 97:4186 – 4202. CrossRef Medline
Heuer HW, Britten KH (2002) Contrast dependence of response normal-ization in area MT of the rhesus macaque. J Neurophysiol 88:3398 –3408.CrossRef Medline
Heeger DJ (1992) Normalization of cell responses in cat striate cortex. VisNeurosci 9:181–197. CrossRef Medline
Herrero JL, Roberts MJ, Delicato LS, Gieselmann MA, Dayan P, Thiele A(2008) Acetylcholine contributes through muscarinic receptors to atten-tional modulation in V1. Nature 454:1110 –1114. CrossRef Medline
Hudson AE, Schiff ND, Victor JD, Purpura KP (2009) Attentional modula-tion of adaptation in V4. Eur J Neurosci 30:151–171. CrossRef Medline
Jarsky T, Roxin A, Kath WL, Spruston N (2005) Conditional dendritic spikepropagation following distal synaptic activation of hippocampal CA1 py-ramidal neurons. Nat Neurosci 8:1667–1676. CrossRef Medline
Kamondi A, Ascadi L, Wang XJ, Buszaki G (1998) Theta oscillations insomata and dendrites of hippocampal pyramidal cells in vivo: activity-dependent phase-precession of action potentials. Hippocampus8:244 –261. CrossRef Medline
Kandaswamy U, Deng PY, Stevens CF, Klyachko VA (2010) The role ofpresynapticdynamics in processing of natural spike trains in hippocampalslices. J Neurosci 30:15904 –15914. CrossRef Medline
Kasamatsu T, Mizobe K, Sutter EE (2005) Muscimol and baclofen differen-tially suppress retinotopic and nonretinotopic responses in visual cortex.Vis Neurosci 22:839 – 858. Medline
Khayat PS, Niebergall R, Martinez-Trujillo JC (2010) (2010) Attentiondifferentially modulates similar neuronal responses evoked by varyingcontrast and direction stimuli in area MT. J Neurosci 30:2188 –2197.CrossRef Medline
Kitano M, Niiyama K, Kasamatsu T, Sutter EE, Norcia AM (1994) Retino-topic and nonretinotopic field potentials in cat visual cortex. Vis Neurosci11:953–977. CrossRef Medline
Kitano M, Kasamatsu T, Norcia AM, Sutter EE (1995) Spatially distributedresponses induced by contrast reversal in cat visual cortex. Exp Brain Res104:279 –309. CrossRef Medline
Klyachko VA, Stevens CF (2006) Excitatory and feed-forward inhibitoryhippocampal synapses work synergistically as an adaptive filter of naturalspike trains. PLoS Biol 4:e207. Medline
Lee J, Maunsell JH (2009) A normalization model of attentional modulationof single unit responses. PLoS One 4:e4651. CrossRef
Lee J, Williford T, Maunsell JH (2007) Spatial attention and the latency ofneuronal responses in macaque area V4. J Neurosci 27:9632–9637.CrossRef Medline
Levick WR (1973) Variations in the response latency of cat retinal ganglioncells. Vision Res 13:837– 853. CrossRef Medline
Logothetis NK (2002) The neural basis of the blood-oxygen-level-dependent functional magnetic resonance signal. Philos Trans R SocLond B Biol Sci 357:1003–1037. CrossRef Medline
Logothetis NK (2003) The underpinnings of the bold functional magneticresonance imaging signal. J Neurosci 23:3963–3971. Medline
McAdams CJ, Maunsell JH (1999) Effects of attention on orientation-tuning functions of single neurons in macaque area V4. J Neurosci 19:431– 441. Medline
McAdams CJ, Reid RC (2005) Attention modulates the responses of simplecells in monkey primary visual cortex. J Neurosci 25:11023–11033.CrossRef Medline
Mehta MR, Quirk MC, Wilson MA (2000) Experience-dependent asym-metric shape of hippocampal receptive fields. Neuron 25:707–715.CrossRef Medline
Miller EK, Gochin PM, Gross CG (1993) Suppression of visual responses ofneurons in inferior temporal cortex of the awake macaque by addition ofa second stimulus. Brain Res 616:25–29. CrossRef Medline
Mitchell JF, Sundberg KA, Reynolds JH (2007) Differential attention-dependent response modulation across cell classes in macaque visual areaV4. Neuron 55:131–141. CrossRef Medline
Mitzdorf U (1985) Current-source density method and application in catcerebral cortex: investigation of evoked potentials and EEG phenomena.Physiol Rev 65:37–100. Medline
Monosov IE, Trageser JC, Thompson KG (2008) Measurements of simulta-neously recorded spiking activity and local field potentials suggest thatspatial selection emerges in the frontal eye field. Neuron 57:614 – 625.CrossRef Medline
Moran J, Desimone R (1985) Selective attention gates visual processing inthe extrastriate cortex. Science 229:782–784. CrossRef Medline
Sundberg et al. • Attention and Latency in V4 J. Neurosci., November 7, 2012 • 32(45):16040 –16050 • 16049

Mountcastle VB, Motter BC, Steinmetz MA, Sestokas AK (1987) Commonand differential effects of attentive fixation on the excitability of parietaland prestriate (V4) cortical visual neurons in the macaque monkey.J Neurosci 7:2239 –2255. Medline
Nicholson C, Freeman JA (1975) Theory of current source-density analysisand determination of conductivity tensor for anuran cerebellum. J Neu-rophysiol 38:356 –368. Medline
Okun M, Naim A, Lampl I (2010) The subthreshold relation between cor-tical local field potential and neuronal firing unveiled by intracellularrecording in awake rats. J Neurosci 30:4440 – 4448. CrossRef Medline
Oram MW, Xiao D, Dritschel B, Payne KR (2002) The temporal resolutionof neural codes: does response latency have a unique role? Philos Trans RSoc Lond B Biol Sci 357:987–1001. CrossRef Medline
Perrett DI, Hietanen JK, Oram MW, Benson PJ (1992) Organization andfunctions of cells responsive to faces in the temporal cortex. Philos TransR Soc Lond B Biol Sci 335:23–30. CrossRef Medline
Pouille F, Scanziani M (2001) Enforcement of temporal fidelity in pyrami-dal cells by somatic feed-forward inhibition. Science 293:1159 –1163.CrossRef Medline
Recanzone GH, Wurtz RH, Schwarz U (1997) Responses of MT and MSTneurons to one and two moving objects in the receptive field. J Neuro-physiol 78:2904 –2915. Medline
Reich DS, Mechler F, Victor JD (2001) Temporal coding of contrast in pri-mary visual cortex: when, what and why. J Neurophysiol 85:1039 –1050.Medline
Reynolds JH, Chelazzi L (2004) Attentional modulation of visual process-ing. Ann Rev Neurosci 27:611– 647. CrossRef Medline
Reynolds JH, Desimone R (2003) Interacting roles of attention and visualsalience in V4. Neuron 37:853– 863. CrossRef Medline
Reynolds JH, Heeger DJ (2009) The normalization model of attention. Neu-ron 61:168 –185. CrossRef Medline
Reynolds JH, Chelazzi L, Desimone R (1999) Competitive mechanisms sub-serve attention in macaque areas V2 and V4. J Neurosci 19:1736 –1753.Medline
Reynolds JH, Pasternak T, Desimone R (2000) Attention increases sensitiv-ity of V4 neurons. Neuron 26:703–714. CrossRef Medline
Roelfsema PR, Lamme VA, Spekreijse H (1998) Object-based attention inthe primary visual cortex of the macaque monkey. Nature 395:376 –381.CrossRef Medline
Rolls ET, Tovee MJ (1995) The responses of single neurons in the temporalvisual cortical areas of the macaque when more than one stimulus ispresent in the receptive field. Exp Brain Res 103:409 – 420. Medline
Sanchez-Vives MV, Nowak LG, McCormick DA (2000) Membrane mecha-nisms underlying contrast adaptation in Cat Area 17 in vivo. J Neurosci20:4267– 4285. Medline
Sclar G, Freeman RD (1982) Orientation selectivity in the cat’s striate cortexis invariant with stimulus contrast. Exp Brain Res 46:457– 461. CrossRefMedline
Shapley RM, Victor JD (1978) The effect of contrast on the transfer proper-ties of cat retinal ganglion cells. J Physiol 285:275–298. Medline
Shepherd GM (2011) The microcircuit concept applied to cortical evolu-tion: from three-layer to six-layer cortex. Front Neuroanat 5:30. CrossRefMedline
Spinks RL, Baker SN, Jackson A, Khaw PT, Lemon RN (2003) Problem ofdural scarring in recording from awake, behaving monkeys: a solutionusing 5-fluorouracil. J Neurophysiol 90:1324 –1332. CrossRef Medline
Spitzer H, Desimone R, Moran J (1988) Increased attention enhances bothbehavioral and neuronal performance. Science 240:338 –340. CrossRefMedline
Sundberg KA, Mitchell JF, Reynolds JH (2009) Spatial attention modulatescenter-surround interactions in macaque visual area v4. Neuron 61:952–963. CrossRef Medline
Swadlow HA (2003) Fast-spike interneurons and feedforward inhibition inawake sensory neocortex. Cereb Cortex 13:25–32. CrossRef Medline
Swadlow HA, Gusev AG, Bezdudnaya T (2002) Activation of a cortical col-umn by a thalamocortical impulse. J Neurosci 22:7766 –7773. Medline
Thiele A, Pooresmaeili A, Delicato LS, Herrero JL, Roelfsema PR (2009)Additive effects of attention and contrast in primary visual cortex. CerebCortex 19:2970 –2981. CrossRef Medline
Tiesinga P, Fellous JM, Sejnowski TJ (2008) Regulation of spike timing invisual cortical circuits. Nat Rev Neurosci 9:97–107. CrossRef Medline
Treue S, Martínez Trujillo JC (1999) Feature-based attention influencesmotion processing gain in macaque visual cortex. Nature 399:575–579.CrossRef Medline
VanRullen R, Guyonneau R, Thorpe SJ (2005) Spike times make sense.Trends Neurosci 28:1– 4. CrossRef Medline
Victor JD (1987) The dynamics of the cat retinal X cell centre. J Physiol386:219 –246. Medline
Victor JD (1999) Temporal aspects of neural coding in the retina and lateralgeniculate. Network 10:R1–R66. Medline
Williford T, Maunsell JH (2006) Effects of spatial attention on contrast re-sponse functions in macaque area V4. J Neurophysiol 96:40 –54. CrossRefMedline
16050 • J. Neurosci., November 7, 2012 • 32(45):16040 –16050 Sundberg et al. • Attention and Latency in V4