Behavioral Finance: An Analysis of the Performance of Behavioral Finance Funds
17
56 BEHAVIORAL FINANCE: AN ANALYSIS OF THE PERFORMANCE OF BEHAVIORAL FINANCE FUNDS FALL 2010 T raditional finance is based upon models in which agents operating within these models are rational. Rational means that agents update their beliefs consistent with Bayes’ law and, given the choice, make normatively acceptable choices consistent with subjective expected utility. Behavioral finance argues that agents are often not fully rational and analyzes the consequence of relaxing some of the assump- tions of individual rationality. Behavioral economists have turned to cognitive psychol- ogists to best understand how people’s beliefs and preferences affect asset prices (Barberis and Thaler [2002]). BACKGROUND LITERATURE Articles have shown that interactions between rational and irrational traders can lead to long and substantial impacts on asset pricing. Various observations have shown that there are limits to arbitrage, with poten- tial risks including the fundamental risk of a security, noise trader risk, and the imple- mentation costs for a trade. The theory of limited arbitrage shows that irrational traders cause deviations from fundamental value, and that rational traders are often powerless to correct these deviations. In addressing these deviations, behavioral models assume specific forms of irrationality or identify systematic biases that arise when people form beliefs and make decisions based upon their preferences. Prospect theory (Tversky and Kahnemann [1979, 1992]) helps address the findings when evaluating how investors evaluate risky gambles. Utility is defined over gains and losses rather than over final wealth positions and investors are focusing only on gains and losses. The value function is seen to reflect that people are risk averse over gains and risk seeking over losses. “Loss aversion” is also observed, as people show a greater sensitivity to losses than to gains. The theory also postulates a nonlinear probability transformation; people are also more sensitive to differences in probabilities at higher prob- ability levels. This is reflected in the fact that people place more emphasis on outcomes that are certain relative to those that are merely probable, the “certainty effect.” “Framing,” the way a choice is pre- sented, also plays a part in the decision- making process. Closely tied is the concept of “mental accounting” (Thaler [1999]), which suggests that people evaluate individual gambles as separate from overall wealth and their sum total of gambles. People are also seen to have an “ambiguity aversion,” which shows general dislike when confronted by the uncertainty of the probability distribu- tion of a gamble. Ambiguity aversion is based on the person’s familiarity and competence Behavioral Finance: An Analysis of the Performance of Behavioral Finance Funds ALESSANDRO SANTONI AND ARUN R. KELSHIKER ALESSANDRO SANTONI is the head of Strategic Planning, Research, and Investor Relations at Banca Monte Paschi, Italy, and a Ph.D. student at the University of Siena in Siena, Italy. [email protected] ARUN R. KELSHIKER, formerly a deputy chief executive officer and chief investment officer at Allianz Asset Manage- ment Russia, is an MBA student at the University of Chicago in Chicago, IL. [email protected] The Journal of Index Investing 2010.1.2:56-72. Downloaded from www.iijournals.com by PRINCETON UNIVERSITY on 09/20/13. It is illegal to make unauthorized copies of this article, forward to an unauthorized user or to post electronically without Publisher permission.
Transcript of Behavioral Finance: An Analysis of the Performance of Behavioral Finance Funds
56 BEHAVIORAL FINANCE: AN ANALYSIS OF THE PERFORMANCE OF BEHAVIORAL FINANCE FUNDS FALL 2010
Traditional finance is based upon models in which agents operating within these models are rational. Rational means that agents
update their beliefs consistent with Bayes’ law and, given the choice, make normatively acceptable choices consistent with subjective expected utility.
Behavioral f inance argues that agents are often not fully rational and analyzes the consequence of relaxing some of the assump-tions of individual rationality. Behavioral economists have turned to cognitive psychol-ogists to best understand how people’s beliefs and preferences affect asset prices (Barberis and Thaler [2002]).
BACKGROUND LITERATURE
Articles have shown that interactions between rational and irrational traders can lead to long and substantial impacts on asset pricing. Various observations have shown that there are limits to arbitrage, with poten-tial risks including the fundamental risk of a security, noise trader risk, and the imple-mentation costs for a trade. The theory of limited arbitrage shows that irrational traders cause deviations from fundamental value, and that rational traders are often powerless to correct these deviations. In addressing these deviations, behavioral models assume specif ic forms of irrationality or identify
systematic biases that arise when people form beliefs and make decisions based upon their preferences.
Prospect theor y (Tver sky and Kahnemann [1979, 1992]) helps address the f indings when evaluating how investors evaluate risky gambles. Utility is def ined over gains and losses rather than over final wealth positions and investors are focusing only on gains and losses. The value function is seen to ref lect that people are risk averse over gains and risk seeking over losses. “Loss aversion” is also observed, as people show a greater sensitivity to losses than to gains. The theory also postulates a nonlinear probability transformation; people are also more sensitive to differences in probabilities at higher prob-ability levels. This is ref lected in the fact that people place more emphasis on outcomes that are certain relative to those that are merely probable, the “certainty effect.”
“Framing,” the way a choice is pre-sented, also plays a part in the decision-making process. Closely tied is the concept of “mental accounting” (Thaler [1999]), which suggests that people evaluate individual gambles as separate from overall wealth and their sum total of gambles. People are also seen to have an “ambiguity aversion,” which shows general dislike when confronted by the uncertainty of the probability distribu-tion of a gamble. Ambiguity aversion is based on the person’s familiarity and competence
Behavioral Finance: An Analysis of the Performance of Behavioral Finance FundsALESSANDRO SANTONI AND ARUN R. KELSHIKER
ALESSANDRO SANTONI
is the head of Strategic Planning, Research, and Investor Relations at Banca Monte Paschi, Italy, anda Ph.D. student atthe University of Sienain Siena, [email protected]
ARUN R. KELSHIKER,formerly a deputy chief executive officer and chief investment officer at Allianz Asset Manage-ment Russia, is an MBA student at the University of Chicago in Chicago, [email protected]
JII-SANTONI.indd 56JII-SANTONI.indd 56 9/24/10 7:53:40 PM9/24/10 7:53:40 PM
The
Jou
rnal
of
Inde
x In
vest
ing
2010
.1.2
:56-
72. D
ownl
oade
d fr
om w
ww
.iijo
urna
ls.c
om b
y PR
INC
ET
ON
UN
IVE
RSI
TY
on
09/2
0/13
.It
is il
lega
l to
mak
e un
auth
oriz
ed c
opie
s of
this
art
icle
, for
war
d to
an
unau
thor
ized
use
r or
to p
ost e
lect
roni
cally
with
out P
ublis
her
perm
issi
on.

THE JOURNAL OF INDEX INVESTING 57FALL 2010
with the decision-making criteria (i.e., the less familiar, the greater the aversion from ambiguity and/or the pref-erence for the familiar).
To summarize, prospect theory hypothesizes that when choosing between gambles, people compute the gains and losses for each one and choose the one with the highest prospective utility. The prospective utility function includes loss aversion, the fact that people are more sensitive to losses than to gains, as well as “regret,” the pain felt upon the realization that we would have been better off if we had not taken a certain action in the past.
APPLICATION TO INVESTMENT PORTFOLIOS
When constructing portfolios, active invest-ment managers buy and sell securities based on their expectations about the future—typically expectations regarding the future earnings potential of companies and their associated risk characteristics. The final aim of this process is to maximize alpha defined as the differ-ence between a portfolio’s risk-adjusted return and the return for an appropriate benchmark portfolio. Using this definition, alpha is derived from a manager’s ability to form more accurate, and hence superior expectations, vis-à-vis market consensus. In short, maximizing alpha hinges on the ability to derive a superior understanding and working of the information set available to the market.
The traditional finance paradigm sees two poten-tial sources of alpha maximization:
1. The ability to utilize superior (private) information. Active investors could try to generate a better information set by increasing their knowledge with respect to a company or the industry in which the company operates.
2. Superior processing of information. Assuming that the vast majority of the information set is pub-licly available to all investors, the ability to beat the market could be derived by developing supe-rior procedures for processing this information. Quantitative portfolio managers would fall into this category.Advocates of behavioral finance introduced another
possible source of alpha creation.
3. Behavioral biases. Fund managers whose strategies claim that in certain circumstances investors do not try to maximize wealth and in other circum-stances investors exhibit systematic mental biases. Both of these cases can result in mispriced securi-ties. Both are also the result of behavioral biases. There are several anomalies studied in the lit-erature of behavioral f inance theory. Among the most relevant are the following: the January effect (De Bondt and Thaler [1987]), the Monday effect (French [1980]), the momentum effect (Grundy and Martin [2001]), the winner-loser effect, the post-earnings-announcement drift (George and Hwang [2004]) as well as several others. These anomalies offer an opportunity to earn abnormal returns for those who can benef it from their impacts on asset pricing.
In several interviews, Fuller and Thaler Asset Management (F&T),1 one of the few firms that promotes itself as being a leader in behavioral finance, explained its strategy to beat the market.
The key messages were as follows:
1. Analysts and Investors (A&I) are slow to recognize new information related to earnings surprises
2. A&I behave overconfidently with respect to their prior view
3. A&I underweight evidence that disconfirms their prior views and overweight evidence that confirms their views
4. A&I tend to interpret a permanent change as a temporary one
The two main biases at the heart of F&T’s strategy are “overconfidence” and “anchoring.” As such F&T claim that buying a stock soon after a major positive earnings surprise could potentially generate a significant pay back.
Efficient market theorists will point out that intel-ligent investors quickly take advantage of these mispric-ings, basically ensuring that these mispricings are at best small and temporary. Behaviorists counter this, claiming that mispricings often become worse before they get better, and that in particular, the learning process is a slow one.
A JPMorgan study [1998] showed that a consistent strategy of holding the cheapest stocks (defined as the
JII-SANTONI.indd 57JII-SANTONI.indd 57 9/24/10 7:53:40 PM9/24/10 7:53:40 PM
The
Jou
rnal
of
Inde
x In
vest
ing
2010
.1.2
:56-
72. D
ownl
oade
d fr
om w
ww
.iijo
urna
ls.c
om b
y PR
INC
ET
ON
UN
IVE
RSI
TY
on
09/2
0/13
.It
is il
lega
l to
mak
e un
auth
oriz
ed c
opie
s of
this
art
icle
, for
war
d to
an
unau
thor
ized
use
r or
to p
ost e
lect
roni
cally
with
out P
ublis
her
perm
issi
on.

58 BEHAVIORAL FINANCE: AN ANALYSIS OF THE PERFORMANCE OF BEHAVIORAL FINANCE FUNDS FALL 2010
bottom 10% of a universe of 3,000 stocks sorted on the price to sales ratio) at the beginning of each year and rebalancing the portfolio in equal proportions for a 1-year period produced an average annual return of 15.8% over a 55-year period ending in 2005. A strategy of buying the most expensive stocks using the same methodology produced an average annual return of only 2.8%. Likewise, buying the best performers over the previous year returned 15.2%, and buying the worst performers returned only 3.4%.
BRIEF HISTORY OF BEHAVIORAL FUNDS
The history of behavioral funds started in the early 1990s when JPMorgan, LSV Asset Management, and Fuller and Thaler started to sell funds managed with a “behavioral approach.” Among the pioneers in what it terms “Behavioral Investing,” the Asset Management unit at JPMorgan has been active since 1992, with its initial retail product offering in the United Kingdom. Andrew Spencer, the CIO for European equities at the time, developed the company’s first behavioral finance mutual fund in 1992; the fund, named Premier Equity Growth, was only offered in the United Kingdom. LSV Asset Management and Fuller and Thaler Asset Manage-ment also used a distinctive behavioral finance approach. Both were founded in the early 1990s. Fuller and Thaler funds were distributed by JPMorgan under their Undis-covered Managers brand. The Dreman funds, distributed by DWS Scudder, were the main retail competition in the United States. Later, in Europe, Bank Degrof and the Liechtenstein Bank LGT started distributing behavioral funds. In our research, we considered thirty-one funds that claim to apply behavioral finance in their portfolio strategy with total cumulative assets under management of $16 billion. In particular these funds are part of the Fuller & Thaler fund family, the JPMorgan AM funds, the Bank Degroff funds, LSV funds, Osiris funds, and LGT funds. We analyzed their performance from their inception until August 18, 2009. We define behavioral funds as those defined as behavioral in their names and/or in the description of the fund to clients.
Within our research, we categorize the most common heuristic-driven biases that mutual behavioral funds identify and attempt to exploit in order to out-perform fundamental and quantitative funds. We then track their performance and evaluate if they have been successful since their inception; in particular there is a
focus over the past five years over which the number of behavioral funds has reached a statistically signifi-cant number. The sample we considered is composed of thirty-one funds, of which 75% are large-cap funds and 25% are small cap/multi cap. Their respective styles are 42% value based, 13% growth, and 45% blend. The regional breakdown is 64% North America, 26% Europe, and 6% Asia and 4% developing markets.
POLICIES OF BEHAVIORAL FUNDS
In our analysis we found that mutual funds iden-tif ied as behavioral for current research purposes, do not construct their portfolios along the lines of classical behavioral funds theory; these theories include prospect theory portfolios, the SP/A-based behavioral portfolio theory, and behavioral portfolio theory. Instead, they implicitly accept that excess profits are possible if inef-ficiency is recognized and analyzed as investors behave irrationally at times and this behavior is often ref lected in the market price. Fuller and Thaler Asset Management (F&T) highlighted two main behavioral biases among investors. First, the winner-loser effect (Behavioral Value Fund), and second post-earnings-announcement drift (Behavioral Growth Fund). In particular, they focus on large earnings surprises as an important signal. The second stage of their strategy is to identify whether large earnings surprises are driven by company-specific factors. Another interesting characteristic of the F&T portfolio strategy is that they do not use any target price to identify a potential exit point while they adopt a stop loss mechanism. The idea behind this strategy is to avoid the prospect theory trap in which investors tend to sell too early on the upside and sell too late on the downside.
JPMorgan Behavioral Funds also identify insider buying as one of their main behavioral indicators. In their prospectus, they say: “We bought early into finan-cial names as a result of insider purchases, which can be an early indicator of a stock’s appreciation potential, and represent a key catalyst in the Fund’s strategy.” LSV AM managed by Lakonishok and two other academics that specialize in behavioral finance, namely, Andrei Shleifer (Harvard) and Robert Vishny (University of Chicago), highlighted that at the heart of their strategy is a simple dictum: “We search for companies that have had poor performance and have disappointed investors in the past.” Quoting Lakonishok: “But we also try not to
JII-SANTONI.indd 58JII-SANTONI.indd 58 9/24/10 7:53:40 PM9/24/10 7:53:40 PM
The
Jou
rnal
of
Inde
x In
vest
ing
2010
.1.2
:56-
72. D
ownl
oade
d fr
om w
ww
.iijo
urna
ls.c
om b
y PR
INC
ET
ON
UN
IVE
RSI
TY
on
09/2
0/13
.It
is il
lega
l to
mak
e un
auth
oriz
ed c
opie
s of
this
art
icle
, for
war
d to
an
unau
thor
ized
use
r or
to p
ost e
lect
roni
cally
with
out P
ublis
her
perm
issi
on.
THE JOURNAL OF INDEX INVESTING 59FALL 2010
fall into the value trap by buying a cheap company that becomes cheaper over time. So we look at all sorts of catalysts to see if the company is recovering and turning the corner.”
Previous research on this issue arrives at different but interesting conclusions. The first paper is “Behav-ioral Portfolios: Performance Measurement” by Rein-hart and Brennan [2003] and the second is “Behavioral Finance: Are the Disciples Profiting from the Doc-trine?” by Wright, Boney, and Banerjee [2006] that utilized the sample used by Reinhart (nine behavioral funds) adding seven more.
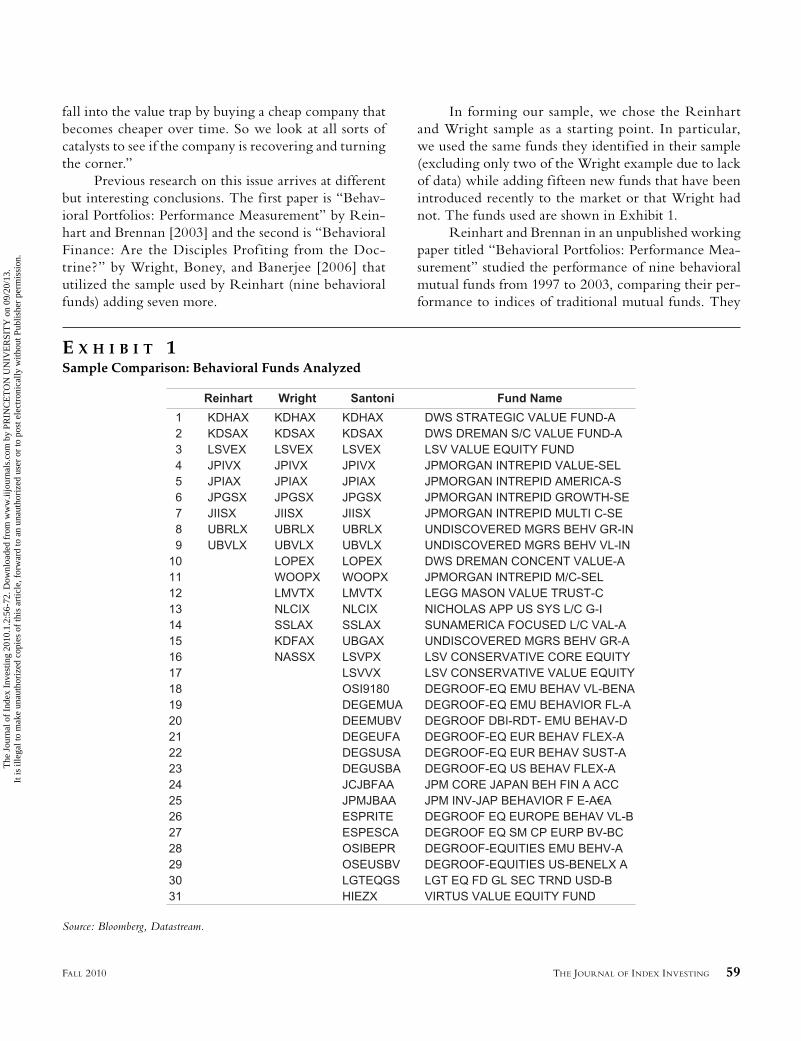
In forming our sample, we chose the Reinhart and Wright sample as a starting point. In particular, we used the same funds they identified in their sample (excluding only two of the Wright example due to lack of data) while adding fifteen new funds that have been introduced recently to the market or that Wright had not. The funds used are shown in Exhibit 1.
Reinhart and Brennan in an unpublished working paper titled “Behavioral Portfolios: Performance Mea-surement” studied the performance of nine behavioral mutual funds from 1997 to 2003, comparing their per-formance to indices of traditional mutual funds. They
E X H I B I T 1Sample Comparison: Behavioral Funds Analyzed
Source: Bloomberg, Datastream.
JII-SANTONI.indd 59JII-SANTONI.indd 59 9/24/10 7:53:40 PM9/24/10 7:53:40 PM
The
Jou
rnal
of
Inde
x In
vest
ing
2010
.1.2
:56-
72. D
ownl
oade
d fr
om w
ww
.iijo
urna
ls.c
om b
y PR
INC
ET
ON
UN
IVE
RSI
TY
on
09/2
0/13
.It
is il
lega
l to
mak
e un
auth
oriz
ed c
opie
s of
this
art
icle
, for
war
d to
an
unau
thor
ized
use
r or
to p
ost e
lect
roni
cally
with
out P
ublis
her
perm
issi
on.

60 BEHAVIORAL FINANCE: AN ANALYSIS OF THE PERFORMANCE OF BEHAVIORAL FINANCE FUNDS FALL 2010
examined aspects as alpha capture and the information ratio, along with risk-adjusted performance measure-ments. They found that behavioral funds earned a posi-tive premium over the market approximately 60.5% of the time even though behavioral funds were, as expected, inconsistent in beating the market. Moreover their results showed that behavioral funds performed better than mutual fund indices when accounting for risk.
Their other major finding was that “while it is dif-ficult to draw strong conclusions regarding behavioral techniques and management of portfolios the information available tends to support a f inding that recognizing behavioral inefficiencies can improve the performance of portfolios.” Moreover, as more mutual funds recognize the benefits of behavioral finance and employ behavioral methods to capitalize on irrational behavior over a longer period of time, firmer conclusions can be made.
One of the most interesting observations described in the Reinhart and Brennan report was that large-cap behavioral funds significantly outperformed small-cap, value, and growth funds for both relative indices.
Reinhart and Brennan found that large-cap behav-ioral funds performed significantly better than small-cap and value funds using the information ratio as the deter-minant of risk-adjusted performance. One conclusion that can be drawn according to Reinhart and Brennan is that “large-caps are the best security type to take advantage of behavioral factors. Large-cap companies are highly liquid, well known by many investors, followed in the media and therefore are highly vulnerable to the inf luences of irrational behavior.” However, we would point out that the conclusion was drawn comparing two large-cap value funds against only one small-cap value fund, as such, a very limited sample. Furthermore, Reinhart underlined in the report that “a comparison of small-cap to large-cap funds indicates mixed results.”
In the paper “Behavioral Finance: Are the Disciples Profiting from the Doctrine?” Wright, Boney, and Banerjee [2006] analyzed sixteen behavioral funds to determine whether they were successful in attracting investment as well as in earning abnormal returns. They found that:
• Mutual funds visibly espousing behavioral finance principles attract funds at a greater rate than both S&P 500 index funds and matched actively man-aged, non-behavioral funds.
• Based on raw returns, behavioral mutual funds generally beat both S&P 500 index funds and
(less significantly) their matched non-behavioral counterparts.
• Based on risk-adjusted returns, behavioral mutual funds neither signif icantly outperform nor underperform their matched non-behavioral counterparts.
• Behavioral mutual funds are essentially value funds, trading the aggregate risk of value stocks for their aggregate excess raw return. There is no evidence that these funds generate excess raw returns in other ways.
• Behavioral mutual funds exhibit no ability to time risk-return opportunities.
The conclusion is that while behavioral finance seems to be gaining greater acceptance among investors, there doesn’t seem to be any evidence to support the raison d’être for behavioral funds (i.e., anomalies that can be identified and capitalized upon on a consistent basis).
In Exhibit 2, we summarize the major topics analyzed by the three researchers (Reinhart, Wright, and Santoni) that have so far studied this issue. In all three studies, one major issue analyzed was the ability of behavioral funds to outperform market benchmarks. Results have been mixed, however, none of the pre-vious studies could claim that behavioral funds are consistently able to outperform their respective bench-marks. In the 2003 Reinhart paper, the major focus was also on risk-adjusted return and an evaluation and comparison among different styles. The analysis and conclusions drawn are somewhat unsubstantiated by us due to the limited sample. The Wright report does include an important qualitative aspect to the analysis,
E X H I B I T 2Major Topics Analyzed
JII-SANTONI.indd 60JII-SANTONI.indd 60 9/24/10 7:53:40 PM9/24/10 7:53:40 PM
The
Jou
rnal
of
Inde
x In
vest
ing
2010
.1.2
:56-
72. D
ownl
oade
d fr
om w
ww
.iijo
urna
ls.c
om b
y PR
INC
ET
ON
UN
IVE
RSI
TY
on
09/2
0/13
.It
is il
lega
l to
mak
e un
auth
oriz
ed c
opie
s of
this
art
icle
, for
war
d to
an
unau
thor
ized
use
r or
to p
ost e
lect
roni
cally
with
out P
ublis
her
perm
issi
on.

THE JOURNAL OF INDEX INVESTING 61FALL 2010
namely, the capacity of the behavioral funds to attract money inf lows, inferring the appetite on the part of the investor to include behavioral funds as a legitimate investment strategy for outperformance. In our report, we add several other qualitative aspects by investigating the behavior of these funds during bull and bear markets, the seasonality effect, and their consistency and their capacity to anticipate market reversals.
RESULTS AND MAJOR FINDINGS
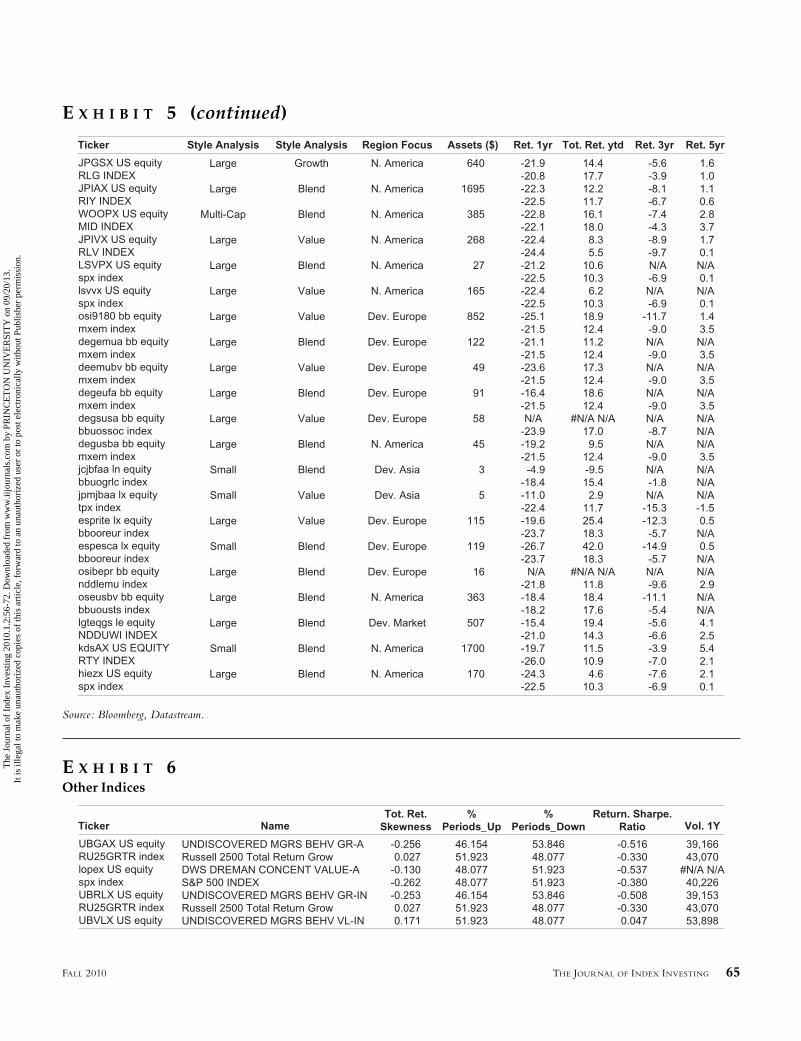
We found no clear evidence of outperformance of behavioral funds against their respective indices. Over a five-year horizon, only 47% of these funds beat their benchmarks. Over a shorter horizon (one year), a greater proportion of funds, namely, 57%, were able to outper-form their benchmarks. When examining the volatility of these funds, 60% of the funds analyzed reported a lower volatility versus their respective benchmarks; this meets our expectations, given that the majority of behavioral funds are invested in value/blend stocks.
Small-cap behavioral funds outperformed large-cap behavioral funds in particular during bear markets. Over the past three years, in which we have seen a bear market (2007–2009), 60% of small-cap funds managed to beat their benchmarks as compared with only 13% of large-cap funds. This finding is key as it is in sharp contradiction to the finding of Reinhart and Brennan [2003] that large-cap behavioral funds perform better than small-cap funds because “large-cap companies are highly liquid, well known by many investors, followed in the media and therefore are highly vulnerable to the inf luences of irrational behavior.” However, we would point out that the Reinhart conclusion was drawn com-paring two large-cap value funds versus one small-cap value fund, as such, a very limited sample. Moreover, Reinhart himself stated, “a comparison of small-cap to large cap funds indicates mixed results.”
Behavioral value funds performed better than the benchmark, in particular over a one-year horizon (2009) with 80% of funds outperforming the bench-mark. However, a longer time horizon of three years shows a dramatically different result, with 71% of funds underperforming the benchmark. As for growth funds, they performed poorly both against value funds and the benchmark over both shorter and longer time horizons.
Among behavioral funds, we found a very low correlation between fund diversification and its ability to beat the benchmark. Their average top ten holdings corresponded to 26% of the total weight of the port-folio. Within the sample, the range of top ten holdings as a percentage of the fund had a minimum of 11% and a maximum of 46%. We found that the correlation between diversification and outperformance versus the benchmark resulted in a low R square of 0.09, basically indicating a very low correlation. This finding is some-what counterintuitive within the constructs of classical finance, which advocates diversification in generating a market return.
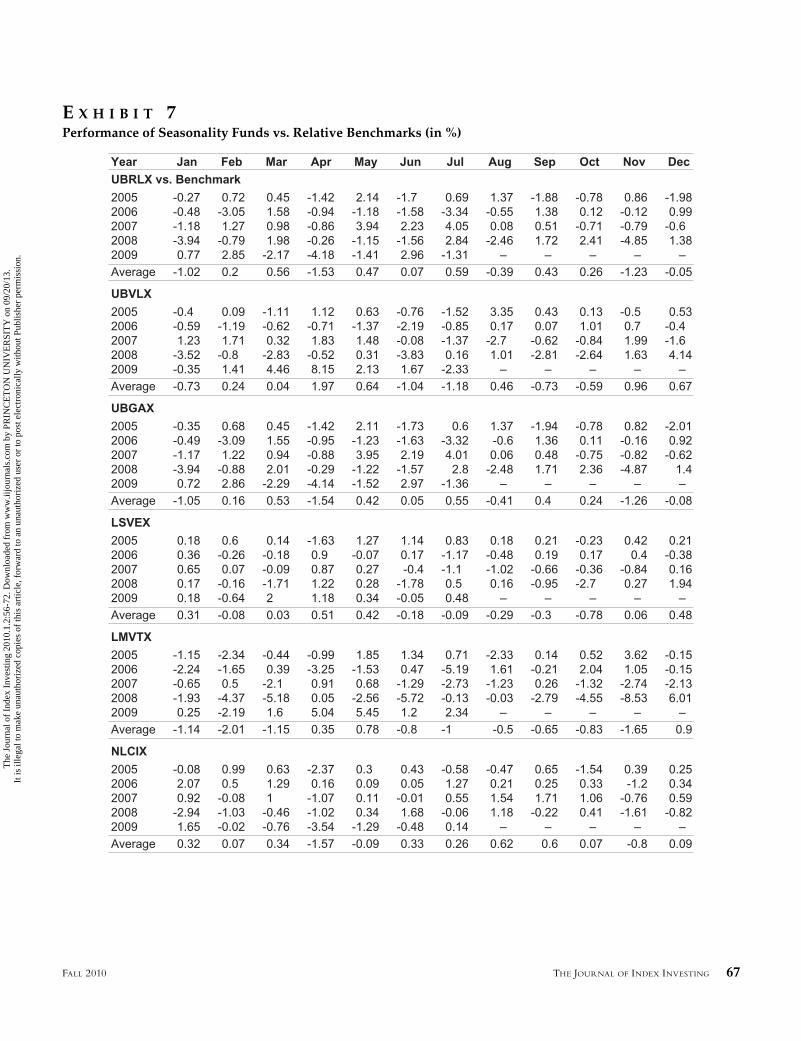
A seasonality effect was found and is clearly prev-alent when observing the performance of behavioral funds. First, over the past five years, during the month of May, 88% of funds show greater average cumulative per-formance than their benchmarks, and outperform. The percentages are 76% in December and 56% in January. Conversely, the months of August and October show the lowest proportion of funds beating the benchmark, 32% and 28%, respectively. Worth noting is the fact that in eight out of twelve months, on average, behav-ioral funds tend to underperform their benchmark. This finding is very interesting because it indirectly confirms the December effect, highlighted by Grinblatt and Keloharju [2001]. They observed that, in December, investors are more likely to sell extreme losers than they are during the rest of the year, and as such, identify a strong December bias that could be benefited upon by a behavioralist. Moreover, we confirmed the De Bondt and Thaler theory on the winner-loser effect being highly concentrated in the month of January. However, we believe the new “May effect” definitely warrants further research.
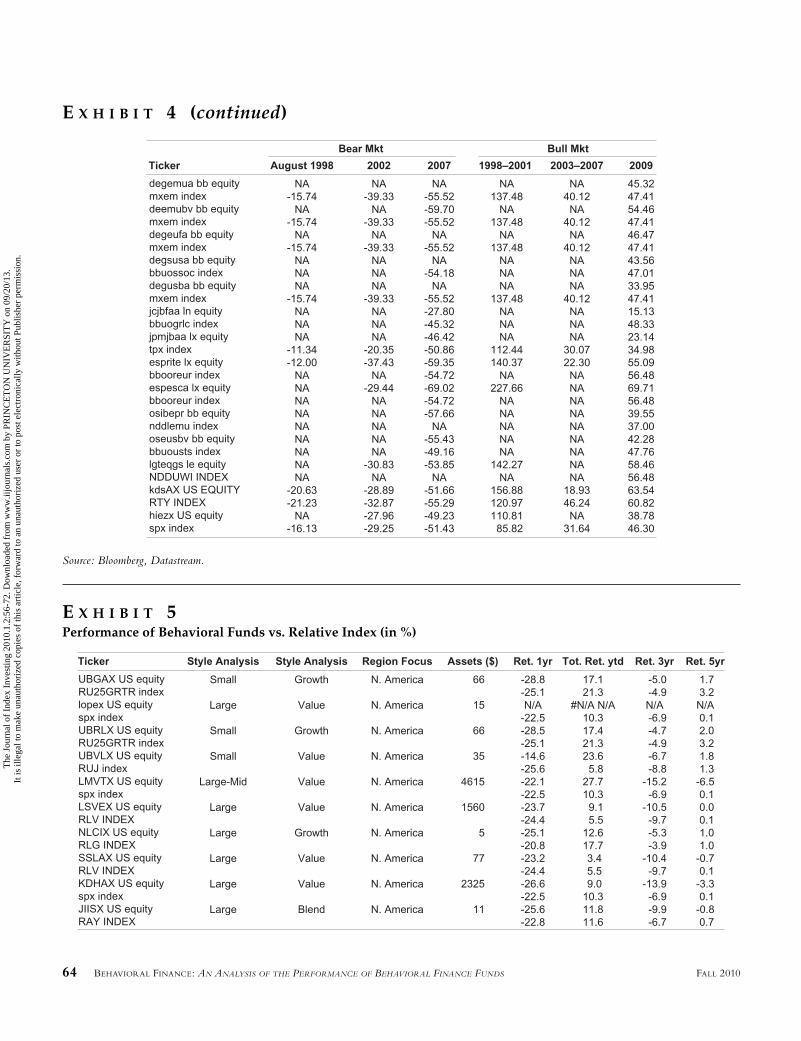
We analyzed the performance of behavioral funds during bear and bull cycles over the past twenty years. Our study looked at three negative cycles over the past twenty years: August 1998, with the Dow Jones collapsing 15%; the period April 2002 till October 2002 (–27%), and finally the period August 2007 till March 2009 (–47%). We found out that, on average, behavioral funds are not particularly good in beating the market during bear markets, as in two out of three cases the performance was poorer than their benchmark.
When looking at bull market periods, the fol-lowing results were observed. The f irst period was from September 1998 till May 2001, when the Dow
JII-SANTONI.indd 61JII-SANTONI.indd 61 9/24/10 7:53:40 PM9/24/10 7:53:40 PM
The
Jou
rnal
of
Inde
x In
vest
ing
2010
.1.2
:56-
72. D
ownl
oade
d fr
om w
ww
.iijo
urna
ls.c
om b
y PR
INC
ET
ON
UN
IVE
RSI
TY
on
09/2
0/13
.It
is il
lega
l to
mak
e un
auth
oriz
ed c
opie
s of
this
art
icle
, for
war
d to
an
unau
thor
ized
use
r or
to p
ost e
lect
roni
cally
with
out P
ublis
her
perm
issi
on.

62 BEHAVIORAL FINANCE: AN ANALYSIS OF THE PERFORMANCE OF BEHAVIORAL FINANCE FUNDS FALL 2010
Jones Industrial Index increased by 44%, then February 2003 to July 2007 (+69%), and finally February 2009 to August 2009 (+29%). In periods of bull markets, we found that behavioral funds perform better than in bear markets, with behavioral funds managing to beat the benchmark in a majority of the cases. This occurred in two out of the three periods observed. However, in sharp contrast to the previous two periods, during the last bull market period from February 2009 until August 2009, 59% of behavioral funds (our sample including all thirty-one funds) underperformed the benchmark, with a relative negative 8%. One possible explanation could be the entrance of “non” expert behavioral fund managers, considering the sample increased significantly from the second to the third analysis (from eleven to thirty-two funds analyzed).
In order to check the last hypothesis of our pre-vious point, we verified the consistency of performance of specific funds versus the benchmark in the three bull market periods. We found a very limited correlation with only one fund outperforming in all three periods and 30% of funds outperforming in two out of three periods. This infers that the entrance of non-expert behaviorist fund managers cannot be the rationale for our observation.
We also analyzed the capacity of behavioral funds to predict market reversal in the six cycles observed over the past twenty years. In our study, we concentrated on a short period (two months after a bear/bull trend start), attempting to verify the ability of behavioral funds to anticipate the reversal of the trend. We discovered that behavioral funds have the capacity in the first two months of a bear market (in 2002 and 2007) to behave better than during the entire bear market under consid-eration. Exactly the opposite is true during bull markets when behavioral funds need more time to anticipate the market reversal. Overall, we would conclude that the capacity of behavioral funds to anticipate market reversals is difficult to support. This is not particularly surprising considering that when studying the strategy of many of these funds, we found out that many of them follow momentum strategies, and as such by default, it is difficult for them to anticipate reversal.
At this stage of our research, we wanted to take a step further by analyzing the performance of one of the oldest, most highly respected and successful behavioral funds (the JPM Undiscovered Value Funds, UBVLX), managed by Fuller, one of the “gurus” of behavioral
finance. We compared the performance of the UBVLX versus its primary index (Russell 2000 Value IDX) and versus a “peer” fund that does not follow a behavioral strategy (another JPMorgan Fund JPMSX) managed by a fundamental style–driven fund manager, whose strategy focuses on bottom-up stock selection, and who con-structs portfolios based on company fundamentals.
The Fuller/JPM fund, UBVLX, is a good per-former over the time horizon with a total return of 58% from its inception in 1998 until March 2007.
In line with average behavioral funds, the funds of F&T report significant outperformance in a bull market (i.e., 2005–2007) and significant underperformance in a bear and highly volatile market.
The performance of UBVLX is not significantly different from its peer ( JPMSX) during the bear market period. The performance of UBVLX is negative during the period of high volatility, August 2007–March 2009, where the fund reported a negative total return of –50% versus –46% for its index (Russell 2500). Exhibit 3 shows the total return difference versus the Russell 2500 over the period August 2007 to March 2009. It also slightly outperformed JPMSX over the same period.
Valuation metrics show that the UBVLX fund invests in stocks that may be perceived to have distressed current valuations, which lend themselves to the percep-tion of asset mispricing. On average, the UBVLX invests in lower P/E and P/BV ratio stocks than the JPMSX. Also the turnover of UBVLX was lower than that of the JPMSX.
The asset allocation towards small-cap stocks of UBVLX increased significantly over time from 68% of total to 80.2%, while that of the JPMSX moved from 59% to 70.1%. This could support our f inding that during bear markets, small-cap behavioral funds out-perform large-cap behavioral funds. Importantly, the JPMSX significantly increased its liquidity over time (from 1% to 5%) while the UBVLX remained 100% committed to equities.
To summarize, we found no clear evidence of out-performance of behavioral funds against their respec-tive indices, although the majority of funds had lower volatility compared to their respective benchmarks. Small-cap behavioral funds generally outperformed large-cap behavioral funds, in particular during bear markets. Behavioral value funds outperformed the benchmark over a shorter horizon, however over a longer horizon underperformed their benchmark.
JII-SANTONI.indd 62JII-SANTONI.indd 62 9/24/10 7:53:40 PM9/24/10 7:53:40 PM
The
Jou
rnal
of
Inde
x In
vest
ing
2010
.1.2
:56-
72. D
ownl
oade
d fr
om w
ww
.iijo
urna
ls.c
om b
y PR
INC
ET
ON
UN
IVE
RSI
TY
on
09/2
0/13
.It
is il
lega
l to
mak
e un
auth
oriz
ed c
opie
s of
this
art
icle
, for
war
d to
an
unau
thor
ized
use
r or
to p
ost e
lect
roni
cally
with
out P
ublis
her
perm
issi
on.

THE JOURNAL OF INDEX INVESTING 63FALL 2010
E X H I B I T 3Total Return Difference (%), UBVLX vs. Russell 2500, August 2007 to March 2009
E X H I B I T 4Performance during Periods of Bear and Bull Markets (in %)
Source: Bloomberg, Datastream.
JII-SANTONI.indd 63JII-SANTONI.indd 63 9/24/10 7:53:40 PM9/24/10 7:53:40 PM
The
Jou
rnal
of
Inde
x In
vest
ing
2010
.1.2
:56-
72. D
ownl
oade
d fr
om w
ww
.iijo
urna
ls.c
om b
y PR
INC
ET
ON
UN
IVE
RSI
TY
on
09/2
0/13
.It
is il
lega
l to
mak
e un
auth
oriz
ed c
opie
s of
this
art
icle
, for
war
d to
an
unau
thor
ized
use
r or
to p
ost e
lect
roni
cally
with
out P
ublis
her
perm
issi
on.
64 BEHAVIORAL FINANCE: AN ANALYSIS OF THE PERFORMANCE OF BEHAVIORAL FINANCE FUNDS FALL 2010
E X H I B I T 4 (continued)
E X H I B I T 5Performance of Behavioral Funds vs. Relative Index (in %)
Source: Bloomberg, Datastream.
JII-SANTONI.indd 64JII-SANTONI.indd 64 9/24/10 7:53:43 PM9/24/10 7:53:43 PM
The
Jou
rnal
of
Inde
x In
vest
ing
2010
.1.2
:56-
72. D
ownl
oade
d fr
om w
ww
.iijo
urna
ls.c
om b
y PR
INC
ET
ON
UN
IVE
RSI
TY
on
09/2
0/13
.It
is il
lega
l to
mak
e un
auth
oriz
ed c
opie
s of
this
art
icle
, for
war
d to
an
unau
thor
ized
use
r or
to p
ost e
lect
roni
cally
with
out P
ublis
her
perm
issi
on.
THE JOURNAL OF INDEX INVESTING 65FALL 2010
E X H I B I T 5 (continued)
E X H I B I T 6Other Indices
Source: Bloomberg, Datastream.
JII-SANTONI.indd 65JII-SANTONI.indd 65 9/24/10 7:53:44 PM9/24/10 7:53:44 PM
The
Jou
rnal
of
Inde
x In
vest
ing
2010
.1.2
:56-
72. D
ownl
oade
d fr
om w
ww
.iijo
urna
ls.c
om b
y PR
INC
ET
ON
UN
IVE
RSI
TY
on
09/2
0/13
.It
is il
lega
l to
mak
e un
auth
oriz
ed c
opie
s of
this
art
icle
, for
war
d to
an
unau
thor
ized
use
r or
to p
ost e
lect
roni
cally
with
out P
ublis
her
perm
issi
on.

66 BEHAVIORAL FINANCE: AN ANALYSIS OF THE PERFORMANCE OF BEHAVIORAL FINANCE FUNDS FALL 2010
E X H I B I T 6 (continued)
Source: Bloomberg, Datastream.
JII-SANTONI.indd 66JII-SANTONI.indd 66 9/24/10 7:53:45 PM9/24/10 7:53:45 PM
The
Jou
rnal
of
Inde
x In
vest
ing
2010
.1.2
:56-
72. D
ownl
oade
d fr
om w
ww
.iijo
urna
ls.c
om b
y PR
INC
ET
ON
UN
IVE
RSI
TY
on
09/2
0/13
.It
is il
lega
l to
mak
e un
auth
oriz
ed c
opie
s of
this
art
icle
, for
war
d to
an
unau
thor
ized
use
r or
to p
ost e
lect
roni
cally
with
out P
ublis
her
perm
issi
on.
THE JOURNAL OF INDEX INVESTING 67FALL 2010
E X H I B I T 7Performance of Seasonality Funds vs. Relative Benchmarks (in %)
JII-SANTONI.indd 67JII-SANTONI.indd 67 9/24/10 7:53:45 PM9/24/10 7:53:45 PM
The
Jou
rnal
of
Inde
x In
vest
ing
2010
.1.2
:56-
72. D
ownl
oade
d fr
om w
ww
.iijo
urna
ls.c
om b
y PR
INC
ET
ON
UN
IVE
RSI
TY
on
09/2
0/13
.It
is il
lega
l to
mak
e un
auth
oriz
ed c
opie
s of
this
art
icle
, for
war
d to
an
unau
thor
ized
use
r or
to p
ost e
lect
roni
cally
with
out P
ublis
her
perm
issi
on.

68 BEHAVIORAL FINANCE: AN ANALYSIS OF THE PERFORMANCE OF BEHAVIORAL FINANCE FUNDS FALL 2010
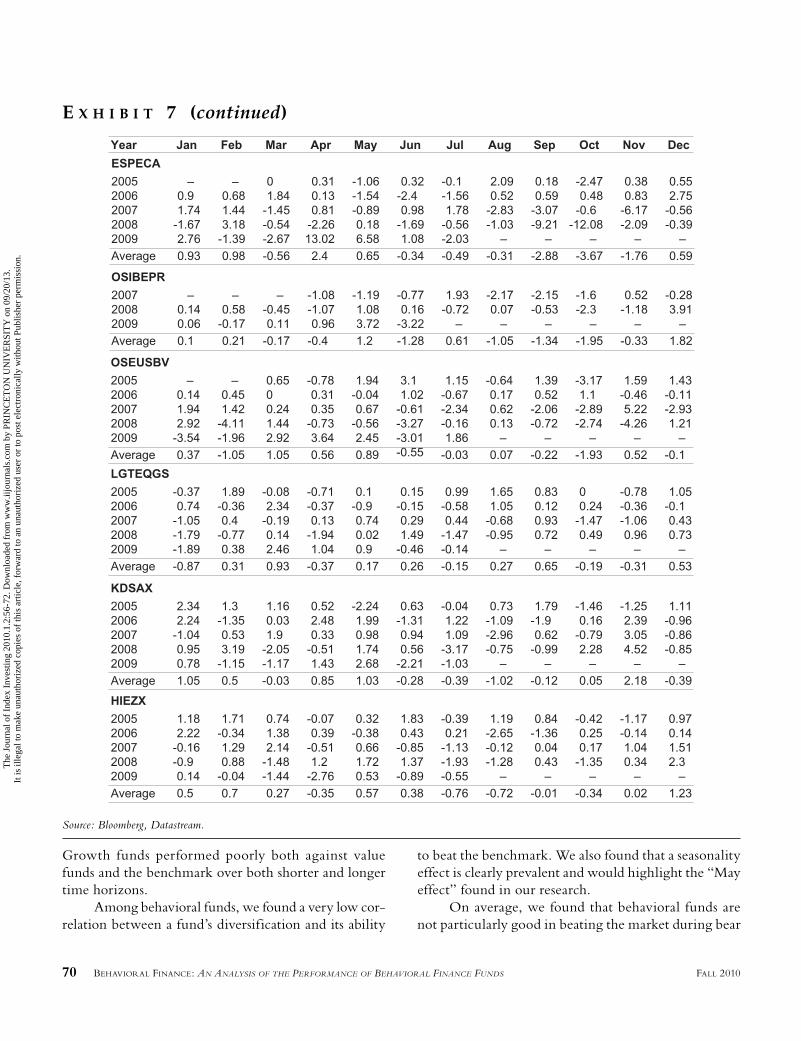
E X H I B I T 7 (continued)
JII-SANTONI.indd 68JII-SANTONI.indd 68 9/24/10 7:53:46 PM9/24/10 7:53:46 PM
The
Jou
rnal
of
Inde
x In
vest
ing
2010
.1.2
:56-
72. D
ownl
oade
d fr
om w
ww
.iijo
urna
ls.c
om b
y PR
INC
ET
ON
UN
IVE
RSI
TY
on
09/2
0/13
.It
is il
lega
l to
mak
e un
auth
oriz
ed c
opie
s of
this
art
icle
, for
war
d to
an
unau
thor
ized
use
r or
to p
ost e
lect
roni
cally
with
out P
ublis
her
perm
issi
on.

THE JOURNAL OF INDEX INVESTING 69FALL 2010
E X H I B I T 7 (continued)
JII-SANTONI.indd 69JII-SANTONI.indd 69 9/24/10 7:53:46 PM9/24/10 7:53:46 PM
The
Jou
rnal
of
Inde
x In
vest
ing
2010
.1.2
:56-
72. D
ownl
oade
d fr
om w
ww
.iijo
urna
ls.c
om b
y PR
INC
ET
ON
UN
IVE
RSI
TY
on
09/2
0/13
.It
is il
lega
l to
mak
e un
auth
oriz
ed c
opie
s of
this
art
icle
, for
war
d to
an
unau
thor
ized
use
r or
to p
ost e
lect
roni
cally
with
out P
ublis
her
perm
issi
on.
70 BEHAVIORAL FINANCE: AN ANALYSIS OF THE PERFORMANCE OF BEHAVIORAL FINANCE FUNDS FALL 2010
Growth funds performed poorly both against value funds and the benchmark over both shorter and longer time horizons.
Among behavioral funds, we found a very low cor-relation between a fund’s diversification and its ability
to beat the benchmark. We also found that a seasonality effect is clearly prevalent and would highlight the “May effect” found in our research.
On average, we found that behavioral funds are not particularly good in beating the market during bear
E X H I B I T 7 (continued)
Source: Bloomberg, Datastream.
JII-SANTONI.indd 70JII-SANTONI.indd 70 9/24/10 7:53:46 PM9/24/10 7:53:46 PM
The
Jou
rnal
of
Inde
x In
vest
ing
2010
.1.2
:56-
72. D
ownl
oade
d fr
om w
ww
.iijo
urna
ls.c
om b
y PR
INC
ET
ON
UN
IVE
RSI
TY
on
09/2
0/13
.It
is il
lega
l to
mak
e un
auth
oriz
ed c
opie
s of
this
art
icle
, for
war
d to
an
unau
thor
ized
use
r or
to p
ost e
lect
roni
cally
with
out P
ublis
her
perm
issi
on.

THE JOURNAL OF INDEX INVESTING 71FALL 2010
markets. In periods of bull markets, behavioral funds perform better than in bear markets, managing to beat the benchmark in the majority of periods researched. We also conclude that the capacity of behavioral funds to anticipate market reversals is difficult to support.
CONCLUSION
In recent years more and more mutual funds are starting to market themselves as behavioral funds and are seeking to profit from these types of market/behavioral anomalies. In our analysis, we have tried to answer a few questions that arise when evaluating behavioral mutual funds. Investigation into their investment style is among the most important questions to answer. After inter-viewing many portfolio managers/analysts managing behavioral funds and after having read through pub-licly available documents (mainly prospectus and inter-views in the press), we can conclude that it is extremely challenging to find a genuine behavioral fund applying behavioral portfolio theory in reality. Instead, they implicitly accept that excess profits are possible if an inefficiency is recognized and analyzed properly because investors behave irrationally at times and this behavior can be ref lected in the market price. The most common inefficiencies, which benefit the behavioral fund man-ager, are the winner-loser effect, the trend momentum effect, the post-earnings effect, and insider dealing as an information signal.
The analysis is also involved with challenging the main precepts of behavioral funds. Among the major negative results we found was the difficulty in clearly showing the capacity of these funds to consistently beat the benchmark and to predict market reversal. More-over, during periods of a bear market, these funds tend to underperform the benchmark. On the positive side, is the capacity of these funds to exploit some of the most common behavioral biases, such as the December and January effects, as well as their lower volatility versus the benchmark. During periods of bull markets, these funds tend to outperform the benchmark. In closing, when analyzing one of the oldest and best known behavioral funds, the JPM Undiscovered Value Funds, UBVLX, managed by F&T, we were able to confirm many of the f indings as shown by our sample of thirty-one behavioral funds with over $16 billion of assets under management.
ENDNOTE
1“How Thinking Costs You.” Behavioral Economics Shows That When It Comes to Investing, People Aren’t That Smart. Washington Post, May 25, 2008.
REFERENCES
Baker, M., and S. Aldo. “Behavioral Finance at JPMorgan.” Working Paper, Harvard University, 2007.
Barberis, N., and R.H. Thaler. “A Survey of Behavioral Finance.” NBER Working Paper No. 9222, September 2002.
Bogle, J. “The Implications of Style Analysis for Mutual Fund Performance Evaluation.” The Journal of Portfolio Management, Summer 1998, pp. 34-42.
Camerer, C.F. Behavioral Game Theory: Experiments in Strategic Interaction. New York, NY: Princeton University Press, 2003.
Camerer, C.F., and G. Loewenstein. “Behavioral Economics: Past, Present, and Future.” In Advances in Behavioral Economics edited by C. Camerer, G. Loewenstein, and M. Rabin. New York, NY: Princeton University Press, 2003.
Carhart, M.M. “On Persistence in Mutual Fund Perfor-mance.” Journal of Finance, 52 (1997), pp. 57-82.
Cornell, B. “Valuing Intel: A Strange Tale of Analysts and Announcements.” Working Paper, November 2000.
Coval, J.D., and T. Shumway, “Do Behavioral Biases Affect Prices?” Working Paper, University of Michigan, 2001.
Davis, D.D., and C.A. Holt. Experimental Economics. New York, NY: Princeton University Press, 1993.
De Bondt, W.F.M., and R.H. Thaler. “Does the Stock Market Overreact?” Journal of Finance, 40 ( July 1985), pp. 793-805.
——. “Further Evidence on Investor Overreaction and Stock Market Seasonality.” Journal of Finance, 42 ( July 1987), pp. 557-581.
——. “A Mean-Reverting Walk Down Wall Street.” Journal of Economic Perspectives, Vol. 3, No. 1 (1989), pp. 189-202.
Eun, C.S., R. Kolodry, and B.G. Resnick. “U.S.-based Inter-national Mutual Funds: A Performance Evaluation.” The Journal of Portfolio Management, Spring 1991, pp. 88-94.
JII-SANTONI.indd 71JII-SANTONI.indd 71 9/24/10 7:53:47 PM9/24/10 7:53:47 PM
The
Jou
rnal
of
Inde
x In
vest
ing
2010
.1.2
:56-
72. D
ownl
oade
d fr
om w
ww
.iijo
urna
ls.c
om b
y PR
INC
ET
ON
UN
IVE
RSI
TY
on
09/2
0/13
.It
is il
lega
l to
mak
e un
auth
oriz
ed c
opie
s of
this
art
icle
, for
war
d to
an
unau
thor
ized
use
r or
to p
ost e
lect
roni
cally
with
out P
ublis
her
perm
issi
on.

72 BEHAVIORAL FINANCE: AN ANALYSIS OF THE PERFORMANCE OF BEHAVIORAL FINANCE FUNDS FALL 2010
French, Kenneth R. “Stock Returns and the Weekend Effect.” Journal of Financial Economics, 8 (1980), pp. 55-69.
George, T., and C.Y. Hwang. “The 52-Week High and Momentum Investing.” Journal of Finance, 59 (2004), pp. 2145-2176.
Grundy, B.F., and S.R. Martin. “Understanding the Nature of the Risks and the Source of the Rewards to Momentum Investing.” Review of Financial Studies, 14 (2001), pp. 29-79.
Kahneman, D., and A. Tversky. “Prospect Theory: An Analysis of Decision Under Risk.” Econometrica, 47 (1979), pp. 263-291.
——. “Advances in Prospect Theory: Cumulative Represen-tation of Uncertainty.” Journal of Risk and Uncertainty, Vol. 5, No. 4 (October 1992), pp. 297-323.
Innocenti, A. Cognitive Economics: An Introduction. Labsi Experimental Economics Laboratory. University of Siena.
JPMorgan Asset Management Calculation, based on James O’Shaughnessy’s What Works on Wall Street. New York, NY: McGraw-Hill, 1998. Data cover the period 1951–2005.
Lamont, O.A., and R.H. Thaler. “Can the Market Add or Subtract? Mispricing in Tech Stock Carve-Outs.” NBER Working Paper 8302, May 2001.
Odean, T. “Are Investors Reluctant to Realize Their Losses?” Journal of Finance, Vol. 53, No. 5 (October 1998), pp. 1775-1798.
Reinhart, W.J., and M. Brennan. “Behavioral Portfolios: Per-formance Measurement.” Working Paper, Loyola College, 2005.
Shefrin, H., and M. Statman. “Behavioral Portfolio Theory.” Journal of Financial and Quantitative Analysis ( June 2000), pp. 127-151.
Thaler, R.H., ed. Advances in Behavioral Finance, Vol. 2. New York, NY: Russell Sage, 2005.
——. “Mental Accounting Matters.” Journal of Behavioral Deci-sion Making, Vol. 12, No. 3 (1999), p. 183.
——. The Winner’s Curse. Paradoxes and Anomalies of Economic Life. New York, NY: Princeton University, 1992.
Wright, C., P. Banerjee, and V. Boney. “Behavioral Finance: Are the Disciples Profiting from the Doctrine?” The Journal of Investing, Winter 2006, pp. 82-90.
To order reprints of this article, please contact Dewey Palmieri at [email protected] or 212-224-3675.
JII-SANTONI.indd 72JII-SANTONI.indd 72 9/24/10 7:53:47 PM9/24/10 7:53:47 PM
The
Jou
rnal
of
Inde
x In
vest
ing
2010
.1.2
:56-
72. D
ownl
oade
d fr
om w
ww
.iijo
urna
ls.c
om b
y PR
INC
ET
ON
UN
IVE
RSI
TY
on
09/2
0/13
.It
is il
lega
l to
mak
e un
auth
oriz
ed c
opie
s of
this
art
icle
, for
war
d to
an
unau
thor
ized
use
r or
to p
ost e
lect
roni
cally
with
out P
ublis
her
perm
issi
on.