Behavior of underground strutted retaining structure under ...
24
Earthquakes and Structures, Vol. 8, No. 5 (2015) 1147-1170 DOI: http://dx.doi.org/10.12989/eas.2015.8.5.1147 1147 Copyright © 2015 Techno-Press, Ltd. http://www.techno-press.org/journals/eas&subpage=7 ISSN: 2092-7614 (Print), 2092-7622 (Online) Behavior of underground strutted retaining structure under seismic condition Subha Sankar Chowdhury a , Kousik Deb and Aniruddha Sengupta b Department of Civil Engineering, Indian Institute of Technology Kharagpur, Kharagpur–721302, India (Received August 12, 2014, Revised September 24, 2014, Accepted September 26, 2014) Abstract. In this paper, the behavior of underground strutted retaining structure under seismic condition in non-liquefiable dry cohesionless soil is analyzed numerically. The numerical model is validated against the published results obtained from a study on embedded cantilever retaining wall under seismic condition. The validated model is used to investigate the difference between the static and seismic response of the structure in terms of four design parameters, e.g., support member or strut force, wall moment, lateral wall deflection and ground surface displacement. It is found that among the different design parameters, the one which is mostly affected by the earthquake force is wall deflection and the least affected is the strut force. To get the best possible results under seismic condition, the embedment depth of the wall and thickness of the wall can be chosen as around 100% and 6% of the depth of final excavation level, respectively. The stiffness of the strut may also be chosen as 5× 10 5 kN/m/m to achieve best possible performance under seismic condition. Keywords: diaphragm wall; strutted excavation; FLAC; sand; earthquake 1. Introduction The behavior of permanent underground retaining structures such as underground basement or metro station is usually studied under static condition only. However, if these are constructed in areas which are prone to earthquakes, then seismic forces may affect their behavior significantly. The effect of earthquake may become detrimental and cause collapse of the entire retaining system due to failure of wall and support system when excessive load and moment come in the struts and wall due to the dynamic earth pressure behind the retaining wall. Moreover, the ground surface adjacent to the retaining wall may also settle or heave beyond permissible limit under seismic condition creating severe instability of the adjacent structures. A number of analyses on underground retaining structures have been done under static condition either using finite element methods (Finno and Harahap 1991, Finno et al. 1991, Day and Potts 1993, His and Small 1993, Bose and Som 1998, Ng et al. 1998, Carruba and Colonna 2000, Karlsrud and Andresen 2005, Zdravkovic et al. 2005, Costa et al. 2007, Yoo and Lee 2008, Hsiung 2009, Ou and Corresponding author, Ph.D., Associate Professor, E-mail: [email protected] a E-mail: [email protected] b Professor, E-mail: [email protected]
Transcript of Behavior of underground strutted retaining structure under ...

Earthquakes and Structures, Vol. 8, No. 5 (2015) 1147-1170
DOI: http://dx.doi.org/10.12989/eas.2015.8.5.1147 1147
Copyright © 2015 Techno-Press, Ltd.
http://www.techno-press.org/journals/eas&subpage=7 ISSN: 2092-7614 (Print), 2092-7622 (Online)
Behavior of underground strutted retaining structure under seismic condition
Subha Sankar Chowdhurya, Kousik Deb and Aniruddha Senguptab
Department of Civil Engineering, Indian Institute of Technology Kharagpur, Kharagpur–721302, India
(Received August 12, 2014, Revised September 24, 2014, Accepted September 26, 2014)
Abstract. In this paper, the behavior of underground strutted retaining structure under seismic condition in
non-liquefiable dry cohesionless soil is analyzed numerically. The numerical model is validated against the
published results obtained from a study on embedded cantilever retaining wall under seismic condition. The
validated model is used to investigate the difference between the static and seismic response of the structure
in terms of four design parameters, e.g., support member or strut force, wall moment, lateral wall deflection
and ground surface displacement. It is found that among the different design parameters, the one which is
mostly affected by the earthquake force is wall deflection and the least affected is the strut force. To get the
best possible results under seismic condition, the embedment depth of the wall and thickness of the wall can
be chosen as around 100% and 6% of the depth of final excavation level, respectively. The stiffness of the
strut may also be chosen as 5×10⁵ kN/m/m to achieve best possible performance under seismic condition.
Keywords: diaphragm wall; strutted excavation; FLAC; sand; earthquake
1. Introduction
The behavior of permanent underground retaining structures such as underground basement or
metro station is usually studied under static condition only. However, if these are constructed in
areas which are prone to earthquakes, then seismic forces may affect their behavior significantly.
The effect of earthquake may become detrimental and cause collapse of the entire retaining system
due to failure of wall and support system when excessive load and moment come in the struts and
wall due to the dynamic earth pressure behind the retaining wall. Moreover, the ground surface
adjacent to the retaining wall may also settle or heave beyond permissible limit under seismic
condition creating severe instability of the adjacent structures.
A number of analyses on underground retaining structures have been done under static condition
either using finite element methods (Finno and Harahap 1991, Finno et al. 1991, Day and Potts 1993,
His and Small 1993, Bose and Som 1998, Ng et al. 1998, Carruba and Colonna 2000, Karlsrud and
Andresen 2005, Zdravkovic et al. 2005, Costa et al. 2007, Yoo and Lee 2008, Hsiung 2009, Ou and
Corresponding author, Ph.D., Associate Professor, E-mail: [email protected] aE-mail: [email protected]
bProfessor, E-mail: [email protected]
Subha Sankar Chowdhury, Kousik Deb and Aniruddha Sengupta
Hsieh 2011) or with the help of empirical or semi-empirical methods based on numerous databases
on deep excavation from worldwide case histories in different types of soil (Hsieh and Ou 1998,
Tanaka 1999, Long 2001, Moormann 2004, Liu et al. 2005, Wang et al. 2005, 2010, Kung et al.
2007). The static behavior of braced excavation has also been studied with physical model tests
(Georgiadis and Anagnostopoulos 1999, Nakai et al. 1999, Takemura et al. 1999, Tefera et al.
2006). But very limited studies on such structures under seismic condition have been conducted.
Callisto and Soccodato (2010) have utilized acceleration time history of two Italian earthquakes
to perform numerical analyses of embedded cantilever retaining walls in dry coarse-grained soil
using FLAC. The behavior of the retaining walls has been studied by pseudo-static approach and a
design criterion has been developed. Apart from the embedded retaining wall, a number of
numerical studies (Neelakantan et al. 1992, Siller and Frawley 1992, Yogendrakumar et al. 1992,
Madabhushi and Zeng 1998, 2008, Jr. Richards et al. 1999, Caltabiano et al. 2000, Gazetas et al.
2004, Ling et al. 2005, Psarropoulos et al. 2005, Wartman et al. 2006) have been done on other
type of walls such as gravity, cantilever, anchored walls or mechanically stabilized earth retaining
walls under seismic condition. Experimental studies (Zeng 1998, Tufenkjian and Vucetic 2000,
Watanabe et al. 2003, Ling et al. 2005, 2009, Atik and Sitar 2010) have also been conducted to
investigate the behavior of different types of wall under seismic condition. Conti et al. (2010)
conducted dynamic centrifuge tests on scaled models of flexible retaining walls, both cantilevered
and singly propped at the top. It was identified that the permanent displacements (during shaking)
and residual bending moments (after shaking) depend not only on the entire acceleration time
history, but also on current earthquake intensity. It is observed that most of the seismic studies
have been conducted to investigate the behavior of cantilever or gravity wall retaining backfill soil
(or sheet piles). Very limited studies have been conducted on embedded retaining structures under
seismic condition because they are most of the time temporary in nature. In view of this, an
attempt has been made in this paper to study the behavior of embedded retaining structures during
earthquakes. In this study, the force in the supporting members (struts or slabs), bending moment
in the wall, deflection of the wall and the vertical ground displacement under seismic condition
have been compared with those under static condition to assess the effect of earthquake on the
performance of embedded retaining structures.
2. Numerical simulation
Both static and seismic analyses have been done using a two dimensional plane strain finite
difference program called FLAC (Itasca 2005). The construction of embedded retaining structure
involves different stages of excavation and subsequent installation of support members at the
desired levels below the ground until final excavation level is reached. In the numerical
computation, the characteristic of the soil under dynamic condition is described by a hysteretic
model which updates the tangent shear modulus at each calculation step. The soil behaves as a
linearly elastic-perfectly plastic material following Mohr-Coulomb failure criterion.
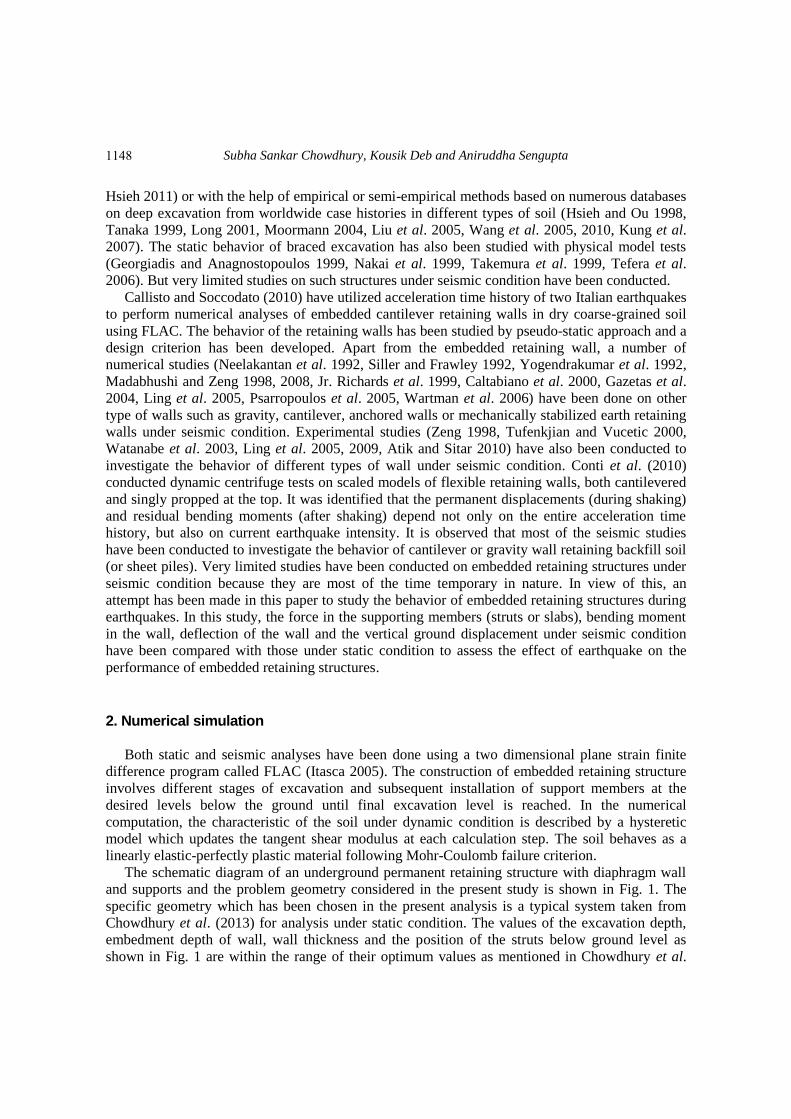
The schematic diagram of an underground permanent retaining structure with diaphragm wall
and supports and the problem geometry considered in the present study is shown in Fig. 1. The
specific geometry which has been chosen in the present analysis is a typical system taken from
Chowdhury et al. (2013) for analysis under static condition. The values of the excavation depth,
embedment depth of wall, wall thickness and the position of the struts below ground level as
shown in Fig. 1 are within the range of their optimum values as mentioned in Chowdhury et al.
1148

Behavior of underground strutted retaining structure under seismic condition
Fig. 1 Schematic diagram of geometry considered in the present study
(2013). In case of an underground structure such as a station building for underground metro
transport, the R.C.C diaphragm walls becomes permanent and these walls are connected with slabs
at different levels. These slabs are the support members which run throughout the length of the
wall. In the present analysis, the walls and the struts are modeled so to simulate diaphragm wall
and the slabs, respectively.
As different stages are involved in the construction of a braced excavation, theoretically
earthquake may occur at any stage. However, the maximum chance of earthquake occurrence is at
the service stage, i.e., at the final stage of construction. In the present study, each stage of the
construction is first analyzed under static condition with small strain shear modulus (0.3G0) and
then under seismic condition with G0. The stiffness (shear modulus, G0) of soil changes with the
strain level, but the model which has been used in the present study does not consider the
reduction of stiffness with strain level. Thus, to incorporate the stiffness reduction, a reduced
stiffness has been used during each stage analyzed under static condition as suggested by Aversa et
al. (2007).This procedure is followed for all the stages till the final excavation level is reached.
The values of the design parameters like bending moment, strut forces, wall deflection may reach
maximum at any stage of the construction. However, the maximum ground deformation has been
found to occur at the final stage of construction. As the ratio of the length to width of the
excavation is usually very large, so it is analyzed as a two-dimensional plane strain problem.
Considering unit length along the direction perpendicular to the plane of analysis, cross-sectional
area (Awall) and moment of inertia (Iwall) of the wall are calculated as 1.0×twall and 1.0×twall3/12
respectively, where twall is the thickness of the wall. Depending on the depth of excavation (De), the
wall is supported by different levels of supporting members or struts. For 10 m, 15 m and 20 m
depths of excavation, the number of strut is assumed to be 2, 3 and 4, respectively. The soil
properties namely, dry density, friction angle and initial shear modulus are taken from Callisto and
Soccodato (2010). The wall is embedded in dry, coarse-grained soil with a friction angle () of 35o
and density () of 2040 kg/m3. The coefficient of lateral earth pressure at rest (K0) is calculated
1149

Subha Sankar Chowdhury, Kousik Deb and Aniruddha Sengupta
from (1-sin. The initial stress state is computed by assuming K0 as 0.426 (for equal to 35o).
The sand layer is underlain by rigid layer at the bottom of the model. The wall friction angle ()
between soil and wall is taken as 20o. A non-associated flow rule is used with dilatancy angle
equal to zero. The Poisson‟s ratio () of soil is taken as 0.30. The small strain shear modulus (G0)
varies with the mean effective stress (p’) according to the following equation (Itasca 2005)
5.0
0
ref
G
ref p
pK
p
G (1)
where, pref is the reference pressure (100 kPa), p’ is the mean effective stress and KG is the stiffness
multiplier (equal to 1000). The values of pref and KG are taken from Callisto and Soccodato (2010).
The first stage of the numerical analysis consists of installation of the wall in the soil under at
rest (K0) state of stress. In this stage, the stress dependent dynamic stiffness is characterized by the
shear stiffness of the soil which follows the empirical power law (Eq. (1)). After the initial stage
i.e., when the wall is installed in the ground, the reduced value of the shear modulus (0.3G0) is
used for static simulation of the excavation. This is done because the model does not allow the
change in soil stiffness with the strain level in static simulation (Aversa et al. 2007). After the
static analysis, the shear modulus (G0) is used for dynamic analysis. The bulk modulus for static
analysis (Kst) and dynamic analysis (Kd) are given by Eqs. (2a) and (2b), respectively.
)21(3
)1)(3.0(2 0
GK st
(2a)
)21(3
)1(2 0
GKd
(2b)
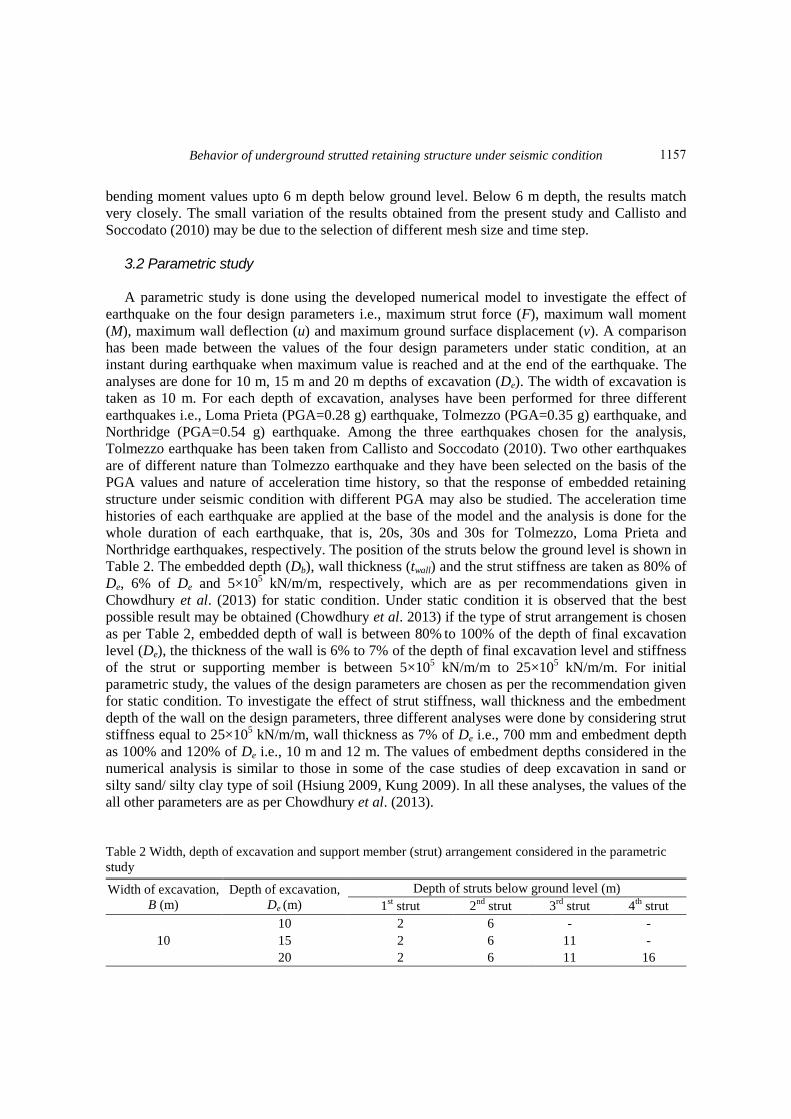
The numerical model under seismic condition for 10m width of the excavation and 20m depth
Fig. 2 Numerical modeling for parametric study in FLAC
1150

Behavior of underground strutted retaining structure under seismic condition
of excavation is shown in Fig. 2. In the model, the size of the elements is taken as 0.5 m×0.5 m.
The maximum frequency that can be modeled for smooth wave propagation through all elements
depends on the minimum value of G0 which is obtained at the centre of the topmost element of the
model i.e., at a depth of 0.5/2=0.25 m below ground level. For =2040 kg/m3, pref=100 kPa and
KG=1000, the value of G0 is found to be 1.8107 kPa (as per Eq. (1)). The shear wave speed (Cs)
and the maximum frequency (fmax) that can be modeled are calculated from the following
equations (Itasca 2005) as
ρ
GCS
0 (3)
λ
Cf S
max (4)
The value of Cs is 93.9 m/s. is the wavelength associated with highest frequency component
that contains appreciable energy. The wavelength is calculated according to FLAC, 5.0 manual
(Itasca 2005) as
lΔλ 10 (5)
where l is the spatial element size i.e., 0.5 m. From Eqs. (3) and (4), the value of fmax is 18.6 Hz
i.e., the maximum frequency with which the wave can propagate through the model is 18.6 Hz. So,
the input acceleration history is low-pass filtered at 15 Hz for compatibility with the size of the
elements. For all the chosen earthquakes, the majority of the power of the seismic wave is
contained within the 15 Hz frequency as shown in Fourier spectra. So, by filtering the acceleration
time history data at 15 Hz, there is no major loss of energy of the earthquake. Thus, the nature of
the seismic motions remains similar, even after it is filtered at 15 Hz frequency.
During static simulation of the construction stages, the lateral boundaries are restrained from
moving in horizontal direction and the bottom boundary is restrained from moving in both
horizontal and vertical directions. During seismic analyses, free-field conditions are applied along
the vertical boundaries so that boundaries retain their non-reflecting properties when these are
subjected to outward propagating waves from the structure. The lateral boundaries of the main grid
are connected with the free field grid by viscous dashpots to simulate quiet boundary condition as
developed by Lysmer and Kuhlemeyer (1969).
The two vertical boundaries at the right and left edges of the model are kept at a distance of 6B
(where, B is the width of excavation) from the left and right walls, respectively. Similarly, the
bottom boundary is located at the same distance from the toe of the wall.
The interface normal and shear stiffness (Kn and Ks) are estimated according to the following
equation (Itasca 2005) as
min
snzΔ
GK
KK3
4
max10 (6)
where K and G are the bulk and shear moduli of the soil and zmin is the smallest width of an
adjoining element in the normal direction to the interface. The maximum value of the above
expression for all the elements adjoining the interface is considered in the calculation of interface
1151

Subha Sankar Chowdhury, Kousik Deb and Aniruddha Sengupta
normal and shear stiffness.
In the numerical model, the element size adjacent to the wall is taken as 0.5 m. As small strain
shear modulus (G0) increases with depth below the ground surface, the maximum value of G0 for
18m depth of the wall is obtained at the at the toe of the wall i.e., at a depth of 17.75 m below
ground surface because in FLAC, the shear modulus is estimated at the centroid of each element.
The value of G (in Eq. (6)) is equal to G0 (obtained from Eq. (1) corresponding to p‟ at 17.75 m
below ground level with =2040 kg/m3). The value of K (in Eq. (6)) is equal to K0 (obtained from
Eq. (2b) corresponding to the value of G0 as mentioned above). The interface normal and shear
stiffness are calculated using the value of K, G and zmin (=0.5 m) in the Eq. (6). For 18 m depth of
retaining wall, the values of K and G are 4.55×10⁸ kN/m
2 and 2.10×10
8 kN/m
2, respectively. With
zmin=0.5 m, the values of Kn and Ks are 1.47×10¹⁰
kN/m2. The cohesion and friction angle of the
interface material are 0 and 20o, respectively.
The Young‟s modulus of the wall (Ewall) and Poisson‟s ratio of concrete (wall) are taken as
29580 MPa and 0.15, respectively. In FLAC, the Young‟s modulus of the wall is given as
Ewall/(1−wall2) in order to represent plane strain formulation of a continuous wall as mentioned in
the FLAC (Itasca 2005). The walls and the struts are modeled using beam elements. If the cross-
sectional area, modulus of elasticity and the spacing of support member are Astrut, Estrut and s,
respectively, then the strut or support stiffness (kstrut) is given by Astrut.Estrut/ls, where l is the length
of support member i.e., width of excavation. In the seismic analyses, the whole braced excavation
is modeled with two walls situated at the two edges of the excavation and connected by supporting
members or struts at different levels. The distance between the two walls is equal to the width of
the excavation. The connection between the strut nodes and the wall nodes are established with the
help of springs. Only rotation is allowed for the strut node i.e., hinge connection exists between the
wall node and the strut node. The translation in both vertical and horizontal directions is not
allowed for the strut node.
The soil behavior under the earthquake loading is described by non-linear model with
hysteretic damping available in FLAC (Itasca 2005). Under plane strain condition, the shear stress
() and the shear strain () are related as
.
00
ss MG
G
G (7)
where Gs() is the secant shear modulus which is a function of , G0 is the small strain shear
modulus and Ms is the normalized secant shear modulus. In the present analysis, it is assumed that
cyclic soil behavior can be represented by the relationship between Ms and given in FLAC
(Itasca 2005). The modulus degradation curve is expressed using the sigmoidal model in FLAC
(Itasca 2005) and is given by
b/xγlogexp1
ayM
010
0s
(8)
where the values of the four parameters are given by a=0.9762, b=-0.4393, x0=-1.285 and
y0=0.03154.
The details of the three chosen earthquakes, i.e., Loma Prieta, Tolmezzo, and Northridge
earthquakes, used in the present study are given in Table 1. The input acceleration time history of
Loma Prieta, Tolmezzo and Northridge earthquakes are shown in Figs. 3(a), (b), (c),
respectively. In the figures, the input acceleration is given in the units of acceleration due to
1152

Behavior of underground strutted retaining structure under seismic condition
Table 1 Earthquakes considered in the present study
Name of Earthquake Year of
occurrence
Duration
(sec)
Peak ground acceleration (PGA)
(g)
Loma Prieta 1989 40 0.28
Tolmezzo 1976 20 0.35
Northridge 1994 32 0.54
(a)
(b)
(c)
Fig. 3 Input acceleration time history for (a) Loma Prieta earthquake (b) Tolmezzo earthquake and
(c) Northridge earthquake
1153

Subha Sankar Chowdhury, Kousik Deb and Aniruddha Sengupta
(a)
(b)
(c)
Fig. 4 Fourier amplitude spectrum of input acceleration history for (a) Loma Prieta earthquake (b)
Tolmezzo earthquake and (c) Northridge earthquake
gravity (g) and time (t) in seconds. The frequency content of the earthquakes is determined by
Fourier amplitude spectrum and it is shown in Figs. 4(a), (b), (c) for Loma Prieta, Tolmezzo and
Northridge earthquakes, respectively. Each of the acceleration time histories is filtered at 15 Hz
and is applied to the bedrock nodes at the bottom boundary of the model. The elastic response
spectra for zero percent damping are shown in Figs. 5(a), (b), (c) for Loma Prieta, Tolmezzo and
Northridge earthquakes, respectively. From the response spectra of the three earthquakes, it is
revealed that they cover the period (or frequency) range wide enough for the concerned structure.
The range of PGA is in between 0.28 g and 0.54 g. This range is wide and high enough to cover
most of the known earthquakes.
1154

Behavior of underground strutted retaining structure under seismic condition
(a)
(b)
(c)
Fig. 5 Response spectrum of input acceleration history for (a) Loma Prieta earthquake (b) Tolmezzo
earthquake and (c) Northridge earthquake
3. Results and discussions
3.1. Model validation
To validate the developed numerical model, two embedded cantilevered retaining walls, as
presented by Callisto and Soccodato (2010), are modeled in FLAC. The retaining walls are made
up of contiguous bored reinforced 0.6 m diameter concrete piles at 0.7 m spacing with a bending
stiffness of 2.7×10⁵ kN-m/m. The width of the excavation is 16 m. All the material properties and
geometry are taken as reported in Callisto and Soccodato (2010). In the numerical model, the
1155

Subha Sankar Chowdhury, Kousik Deb and Aniruddha Sengupta
Fig. 6 A comparison between deflection patterns of left wall from Callisto and Soccodato (2010)
and present study
Fig. 7 A comparison between bending moment patterns in left wall from Callisto and Soccodato
(2010) and present study
vertical boundaries extend upto 22 m from the edge of the wall and the horizontal boundary is also
22 m below the toe of the wall. The properties of the coarse-grained soil i.e., density (2040 kg/m3),
friction angle (35°), dilatancy angle (0°) and shear modulus (depends on mean effective stress, as
per Eq. (1)) are taken from Callisto and Soccodato (2010). In the validation model, a small value
of cohesion (=0.5 kN/m2) of the soil is taken to ensure numerical stability (Callisto et al. 2008).
The values of K0 and for the soil are taken as 0.5 and 0.2, respectively. The deflection of the left
wall and bending moment developed in the left wall at the end of the Tolmezzo earthquake are
estimated in the present numerical study and the results are compared with the results obtained by
Callisto and Soccodato (2010).
The deflection pattern of the left wall at the end of the earthquake as found from the present
study and that from Callisto and Soccodato (2010) is presented in Fig. 6. It can be seen from the
figure that the deflections predicted by the present study matches closely with that from Callisto
and Socodato. However, the difference between the results increases as the depth of the wall
increases. The variation of bending moment developed in the left wall with depth below ground
level at the end of the earthquake found from the present study and Callisto and Soccodato (2010)
is shown in Fig. 7. It may be observed from the figure that there is little difference between the
1156
Behavior of underground strutted retaining structure under seismic condition
bending moment values upto 6 m depth below ground level. Below 6 m depth, the results match
very closely. The small variation of the results obtained from the present study and Callisto and
Soccodato (2010) may be due to the selection of different mesh size and time step.
3.2 Parametric study
A parametric study is done using the developed numerical model to investigate the effect of
earthquake on the four design parameters i.e., maximum strut force (F), maximum wall moment
(M), maximum wall deflection (u) and maximum ground surface displacement (v). A comparison
has been made between the values of the four design parameters under static condition, at an
instant during earthquake when maximum value is reached and at the end of the earthquake. The
analyses are done for 10 m, 15 m and 20 m depths of excavation (De). The width of excavation is
taken as 10 m. For each depth of excavation, analyses have been performed for three different
earthquakes i.e., Loma Prieta (PGA=0.28 g) earthquake, Tolmezzo (PGA=0.35 g) earthquake, and
Northridge (PGA=0.54 g) earthquake. Among the three earthquakes chosen for the analysis,
Tolmezzo earthquake has been taken from Callisto and Soccodato (2010). Two other earthquakes
are of different nature than Tolmezzo earthquake and they have been selected on the basis of the
PGA values and nature of acceleration time history, so that the response of embedded retaining
structure under seismic condition with different PGA may also be studied. The acceleration time
histories of each earthquake are applied at the base of the model and the analysis is done for the
whole duration of each earthquake, that is, 20s, 30s and 30s for Tolmezzo, Loma Prieta and
Northridge earthquakes, respectively. The position of the struts below the ground level is shown in
Table 2. The embedded depth (Db), wall thickness (twall) and the strut stiffness are taken as 80% of
De, 6% of De and 5×10⁵ kN/m/m, respectively, which are as per recommendations given in
Chowdhury et al. (2013) for static condition. Under static condition it is observed that the best
possible result may be obtained (Chowdhury et al. 2013) if the type of strut arrangement is chosen
as per Table 2, embedded depth of wall is between 80% to 100% of the depth of final excavation
level (De), the thickness of the wall is 6% to 7% of the depth of final excavation level and stiffness
of the strut or supporting member is between 5×10⁵ kN/m/m to 25×10
5 kN/m/m. For initial
parametric study, the values of the design parameters are chosen as per the recommendation given
for static condition. To investigate the effect of strut stiffness, wall thickness and the embedment
depth of the wall on the design parameters, three different analyses were done by considering strut
stiffness equal to 25×105 kN/m/m, wall thickness as 7% of De i.e., 700 mm and embedment depth
as 100% and 120% of De i.e., 10 m and 12 m. The values of embedment depths considered in the
numerical analysis is similar to those in some of the case studies of deep excavation in sand or
silty sand/ silty clay type of soil (Hsiung 2009, Kung 2009). In all these analyses, the values of the
all other parameters are as per Chowdhury et al. (2013).
Table 2 Width, depth of excavation and support member (strut) arrangement considered in the parametric
study
Width of excavation,
B (m)
Depth of excavation,
De (m)
Depth of struts below ground level (m)
1st strut 2
nd strut 3
rd strut 4
th strut
10
10 2 6 - -
15 2 6 11 -
20 2 6 11 16
1157

Subha Sankar Chowdhury, Kousik Deb and Aniruddha Sengupta
3.2.1 Effect of earthquake on maximum strut force A comparison between maximum strut force at different levels for different depths of
excavation under static and seismic conditions is shown in Table 3. The strut forces under static
condition (Fstat), at the end of earthquake and its maximum value at a particular instant during
earthquake (Fseis) are shown for all the three earthquakes considered in the present study. If RF is
defined as the ratio of Fseis and Fstat, then it is found that when depth of excavation is 15 m, the
Table 3 Variation of Strut forces for different values of De and earthquakes
De
(m)
Strut
levels
Strut force ( 103 kN/m)
Static
(Fstat)
Earthquake
Loma Prieta
(PGA=0.28 g)
Tolmezzo
(PGA=0.35 g)
Northridge
(PGA=0.54 g)
End of
EQ.
Maximum
(Fseis) Fseis/Fstat
End of
EQ.
Maximum
(Fseis) Fseis/Fstat
End of
EQ.
Maximum
(Fseis) Fseis/Fstat
10 1
st 0.74 1.78 1.97 2.66 1.97 2.38 3.21 2.03 2.16 2.92
2nd
1.46 3.17 3.27 2.24 4.34 4.72 3.23 3.65 4.01 2.75
15
1st 0.87 1.83 1.97 2.26 1.95 2.44 2.80 1.86 2.34 2.69
2nd
2.56 7.16 7.22 2.82 5.87 6.34 2.48 5.0 5.6 2.19
3rd
2.50 3.08 5.19 2.08 6.74 6.95 2.78 6.84 6.84 2.74
20
1st 1.13 1.85 2.05 1.81 2.14 2.61 2.31 2.14 2.34 2.07
2nd
2.92 4.8 5.06 1.73 7.41 7.56 2.59 5.77 6.16 2.11
3rd
4.10 7.07 7.16 1.75 9.00 9.44 2.30 7.84 8.35 2.04
4th
3.39 6.67 6.75 1.99 8.72 9.10 2.68 7.67 8.07 2.38
Table 4 Values of design factors for different values of Db/De, twall/De and kstrut under static & seismic
conditions
Design parameters
Values of design parameters
Db=8 m,
Db/De=0.8
kstrut=5×10⁵
kN/m/m
twall/De=0.06
Db=10 m,
Db/De=1.0
kstrut=5×10⁵
kN/m/m
twall/De=0.06
Db=12 m
Db/De=1.2
kstrut=5105
kN/m/m
twall/De=0.06
Db=8 m
Db/De=0.8
kstrut=25105
kN/m/m
twall/De=0.06
Db=8 m
Db/De=0.8
kstrut=5×10⁵
kN/m/m
twall/De=0.07
Static Seismic
(Max.) Static
Seismic
(Max.) Static
Seismic
(Max.) Static
Seismic
(Max.) Static
Seismic
(Max.)
F
(×103
kN/m)
1st strut 0.737 2.379 1.136 3.317 2.33 4.775 0.852 2.531 0.745 2.152
2nd
strut 1.456 4.717 1.577 3.530 1.232 1.916 1.666 5.295 1.498 4.861
M
(×103 kN-
m/m)
Left 0.072 0.405 0.062 0.312 0.183 0.643 0.070 0.396 0.085 0.492
Right 0.072 0.413 0.061 0.316 0.185 0.659 0.070 0.448 0.085 0.476
u (mm) Left 1.51 79.32 1.376 78.3 4.50 75.96 1.424 80.33 1.407 79.95
Right 1.51 84.38 1.356 84.32 4.60 90.56 1.428 84.44 1.398 83.37
v (mm) Left 2.06 17.52 2.356 10.82 2.07 12.85 1.752 21.15 2.285 15.29
Right 2.07 19.33 2.370 8.49 2.07 12.96 1.758 23.99 2.267 18.16
1158

Behavior of underground strutted retaining structure under seismic condition
value of RF for 1st, 2nd and 3rd levels varies from (2.3-2.8), (2.2-2.8) and (2.1-2.8), respectively
for the selected earthquakes. Similarly, the value of RF for 4th level strut, when De is 20 m, varies
from 2.0 to 2.7. Thus, the maximum strut forces at a particular instant during an earthquake are
approximately 2-3 times higher than that under static condition. However, the strut forces at the
end of earthquake are approximately 1.2-3 times higher than that under static condition.
In order to investigate the effect of embedment depth, wall thickness and strut stiffness on axial
force in struts under seismic condition, three different analyses were done and results are shown in
Table 4. It can be found from Table 4 that, if the depth of embedment is increased from 8 m to 10
m the forces in 1st and 2
nd level struts increase by 39% and decrease by 25%, respectively.
However, if Db is increased from 10 m to 12 m there is 44% increment and 46% decrement in 1st
and 2nd
level strut force, respectively. Similarly, for a particular value of Db (=8 m) and twall/De
(=0.06), if the strut stiffness (kstrtu) is increased from 5×10⁵ kN/m/m to 25×10
5 kN/m/m, the forces
in 1st and 2
nd level struts increase by 6% and 12%, respectively. This is due to the fact that as the
stiffness of the strut is increased, it attracts more force. However, when Db=8 m, kstrut=5×10⁵
kN/m/m and twall/De is increased from 0.06 to 0.07, the forces in 1st and 2
nd level struts decreases
by 10% and increases by 3%, respectively. Overall, it is observed that under seismic condition if
the depth of embedment of the wall is taken as 100% of the depth of excavation, the best possible
results can be obtained in terms of maximum strut force. However, maximum strut force increases
as the stiffness of the strut and thickness of the wall increase.
3.2.2 Effect of earthquake on maximum wall moment The value of the bending moment (M) has been estimated for both left and right walls under
under static condition, at the end of earthquake and at a particular instant during earthquake when
it is maximum. The distribution of the moment on the right wall along its depth is plotted in Figs.
8(a)-8(c), 9(a)-9(c), 10(a)-10(c) for three different depths of excavation and three different
earthquakes. From the figures, it may be found that the moment under seismic condition is much
greater than that under static condition. If the ratio between maximum bending moment at a
particular instant during earthquake i.e., seismic moment (Mseis) and static moment (Mstat) is
defined as RM, then it is found that when De=10 m, 15 m and 20 m, the values of RM are (6.2, 3.5
and 1.9), (5.7, 4.0 and 3.4) and (8.8, 3.2 and 2.8) for Loma Prieta, Tolmezzo and Northridge
earthquakes, respectively. Thus, the maximum wall moment at a particular instant of earthquake is
approximately 2-9 times higher than that under static condition. However, the wall moment at the
end of earthquake is approximately 2-5 times higher than that under static condition.
It can be further found from Table 4 that if the depth of embedment is increased from 8m to
10m, the maximum seismic moment in the wall decreases by 23%. However, if Db is increased
from 10 m to 12 m there is 59% increment in the wall moment. Similarly, for a particular value of
Db (=8 m) and twall/De (=0.06), if the strut stiffness (kstrut) is increased from 5×10⁵ kN/m/m to
25105 kN/m/m, the maximum wall moment is increased by 8.5%. However, for Db=8 m,
kstrut=5×10⁵ kN/m/m and twall/De is increased from 0.06 to 0.07, the maximum wall moment
increases by approximately 20%. Thus, under seismic condition, if the depth of embedment of the
wall is taken as 100% of depth of excavation, the best possible result can be obtained in terms of
maximum wall moment. However, maximum wall moment increases as the stiffness of the strut
and thickness of the wall increase.
3.2.3 Effect of earthquake on maximum lateral wall deflection The lateral wall deflection under static condition, at the end of earthquake and at the instant of
1159

Subha Sankar Chowdhury, Kousik Deb and Aniruddha Sengupta
(a)
(b)
(c)
Fig. 8 Bending moment profile of right wall when De=10 m for (a) Loma Prieta earthquake (b)
Tolmezzo earthquake and (c) Northridge earthquake
maximum value are shown in Figs. 11(a)-11(c), 12(a)-12(c), 13(a)-13(c) for three different depths
of excavation and three different earthquakes. From the figures, it is seen that there is a large
difference between the deflection under static and seismic conditions. If the ratio between the
maximum value of the wall deflection under seismic condition (useis) and static condition (ustat) is
defined as Ru, then it is found when De=10 m, the values of Ru are 55.9, 51.4 and 87.1 for Loma
Prieta, Tolmezzo and Northridge earthquakes, respectively. However, if De is 15 m, the values of
Ru are 37.5, 35.2 and 61.0 for the selected earthquakes. Similarly, when the depth of excavation is
20 m, the values of Ru are 26.7, 29.1 and 45.1 for Loma Prieta, Tolmezzo and Northridge
earthquakes, respectively. Thus, the maximum wall defection at a particular instant during
earthquake is approximately 25-90 times higher than that under static condition. However, the wall
1160

Behavior of underground strutted retaining structure under seismic condition
defection at the end of earthquake is approximately 7-58 times higher than that under static
condition. For the selected soil profile, earthquake and structure, the ratio of seismic and static
deflection (up to 90 at a particular instant during earthquake and 58 at the end of earthquake) may
(a)
(b)
(c)
Fig. 9 Bending moment profile of right wall when De=15 m for (a) Loma Prieta earthquake (b)
Tolmezzo earthquake and (c) Northridge earthquake
1161

Subha Sankar Chowdhury, Kousik Deb and Aniruddha Sengupta
(a)
(b)
(c)
Fig. 10 Bending moment profile of right wall when De=20 m for (a) Loma Prieta earthquake (b)
Tolmezzo earthquake and (c) Northridge earthquake
increases or decreases depending on the factors mentioned above. The seismic motions increase
the earth pressure on underground structures. It also may have a kinematic effect on the
underground structure (Abuhajar et al. 2011).
It is also found from Table 4 that if the depth of embedment is increased from 8 m to 10 m, the
value of lateral wall deflection under seismic condition remains almost constant. However, if Db is
increased from 10 m to 12 m, there is 7% increment in the wall deflection. For a particular value of
Db (=8 m) and twall/De (=0.06), if the strut stiffness (kstrut) is increased from 5×10⁵ kN/m/m to
1162

Behavior of underground strutted retaining structure under seismic condition
(a)
(b)
(c)
Fig. 11 Wall deflection profile of right wall when De=10 m for (a) Loma Prieta earthquake (b)
Tolmezzo earthquake and (c) Northridge earthquake
25×105 kN/m/m, the wall deflection remains almost constant. Similarly, for Db=8 m, kstrut=5×10
5
kN/m/m and twall/De is increased from 0.06 to 0.07, no significant change in the wall deflection is
observed. Thus, it can be said that under seismic condition to get the best possible results in terms
of lateral wall deflection, the depth of embedment can be chosen as 80% to 100% of the depth of
excavation.
3.2.4 Effect of earthquake on maximum vertical ground displacement The ground surface displacement in the final stage of excavation under static condition (vstat) and
at the end of earthquake (vseis) is shown in Table 5. The values for ground displacement at the end
of earthquake are calculated within range of 20 m from the face of retaining wall. It may be found
1163

Subha Sankar Chowdhury, Kousik Deb and Aniruddha Sengupta
(a)
(b)
(c)
Fig. 12 Wall deflection profile of right wall when De=15 m for (a) Loma Prieta earthquake (b)
Tolmezzo earthquake and (c) Northridge earthquake
Table 5 Variation of ground surface displacement for different values of De and earthquakes
De
(m) Side of excavation
Maximum ground surface displacement (mm)
Static
(vstat)
Earthquake
Loma Prieta
(PGA=0.28 g)
Tolmezzo
(PGA=0.35 g)
Northridge
(PGA=0.54 g)
End of EQ.
(vseis) vseis/vstat
End of EQ.
(vseis) vseis/vstat
End of EQ.
(vseis) vseis/vstat
10 Left +2.1 +4.0 1.9 -17.5 8.3 -12.9 6.1
Right +2.1 +2.5 1.2 -19.3 9.2 -8.2 3.9
15 Left +3.4 +6.0 1.7 -8.6 2.5 +2.2 0.7
Right +3.4 +6.8 2.0 -5.9 1.7 +5.3 1.6
20 Left +4.3 +9.9 2.3 -5.0 1.2 +7.6 1.8
Right +4.3 +11.7 2.7 +6.6 1.5 +5.7 1.3
„-„ indicates settlement and „+‟ indicates heaving
The value of vseis/vstat is calculated on the basis of absolute magnitude of the above values of vseis
1164

Behavior of underground strutted retaining structure under seismic condition
(a)
(b)
(c)
Fig. 13 Wall deflection profile of right wall when De=20 m for (a) Loma Prieta earthquake (b)
Tolmezzo earthquake and (c) Northridge earthquake
from the table that there is large difference between the ground displacement between static and
seismic conditions. If Rv is defined as the ratio between vseis and vstat, then it is observed that when
the depth of excavation is 10m, the values of Rv are 1.9, 9.2, 6.1 for Loma Prieta, Tolmezzo and
Northridge earthquakes, respectively. However, when De=15 m, the values of Rv are 2.0, 2.5, 1.6
for Loma Prieta, Tolmezzo and Northridge earthquakes, respectively. Similarly, when the depth of
1165

Subha Sankar Chowdhury, Kousik Deb and Aniruddha Sengupta
excavation is 20m, the values of Rv are 2.7, 1.5, 1.8 for Loma Prieta, Tolmezzo and Northridge
earthquakes, respectively. Thus, the maximum ground displacement at the end of earthquake is
approximately 1-9 times higher than that under static condition.
It can be found from Table 4 that if the depth of embedment is increased from 8 m to 10 m, the
ground surface displacement under seismic condition (vseis) decreases by 44%. However, if Db is
increased from 10 m to 12 m, there is increment of 20% in ground displacement. This happens
because of the depth of embedment which plays an important role in reducing ground surface
displacement under static condition as well as seismic condition. However, under seismic
condition, the seismic wave travels upward through the soil and reaches the ground surface at
different amplitudes. Thus, the ground surface displacement may increase or decrease, if the depth
of embedment is decreased. If kstrut is increased from 5×10⁵ kN/m/m to 25×10
5 kN/m/m, the value
of vseis is increased by 24%. However, if Db=8 m, kstrut=5×10⁵ kN/m/m and twall/De is increased
from 0.06 to 0.07, the ground displacement is decreased by 6%. Thus, it may be said that to get the
best possible results in terms of lateral wall deflection under seismic condition, the depth of
embedment may be chosen around 100% of the depth of excavation. However, higher wall
thickness may be considered to get slightly lower surface displacement.
4. Conclusions
On the basis of the geometry of the underground retaining structure, type of soil and the
earthquakes considered in the present study, it can be concluded that the strut force under seismic
condition is approximately 2-3 times higher than that under static condition. It is further observed
that the wall deflection is most sensitive to earthquake effect as compared to the other design
parameters. To get the best possible results under seismic condition, the embedment depth of the
wall may be chosen as around 100% of the depth of final excavation level. The stiffness of the
strut and thickness of the wall may be chosen as 5×10⁵ kN/m/m and 6% of depth of excavation,
respectively to get the best possible performance in terms of strut force, wall moment and lateral
wall deflection. However, under seismic condition to achieve lower ground displacement, thicker
wall (twall=0.07De or more) can be used, but in such case higher strut force and wall moment will
develop. Some of the limitations in the present study include the use of elastic-perfectly plastic
Mohr-Coulomb model, which approximates the real behavior of soil. However, this has been used
because, of its simplicity and wide application to model the soil. The analysis has been done for
three earthquakes of different intensities and similar trend of results are obtained for all the
selected earthquakes. The range of PGA is in between 0.28 g and 0.54 g. This range is wide and
high enough to cover most of the known earthquakes. Thus, the trends those are obtained in the
present study can be valid for other earthquakes also. The recommendations can also be valid for
other earthquakes. However, values of maximum bending moment, wall deflection, strut force,
ground deformation may vary for different earthquakes.
Acknowledgments
The financial support for the present work received from the Science and Engineering Research
Board (SERB) of the Department of Science and Technology, Government of India, New Delhi is
hereby gratefully acknowledged.
1166

Behavior of underground strutted retaining structure under seismic condition
References
Abuhajar, O., Naggar, H.E. and Newson, T. (2011), “Effects of underground structures on amplification of
seismic motion for sand with varying density”, Pan-Am CGS Geotechnical Conference, October 2-6,
2011, Toronto, Ontario, Canada.
Atik, L.A. and Sitar, N. (2010), “Seismic earth pressures on cantilever retaining structures”, J. Geotech.
Geoenviron. Eng., 136(10), 1324-1333.
Aversa, S., Maiorano, R.M.S. and Tamagnini, C. (2007), “Influence of damping and soil model on the
computed seismic response of flexible retaining structures”, In 14th European Conference on Soil
Mechanics and Geotechnical Engineering.
Bose, S.K. and Som, N.N. (1998), “Parametric study of a braced cut by Finite Element method”, Comput.
Geotech., 22(2), 91-107.
Callisto, L., Soccodato, F.B. and Conti, R. (2008), “Analysis of the seismic behavior of propped retaining
structures”, Proceedings of Geotechnical Earthquake Engineering and Soil Dynamivs IV conference, GSP
181, Sacramento, USA.
Callisto, L. and Soccodato, F.M. (2010), “Seismic design of flexible cantilever retaining walls”, J. Geotech.
Geoenviron. Eng., 136(2), 344-354.
Caltabiano, S., Cascone, E. and Maugeri, M. (2000), “Seismic stability of retaining walls with surcharge”,
Soil Dyn. Earthq. Eng., 20(8), 469-476.
Carrubba, P. and Colonna, P. (2000), “A comparison of numerical methods for multi-tied walls”, Comput.
Geotech., 27(2), 117-140.
Chowdhury, S.S., Deb, K. and Sengupta, A. (2013), “Estimation of design parameters for braced excavation:
A numerical study”, Int. J. Geomech., 13(3), 234-247.
Conti, R., Viggiani, G.M.B. and Madabhusi, S.P.G. (2010), Physical modeling of flexible retaining walls
under seismic actions, Physical Modelling in Geotechnics, Eds. Springman, Laue and Seward, Taylor &
Francis Group, London.
Costa, P.A., Borges, J.L. and Fernandes, M.M. (2007), “Analysis of a braced excavation in soft soils
considering the consolidation effect”, J. Geotech. Geologic. Eng., 25(6), 617-629.
Day, R.A. and Potts. D.M. (1993), “Modeling sheet pile retaining walls”, Comput. Geotech., 15(3), 125-143.
Gazetas, G., Psarropoulos, P.N., Anastasopoulos, I. and Gerolymos, N. (2004), “Seismic behavior of flexible
retaining systems subjected to short-duration moderately strong excitation”, Soil Dyn. Earthq. Eng., 24(7),
537-550.
Georgiadis, M. and Anagnostopoulos, C. (1999), “Displacement of structures adjacent to cantilever sheet
pile walls”, Soil. Found., 39(2), 99-104.
Finno, R.J., Harahap, I.S. and Sabatini, P.J.M. (1991), “Analysis of braced excavations with coupled finite
element formulations”, Comput. Geotech., 12(2), 91-114.
Finno, R.J. and Harahap, I.S. (1991), “Finite Element Analysis of HDR-4 excavation”, J. Geotech. Eng.
Div., 117(10), 1590-1609.
His, J.P. and Small, J.C. (1993), “Application of a fully coupled method to the analysis of an excavation”,
Soil. Found., 33(4), 36-48.
Hsieh, P.G. and Ou, C.Y. (1998), “Shape of ground surface settlement profiles caused by excavation”, Can.
Geotech. J., 35(6), 1004-1117.
Hsiung, B.C.B. (2009), “A case study on the behavior of a deep excavation in sand”, Comput. Geotech.,
36(4), 665-675.
Itasca (2005), FLAC Fast Lagrangian Analysis of Continua, v.5.0, User‟s Manual.
Jr. Richards, R., Huang, M. and Fishman, K.L. (1999), “Seismic earth pressure on retaining structures”, J.
Geotech. Geoenviron. Eng., 125(9), 771-778.
Karlsrud, K. and Andresen, L. (2005), “Loads on braced excavation in soft clay”, Int. J. Geomech., 5(2),
107-113.
Kung, G.T.C., Juang, C.H., Hsiao, E.C.L. and Hashash, Y.M.A. (2007), “Simplified model for wall
1167

Subha Sankar Chowdhury, Kousik Deb and Aniruddha Sengupta
deflection and ground-surface settlement caused by braced excavation in clays”, J. Geotech. Geoenviron.
Eng., 133(6), 731-747.
Kung, G.T.C. (2009), “Comparison of excavation-induced wall deflection using top-down and bottom-up
construction methods in Taipei silty clay”, Comput. Geotech., 36(3), 373-385.
Ling, H.I., Mohri, Y., Leshchinsky, D., Burke, C., Matsushima, K. and Liu, H. (2005), “Large scale shaking
table tests on modular block-reinforced soil retaining walls”, J. Geotech. Geoenviron. Eng., 131(4), 465-
476.
Ling, H.I., Liu, H. and Mohri, Y. (2005), “Parametric studies on the behavior of reinforced soil retaining
walls under earthquake loading”, J. Eng. Mech., 131(10), 1056-1065.
Ling, H.I., Leshchinsky, D., Wang, J.P., Mohri, Y. and Rosen, A. (2009), “Seismic response of geocell
retaining walls: Experimental studies”, J. Geotech. Geoenviron. Eng., 135(4), 515-524.
Liu, G.B., Ng, C.W.W. and Wang, Z.W. (2005), “Observed performance of a deep multi-strutted excavation
in Shanghai soft clays”, J. Geotech. Geoenviron. Eng., 131(8), 1004-1013.
Long, M. (2001), “Database for retaining wall and ground movements due to deep excavations”, J. Geotech.
Geoenviron. Eng., 127(3), 203-224.
Lysmer, J. and Kuhlemeyer, R.L. (1969), “Finite dynamic model for infinite media”, J. Eng. Mech.,
95(EM4), 859-877.
Madabhushi, S.P.G. and Zeng, X. (1998), “Seismic response of gravity quay walls. I: Numerical modeling”,
J. Geotech. Geoenviron. Eng., 124(5), 418-427.
Madabhushi, S.P.G. and Zeng, X. (2008), “Simulating seismic response of cantilever retaining walls”, J.
Geotech. Geoenviron. Eng., 133(5), 539-549.
Moormann, C. (2004), “Analysis of wall and ground movements due to deep excavations in soft soil based
on a new worldwide database”, Soils Found., 44(1), 87-98.
Nakai, T., Kawano, H., Murata, K., Banno, M. and Hashimoto, T. (1999), “Model test and numerical
simulation of braced excavation in sandy ground: Influences of construction history, wall friction, wall
stiffness, strut position and strut stiffness”, Soils Found., 39(3), 1-12.
Neelakantan, G., Budhu, M. and Jr. Richards, R. (1992), “Balanced seismic design of anchored retaining
walls”, J. Geotech. Eng. Div., 118(6), 873-888.
Ng, C.W.W., Simpson, B., Lings, M.L. and Nash, D.F.T. (1998), “Numerical analysis of a multipropped
retaining wall in stiff clay”, Can. Geotech. J., 35(1), 115-130.
Ou, C.Y. and Hsieh, P.G. (2011), “A simplified method for predicting ground settlement profiles induced by
excavation in soft clay”, Comput. Geotech., 38(8), 987-997.
Psarropoulos, P.N., Klonaris, G. and Gazetas, G. (2005), “Seismic earth pressures on rigid and flexible
retaining walls”, Soil Dyn. Earthq. Eng., 25(10), 795-809.
Siller, T.J. and Frawley, D.D. (1992), “Seismic response of multianchored retaining walls”, J. Geotech.
Geoenviron. Eng., 118(11), 1787-1803.
Takemura, J., Kondoh, M., Esaki, T., Kouda, M. and Kusakabe, O. (1999), “Centrifuge model tests on
double propped wall excavation in soft clay”, Soil. Found., 39(3), 75-87.
Tanaka, H. (1999), “Behavior of a braced excavation in soft clay and the undrained shear strength for
passive earth pressure”, Soils Found., 34(1), 53-64.
Tefera, T.H., Nordal, S., Grande, L., Sandven, R. and Emdal, A. (2006), “Ground settlement and wall
deformation from a large scale model test on as single strutted sheet pile wall in sand”, Int. J. Physic.
Model. Geotech., 6(2), 1-13.
Tufenkjian, M.R. and Vucetic, M. (2000), “Dynamic failure mechanism of soil-nailed excavation models in
centrifuge”, J. Geotech. Geoenviron. Eng., 126(3), 227-235.
Wang, Z.W., Ng, C.W.W. and Liu, G.B. (2005), “Characteristics of wall deflections and ground surface
settlements in Shanghai”, Can. Geotech. J., 42(5), 1243-1254.
Wang, J.H., Xu, Z.H. and Wang, W.D. (2010), “Wall and ground movements due to deep excavations in
Shanghai soft soils”, J. Geotech. Geoenviron. Eng., 136(7), 985-994.
Wartman, J., Rondinel-Oviedo, E.A. and Rodriguez-Marek, A. (2006), “Performance and analyses of
Mechanically Stabilized earth walls in the Tecoman, Mexico Earthquake”, J. Perform. Constr. Fac.,
1168

Behavior of underground strutted retaining structure under seismic condition
20(3), 287-299.
Watanabe, K., Munaf, Y., Koseki, J., Tateyama, M. and Kojima, K. (2003), “Behaviors of several types of
model retaining walls subjected to irregular excitation”, Soils Found., 43(5), 13-27.
Yogendrakumar, M. Bathurst, R.J. and Finn, W.D.L. (1992), “Dynamic response analysis of reinforced soil
retaining wall”, J. Geotech. Geoenviron. Eng., 118(8), 1158-1167.
Yoo, C. and Lee, D. (2008), “Deep excavation-induced ground surface movement characteristics-A
numerical investigation”, Comput. Geotech., 35(2), 231-252.
Zdravkovic, L. Potts, D.M. and St. John, H.D. (2005), “Modeling of a 3D excavation in finite element
analysis”, Geotechnique, 55(7), 497-513.
Zeng, X. (1998), “Seismic response of gravity quay walls. I: Centrifuge modeling”, J. Geotech.
Geoenviron. Eng., 124(5), 406-417.
IT
Notations The following symbols are used in this paper:
Awall=cross-sectional area of the wall
Astrut=cross-sectional area of the wall
a=parameter for sigmoidal model in FLAC
B=width of excavation
b=parameter for sigmoidal model in FLAC
CS=shear wave speed
De=maximum excavation depth (final stage)
Db=embedded depth (final stage)
fmax=maximum frequency
Estrut=Young‟s modulus of the strut
Ewall=Young‟s modulus of the wall
F=maximum axial force in the strut
Fstat=axial force in the strut under static condition
Fseis=axial force (maximum value) in the strut under seismic condition
RF=Fseis/Fstat
g=acceleration due to gravity
G0=small strain shear modulus of soil
Gst=shear modulus of soil used in static simulation
Gd=shear modulus of soil used in dynamic simulation
Gs=secant shear modulus of soil
Iwall=moment of inertia of the wall
KG=stiffness multiplier
Kst=bulk modulus of soil used in static simulation
Kd=bulk modulus of soil used in dynamic simulation
Ko=coefficient of lateral earth pressure at rest
Kn=interface normal stiffness between wall and soil
Ks=interface shear stiffness between wall and soil
kstrut=strut or support member stiffness
1169

Subha Sankar Chowdhury, Kousik Deb and Aniruddha Sengupta
kwall=wall stiffness
l=length of strut or support member
M=maximum bending moment in the wall
Mstat=moment in the wall under static condition
Mseis=moment (maximum value) in the wall under seismic condition
RM=Mseis/Mstat
Ms=normalized secant shear modulus of soil
p’=mean effective stress
pref=reference pressure
s=horizontal spacing of strut or support members
t=time
twall=thickness of the wall
u=maximum horizontal wall deflection
ustat=deflection of wall under static condition
useis=deflection (maximum value) of wall under seismic condition
Ru=useis/ustat
ts=slab thickness
v=maximum vertical ground displacement
vstat=displacement of the ground surface under static condition
vseis=displacement (maximum value) of the ground surface under seismic condition
Rv=vseis/vstat
x0=parameter for sigmoidal model in FLAC
y0=parameter for sigmoidal model in FLAC
zmin=smallest width of an adjoining element in the normal direction to the interface
=wall friction angle
=density of soil
l=spatial element size
=shear strain in soil
=the wavelength associated with highest frequency component that contains appreciable energy
=friction angle
=Poisson‟s ratio of soil
wall=Poisson‟s ratio of wall
=shear stress in soil
1170