Behavior of Reinforced Concrete Slab Bridges During...
8
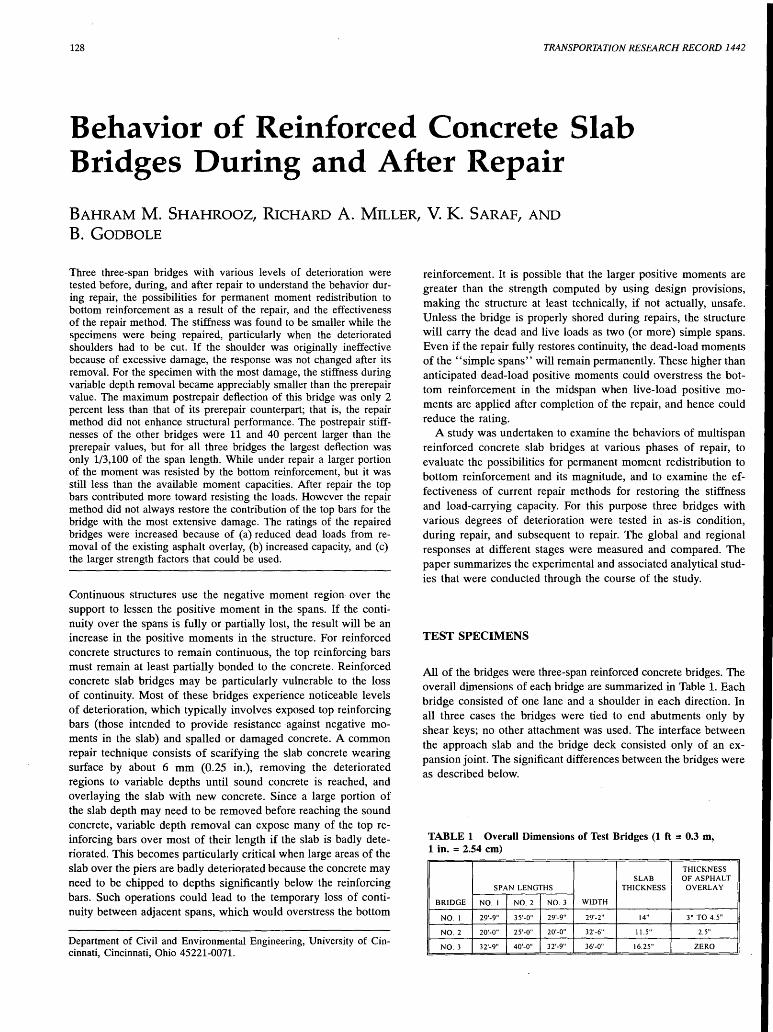
128 TRANSPORTATION RESEARCH RECORD 1442 Behavior of Reinforced Concrete Slab Bridges During and After Repair BAHRAM M. SHAHROOZ, RICHARD A. MILLER, V. K. SARAF, AND B. GODBOLE Three three-span bridges with various levels of deterioration were tested before, during, and after repair to understand the behavior dur- ing repair, the possibilities for permanent moment redistribution to bottom reinforcement as a result of the repair, and the effectiveness of the repair method. The stiffness was found to be smaller while the specimens were being repaired, particularly when the deteriorated shoulders had to be cut. If the shoulder was originally ineffective because of excessive damage, the response was not changed after its removal. For the specimen with the most damage, the stiffness during variable depth removal became appreciably smaller than the prerepair value. The maximum postrepair deflection of this bridge was only 2 percent less than that of its prerepair counterpart; that is, the repair method did not enhance structural performance. The postrepair stiff- nesses of the other bridges were 11 and 40 percent larger than the prerepair values, but for all three bridges the largest deflection was only 1/3,100 of the span length. While under repair a larger portion of the moment was resisted by the bottom reinforcement, but it was still less than the available moment capacities. After repair the top bars contributed more toward resisting the loads. However the repair method did not always restore the contribution of the top bars for the bridge with the most extensive damage. The ratings of the repaired bridges were increased because of (a) reduced dead loads from re- moval of the existing asphalt overlay, (b) increased capacity, and (c) the larger strength factors that could be used. Continuous structures use the negative moment region· over the support to lessen the positive moment in the spans. If the conti- nuity over the spans is fully or partially lost, the result will be an increase in the positive moments in the structure. For reinforced concrete structures to remain continuous, the top reinforcing bars must remain at least partially bonded to the concrete. Reinforced concrete slab bridges may be particularly vulnerable to the loss of continuity. Most of these bridges experience noticeable levels of deterioration, which typically involves exposed top reinforcing bars (those intended to provide resistance ·against negative mo- ments in the slab) and spalled or damaged concrete. A common repair technique consists of scarifying the slab concrete wearing surface by about 6 mm (0.25 in.), removing the deteriorated regions to variable depths until sound concrete is reached, and overlaying the slab with new concrete. Since a large portion of the slab depth may need to be removed before reaching the sound concrete, variable depth removal can expose many of the top re- inforcing bars over most of their length if the slab is badly dete- riorated. This becomes particularly critical when large areas of the slab over the piers are badly deteriorated because the concrete may need to be chipped to depths significantly below the reinforcing bars. Such operations could lead to the temporary loss of conti- nuity between adjacent spans, which would overstress the bottom Department of Civil and Environmental Engineering, University of Cin- cinnati, Cincinnati, Ohio 45221-0071. reinforcement. It is possible that the larger positive moments are greater than the strength computed by using design provisions, making the structure at least technically, if not actually, unsafe. Unless the bridge is properly shored during repairs, the structure will carry the dead and live loads as two (or more) simple spans. Even if the repair fully restores continuity, the dead-load moments of the "simple spans" will remain permanently. These higher than anticipated dead-load positive moments could overstress the bot- tom reinforcement in the midspan when live-load positive mo- ments are applied after completion of the repair, and hence could reduce the rating. A study was undertaken to examine the behaviors of multispan reinforced concrete slab bridges at various phases of repair, to evaluate the possibilities for permanent moment redistribution to bottom reinforcement and its magnitude, and to examine the ef- fectiveness of current repair methods for restoring the stiffness and load-carrying capacity. For this purpose three bridges with various degrees of deterioration were tested in as-is condition, during repair, and subsequent to repair. The global and regional responses at different stages were measured and compared. The paper summarizes the experimental and associated analytical stud- ies that were conducted through the course of the study. TEST SPECIMENS All of the bridges were three-span reinforced concrete bridges. The overall dimensions of each bridge are summarized in Table 1. Each bridge consisted of one lane and a shoulder in each direction. In all three cases the bridges were tied to end abutments only by shear keys; no other attachment was used. The interface between the approach slab and the bridge deck consisted only of an ex- pansion joint. The significant differences between the bridges were as described below. TABLE 1 Overall Dimensions of Test Bridges (1 ft = 0.3 m, 1 in. = 2.54 cm) THICKNESS SLAB OF ASPHALT SP AN LENGTHS THICKNESS OVERLAY BRIDGE NO. I NO. 2 NO. 3 WIDTH NO. I 29'-9" 35'-0" 29'-9" 29'-2" 14" 3" TO 4.5" NO. 2 20'-0" 25'-0" 20'-0" 32'-6" 11.5" 2.5" NO. 3 32'-9" 40'-0" 32'-9" 36'-0" 16.25" ZERO
Transcript of Behavior of Reinforced Concrete Slab Bridges During...
128 TRANSPORTATION RESEARCH RECORD 1442
Behavior of Reinforced Concrete Slab Bridges During and After Repair
BAHRAM M. SHAHROOZ, RICHARD A. MILLER, V. K. SARAF, AND
B. GODBOLE
Three three-span bridges with various levels of deterioration were tested before, during, and after repair to understand the behavior during repair, the possibilities for permanent moment redistribution to bottom reinforcement as a result of the repair, and the effectiveness of the repair method. The stiffness was found to be smaller while the specimens were being repaired, particularly when the deteriorated shoulders had to be cut. If the shoulder was originally ineffective because of excessive damage, the response was not changed after its removal. For the specimen with the most damage, the stiffness during variable depth removal became appreciably smaller than the prerepair value. The maximum postrepair deflection of this bridge was only 2 percent less than that of its prerepair counterpart; that is, the repair method did not enhance structural performance. The postrepair stiffnesses of the other bridges were 11 and 40 percent larger than the prerepair values, but for all three bridges the largest deflection was only 1/3,100 of the span length. While under repair a larger portion of the moment was resisted by the bottom reinforcement, but it was still less than the available moment capacities. After repair the top bars contributed more toward resisting the loads. However the repair method did not always restore the contribution of the top bars for the bridge with the most extensive damage. The ratings of the repaired bridges were increased because of (a) reduced dead loads from removal of the existing asphalt overlay, (b) increased capacity, and (c) the larger strength factors that could be used.
Continuous structures use the negative moment region· over the support to lessen the positive moment in the spans. If the continuity over the spans is fully or partially lost, the result will be an increase in the positive moments in the structure. For reinforced concrete structures to remain continuous, the top reinforcing bars must remain at least partially bonded to the concrete. Reinforced concrete slab bridges may be particularly vulnerable to the loss of continuity. Most of these bridges experience noticeable levels of deterioration, which typically involves exposed top reinforcing bars (those intended to provide resistance ·against negative moments in the slab) and spalled or damaged concrete. A common repair technique consists of scarifying the slab concrete wearing surface by about 6 mm (0.25 in.), removing the deteriorated regions to variable depths until sound concrete is reached, and overlaying the slab with new concrete. Since a large portion of the slab depth may need to be removed before reaching the sound concrete, variable depth removal can expose many of the top reinforcing bars over most of their length if the slab is badly deteriorated. This becomes particularly critical when large areas of the slab over the piers are badly deteriorated because the concrete may need to be chipped to depths significantly below the reinforcing bars. Such operations could lead to the temporary loss of continuity between adjacent spans, which would overstress the bottom
Department of Civil and Environmental Engineering, University of Cincinnati, Cincinnati, Ohio 45221-0071.
reinforcement. It is possible that the larger positive moments are greater than the strength computed by using design provisions, making the structure at least technically, if not actually, unsafe. Unless the bridge is properly shored during repairs, the structure will carry the dead and live loads as two (or more) simple spans. Even if the repair fully restores continuity, the dead-load moments of the "simple spans" will remain permanently. These higher than anticipated dead-load positive moments could overstress the bottom reinforcement in the midspan when live-load positive moments are applied after completion of the repair, and hence could reduce the rating.
A study was undertaken to examine the behaviors of multispan reinforced concrete slab bridges at various phases of repair, to evaluate the possibilities for permanent moment redistribution to bottom reinforcement and its magnitude, and to examine the effectiveness of current repair methods for restoring the stiffness and load-carrying capacity. For this purpose three bridges with various degrees of deterioration were tested in as-is condition, during repair, and subsequent to repair. The global and regional responses at different stages were measured and compared. The paper summarizes the experimental and associated analytical studies that were conducted through the course of the study.
TEST SPECIMENS
All of the bridges were three-span reinforced concrete bridges. The overall dimensions of each bridge are summarized in Table 1. Each bridge consisted of one lane and a shoulder in each direction. In all three cases the bridges were tied to end abutments only by shear keys; no other attachment was used. The interface between the approach slab and the bridge deck consisted only of an expansion joint. The significant differences between the bridges were as described below.
TABLE 1 Overall Dimensions of Test Bridges (1 ft = 0.3 m, 1 in. = 2.54 cm)
THICKNESS SLAB OF ASPHALT
SP AN LENGTHS THICKNESS OVERLAY
BRIDGE NO. I NO. 2 NO. 3 WIDTH
NO. I 29'-9" 35'-0" 29'-9" 29'-2" 14" 3" TO 4.5"
NO. 2 20'-0" 25'-0" 20'-0" 32'-6" 11.5" 2.5"
NO. 3 32'-9" 40'-0" 32'-9" 36'-0" 16.25" ZERO

Shahrooz et al.
Bridge 1
Bridge 1 was 46 years old at the time of testing. The abutments and piers were reinforced concrete walls (Figure 1). Site inspections did not reveal any visible signs of damage except for some rusted reinforcing bars that could be seen on the bottom face. Bridge 1 was tested as the specimen with " minor damage. "
Bridge 2
Despite being slightly newer ( 41 years old), Bridge 2 had experienced more damage than Bridge 1. The concrete in the shoulders had deteriorated appreciably, resulting in exposed reinforcing bars, as seen in Figure 2. Each pier line consisted of five HP 12 X 53 with a pile cap. This bridge served as the specimen with " moderate damage. ''
Bridge 3
The piers in 30-year-old Bridge 3 had seven steel-encased concrete piles [ 406-mm (16-in.)-diameter piles] and a pile cap. Damage had occurred along one of the shoulders, and primary reinforcing bars were exposed along the edge. In addition the bridge deck had experienced significant damage over both piers covering regions of approximately 3.7 m (12 ft) X 3.4 m (11 ft) and 3.7 m (12 ft) X 5.5 m (18 ft). As seen in Figure 3 these areas had been patched with asphalt. The damage in this bridge was classified as ''extensive. ' '
REPAIR METHOD
The repair methods were generally similar for the three bridges. The traffic was maintained while one-half of the bridge was being repaired. Upon removal of the asphalt overlay (if existing), the bridge deck was scarified 6 mm (0.25 in.). The entire portion of the deck under repair was sounded, and the areas to be removed were outlined. The areas with unsound concrete were subsequently removed by chipping or hand dressing. If more than one-
FIGURE 1 Overview of Bridge 1.
129
FIGURE 2 Damage in shoulder of Bridge 2.
half of the perimeter of a primary reinforcing bar was exposed, the adjacent concrete was removed to a depth that provided a minimum of 19 mm (0.75-in.) of clearance around the bar. Loose but otherwise undamaged bars were supported and tied back into place, and extensively rusted or damaged bars were replaced. The deck was patched with microsilica-modified concrete. Following a sufficient curing time the deck was overlaid with a 32-mm (1.25-in.)-thick layer of microsilica-modified concrete.
Because the bridges had experienced different levels of damage, the amount of chipping required varied. For Bridge 1 the slab near the abutments was cut through its depth, as shown in Figure 4. However the good quality of the concrete over the piers did not necessitate chipping of the deck.
Each driving lane of Bridge 2 was repaired in two stages. In Stage 1 a 0.6-m (2-ft) width of the shoulder was cut completely along the entire length of the bridge. This was necessary because the shoulders had deteriorated rather significantly. During the shoulder removal the workers were careful not to cut the bars perpendicular to the traffic lanes because this steel was used to tie the new shoulder to the slab. New longitudinal reinforcing bar was placed and a new shoulder made up of class S concrete was poured to a depth of 32 mm (1.25 in.) below the final surface. After a 7-day curing time Phase 2 of the repair, which involved variable depth removal, was started. The slab at the approach slabs
FIGURE 3 Patched regions over pier lines in deck of Bridge 3.

130
FIGURE 4 Cuts through deck of bridge 1 at abutments.
was cut to a depth of 152 mm (6 in.), and the deck was chipped to a depth varying from 51 mm (2 in.) to 102 mm (4 in.). As a result many of the bars were exposed, as can be seen in Figure 5. The variable depth removal was patched with microsilica concrete, and after allowing the patches to cure the microsilica overlay was placed.
FIGURE S Condition of slab in Bridge 2 after variable depth removal.
TRANSPOR'IATION RESEARCH RECORD 1442
FIGURE 6 Condition of slab in Bridge 3 after variable depth removal.
Bridge 3 was also repaired in two phases in the same manner as Bridge 2, but a 0.9-m (3-ft) width of the shoulder had to be cut. The entire width of the slab (under repair) over the piers was chipped to a depth that varied between 76 mm (3 in.) and 102 mm (4 in.). Figure 6 shows the extent of chipping. As with the other bridges the variable depth removal was patched with microsilica concrete, and a microsilica overlay was placed on the deck.
EXPERIMENTAL PROGRAM
Each bridge was tested before repair, during repair (both repair phases for Bridges 2 and 3), and after repair. The bridge deck deflections were measured at 20 locations across two adjacent spans by using displacement transducers: either direct current displacement transducers or a wire potentiometer. A typical layout of the instrumentation plan is shown in Figure 7. The curvature of the bridge deck was obtained by measuring concrete strains on the top and bottom surfaces at the middle of each span and on each side of the pier caps or pier walls. These locations are shown by X's in Figure 7. Either concrete strain gauges or clip gauges [both with a 102-mm (4-in.) gauge length] were used for this purpose. On the basis of the calculated curvatures the positive moments for each span and the negative moments on each side of the pier were inferred.
PIER LINE !
PIER LINE !
:A::J1:_!:-:::t ::: t:1::J DISPLACEMENT 0 TRANSDUCERS
------- ------ . -------~
i i CLIP GAGES OR 1 STRAIN GAGES x (TOP & BOTTOM)
FIGURE 7 Instrumentation plan.

Shahrooz et al.
Four single-axle dump trucks loaded with gravel [each weighing about 14 530 kg (32,000 lb)] were used to load the bridges. The trucks were placed in three different positions to produce maximum deflection in the midspan (load case 1 ), maximum deflection in the end span (load case 2), and maximum negative moment at the pier (load case 3). The actual positions of the trucks were selected through finite-element analyses (J).
EXPERIMENTAL RESULTS
The experimental data for each specimen are presented separately. The behaviors of the bridges while under repair and the effectiveness of the repair method are discussed.
Bridge 1
Figure 8 illustrates the deflection profiles along grid line 2 [2. 7 m (9 ft) from the edge] for load case 1, which caused the maximum deflection in the central span. The bridge was more flexible during repair than it was in the prerepair condition; for example, the
Abutment
c (JJ
5 ::J
.D <(
Pier Pier 2
\.... '-Q) Q)
0: a: Distance (ft)
1 . 0 ~--'---_...,....f __ 3_.__o_-_,:----:--4__.___5-.~ ~: ~ E E o.o
-1.0 c 0
:.;:::;-2.0 u ~-3 0 '+--- . Q)
0-4.0
------~------- &-----~--- --- -0.04 c : : ' : /. 0
------~-------~- - '.>.-~- ----- -0.08 ·_;:; ' ' ' u : : ' Q)
-----+-----~---- ~------- -0. 1 2 ~ : : : Q)
~ 1 :0 J :5 2 0 °. 1 6 0
Distance \m)
BEFORE REPAIR ~ DURING REPAIR
AFTER REPAIR
FIGURE 8 Deflection profiles for Bridge 1, grid line 2.
131
maximum central deflection became 36 percent larger. This observation is expected by recognizing that the deck had been cut away from the approach slab and full-depth cuts through the slab had been made along the abutments (Figure 4). The largest defection anywhere on the deck occurred during repair under load case 1. This deflection corresponded to that of the central span along grid line 1 [0.9 m (3 ft) from the edge], and it was 3.4 mm (0.135 in.), or L/3,100, where L is the span length. This value is indeed very small. As seen in Figure 8 the overall stiffness of the repaired bridge was improved, leading to a 15 percent reduction in the midspan deflection along grid line 2.
The ratio of the negative moment (measured close to the pier) to the positive moment (in the middle of the end span) is compared for different stages in Figure 9. During repair, when the trucks were positioned to produce maximum moment at the pier (load case 3), the portion of the total static live-load moment resisted by the bottom reinforcement at the midspan became 58 percent larger. However the increased live-load moment was well below the available moment capacity. Truck load tests provide information only about the distribution of live loads, and it is not possible to quantify from these tests the changes that were due to dead loads. However the live loads were several times larger than the standard design loads, and the magnitudes of the live loads were close to the calculated magnitude of the dead load. The small values of the measured strains under live loads suggest that any increased dead-load moments would also be small.
Subsequent to the completion of the repair the ratio of the negative moment over the pier to the positive moment in the spans increased, which indicated that a larger portion of the total moment was being resisted by the negative reinforcement. The participation of the negative reinforcement in the end span increased by an average of 14 percent. Hence the repair method was beneficial in restoring the continuity over the piers.
Bridge 2
As seen in Figure 10 the slab defection under load case 2 along grid line 1 [0.9 m (3 ft) from the edge] became larger, as expected, when the 0.6-m (2-ft)-wide potion of the slab had been cut along the entire length (phase one of repair). However the defection profile was not significantly different from that measured before removal of the shoulder. The maximum end span deflection (under
I- BRIDGE 1 (END SPAN) z w
3 == 0 == 2 z <C n. en 0 i 0 0 I-
ffi -1
~ -2 0
~ -3 2 3 LOAD CASE NO.
E:J BEFORE REPAIR• DURING REPAIR DAFTER REPAIR
FIGURE 9 Ratio of pier to midspan moment for Bridge 1.

132
Abutment Pier 1 Pier 2
iJ~~il~ t
"' "' 0:: 0:: Distance (ft)
,-.... 0.5 0 15 30 45 0.02
E E o.o ..-~--- 0.00 c
-~ =~:~ ·\s~·~:::::::::t::::::::: =:::: -~ u : : u
~ -1 .5 ---- ·--:---------:--------- -0.06 ~-0-2.0 o ' 1'0 15-0.08°
Distance (m)
GRID LINE
,-.... 0.5 E E o.o
-0.5 c ._g _ ,_o u ~-1.5 v 0-2.0
-- BEFORE REPAIR ..............- DURING REPAIR 1 -------- DURING REPAIR 2 - - - AFTER REPAIR
"' "' 0:: 0:: Distance (ft)
15 30 45 0.02
GRID LINE 2
FIGURE 10 Deflection profiles for Bridge 2.
load case 2) was only 10 percent larger when the shoulder had been cut. The deteriorated shoulder in this bridge (Figure 2) did not contribute to the original prerepair stiffness, and its removal did not apparently alter the response. After a 7-day curing of the new shoulder, Phase 2 of repair involved chipping of the deck locally, as shown in Figure 5. The deflections for this phase were much smaller than those measured before repair. When the deteriorated shoulder was replaced, the stiffness must have been improved sufficiently so that the response was not adversely affected by local variable depth removal of the slab. For grid lines farther away from the edge [grid line 2, which was 2.7 m (9 ft) from the edge], the deflection profiles did not change between various stages of repair, and the effects of removing and replacing the deteriorated shoulder were not pronounced. Upon completion of repair the bridge exhibited a substantially larger stiffness. The maximum deflection of the repaired bridge was reduced by 40 percent.
An examination of the ratio of pier to midspan moment shown in Figure 11 supports the preceding observations. (Before repair, instruments for monitoring concrete surface strains in the middle of the central span were not installed. Hence the ratio of pier to midspan moment could not be computed for this span.) During the first phase of repair a large redistribution of the applied moment to the positive reinforcement was apparent. The participation of the bottom reinforcement under load case 1 was approximately 60 percent larger than the value before repair, but it was still smaller than the available positive moment capacity. For Phase 2 the ratios were not appreciably different from those measured before repair. After pouring the new shoulder the behavior was no longer influenced by chipping of the deck. This observation is consistent with the measured deflection profiles. At the conclusion of the repair a larger portion of the total applied moment could
TRANSPORTATION RESEARCH RECORD 1442
1-z w ~a-------...-----~..---~---, :E ~ 6-1------~t---+-------+------i D. tn Q 4-1-------§§l--+-----~+-------1 i e 2 0:::: w a: 0 u. 0 o-2+---1---+---2----t-
S LOAD CASE NO. 3
Qlli] BEFORE REPAIR •DURING REPAIR 1 0 DURING REPAIR 2 §AFTER REPAIR
1-z w ~ 4---------ir----~~--r------, :E z3+-------+----t ~ ~ 2
i 1 +--------1---0 lo::: 0 -1----r-i=---l-w a:.1 -1.---...,;;;;;:~iiL--+-------+---1 u. 0 o-2-1----1---+---2-----t-----3-----1 s LOAD CASE NO.
Will BEFORE REPAIR •DURING REPAIR 1 0 DURING REPAIR 2 §§AFTER REPAIR
FIGURE 11 Ratio of pier to midspan moment for Bridge 2, end span (top) and midspan (bottom).
be resisted by the negative reinforcement at the piers; that is, the bridge acted more as a continuous system. The negative reinforcing steel in the end span participated 16 percent more than the prerepair value, and the top reinforcing bars in the central span resisted 35 percent more moment than during phase one of repair. The repair method was successful insofar as it improved the stiffness and increased the participation of the negative reinforcement at the piers are concerned.
Bridge 3
The deflection profiles under load case 3 (to produce maximum moment at the pier) are shown in Figure 12. When a 0.9-m (3-ft) width of the shoulder had been cut (phase one) the bridge experienced 40 percent larger deflection in the central span along grid line 2 [ 1.2 m ( 4 ft) from the edge]. In contrast for the same phase the maximum deflection for Bridge 2 was increased only by 20 percent (Figure 10). Unlike Bridge 2 the loss of stiffness from the shoulder removal influenced the deflection profiles of Bridge 3 across the width. For example along grid line 3 [3.2 m (10.5 ft) from the edge] the maximum midspan deflection for the first phase

Shahrooz et al.
,---... 0.5 E E o.o
c-0.5
~-1.0 u ~-1.5 QJ 0-2.0
AloEP~• ii~' 2 r
bi01I I
c
v v 0:: 0::
j v v <( 0:: 0::
Distance (ft)
f 0 ! 40 ! 60! 800.02
----~ ~ : ----r--r --- o.oo c
Distance (ft) f 0 ! 40 ! 60! 800.02
--~·-:··-· ····-:·····:· ... 0.00 c
,---... 0.5 E E o.o
:t iJ?l =:::t c-0.5
·2-1.0
---+-·--r -+--- -··-- -0.02 c
· 1°0 i's 2'0 2s-0 ·08 0
Distance (m)
GRID LINE 2
u ~-1.5 QJ 0-2.0
-- BEFORE REPAIR ............... DURING REPAIR 1 ········ DURING REPAIR 2 - - - AFTER REPAIR
---+--+-·,·~.?:+---· -0.04 -~ ---+--+····r --+--·· -0.06 ~
: 1 :0 1 :5 2:0 2s- 0 ·08 0
Distance (m)
GRID LINE 3
FIGURE 12 Deflection profiles for Bridge 3.
of repair became 35 percent larger (Figure 12), whereas in the case of Bridge 2 the effects of cutting the shoulder diminished rapidly away from the edge (Figure 10). These differences indicate that the shoulder in Bridge 3 was originally effective in resisting the loads, and its removal reduced the overall stiffness substantially. This is easily seen by examining the deterioration of this bridge. The deterioration over the piers was mostly confined to the driving lanes and did not really extent into the shoulders.
When a new shoulder had been poured and the deck had been chipped locally over a larger portion, mostly around and over the piers (phase two of repair), the deflections became larger than those measured before repair. The effects of local chipping of the deck were of such a magnitude that the stiffness became smaller than the original prerepair value, even though a new shoulder had been poured. Upon completion of the repair the deflections became expectedly smaller. However the maximum deflection was only 2 percent less than the prerepair value. This is in contrast to the cases for Bridges 1 and 2, for which the postrepair maximum deflections were 11 and 40 percent, respectively, less than their counterparts before repair. The repair method was apparently not as successful in restoring the stiffness of Bridge 3.
As evidenced from Figure 13 the repair procedures resulted in a reduction of moment transfer over the pier; that is, the ratio of pier to midspan moment became smaller. After the shoulder was cut, approximately 22 and 31 percent more moment was being resisted by the bottom reinforcement in the end and the middle span, respectively. Replacement of the shoulder increased the participation of the top reinforcement over the pier in resisting the total applied moment, yet it was smaller than the original level because of extensive chipping of the deck. Approximately 6 to 17 percent less moment than the original moment could be resisted by the negative reinforcement. The positive (bottom) reinforce-
... z w
~ 2--------------.-----------r----------, :E z ~ 1 ti) c i 0 0 ... a:: !:!:!-1 +------------4-------------if-D.. LL 0 0 -2
~ 1 2
LOAD CASE NO. 3
[1l] BEFORE REPAIR • DURING REPAIR 1 D DURING REPAIR 2 §AFTER REPAIR
... z w
~ s-------------,r----------~-----------, :E z &+-----------4--------E3---+----------"""'"'1 c( D.. ~ 4
i 2+-----------4-------~~1----------~ e a:: 0 +-~-r-~--t-w ~-2+-----------4------------+LL 0 o-4+-----1-----+-----2------+-----3-------1
~ LOAD CASE NO.
IITfil BEFORE REPAIR •DURING REPAIR 1 0 QURING REPAIR 2 §AFTER REPAIR
FIGURE 13 Ratio of pier to midspan moment for Bridge 3, end span (top) and midspan (bottom).
133
ment in the central span resisted a larger portion of the applied moment during both phases of repair. These observations are in contrast to those found for Bridge 2 (Figure 11). Although the repair method increased the contribution of the negative (top) reinforcement in the midspan by about 30 percent, the test results indicated a permanent redistribution of live-load moments to the bottom reinforcement in the end span. The contribution of the top reinforcement was about 25 percent less than the value before repair. As mentioned previously truck load tests do not permit' assessment of the redistribution of dead-load moments, but the small strains that were measured suggest that the total redistributed moments owing to dead and live loads would also be less than the available moment strengths.
RATING FACTORS BEFORE AND AFTER REPAIR
By using the 1989 AASHTO guide specifications (2) the bridges were rated to assess the effectiveness of the repair on improving the rating factors. The dead- and live-load effects were computed either by finite-element analyses of a three-dimensional model of the bridge-pier-abutment system or by analysis of a continuous

134
TABLE 2 Rating Factors
Critical Case Capacity (k-ft/ft)
Moment over Pier Before Repair 102
Moment over Pier After Repair 102
Moment over Pier Before Repair 102
Moment over Pier After Repair 102
Moment in End Span Before Repair 46.7
Moment in End Span After Repair 54.9
Moment over Pier Before Repair 54.l
Moment over Pier After Repair 54. l
Moment over Pier Before Repair 103.4
Moment over Pier After Repair 103.4
Moment over Pier Before Repair 103.4
Moment over Pier After Repair 103.4
beam (referred to as a beam model) in which the beam width was computed as described by AASHTO (3), that is, E = 0.063S + 4.65, where E is the beam width and S is clear span. The details of the analytical models are discussed elsewhere (1). The measured material properties were used to compute the capacities, and AASHTO guidelines (2) on load and resistance factors were followed. The finite-element analyses were conducted by using models that were calibrated to match the measured responses (1).
The ratings before and after repair are summarized in Table 2. The capacities were computed by using the provisions of code ACI 318-89 of the American Concrete Institute (4), in which the contribution of concrete in tension was ignored. The new microsilica overlay would not increase the negative moment (the top of the slab is in tension) capacities over the piers because the concrete above the neutral axis is assumed to be cracked and hence ineffective. However the positive moment capacities in the midspan of the repaired bridges would be larger. A combination of reduced dead-load effects· upon removal of the asphalt overlay (for Bridges 1 and 2), the larger resistance factors that could be used after repair, and the increased positive moment capacity because of the new overlay (if the rating factor was controlled by the moment in the rnidspans) led to larger rating factors after completion of the repair. In the case of Bridge 1 the rating was controlled by the negative moment over the pier. The rating was increased between 13 percent (if the results from the beam model are used) to 17 percent (if the results from the finite-element model are used). The observed differences between ratings from the beam and finiteelement models are beyond the scope of this paper and are discussed by Shahrooz et al. (1). The rating factors for Bridges 2 and 3 were increased by 36 and 13 percent, respectively.
SUMMARY AND CONCLUSIONS
A study was carried out in an effort to (a) understand the behavior of deteriorated reinforced concrete slab bridges during repair, (b)
TRANSPORTATION RESEARCH RECORD 1442
I Dead Load Effect I Live Load Effect
I Rating
(k-ft/ft) (k-ft/ft) Factor
I I
I I
I I
I I
I I
I I
Bridge No. I (Beam Model)
20.5 I 13.0 I 3.8
18.7 I 12.9 I 4.3
Bridge No. I (Finite Element Model)
20.6 I 9.6 I 5.2
17.8 I 9.3 I 6.1
Bridge No. 2 (Beam Model)
4.8 I 9.6 I 2.8
4.5 I 9.6 I 3.8
Bridge No. 2 (Finite Element Model)
8.1 I 7.6 I 3.8
7.2 I 6.5 I 5.2
Bridge No. 3 (Beam Model)
26.7 I 16.2 I 2.8
30.7 I 16.2 I 3.2
Bridge No. 3 (Finite Element Model)
25.5 I 12.2 I 3.8
29.5 I 12.2 I 4.3
determine the possible adverse effects of a common repair method on moment redistribution to bottom reinforcement, and (c) examine the effectiveness of the repair method in enhancing the bridge's performance. For this purpose three bridges with various levels of deterioration (from minor to extensive) were tested in as-is condition, under repair, and after repair.
While being repaired the bridges lost stiffness, as expected, particularly when a portion of the shoulders had to be cut because of excessive deterioration. For Bridge 2 the shoulder had apparently deteriorated to an extent that its removal did not change the response from what was measured before repair. Local chipping of the deck in this bridge over the piers did not appreciably reduce the stiffness after the new shoulder had been poured. The shoulder in Bridge 3 was effective originally, and its removal reduced the overall stiffness substantially. Variable depth removal of the deck over the piers was of such a magnitude that the stiffness became smaller than the original prerepair value, even though a new shoulder had been poured. Despite the apparent loss of stiffness the largest deflection for the three specimens was L/3,100, which is considerably smaller than the maximum allowable value and is not critical. When completely repaired the bridges became stiffer, although the additional stiffness was not always significant.
Redistribution of the applied moment from the negative to positive reinforcement was evident during repair. Increases of as much as 60 percent were measured. Nevertheless the larger moments were still smaller than the available capacities. When the bridges were completely repaired a larger portion of the applied moment could be resisted by the negative reinforcement. The continuity over the pier was generally improved at the conclusion of repair for the bridges with minor to moderate damage, but some permanent redistribution of moments to the bottom reinforcement was measured for the bridge with extensive damage.
The ratings of the repaired bridges were also increased because of a combination of reduced dead loads, incr.eased capacity, and

Shahrooz et al.
larger strength factors. The additional rating was most significant for the bridge with moderate damage.
The repair procedure reported here can enhance the stiffnesses, moment transfers, and ratings of reinforced concrete slab bridges if they are moderately deteriorated. If the bridge is lightly or extensively damaged the repair does not improve the performance as much. Considering that the additional deflections during repair were very small and that the additional redistributed moments to the bottom reinforcement were considerably smaller than the available capacities, no changes in the current repair practice would appear to be necessary.
ACKNOWLEDGMENTS
The study reported here was sponsored by the U.S. Department of Transportation and FHWA. The authors acknowledge W. Edwards, V. Dalal, D. Hanhilammi, J. King, and R. Eltzroth of the Ohio Department of Transportation for crucial support and advice throughout the research. The support personnel at Cincinnati In-
135
frastructure Institute at the University of Cincinnati are gratefully acknowledged.
REFERENCES
1. Shahrooz, B. M., et al. Strength Continuity of R.C. Slab Bridges During Repair and Effectiveness of Repair. Report UC/Cil-94/01. Cincinnati Infrastructure Institute, University of Cincinnati, Ohio, Feb. 1994.
2. AASHTO Guide Specifications for Strength Evaluation of Existing Steel and Concrete Bridges, AASHTO, Washington, D.C., 1989.
3. Standard Specifications for Highway Bridges. AASHTO, Washington, D.C., 1991.
4. ACI Committee 318. Building Code Requirements for Reinforced Concrete and Commentary. ACI 318-89/ACI 318R-89. American Concrete Institute, Detroit, Mich., 1989.
The contents of this paper reflect the views of the authors, who are solely responsible for the facts and accuracy of the data presented herein. This paper does not necessarily reflect the views or policies of the Ohio Department of Transportation or FHWA and does not constitute a standard, specification, regulation, or recommendation.
Publication of this paper sponsored by Committee on Structures Maintenance and Management.